Article

Geospatial Analysis of Regional Disparities in Non-Grain Cultivation: Spatiotemporal Patterns and Driving Mechanisms in Jiangsu, China

1
School of Environmental Science and Engineering, Suzhou University of Science and Technology, No. 99 Xuefu Road, Huqiu District, Suzhou 215009, China
2
School of Geography Science and Geomatics Engineering, Suzhou University of Science and Technology, No. 99 Xuefu Road, Huqiu District, Suzhou 215009, China
*
Author to whom correspondence should be addressed.
ISPRS Int. J. Geo-Inf. 2025, 14(4), 174; https://doi.org/10.3390/ijgi14040174
Submission received: 8 February 2025 / Revised: 3 April 2025 / Accepted: 14 April 2025 / Published: 17 April 2025

Abstract

:
Balancing regional disparities in non-grainization is vital for stable grain production and sustainable urbanization. This study employs geospatial analysis to examine the spatiotemporal patterns and driving factors of non-grainization in Jiangsu Province from 2001 to 2020. By integrating geospatial data from 77 county-level units and employing spatial autocorrelation analysis, multiple linear regression, and mixed geographically weighted regression (MGWR), this study reveals the spatial heterogeneity and key driving factors of non-grainization. The results indicate strong spatial dependence, with persistent high–high clusters in economically developed southern/coastal areas and low–low clusters in northern regions. Furthermore, the driving mechanism shifted significantly over the two decades. Early constraints from natural endowments (e.g., elevation’s positive impact significantly weakened post 2010) and individual economics diminished with technological progress, while macroeconomic development became dominant, influencing both scale and structure. Infrastructure improvements (reflected by rural electricity use) consistently limited non-grainization; some factors showed phased effects, and annual mean precipitation emerged as a significant influence in 2020. MGWR revealed substantial, dynamic spatial heterogeneity in these drivers’ impacts across different periods. These findings highlight the importance of geoinformation tools in managing regional disparities. Integrating spatial and socio-economic analysis offers practical insights for policymakers to develop targeted strategies that balance food security with agricultural diversification.

1. Introduction

Food security is a fundamental human right and a cornerstone of both national political stability and sustainable socio-economic development [1]. As urbanization accelerates, particularly in developing countries such as China, the loss of cultivated land has become a critical factor affecting food security. Research indicates that urban expansion and industrialization are progressively reducing agricultural land, exacerbating the loss of cultivated land and placing significant pressure on national grain production [2,3]. Recent research employing high-resolution remote sensing data and modeling has further revealed the pace and scale of global urban expansion encroaching upon prime farmland [4,5]. Particularly in developing countries throughout Asia and Africa, this trend is especially pronounced [6,7]. Meanwhile, the worldwide migration between rural and urban areas—particularly the large-scale flow of rural laborers to cities in developing countries—while fostering industrialization and urbanization, has also resulted in rural labor shortages, thereby fueling an increase in the abandonment of cultivated land [8]. The accelerated growth of China’s economy, coupled with increasing demands for industrial and commercial land, has exerted considerable pressure on agricultural land. Despite the boom in staple crop production [9], the reduction in arable land presents significant challenges, including farmland conversion, abandonment, and a shift from grain production to non-grain production (NGP). These trends have raised concerns among policymakers, researchers, and the public.
Agricultural modernization significantly influences land use patterns. Elements such as increased levels of agricultural mechanization, the development of large-scale operations, and the application of modern agricultural technologies like water-saving irrigation and smart fertilization have significantly enhanced the efficiency and productivity of land use. This further alters farmers’ planting decisions between grain crops and cash crops [10]. However, the NGP of cropland impacts not only food security but also introduces significant risks such as rural social imbalances, agricultural landscape fragmentation, and eco-system degradation [11]. These challenges collectively undermine the sustainable development of regional economies. Currently, extensive research is being conducted on the non-grain production of cultivated land (NGPCL), focusing primarily on the identification of NGPCL through remote sensing imagery [12,13,14], identification of non-grain sensitive factors [15], analysis of the relationship between NGPCL and the intensive utilization of cultivated land [16], spatial analysis of NGPCL [17], and the impact of factors such as the stability of land contracting and management rights on NGPCL [18]. Research on NGP has been conducted at various scales, including at the national [19], regional [17], provincial [13], county, village, and household levels [18,19,20]. It is worth noting that China, as one of the world’s largest agricultural importers, exhibits a high degree of import dependency for feed grains such as soybeans and certain high-end agricultural products. This lends critical strategic significance to domestic food production and farmland protection [21]. Furthermore, the recent COVID-19 pandemic introduced unprecedented disruptions, impacting labor availability due to movement restrictions, disrupting supply chains for both agricultural inputs and outputs [22], and altering market access, thereby significantly affecting agricultural practices and potentially influencing land use decisions, including NGP trends, in rural areas [23,24]. The resulting transformation in the production structure not only concerns the bottom line of food security but is also closely related to the coordinated development of rural revitalization and ecological security, urgently requiring the establishment of dynamic balancing mechanisms through multiple avenues such as technological innovation, policy guidance, and market regulation.
In response to these pressures, the Chinese government has implemented a series of policy measures aimed at safeguarding arable land and stabilizing grain production. First, the 2021 revision of the Land Administration Law strengthened the protection of farmland for grain cultivation, explicitly prioritizing the right to plant grain crops and strictly regulating the conversion of ordinary cultivated land for other agricultural uses. This revision provides the legal framework for curbing the non-grainization trend. Meanwhile, the 2021 No. 1 Central Document called for additional policy support for grain production, encouraging farmers to grow grain crops and offering related financial subsidies. Moreover, in 2024, the State Council released the Opinions on Strengthening Farmland Protection, Improving Farmland Quality, and Enhancing the Balance of Occupation and Compensation, designating farmland protection as a systematic initiative. These measures have shown early progress, effectively containing non-grainization in certain areas by strengthening land use controls and offering fiscal incentives. Despite these measures, the balancing act between promoting grain production and addressing the growing demand for other agricultural products remains a formidable challenge. This issue is particularly pressing for rapidly urbanizing regions, where competition for land resources is intense, and agricultural profitability is increasingly influenced by market dynamics.
Jiangsu Province, as one of China’s most economically advanced and urbanized coastal regions, offers a unique context for studying the interplay between economic development, urbanization, and agricultural land use [25]. From 2000 to 2020, the grain output in Jiangsu Province has increased from 31.06 million tons to 37.29 million tons, while the grain-sown area has only increased from 5304 thousand hectares to 5405.64 thousand hectares during the same period. The primary contribution to the increase in grain output comes from improvements in the yield per unit of cultivated area. However, changes in the grain-sown area vary significantly across different regions within Jiangsu Province. Examining regional disparities in grain and non-grain crop cultivation is essential for optimizing agricultural resource allocation and ensuring sustainable land use. As economic transformations and market demands drive shifts in crop choices, significant regional differences in crop allocation have emerged, impacting food security and agricultural resilience. Analyzing these spatial patterns provides critical insights into the drivers of agricultural land use and will enable tailored policy interventions for diverse regions. The outcomes of this study will aid sustainable agriculture and address regional food production needs in a way that supports global food security.
This study investigated the spatiotemporal changes in grain and non-food crop cultivation across 77 counties and cities in Jiangsu Province. The socio-economic, environmental, and policy factors influencing land use decisions in the region were investigated using spatial analysis techniques and statistical modeling. The findings provide valuable insights into the regional disparities in agricultural land use and offer policy-relevant conclusions for addressing the challenges of non-grainization in other regions undergoing similar transformations. Moreover, this study contributes to the broader discourse on sustainable land use management in rapidly urbanizing areas, with implications for national and global food security strategies.

2. Materials and Methods
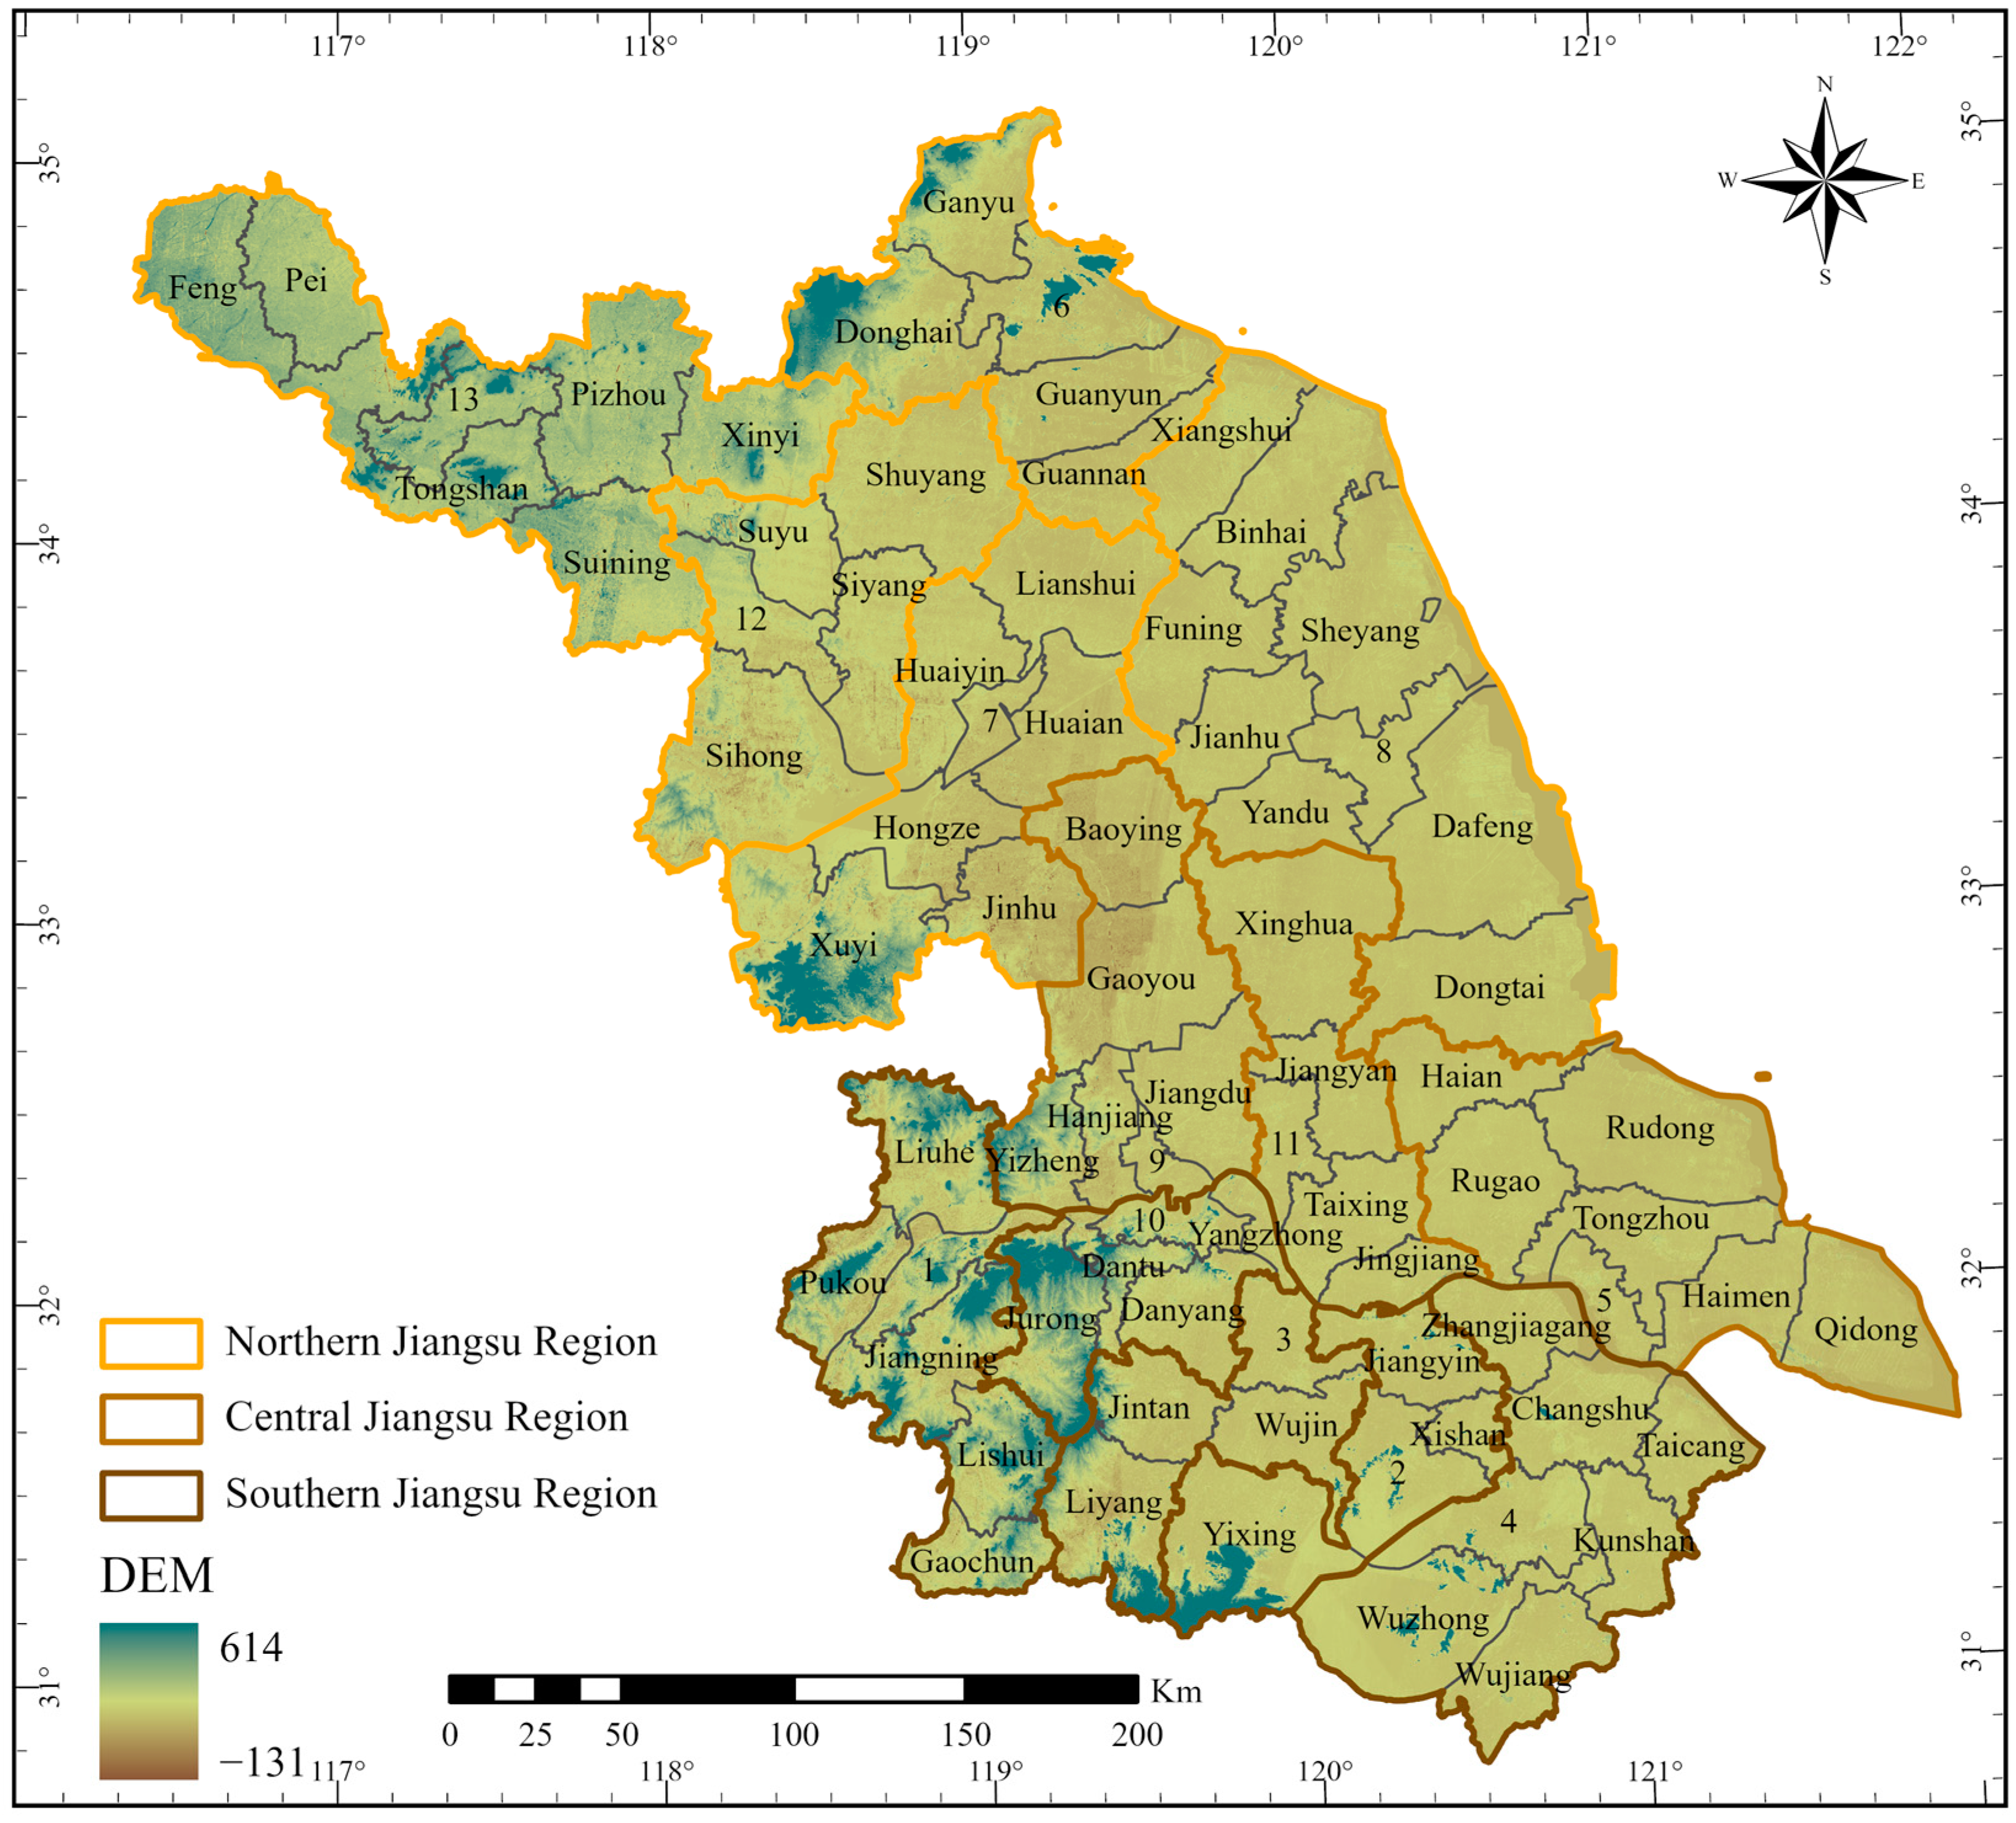
2.1. Study Area

Jiangsu Province covers a land area of 107,200 km2 and is divided into 13 prefecture-level cities. The region spans a transition zone from a warm temperate to subtropical climate, with a temperate monsoon climate in northern Jiangsu and a subtropical monsoon climate in the central and southern regions. These climatic variations create favorable conditions for a wide variety of agricultural practices, earning Jiangsu the title of the “land of fish and rice”. The province’s terrain is predominantly flat, with extensive arable land resources and fertile soils, offering an excellent environment for agricultural production.
As a highly developed region in China, Jiangsu is characterized by concentrated economic activities and a high population density. Between 2000 and 2020, its population density index (persons/km2) increased from 714 to 791. In contrast, according to data from China’s 7th National Population Census, Guangdong, which has a similar economic strength to Jiangsu, had a population density index of only 701 in 2020, while Zhejiang, with a comparable area, had a much lower index of just 612 in 2020. As of 2020, the province’s arable land area was 70,400 km2. However, the rapid industrialization and urbanization occurring in the early 21st century has led to changes in land use patterns within the province. Both the total and per capita cultivated land areas have subsequently declined with urbanization. This study focused on the 77 counties within Jiangsu Province (Figure 1), analyzing the spatiotemporal characteristics and driving factors of non-grain cultivation at the county level.

2.2. Data Resources

The data used in this study were collected from several authoritative sources. Data for 2000, 2010, and 2020 are provided in Supplementary Tables S1–S3 (see Work-sheets 1–3 in the Excel file). Total population, total agricultural output value, per capita disposable income of rural residents, rural electricity consumption, and agricultural fertilizer application were sourced from the China Statistical Yearbooks, Jiangsu Provincial Statistical Yearbooks, and various statistical yearbooks of Jiangsu’s prefecture-level cities (2002–2021) [26]. The indicators for the urbanization rate and the rural registered-resident population discrepancy were calculated based on data from China’s Fifth (corresponding to 2000), Sixth (corresponding to 2010), and Seventh (corresponding to 2020) National Population Censuses [27]. Considering that the national population census is conducted every ten years, this results in missing data for intervening years. Specifically, due to the lack of direct census data for 2001, this study uses data from the temporally closest Fifth National Population Census (2000) as a substitute value for that year. The cultivated land areas for the 77 county-level units were derived from the annual land cover dataset produced by the research team led by Professors Jie Yang and Xin Huang at Wuhan University. Additionally, the elevation data were obtained from the Shuttle Radar Topography Mission (SRTM) dataset, acquired by the NASA Space Shuttle Endeavour. The annual average precipitation data were sourced from the ERA5-Land dataset, published by organizations including the European Union (EU) and the European Centre for Medium-Range Weather Forecasts (ECMWF). The annual average temperature data were derived from the National Centers for Environmental Information (NCEI), under the U.S. National Oceanic and Atmospheric Administration (NOAA).

2.3. Methods

2.3.1. Measurement of the “Non-Grainization” Level

Defining the concept of “non-grainization” is crucial to ensuring the reliability and precision of research on this phenomenon in cultivated land. Based on existing studies [28,29], the degree of non-grainization is often measured from a macro perspective at the county level, using planting structure as an indicator. Specifically, it is typically defined and measured as the proportion of non-grain crop sown area to the total sown area of all crops. This ratio plays a key role in depicting the planting structure and trends in non-grainization for a given region. In this study, we considered Jiangsu Province as a case study to explore the characteristics of non-grainization by measuring the non-grain crop sown area relative to the total sown area of crops across county-level units. The calculation was as follows:
R n f = A n f A f × 100 %
where Rnf represents the non-grainization rate, and Anf is the sown area of non-grain crops, i.e., all crops except for grains. Grains are defined as rice, wheat, and corn. Af represents the total sown area of crops.
To better understand the long-term evolution of influencing factors, the factors driving non-grainization at the county level were selected from four dimensions: the degree of social development, the level of economic development, rural infrastructure, and natural endowments (Table 1). In Table 1, X1–X4 represent social structure, demographic characteristics, population mobility, and human–land relationships; X5–X7 represent the overall level of regional economic development, residents’ income levels, and agricultural economic performance; X8–X10 represent rural infrastructure and resource inputs; and X11–X13 represent the fundamental natural environmental conditions affecting regional agricultural production and human activities. It should be noted that in the “Predicted Relationship” column, a “+” indicates that the variable positively drives the process of non grainization; a “−” indicates that the variable has a negative restraining effect on non-grainization; and a “±” indicates that the direction of the variable’s impact on non-grainization is unclear, and it may have a positive or negative impact.

2.3.2. Spatial Autocorrelation

Spatial autocorrelation refers to the dependency of a variable at a given observation point on other data points within the same spatial distribution. It therefore measures the degree of correlation in spatial distribution patterns and helps to analyze the characteristics of spatial phenomena [30]. Because the global Moran’s I index can only reflect the overall distribution characteristics and does not identify areas of element clustering, the local Moran’s I was used for the analysis in this study. It was implemented using GeoDa software1.16 [31]. The formula is as follows:
I i = Z i S 2 j i n W i j Z j
Z i = x i x ¯
Z j = x j x ¯
S 2 = 1 n ( x i x ¯ ) 2
In Equations (2)–(5), Ii represents the local Moran’s I for region i. The value of S2 is always positive, so the sign of Ii depends on x i x ¯ and j i n W i j Z j . When Ii > 0, high-value spatial units are surrounded by similarly high-value areas (H–H), and when Ii < 0, low-value spatial units are surrounded by similarly low-value areas (L–L).

2.3.3. Multiple Linear Regression and Mixed Geographically Weighted Regression

Multiple linear regression (MLR) is a global regression method used to describe the linear relationship between a dependent variable and two or more independent variables, predicting the trends in the dependent variable based on multiple independent variables without considering the spatial location of the study units [32]. This analysis was performed using SPSS software 22.0, and the multicollinearity among the factors was initially tested; factors with a variance inflation factor (VIF) > 10.0, indicating significant colinearity, were excluded.
Geographically weighted regression (GWR) incorporates the spatial location of the study units into the model, allowing the relationships between variables to vary with geographic location. The mixed geographically weighted regression (MGWR) model is an extension of the GWR model [33]. In ordinary GWR, the relationship between the independent and dependent variables changes with the geographic location of the observation points, making it difficult for the results to reflect the local characteristics of each variable. However, MGWR effectively addresses spatial non-stationarity, reflecting the true attributes of spatial data and improving the model fit. The model divides the coefficients into two parts: one part remains constant (the global coefficients), while the other varies with the spatial coordinates (the local coefficients). The model was implemented using the MGWR 2.2 software developed by Arizona State University. The model formula is as follows:
y i = j = 0 q β j x i j + j = q + 1 p β j ( u i , v i ) x i j + ε i
In Equation (6), i = 1, 2, …, n; j = 1, 2, …, q; βj are unknown constants, and βj (ui, vi) (j = q + 1, q + 2, …, p) are unknown parameters at observation point (ui,vi), which are functions of the spatial coordinates (ui,vi).

3. Results

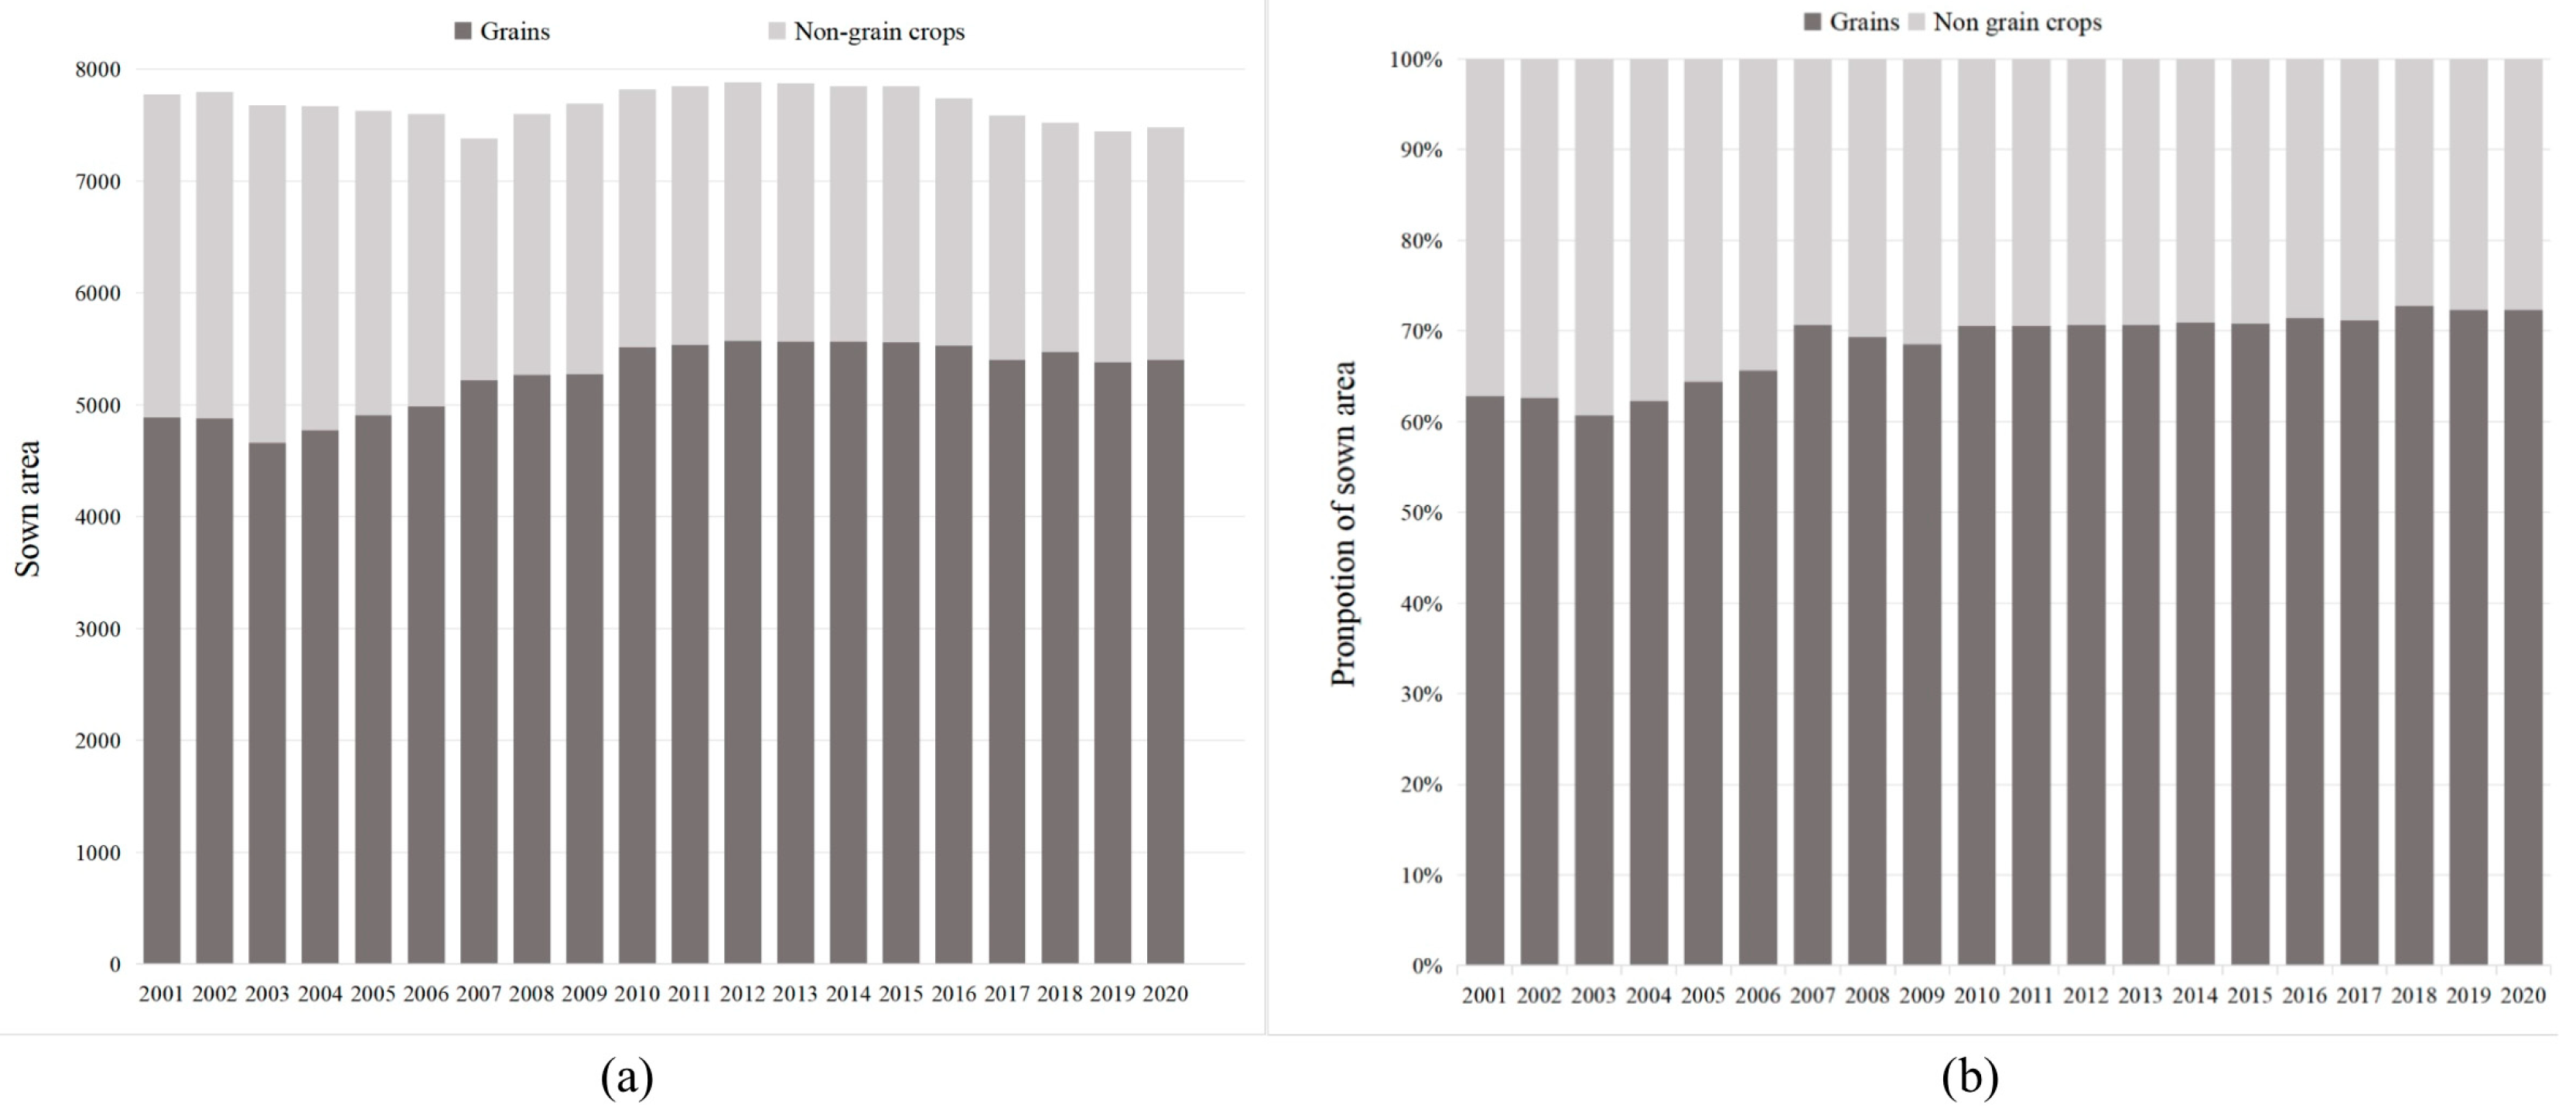
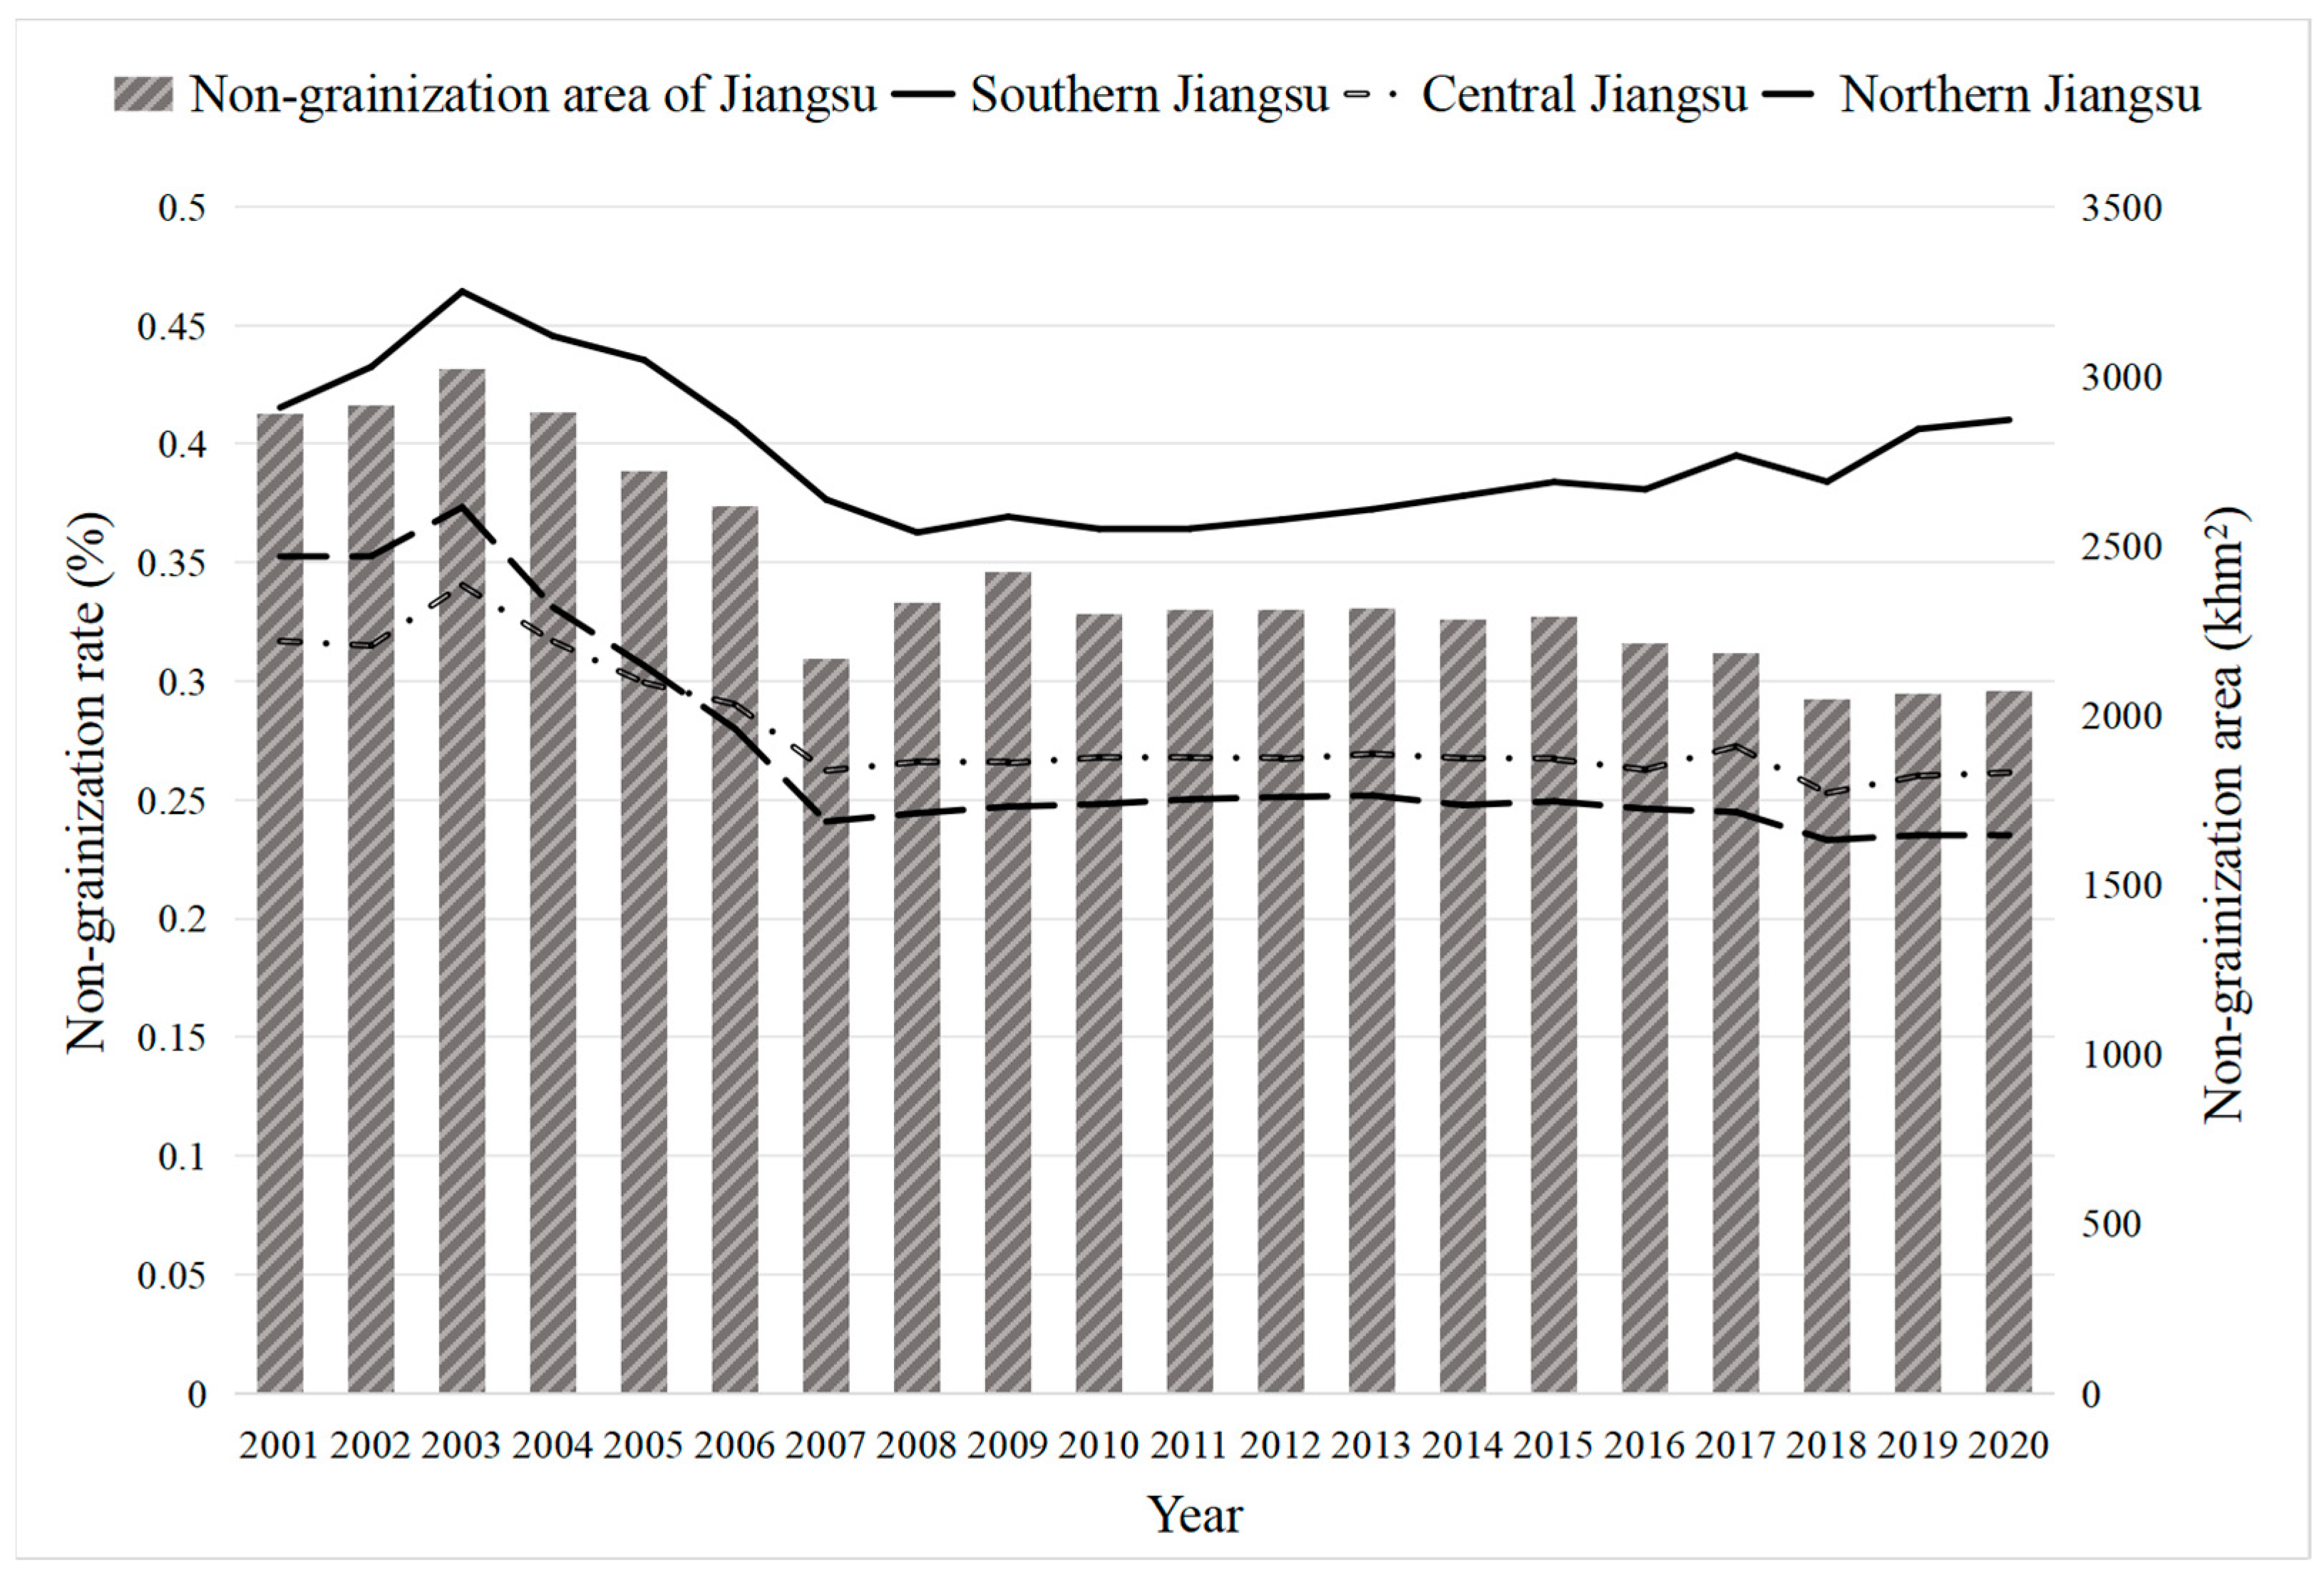
3.1. Temporal Characteristics of Non-Grainization in Jiangsu Province’s Cultivated Land

The agricultural practices in Jiangsu Province, particularly cropping patterns and land allocation, have demonstrated significant dynamism over the past two decades, driven by a complex interplay of socio-economic and policy factors. From 2001 to 2007, the total sown area of crops in Jiangsu Province exhibited a decreasing trend. However, during the period 2000–2003, the area of non-grain cultivation increased, while the grain-sown area decreased (Figure 2a), a trend consistent with national patterns. From 2000 to 2003, the non-grainization rate of cultivated land in Jiangsu Province continuously increased, reaching 39.34%. In 2003, the nationwide grain-sown area reached its lowest point. This trend was primarily driven by rapid urbanization and industrialization, which spurred the migration of rural laborers, consequently reducing farmers’ incentives to cultivate grain. Starting in 2003, China began to implement agricultural tax reforms and various grain production subsidies, significantly increasing farmers’ enthusiasm for grain cultivation. As a result, from 2003 to 2007, the area of non-grain cultivation decreased, and the grain-sown area increased. From 2007 to 2015, the total sown area of crops in Jiangsu displayed a general upward trend, with both non-grain cultivation and grain-sown areas slowly increasing. Between 2003 and 2007, the non-grainization rate decreased continuously. However, from 2007 to 2020, the non-grainization rate only gradually declined, dropping to 27.72% (Figure 2b).
The non-grainization rate of cultivated land in southern Jiangsu was significantly higher than in central and northern Jiangsu (Figure 3). In southern Jiangsu, the rate rose rapidly from 2001 to 2003, reaching 46.42%, and then gradually decreased to 36.27% between 2004 and 2008. From 2008 to 2020, it climbed steadily by 5%, and was largely influenced by the agricultural market and rural revitalization efforts in the region, which reduced the grain-sown area. In central and northern Jiangsu, the non-grainization rates showed similar trends. From 2001 to 2003, they increased to 34.05% in central Jiangsu and 37.33% in northern Jiangsu. Then, from 2003 to 2007, they decreased to 26.23% in central Jiangsu and 24.09% in northern Jiangsu, and finally stabilized. After 2005, the non-grainization rate in northern Jiangsu was slightly lower than that in central Jiangsu.
At the county level, the trends in the non-grainization rate of cultivated land in Jiangsu’s counties from 2001 to 2020 could be categorized into five types: “increase–decrease–increase”, “continuous increase”, “stable”, “increase–decrease–stable”, and “continuous decrease” (Figure 4). The fluctuations in the non-grainization rate from 2001 to 2020 could be summarized as follows:
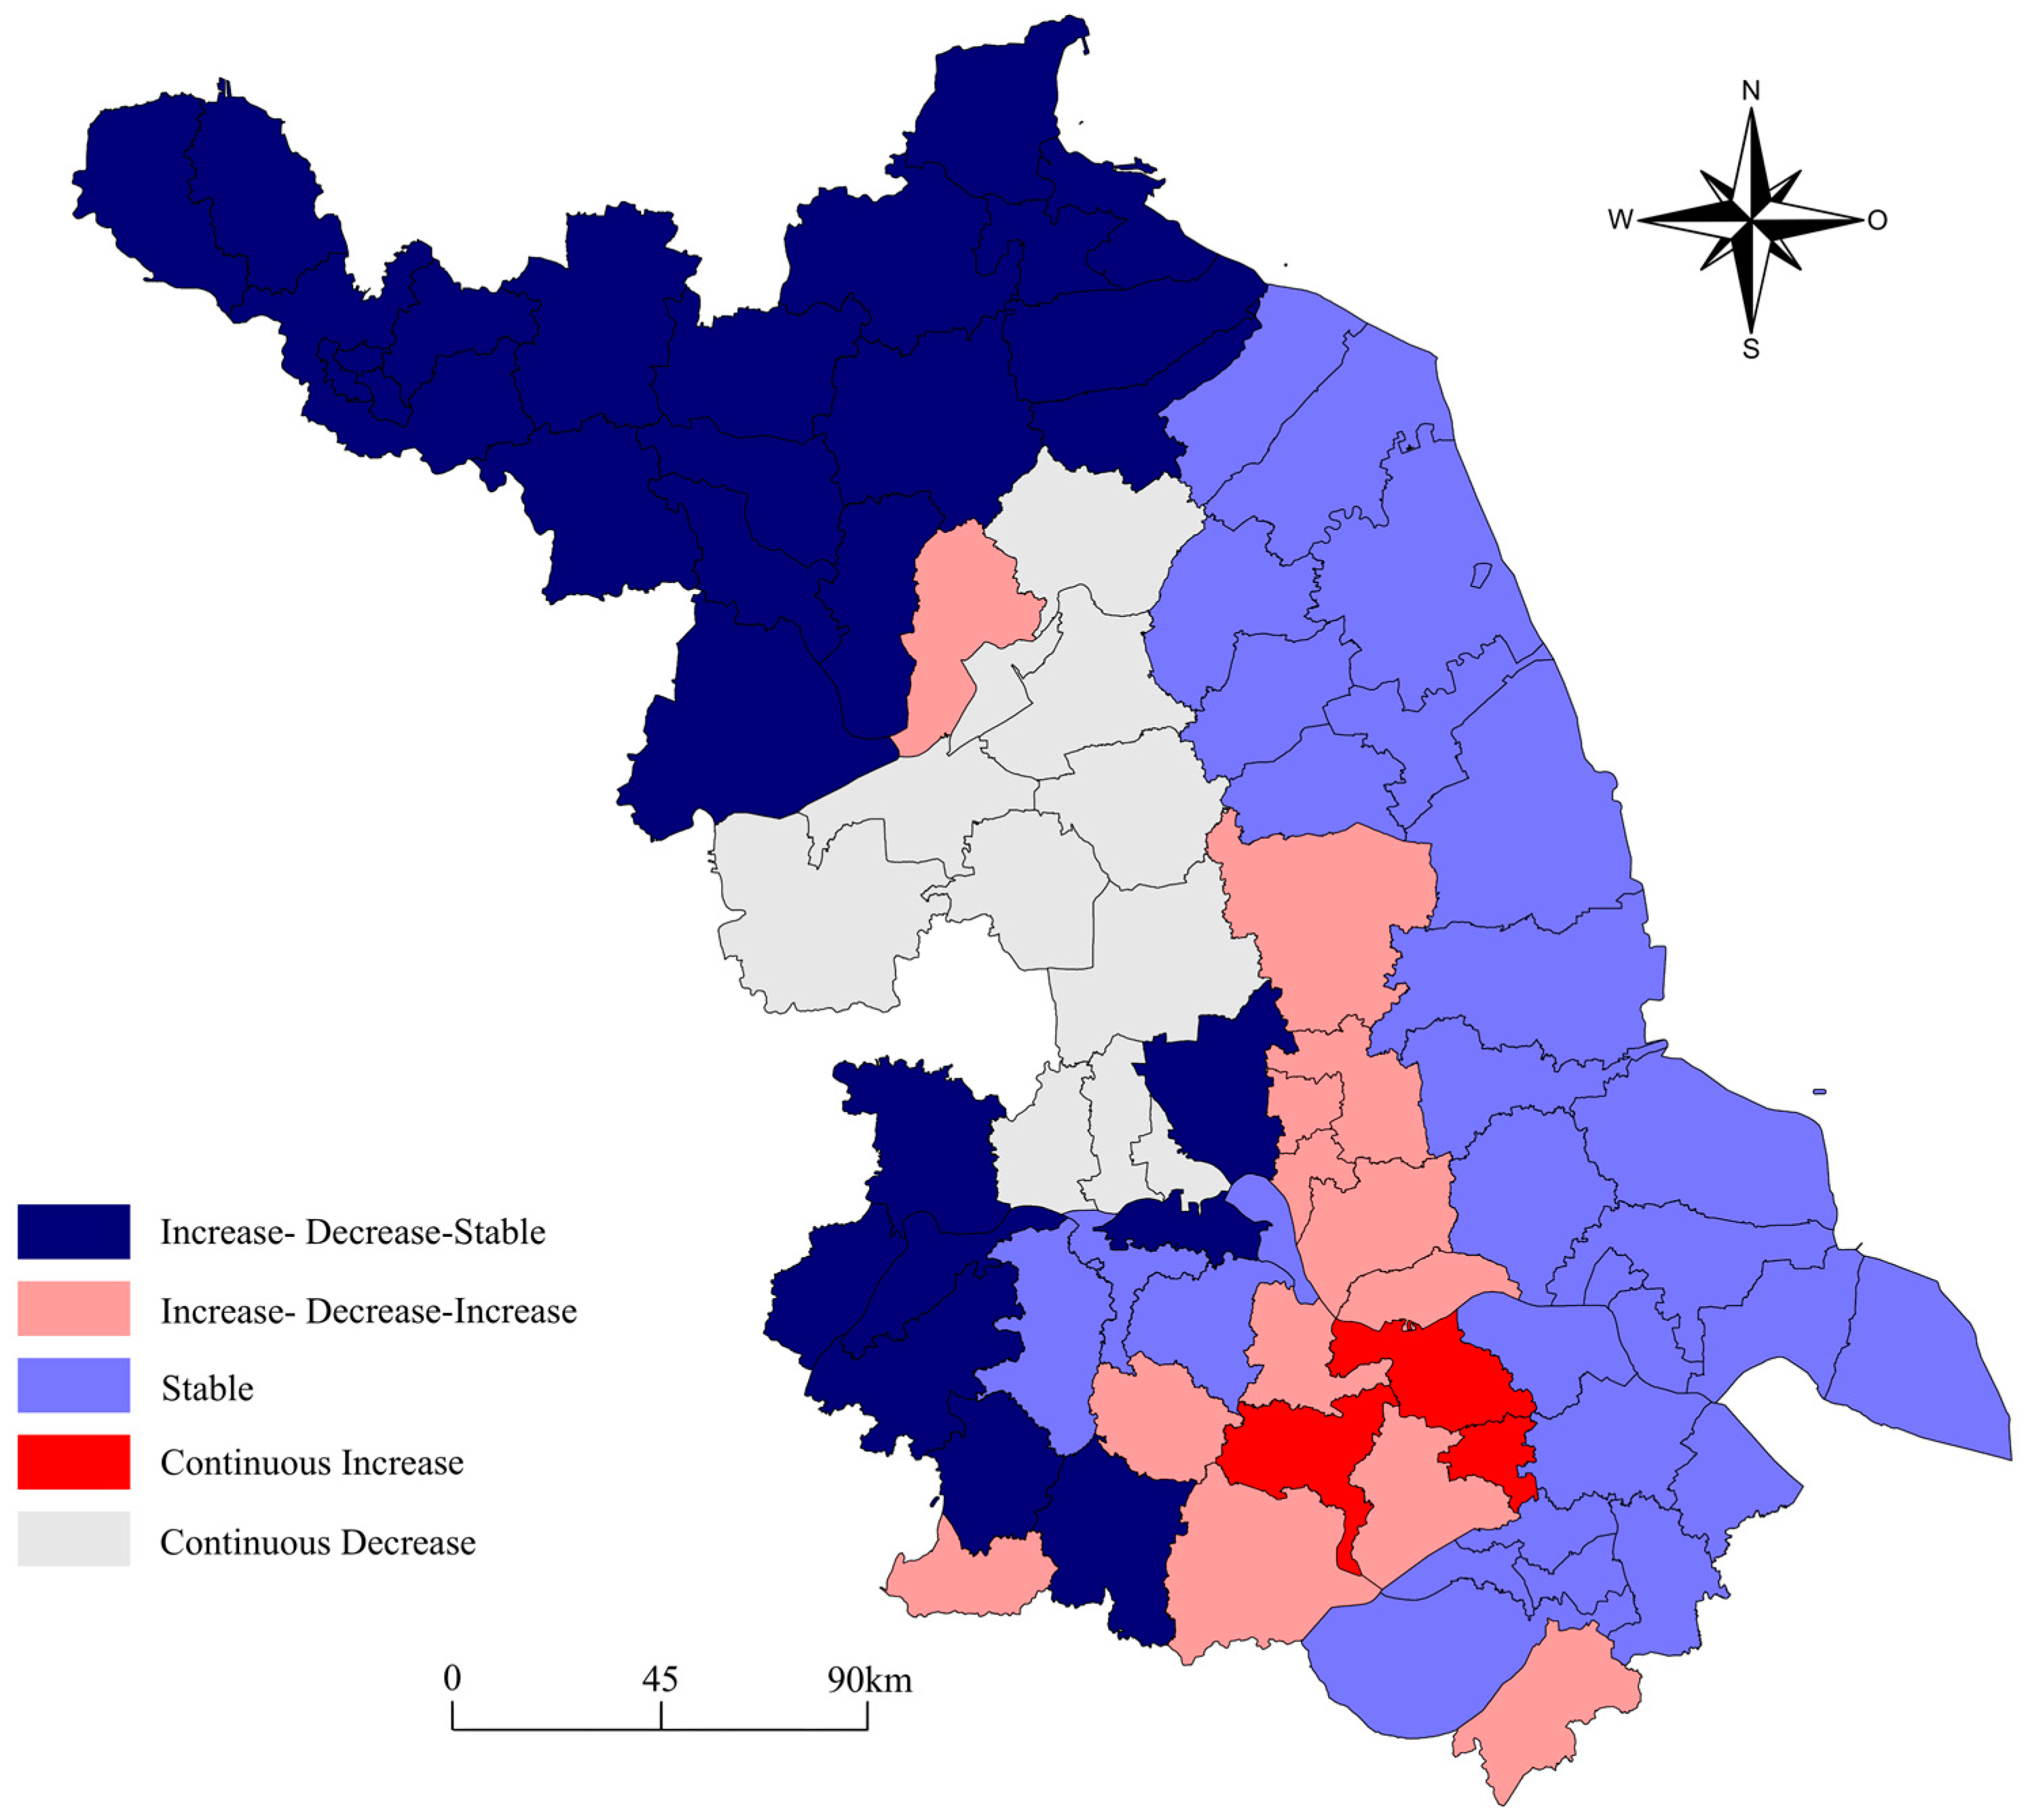
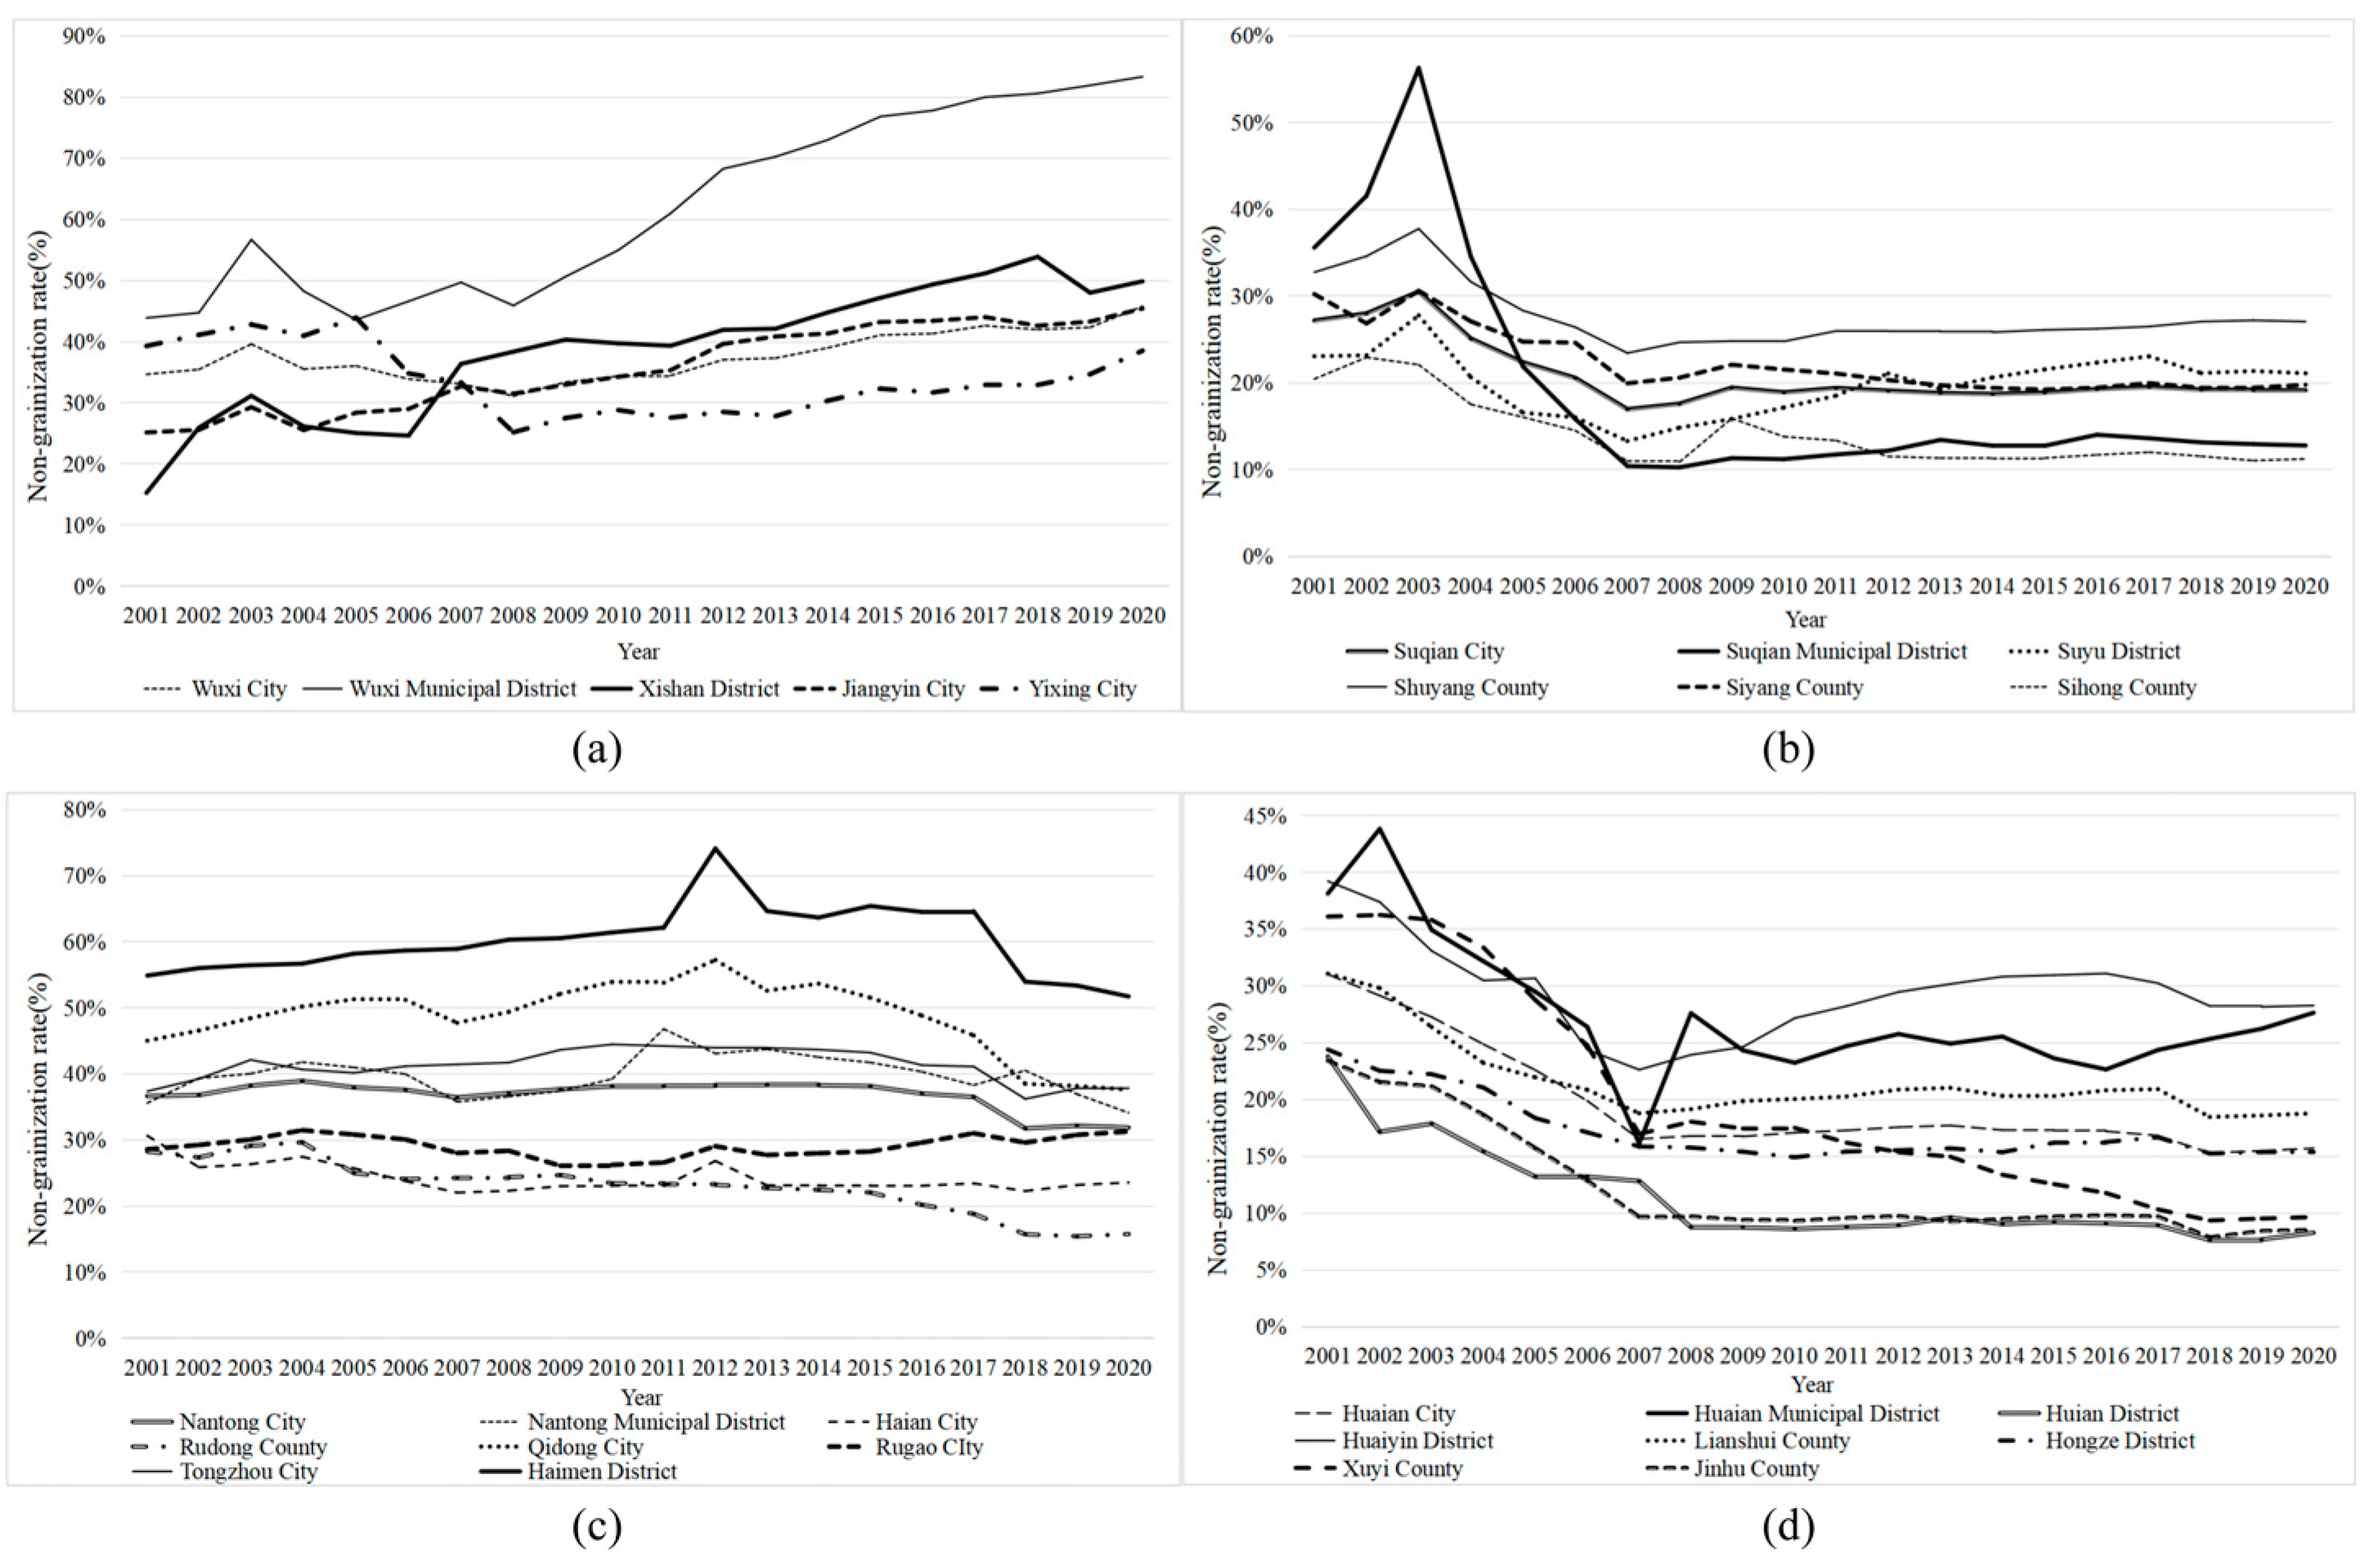
  • Increase–Decrease–Increase: Counties such as Wuxi and Taizhou had a pattern of rising, falling, and then rising non-grainization rates. For example, Wuxi’s non-grainization rate increased significantly to 56.69% between 2001 and 2003, then gradually decreased from 2003 to 2005, and finally increased rapidly to 83.35% by 2020 (Figure 5a).
  • Continuous Increase: This pattern was mainly concentrated in southern Jiangsu, including Xishan District in Wuxi, Jiangyin, and Wujin District in Changzhou. Jiangyin’s non-grainization rate increased by 20.2% from 2001 to 2020 (Figure 5a).
  • Stable: Some counties, such as Haian, Dongtai, and Danyang, experienced relatively stable non-grainization rates from 2001 to 2020 (Figure 5b).
  • Increase–Decrease–Stable: Some counties, such as Suqian, Zhenjiang, and Lianyungang, had a rapid rise in non-grainization rates between 2001 and 2003, reaching a peak of 56.29% followed by a decline to 10.29% by 2008, with little variation thereafter (Figure 5c).
  • Continuous Decrease: Some counties, such as Xuyi, Lianshui, and Hongze in Huai’an, showed a continuous decline in non-grainization rates, with Xuyi’s rate falling by 26.46% from 2001 to 2020 (Figure 5d).

3.2. Spatial Characteristics of Non-Grainization in Jiangsu Province

In 2000, the counties with high non-grainization rates were primarily located in southern Jiangsu, coastal regions, and the Xuzhou metropolitan area (Figure 6). By 2020, the counties with high non-grainization rates were mainly concentrated in southern Jiangsu, within a narrowing gap between central and northern Jiangsu. In 2001, the areas of non-grain cultivation were primarily distributed in central and northern Jiangsu, as well as Nanjing and Zhenjiang in southern Jiangsu. By 2020, the non-grainization areas were primarily located in northern Jiangsu and the coastal areas of central Jiangsu. A spatial autocorrelation analysis showed that in 2001, 2010, and 2020, the local Moran’s I index for non-grainization rates was >0, with a significance level of p < 0.05, indicating spatial clustering. The high–high (H–H) clusters were concentrated in southern Jiangsu, while the low–low (L–L) clusters were located in central and northern Jiangsu. From 2001 to 2020, the L–L clusters displayed a northward shift (Figure 7).

3.3. Analysis of the Factors Influencing the Non-Grainization of Cultivated Land in Jiangsu Province

Based on the regression model fitting results (Table 2 and Table 3), the R2 value of the geographically weighted regression was significantly higher than that in the MLR analysis due to the consideration of the geographical location of the study units. The relationships between the dependent variables, namely the non-grainization rate of cultivated land and the non-grainization area of cultivated land, and the independent variables displayed temporal variations.
Over the two decades from 2001 to 2020, the driving mechanisms of non-grainization of cultivated land in Jiangsu Province underwent a profound and complex evolution, demonstrating significant multidimensionality and dynamism (Table 2 and Table 3). Since 2010, the gross agricultural output value not only continued to promote the expansion of non-grain area but also began to significantly influence the proportion of non-grainization. Initially, regions with developed agricultural economies primarily increased their total output value by expanding the cultivation scale of non-grain crops. As time progressed, entering 2010, simple scale expansion encountered bottlenecks, making structural optimization in pursuit of higher added value an inevitable choice. Regions with higher gross agricultural output value had greater motivation and capacity to adjust and upgrade their planting structures, leading to a corresponding rise in the proportion of non-grainization. Economic development has consistently been the core thread for understanding the evolution of non-grainization in Jiangsu, with its driving role deepening from focusing on scale expansion to emphasizing both scale and structure. Meanwhile, the rigid constraints imposed by traditional natural geographical conditions showed a trend of gradual weakening.
The elevation factor exerted a significant positive influence on both the rate and area of non-grainization in the early stages, reflecting the limitations of topography on traditional grain crop cultivation and its natural suitability for specific non-grain crops (such as fruit trees and tea). However, with continuous advancements in agricultural technology, improvements in farmland infrastructure, and effective guidance from market demand for specialty agricultural products, the absolute limitations of topography were gradually overcome. This led to a gradual decline in the statistical significance of elevation’s influence, eventually ceasing to be a significant constraint by 2020. This indicates that technological and economic factors have largely reshaped the impact of the geographical environment on agricultural production methods.
However, not all factors exhibited unidirectional changes in influence; some showed persistent correlations or phased characteristics. The consistently significant negative relationship between rural electricity consumption and the rate of cultivated land non-grainization is particularly noteworthy. This phenomenon persisted throughout the twenty years, with the stable negative correlation suggesting that higher electricity consumption reflects improvements in agricultural infrastructure, such as electric irrigation, which is crucial for ensuring grain production, especially for guaranteeing stable yields of rice regardless of drought or flood. Consequently, farmers were more inclined to continue planting grain crops. In contrast, some driving factors that played important roles in the early stages showed distinct phased characteristics. The per capita disposable income of rural residents significantly stimulated the increase in the non-grainization rate only in 2001. Thereafter, with the diversification of farmers’ income sources, improvements in agricultural subsidy policies, and changes in operating entities brought about by land circulation, changes in rural residents’ income ceased to be a primary driver of cultivated land non-grainization. Similarly, the promotional effect of per capita cultivated land area on the expansion of non-grain area was limited to the initial period. The positive correlation between the application of agricultural chemical fertilizers (reflecting traditional high-input models) and the non-grain area also gradually disappeared in the later period with the development of green agriculture and the popularization of scientific fertilization techniques. The total power of agricultural machinery, however, exhibited a phased inhibitory effect. Specifically, around 2010, with the rapid development of large-scale mechanization for grain production, the efficiency of grain cultivation increased, making grain planting more advantageous in some areas and thus inhibiting the expansion of non-grain crop cultivation area. However, this inhibitory effect did not persist, possibly because agricultural machinery gradually became more diversified and adaptable to cultivating a wider range of crops, thus weakening its impact on the non-grain area.
More noteworthy is the emergence of new influencing factors towards the end of the study period, prompting attention to the long-term impacts of environmental change. Average annual precipitation showed a significant positive influence on the non-grainization rate in 2020. With increased precipitation, water resource conditions improved in some regions, potentially encouraging farmers to consider adaptive adjustments in their planting decisions. For example, more abundant rainfall can support the production of water-intensive grain crops like rice, thereby reducing the conversion to non-grain crops. This strongly suggests that the impact of climate change on agricultural production patterns has begun to manifest and is increasingly becoming a nascent force influencing farmers’ planting decisions and promoting adaptive adjustments in agricultural structure.
In summary, these two decades witnessed a profound reshaping of the driving forces behind non-grainization of cultivated land in Jiangsu Province: evolving from being largely constrained by individual economic motives, resource endowments, and natural geographical conditions in the early stages, to becoming a complex dynamic system dominated by macroeconomic development, where technological progress continuously alters the production possibility frontier, policy regulation plays an increasingly important role, and emerging factors such as climate change are beginning to exert influence. A deep understanding of the evolution of this driving mechanism, particularly distinguishing the differing emphasis of factors influencing the non-grainization rate (structural proportion) versus the non-grainization area (absolute scale), holds crucial theoretical and practical significance for formulating more precise, effective, and timely strategies for cultivated land protection and sustainable agricultural development.
The significantly correlated factors from the regression analysis were selected to analyze the spatial heterogeneity of each factor influencing the non-grainization rate and non-grainization area of cultivated land [34]. The coefficients of each factor were visualized using the natural breaks classification method (Figure 8 and Figure 9).
As shown in Figure 8, in the initial research period, the regression coefficients for the per capita disposable income of rural residents exhibited a significant southeast-to-northwest gradient decreasing pattern, indicating that the intensity of its positive influence on the non-grainization rate gradually weakened from the southeastern coastal areas towards the northwestern inland regions. Revealing such distinct spatial gradients underscores the value of geoinformation tools in understanding geographically varying socio-economic impacts on land use.
Throughout the entire 20-year study period, the spatial distribution of the regression coefficients for rural electricity consumption demonstrated high stability, consistently showing an east–high/west–low spatial differentiation characteristic. This suggests that its negative influence was more pronounced in the eastern regions.
The impact pattern of natural geographical factors revealed dynamic changes. The spatial gradient of the regression coefficients for the elevation factor underwent a significant shift between 2001 and 2010, evolving from an early southwest-to-northeast decreasing pattern to a west-to-east decreasing pattern, with the lowest degree of influence observed in the southeastern areas. Capturing this dynamic evolution of spatial impact patterns demonstrates the essential role of advanced geospatial techniques like MGWR in analyzing non-stationary relationships.
The driving effect of the economic development level also displayed spatial directivity. Between 2010 and 2020, the regression coefficients for the gross agricultural output value stably presented a spatial distribution pattern featuring a high-value zone in the southwest, progressively decreasing towards the central and northeastern regions.
Furthermore, the influence of climatic factors manifested specific spatial patterns towards the end of the study period. In 2020, the spatial distribution of the regression coefficients for average annual precipitation showed a complex pattern, characterized by a decrease from the southwest to the northeast, followed by a further decrease towards the northwest.
As shown in Figure 9, in the initial research period of 2001, the regression coefficients for per capita of cultivated land area showed a clear west-to-east increasing gradient, indicating that its positive influence on the non-grainization area gradually strengthened from west to east. Concurrently, the coefficients for gross agricultural output value exhibited a southwest-to-northeast increasing trend, peaking in the northernmost and easternmost regions of Jiangsu. Regarding natural geographical factors, the coefficients for elevation in 2001 demonstrated a west-to-east decreasing pattern, with the influence intensity being lowest in the easternmost areas. During the period from 2001 to 2010, the coefficients for agricultural input factors, such as the application of agricultural chemical fertilizers, stably presented a south-to-north increasing spatial pattern.
Moving into the mid-research period of 2010, the spatial distribution pattern of the regression coefficients for gross agricultural output value underwent a significant change. It transformed into a spatial distribution characterized by high-value zones in the northwest and southeast, decreasing towards the central region, with the coefficients in the southeast being the highest. Simultaneously, the coefficients for the total power of agricultural machinery in that year displayed a southwest-to-northeast decreasing spatial trend. Identifying these simultaneous shifts and distinct spatial trends for different variables underscores the importance of spatially explicit models like MGWR, enabled by geoinformation tools, for understanding mid-period transition dynamics.
By the final research period of 2020, although the spatial pattern of the coefficients for gross agricultural output value continued to feature the two high-value zones in the northwest and southeast, the spatial center of its influence shifted. The coefficients in the northwestern region surpassed those in the southeast, making it the region with the strongest influence.

4. Discussion

Significant spatiotemporal variations were identified in the non-grainization of cultivated land in Jiangsu Province over the past two decades [35]. These variations were shaped by a complex interplay of socio-economic, agricultural, and environmental factors. The results provide important insights into land use dynamics in the context of rapid urbanization and agricultural modernization.

4.1. Analysis of the Factors Affecting the Non-Grainization Rate of Cultivated Land in Jiangsu Province and Regional Differences

From 2001 to 2020, the non-grainization rate of cultivated land in Jiangsu Province exhibited an increasing–decreasing–stabilizing trend. In the southern Jiangsu region, the non-grainization rate followed an increasing–decreasing–increasing pattern, whereas the central and northern regions displayed an increasing–decreasing–stabilizing trend. The non-grainization rate was significantly higher in southern Jiangsu than in the central and northern regions. The non-grainization of cultivated land displayed a spatial dependence and was closely related to urban economic development and regional functional planning [36]. Areas with higher levels of economic development were more prone to non-grainization practices. As a more economically developed region, industrialization and urbanization processes are more advanced in southern Jiangsu than elsewhere in the study area, which has promoted the cultivation of high-value non-grain crops and driven the non-grainization of cultivated land.
In terms of spatial autocorrelation, the H–H clusters of the non-grainization rate of cultivated land in Jiangsu Province were primarily located in the Nanjing metropolitan area but gradually expanded to the Su-Xi-Chang region. The L–L clusters were mainly situated in the central and northern regions, with a gradual northward shift. The H–H clusters of the non-grainization area of cultivated land were mainly found in Dongtai City, Pizhou, and Xinyi City. The L–L clusters of the non-grainization area of cultivated land were distributed in the Yangzhong region but gradually expanded to the Su-Xi region [37].
The non-grainization of cultivated land is primarily influenced by the level of economic development. Previous studies have indicated that an increase in rural economic income increases the ability and willingness of farmers to choose high-yield non-grain crops [38,39]. With the development of the rural economy, farmers have more resources and risk-bearing capacity, enabling them to invest in high-value economic crops. Vegetable and fruit production is more likely to occur in regions with higher levels of economic development and sufficient labor [40]. This is because traditional grain crops yield lower profits compared to high-value non-grain crops. As farmers derive a higher income from planting fruits, medicinal materials, and other non-grain crops, the proportion and scale of non-grain crop cultivation gradually expands, directly leading to large areas of existing cultivated land being used for non-grain crops and intensifying the degree of non-grainization of cultivated land [41].

4.2. Potential Impact of the Non-Grainization of Cultivated Land on China’s Food Security

The trend of non-grainization of cultivated land partly reflects the transformation of the agricultural economy toward higher efficiency and sustainable development. However, excessive non-grainization may pose a threat to food security, especially in the context of global climate change and population growth [42]. Over the past two decades, rapid urbanization and industrialization in China’s coastal regions have exerted significant pressure on agricultural land use, resulting in the widespread non-grainization of cultivated land and severely threatening the protection of high-quality farmland and national food security. In 2018, the non-grainization area of cultivated land in the 11 coastal provinces and regions of China was approximately 15.82 × 10⁶ ha, accounting for 33.65% of the national total cultivated land area. Jiangsu Province, as a coastal province with a high GDP, had a non-grainization area of cultivated land exceeding 1.2 × 10⁶ ha and a non-grainization rate of approximately 30%, second only to Guangdong Province (50%) and Guangxi Zhuang Autonomous Region (45%) [36]. The high non-grainization rates in Guangdong and Guangxi are primarily due to their highly developed economies, frequent foreign trade, and diversified agricultural structures. Although the non-grainization of cultivated land has promoted agricultural diversification and economic development, it has also introduced several potential risks to food security.
First, the conversion of cultivated land to non-grain crops directly reduces the area available for grain crop cultivation, potentially leading to a decrease in total grain production. This may increase reliance on grain imports and weaken the stability of the national food supply chain. Additionally, during the non-grainization process, farmers tend to plant high-value crops, which not only alters the agricultural production structure but may also disrupt long-term planting plans and overlook the technological improvements made in cultivating grain crops, affecting the stability of their yield and quality [43]. Furthermore, non-grainization is accompanied by the transfer of agricultural labor to non-agricultural sectors, resulting in a shortage of agricultural labor and further impacting the management and harvesting efficiency of grain crops. It is also important to note that high-value economic crops typically require more water resources and increased use of fertilizers and pesticides [44], which may exacerbate soil degradation, water scarcity, and environmental deterioration, thereby negatively affecting the sustainable production of grain crops [45]. The imbalance in food production across regions also exacerbates the vulnerability of national food security. As an important grain-producing region, the non-grainization of cultivated land in Jiangsu Province may increase the dependence on other major grain-producing areas, creating weak links in the supply chain [46].
Therefore, to balance the promotion of agricultural diversification with the safeguarding of food security, it is essential to optimize land use structures through policy regulation and structural adjustments in agriculture, ensuring that the area and yield of grain crops do not significantly decline due to non-grainization. Simultaneously, promoting agricultural technological innovation and enhancing the production efficiency of grain crops to improve their resilience to risks are key measures to ensure the stability and sustainable development of grain production. The government should formulate policy measures to support grain production, such as agricultural subsidies, technology dissemination, and the construction of grain reserves. These measures are essential to prevent the excessive substitution of grain crops and to maintain their cultivation.

4.3. Policy Implications

4.3.1. Cross-Regional Allocation of Food and Cash Crops, and the Establishment of a Provincial Compensation Mechanism

To ensure the effective utilization of cultivated land and national food security, while countries worldwide have implemented farmland protection compensation measures, they commonly face challenges such as limited funding sources and difficulties in regional coordination. In addressing the balance of resources and responsibilities between regions, specific policy practices have emerged internationally: for instance, Germany utilizes financial transfer payment mechanisms to achieve fiscal balance and resource allocation among different regions [47], while the United States employs institutional arrangements like the purchase of development rights programs to protect farmland while balancing land development needs [48]. In China, to address similar challenges and resolve structural issues such as ‘grain-rich provinces with poor counties’, the central government has explicitly proposed exploring the establishment of inter-provincial horizontal interest compensation mechanisms between major grain-producing and major grain-consuming areas [49]. Against this backdrop, this study posits that, in addition to exploring inter-provincial compensation at the national level, innovatively applying the concept of horizontal compensation within provinces and actively promoting its practice at the provincial level holds significant practical relevance and higher feasibility.
Within Jiangsu Province specifically, there are significant disparities among counties in terms of economic development levels, resource endowments, and agricultural structures. Certain areas bear the primary responsibility for grain production, and it is necessary to recognize and compensate their contributions in value through an intra-provincial compensation mechanism. Compared to the complexities of inter-provincial coordination, the provincial government possesses higher administrative efficiency and operability in promoting such compensation mechanisms within its jurisdiction regarding policy coordination, resource allocation, and balancing interests. This is vital for effectively motivating the enthusiasm of local governments in major grain-producing areas to prioritize agriculture and grain production, as well as stimulating the innovative vitality of farmers and agricultural science personnel.
In concrete terms, implementation should involve comprehensively considering local grain consumption demands, soil conditions, water resources, and other cultivation fundamentals to designate distinct grain production zones and zones for non-grain crops like vegetables and fruits. Provincial compensation mechanisms should be utilized to promote cross-regional resource flow, market mechanisms employed to incentivize grain production, and market policies leveraged to regulate the non-grainization rate, thereby optimizing crop structure while guaranteeing grain output.

4.3.2. Integrating Land Transfer Management and Climate Adaptation for Sustainable Grain Production

The rapid industrialization and urbanization of Jiangsu Province have accelerated the transfer of rural labor to cities, promoting the development of land transfer. Although the scale of land transfer in Jiangsu is large, the proportion of transferred land used for grain cultivation by farmers is relatively small, with a significant non-grainization area of cultivated land. In the rural areas of Jiangsu, new agricultural business entities are now widely engaged in agricultural operations. In response to these entities, the government should continue to improve the land transfer system to ensure the centralized and contiguous characteristics of arable land, and further increase support for large-scale grain production. Meanwhile, it is imperative to significantly enhance the climate resilience of agricultural production. Internationally, many countries have implemented a range of measures to address similar challenges. For instance, in the European Union (EU), the Common Agricultural Policy (CAP) not only supports land transfer among farmers but also provides subsidies and incentives to promote large-scale grain production, while encouraging the adoption of climate-smart agricultural technologies to strengthen climate resilience. In addition, the EU has implemented climate-focused financial support and policies that provide farmers with climate information and training to help them make informed decisions in response to climate change [50].
Meanwhile, continuous upgrading of agricultural infrastructure is also critical, particularly improving irrigation and drainage systems to cope with changing precipitation patterns and to enhance drought resistance, flood mitigation, and resilience to extreme weather events. To ensure sustainable agricultural development, Jiangsu Province must also scientifically plan the regional layout of grain production in line with climate change trends, thereby achieving both climate resilience and sustainability in its grain production systems.

4.3.3. Considering Regional Heterogeneity in Cultivated Land Management

Addressing complex agricultural challenges like non-grain production requires acknowledging and responding to significant regional variations, a principle increasingly recognized in policy-making globally [51,52]. Therefore, considering that Jiangsu, as an economically developed coastal province, exhibits significant regional differences in culture, economic development levels, and the mindset of farmers. The factors driving non-grainization also vary significantly across counties. Taking counties as units, the fluctuating trends in the non-grainization rate of cultivated land from 2001 to 2020 in Jiangsu can be classified into five types. Differentiated governance measures can be adopted at the county level for each of these five types:
  • Increase–decrease–increase: Mainly concentrated in southern Jiangsu, with some areas in central Jiangsu. The non-grainization rate during the increase phase is generally much higher than the provincial average. Vigilance is required to curb the further spread of non-grainization. Measures such as the grain security responsibility system should be implemented to protect grain cultivation areas and strengthen the surveillance of “grain fields” converted to “non-grain fields” to ensure food security. A high standard of farmland construction should be promoted to maintain the cultivation area and improve farmland management. This would prevent farmers from abandoning grain for economic benefits.
  • Continuous increase: Primarily in southern Jiangsu, where the proportion of grain-sown areas is generally below 60%. High-quality grain crop varieties should be promoted, with priority given to arable land use. In this region, high-quality arable land should be used for grain production.
  • Increase–decrease–stable: Mainly occurs in municipal districts, which are the core components of urban areas and the centers of regional economic development. While developing tertiary industry, modern agriculture should also be vigorously developed to establish concentrated and contiguous high-yield grain production areas. This would ensure an effective supply of the major agricultural products, continuous income growth for farmers, and sustainable agricultural development.
  • Stable: Classified treatment and scientific planning are required in these regions. For areas with non-grainization rates below the provincial average (e.g., Suqian and Lianyungang municipal districts), which have a strong foundation in grain production and a significant impact on food security, stable production rates and supply should be maintained. The production capacity of important agricultural products should be gradually improved. For areas with non-grainization rates above the provincial average, existing farmland planning should be adjusted, and the Party and government should take joint responsibility for food security.
  • Continuous decrease: Most districts and counties in Huai’an displayed an overall decreasing trend. In 2022, 10.4% of Jiangsu’s arable land produced 12.9% of its grain. Therefore, all regions must resolutely reduce the unauthorized use of arable land, implement various strategies to enhance food security, and consistently enhance mechanisms for high-quality farmland construction.

4.4. Limitations of the Study

Despite the contributions of this study, several limitations should be acknowledged. First, due to the relatively long research period, reliance on statistical yearbook data alone introduces certain limitations in the analysis. Future research could enhance data reliability and spatial precision by integrating multi-source remote sensing data with field survey information. Second, the current analysis lacks a policy evaluation framework among the influencing factors, and subsequent studies should systematically incorporate these elements. Third, the spatial resolution of the current study remains at the county level. To better capture spatial heterogeneity, future work should extend the analysis to township or pixel scales.

5. Conclusions

This study conducted an in-depth analysis of the spatiotemporal evolution and driving factors of non-grainization in Jiangsu Province over the past two decades. By applying a spatial autocorrelation analysis and MGWR, the findings demonstrate a significant transformation in the driving mechanism. It has transitioned from being largely limited by individual economic motives, resource availability, and natural constraints in the early stages to becoming a complex dynamic system. In this later system, macroeconomic development takes the lead, technological advancements continually expanded the potential for agricultural production, and the influence of emerging factors like annual mean precipitation is starting to become apparent. The study identified significant regional disparities, with southern Jiangsu transitioning to non-grainization more rapidly than central and northern Jiangsu, partly due to the stronger economic incentives and better access to agricultural infrastructure. The results highlight the importance of formulating balanced land use policies that not only support economic diversification but also ensure food security. Future policies should focus on improving agricultural infrastructure, such as irrigation, while ensuring that the economic benefits of non-grain crops do not undermine grain production capacity. The experience of Jiangsu Province offers a valuable case study for other rapidly urbanizing regions facing similar challenges in balancing agricultural modernization, land use pressures, and food security.

Supplementary Materials

The following supporting information can be downloaded at: https://www.mdpi.com/article/10.3390/ijgi14040174/s1. Tables S1–S3 (Worksheets 1–3 Excel file).

Author Contributions

Conceptualization, Yingxi Chen and Yan Xu; methodology, Yingxi Chen; software, Yingxi Chen; validation, Yingxi Chen, Yan Xu and Nannan Ye; formal analysis, Yingxi Chen.; investigation, Yingxi Chen and Nannan Ye; resources, Yan Xu; data curation, Yingxi Chen and Yan Xu; writing—original draft preparation, Yingxi Chen; writing—review and editing, Yingxi Chen; visualization, Yingxi Chen; supervision, Yan Xu; project administration, Yan Xu; funding acquisition, Yan Xu All authors have read and agreed to the published version of the manuscript.

Funding

This research was funded by the Humanities and Social Science Fund of Ministry of Education of China (22YJCZH208) and the National Natural Science Foundation of China (41701609).

Data Availability Statement

The raw data supporting the conclusions of this article will be made available by the authors on request.

Conflicts of Interest

The authors declare no conflict of interest.

References

  1. Prosekov, A.Y.; Ivanova, S.A. Food security: The challenge of the present. Geoforum 2018, 91, 73–77. [Google Scholar] [CrossRef]
  2. Beddington, J.R.; Crute, I.R.; Godfray, H.C.J. Food security: The challenge of feeding 9 billion people. Science 2010, 327, 812–818. [Google Scholar]
  3. Long, H.; Ge, D.; Zhang, Y.; Tu, S.; Qu, Y.; Ma, L. Changing man-land interrelations in China’s farming area under urbanization and its implications for food security. J. Environ. Manag. 2018, 209, 440–451. [Google Scholar] [CrossRef] [PubMed]
  4. Gao, M.; Chen, B.; Xu, Y.; Li, D. Heterogeneous impacts of global land urbanization on land-use structure from economic and technological perspectives. Ecol. Indic. 2023, 147, 109955. [Google Scholar] [CrossRef]
  5. Halperin, S.; Castro, A.J.; Quintas-Soriano, C.; Brandt, J.S. Assessing high quality agricultural lands through the ecosystem services lens: Insights from a rapidly urbanizing agricultural region in the western United States. Agric. Ecosyst. Environ. 2023, 349, 108435. [Google Scholar] [CrossRef]
  6. Mudapakati, C.P.; Bandauko, E.; Chaeruka, J.; Arku, G. Peri-urbanisation and land conflicts in Domboshava, Zimbabwe. Land Use Policy 2024, 144, 107222. [Google Scholar] [CrossRef]
  7. Deb, P.; Jha, R.K.; Kumar, N.; Vishal, M.K.; Shukla, D.P.; Kalita, P.K.; Singh, L.K. Analyzing land use land cover dynamics under rapid urbanization using multi-temporal satellite imageries and geospatial technology for Jamshedpur city in India. Adv. Space Res. 2025, 75, 2810–2825. [Google Scholar] [CrossRef]
  8. Okeleye, S.O.; Okhimamhe, A.A.; Sanfo, S.; Fürst, C. Impacts of Land Use and Land Cover Changes on Migration and Food Security of North Central Region, Nigeria. Land 2023, 12, 1012. [Google Scholar] [CrossRef]
  9. Zhai, J.; Pu, L.; Lu, Y.; Huang, S. Is the boom in staple crop production attributed to expanded cropland or improved yield? A comparative analysis between China and India. Sci. Total Environ. 2024, 933, 173151. [Google Scholar] [CrossRef]
  10. Gao, Y.; Yue, Y.; Yang, W. Correlating grain yield with irrigation in a spatio-temporal context on the North China Plain. Heliyon 2024, 10, e32745. [Google Scholar] [CrossRef]
  11. Zeng, K.; Zhai, Y.; Wang, L.; Wang, Y. Spatio-Temporal Differentiation of Non-Grain Production of Cropland and Its Influencing Factors: Evidence from the Yangtze River Economic Belt, China. Sustainability 2024, 16, 6103. [Google Scholar] [CrossRef]
  12. He, T.T.; Jiang, S.Q.; Xiao, W.; Zhang, M.; Tang, T.; Zhang, H. A non-grain production on cropland spatiotemporal change detection method based on Landsat time-series data. Land Degrad. Dev. 2024, 35, 3031–3047. [Google Scholar] [CrossRef]
  13. Zhang, D.; Yang, W.; Kang, D.; Zhang, H. Spatial-temporal characteristics and policy implication for non-grain production of cultivated land in Guanzhong Region. Land Use Policy 2023, 125, 106466. [Google Scholar] [CrossRef]
  14. Bhullar, A.; Nadeem, K.; Ali, R.A. Simultaneous multi-crop land suitability prediction from remote sensing data using semi-supervised learning. Sci. Rep. 2023, 13, 6823. [Google Scholar] [CrossRef]
  15. Hao, Q.; Zhang, T.; Cheng, X.; He, P.; Zhu, X.; Chen, Y. GIS-based non-grain cultivated land susceptibility prediction using data mining methods. Sci. Rep. 2024, 14, 4433. [Google Scholar] [CrossRef] [PubMed]
  16. Wu, Y.; Yuan, C.; Wei, W.X. Decoupling relationship between the non-grain production and intensification of cultivated land in China based on Tapio decoupling model. J. Clean. Prod. 2023, 424, 138800–138801. [Google Scholar] [CrossRef]
  17. Zhu, Z.Y.; Duan, J.J.; Li, S.L.; Dai, Z.; Feng, Y. Phenomenon of Non-Grain Production of Cultivated Land Has Become Increasingly Prominent over the Last 20 Years: Evidence from Guanzhong Plain, China. Agriculture 2022, 12, 1654. [Google Scholar] [CrossRef]
  18. Zhang, J.; Li, X.; Xie, S.; Xia, X. Research on the Influence Mechanism of Land Tenure Security on Farmers’ Cultivated Land Non-Grain Behavior. Agriculture 2022, 12, 1645. [Google Scholar] [CrossRef]
  19. Chen, S.C.; Zhang, Y.N.; Zhu, Y.L.; Ma, L.; Zhao, J. The battle of crops: Unveiling the shift from grain to non-grain use of farmland in China? Int. J. Agr. Sustain. 2023, 21, 2262752. [Google Scholar] [CrossRef]
  20. Li, Y.F.; Zhao, B.C.; Huang, A.; Xiong, B.; Song, C. Characteristics and Driving Forces of Non-Grain Production of Cultivated Land from the Perspective of Food Security. Sustainability 2021, 13, 14047. [Google Scholar] [CrossRef]
  21. Huang, J.; Wei, W.; Cui, Q.; Xie, W. The prospects for China’s food security and imports: Will China starve the world via imports? J. Integr. Agr. 2017, 16, 2933–2944. [Google Scholar] [CrossRef]
  22. Liu, M.X.; Lin, F.Q. The Impact of COVID-19Pandemic on the Resilience of China’s Agricultural Trade. Int. Econ. Trade Res. 2023, 39, 51–67. [Google Scholar] [CrossRef]
  23. Rivera-Ferre, M.G.; López-i-Gelats, F.; Ravera, F.; Oteros-Rozas, E.; di Masso, M.; Binimelis, R.; El Bilali, H. The two-way relationship between food systems and the COVID-19 pandemic: Causes and consequences. Agr. Syst. 2021, 191, 103134. [Google Scholar] [CrossRef]
  24. Stephens, E.; Timsina, J.; Martin, G.; van Wijk, M.; Klerkx, L.; Reidsma, P.; Snow, V. The immediate impact of the first waves of the global COVID-19 pandemic on agricultural systems worldwide: Reflections on the COVID-19 special issue for agricultural systems. Agr. Syst. 2022, 201, 103436. [Google Scholar] [CrossRef] [PubMed]
  25. Xu, J.L.; Ding, Y. Research on Early Warning of Food Security Using a System Dynamics Model: Evidence from Jiangsu Province in China. J. Food Sci. 2015, 80, R1–R9. [Google Scholar] [CrossRef]
  26. Jiangsu Provincial People’s Government. Jiangsu Statistical Yearbook 2021. Available online: https://tj.jiangsu.gov.cn/2021/indexc.htm (accessed on 27 July 2024).
  27. National Bureau of Statistics. China Population Census Yearbook 2020. Available online: https://www.stats.gov.cn/sj/pcsj/rkpc/7rp/indexch.htm (accessed on 23 March 2025).
  28. Guo, Y.; Wang, J. Identifying the Determinants of Nongrain Farming in China and Its Implications for Agricultural Development. Land 2021, 10, 902. [Google Scholar] [CrossRef]
  29. Hu, J.; Wang, H.; Song, Y. Spatio-Temporal Evolution and Driving Factors of “Non-Grain Production” in Hubei Province Based on a Non-Grain Index. Sustainability 2023, 15, 9042. [Google Scholar] [CrossRef]
  30. Yang, J.; Liu, Q.L.; Deng, M. Spatial hotspot detection in the presence of global spatial autocorrelation. Int. J. Geogr. Inf. Sci. 2023, 37, 1787–1817. [Google Scholar] [CrossRef]
  31. Hughey, S.M.; Kaczynski, A.T.; Porter, D.E.; Hibbert, J.; Turner-McGrievy, G.; Liu, J. Spatial clustering patterns of child weight status in a southeastern US county. Appl. Geogr. 2018, 99, 12–21. [Google Scholar] [CrossRef]
  32. Bashir, A.; Shehzad, M.A.; Hussain, I.; Rehmani, M.I.A.; Bhatti, S.H. Reservoir Inflow Prediction by Ensembling Wavelet and Bootstrap Techniques to Multiple Linear Regression Model. Water Resour. Manag. 2019, 33, 5121–5136. [Google Scholar] [CrossRef]
  33. Kamarianakis, Y.; Feidas, H.; Kokolatos, G.; Chrysoulakis, N.; Karatzias, V. Evaluating remotely sensed rainfall estimates using nonlinear mixed models and geographically weighted regression. Environ. Model. Softw. 2008, 23, 1438–1447. [Google Scholar] [CrossRef]
  34. Zhao, S.X.; Xiao, D.Y.; Yin, M.M. Spatiotemporal Patterns and Driving Factors of Non-Grain Cultivated Land in China’s Three Main Functional Grain Areas. Sustainability 2023, 15, 13720. [Google Scholar] [CrossRef]
  35. Su, Y.; Li, C.; Wang, K.; Deng, J.; Shahtahmassebi, A.R.; Zhang, L.; Ao, W.; Guan, T.; Pan, Y.; Gan, M. Quantifying the spatiotemporal dynamics and multi-aspect performance of non-grain production during 2000–2015 at a fine scale. Ecol. Indic. 2019, 101, 410–419. [Google Scholar] [CrossRef]
  36. Sun, Y.; Chang, Y.; Liu, J.; Ge, X.; Liu, G.J.; Chen, F. Spatial Differentiation of Non-Grain Production on Cultivated Land and Its Driving Factors in Coastal China. Sustainability 2021, 13, 13064. [Google Scholar] [CrossRef]
  37. Xu, C.; Guo, J.; Yi, J.; Ou, M.H. Analysis on the Evolution of Spatiotemporal Pattern and Driving Factors of Non-grain Cultivated land in Jiangsu Province from 1996 to 2020. Resour. Environ. Yangtze Basin 2024, 33, 436–447. [Google Scholar]
  38. Tran, T.Q.; Vu, H.V. The pro-poor impact of non-crop livelihood activities in rural Vietnam: A panel data quantile regression analysis. Econ. Anal. Policy 2020, 68, 348–362. [Google Scholar] [CrossRef]
  39. Dzanku, F.M. Household-specific food price differentials and high-value crop production in rural Ghana. Food Policy 2015, 57, 73–82. [Google Scholar] [CrossRef]
  40. Liu, H.; Chen, S. Empirical analysis of factors influencing farmers’ willingness to participate in small-scale farmland water conservancy construction—Based on a survey of 475 farmers in major grain-producing areas of Hunan Province. China Rural. Surv. 2012, 02, 54–66. [Google Scholar]
  41. Xia, L. Study on the Relationship Between Non-Grain Production of Cultivated Land and Rural Household Income Under the Background of the Rural Revitalization Strategy: Based on On-Site Research and Analysis in Xuanwei City, Yunnan Province. Master’s Thesis, Yunnan University of Finance and Economics, Kunming, China, 5 June 2023. [Google Scholar]
  42. Dai, C.; Liu, Y.; Wang, J. Revealing the process and mechanism of non-grain production of cropland in rapidly urbanized deqing County of China. J. Environ. Manag. 2025, 374, 123948. [Google Scholar] [CrossRef]
  43. Lou, S. What determines the investment intention of Chinese farmers in green grain production? Environ. Dev. Sustain. 2024, 26, 11217–11242. [Google Scholar] [CrossRef]
  44. Xiong, C.J.; Zhao, X.H. Impacts of chemical fertilizer reduction on grain yield: A case study of China. PLoS ONE 2024, 19, e0298600. [Google Scholar] [CrossRef] [PubMed]
  45. Xie, Y.; Wang, Z.; Wang, Y.; Zheng, J.; Xiang, S.; Gao, M. Spatial-temporal variation and driving types of non-grain cultivated land in hilly and mountainous areas of Chongqing. J. Agric. Resour. Environ. 2024, 41, 15–26. [Google Scholar] [CrossRef]
  46. Zheng, T.; Zhao, G.Q.; Chu, S.W. A Study on the Impact of External Shocks on the Resilience of China’s Grain Supply Chain. Sustainability 2024, 16, 956. [Google Scholar] [CrossRef]
  47. Oliveira, E.; Leuthard, J.; Tobias, S. Spatial planning instruments for cropland protection in Western European countries. Land Use Policy 2019, 87, 104031. [Google Scholar] [CrossRef]
  48. Linkous, E.R. Transfer of development rights in theory and practice: The restructuring of TDR to incentivize development. Land Use Policy 2016, 51, 162–171. [Google Scholar] [CrossRef]
  49. Zhang, X.Q. Research on the Construction of Inter-Provincial Horizontal Benefit Compensation Mechanism for Grain Production and Marketing Areas. Price Theory Pract. 2025. [Google Scholar] [CrossRef]
  50. Baldoni, E.; Ciaian, P. The capitalization of CAP subsidies into land prices in the EU. Land Use Policy 2023, 134, 106900. [Google Scholar] [CrossRef]
  51. Han, Z.; Xie, W.; Song, Y.; Sun, L.; Yu, H.; Chen, B.; Li, Y.; Wang, Y. A bottom-up nationwide analysis of sectoral land use reveals spatial heterogeneity across the United States. Resour. Conserv. Recycl. 2025, 212, 107969. [Google Scholar] [CrossRef]
  52. Punzo, G.; Castellano, R.; Bruno, E. Using geographically weighted regressions to explore spatial heterogeneity of land use influencing factors in Campania (Southern Italy). Land Use Policy 2022, 112, 105853. [Google Scholar] [CrossRef]
Figure 1. The administrative regions and subregions of the study area.
Ijgi 14 00174 g001
Figure 2. Changes in the non-grainization area (a) and non-grainization rate (b) of cropland in Jiangsu Province.
Ijgi 14 00174 g002
Figure 3. Changes in the 20-year non-grainization rate in southern, central, and northern Jiangsu.
Ijgi 14 00174 g003
Figure 4. Classification of the trends in the non-grainization rate in the counties of Jiangsu Province from 2001 to 2020.
Ijgi 14 00174 g004
Figure 5. Changes in the 20-year non-grainization rate in various cities in Jiangsu Province. (a) Wuxi; (b) Suqian; (c) Nantong; (d) Huaian.
Ijgi 14 00174 g005
Figure 6. Spatial distribution of non-grainization rate (a,b) and area (c,d) of cultivated land in Jiangsu Province in 2001 and 2020.
Ijgi 14 00174 g006
Figure 7. LISA clustering of non-grainization rate (a,b) and area (c,d) of cultivated land in Jiangsu Province in 2001 and 2020.
Ijgi 14 00174 g007
Figure 8. Spatial distribution of the geographically weighted regression coefficient of the non-grainization rate. (ac) Per capita disposable income of rural residents, rural electricity consumption and elevation in 2001; (df) total agricultural output value, rural electricity consumption and elevation in 2010; (gi) total agricultural output value, rural electricity consumption and annual mean precipitation in 2020.
Ijgi 14 00174 g008
Figure 9. Spatial distribution of the geographical weighted regression coefficient of the non-grainization area of cultivated land. (ad) Per capita cultivated land area, total agricultural output value, agricultural fertilizer application and elevation in 2001; (eg) total agricultural output, total agricultural machinery power, and agricultural fertilizer application in 2010; (h) total agricultural output in 2020.
Ijgi 14 00174 g009
Table 1. The factors driving the preliminary selection of arable land.
Driving FactorVariable DescriptionUnitPredicted Relationship
Social development
Total population (X1)Resident population of districts and countiesPersons+
Urbanization rate (X2)Urban resident population as a proportion of the total population%+
Rural Registered-Resident Population Discrepancy (X3)Rural Registered Population-Rural Resident Population10 thousand people+
Per capita cultivated land area (X4)Total cultivated land area in the county/Total populationKhm2±
Economic factors
Total agricultural output value (X5)Total agricultural output value, forestry, animal husbandry, and fisheriesMillion CNY+
Per capita disposable income of rural residents (X6)Income obtained by rural residents in the county after initial distribution and redistributionCNY per capita±
Proportion of non-agricultural income (X7)Non-agricultural income/Disposable income of rural residents%+
Production conditions
Total agricultural machinery power (X8)Total power of the machinery used in agriculture, forestry, animal husbandry, and fisheries in the countyMW
Rural electricity consumption (X9)Total electricity consumption in rural areas of the county during a specific time periodMWh±
Agricultural fertilizer application (X10)Total amount of fertilizer used in agricultural production in the county during a specific time periodTons+
Natural Endowments
Elevation (X11)Mean elevation of districts and countiesm+
Annual mean precipitation (X12)Mean annual precipitation of districts and countiesmm+
Annual mean temperature (X13)Mean annual temperature of districts and counties°C
Table 2. Comparison of the MLR and MGWR results for the factors driving the non-grainization rate of cultivated land.
Dependent VariableNon-Grainization Rate of Cultivated Land
YearIndependent VariableMLRMGWR
CoefficientT ValueVIFMeanMinimumMaximum
2001Constant 1.3 −0.0−0.00.0
X10.21.52.60.20.20.2
X20.31.73.70.30.30.6
X3−0.0−0.31.9−0.0−0.00.0
X40.21.32.20.30.30.4
X50.10.25.7−0.0−0.00.0
X60.6 **2.67.00.60.60.6
X7−0.10.62.50.00.00.0
X8−0.2−1.52.2−0.3−0.3−0.3
X9−0.6 **−2.94.6−0.3−0.3−0.3
X100.31.54.50.30.30.4
X110.4 ***3.61.40.30.30.4
X120.31.35.20.40.40.4
X13−0.2−0.94.4−0.4−0.3−0.0
Adj.R20.39 0.54
AIC 179.2
Function Gaussian
2010Constant 11.9 −0.3−0.3−0.2
X10.21.22.30.20.10.2
X20.00.03.40.1−0.10.4
X3−0.1−0.83.1−0.1−0.40.1
X4−0.3−1.44.2−0.2−0.2−0.1
X50.5 **2.94.60.50.50.5
X60.51.89.50.40.30.5
X70.10.84.40.10.00.1
X8−0.3−1.54.2−0.2−0.3−0.2
X9−0.4 **−2.83.5−0.3−0.4−0.3
X100.20.95.30.10.10.2
X110.2 *2.21.30.1−0.30.3
X120.21.32.80.30.10.4
X130.00.24.2−0.1−0.1−0.1
Adj.R20.44 0.55
AIC 176.4
Function Gaussian
2020Constant 13.7 −0.2−0.2−0.2
X10.32.32.20.30.30.3
X2−0.1−0.74.8−0.0−0.00.0
X3−0.2−1.53.5−0.2−0.3−0.2
X4−0.2−1.83.3−0.1−0.1−0.1
X50.5 *2.56.40.40.40.5
X60.41.79.40.30.30.3
X70.11.02.00.2−0.00.3
X8−0.1−0.57.6−0.1−0.1−0.1
X9−0.3 *−2.32.5−0.3−0.3−0.2
X10−0.1−0.64.4−0.2−0.3−0.1
X110.10.61.4−0.1−0.10.0
X120.3 *2.23.80.50.20.7
X13−0.1−0.64.2−0.2−0.2−0.2
Adj.R20.55 0.62
AIC 163.1
Function Gaussian
Note: * denotes p < 0.05, ** denotes p < 0.01, and *** denotes p < 0.001.
Table 3. Comparison of the MLR and MGWR results for the factors driving the non-grainization area of cultivated land.
Dependent VariableNon-Grainization Area of Cultivated Land
YearIndependent VariableMLRMGWR
CoefficientT ValueVIFMeanMinimumMaximum
2001Constant 2.6 −0.1−0.1−0.1
X10.11.12.60.10.10.1
X20.00.03.70.0−0.10.1
X30.00.41.90.00.00.1
X40.2 *2.62.20.30.10.7
X50.4 **3.05.70.40.40.4
X60.21.47.00.10.00.1
X70.11.42.50.10.00.1
X8−0.1−1.72.2−0.2−0.2−0.2
X9−0.2−2.04.6−0.1−0.2−0.1
X100.5 ***4.34.50.50.40.5
X110.1 *2.11.40.1−0.00.2
X120.21.35.20.20.10.2
X13−0.1−0.84.4−0.0−0.1−0.0
Adj.R20.74 0.83
AIC 100.0
Function Gaussian
2010Constant 8.0 −0.0−0.00.0
X1−0.0−0.52.3−0.0−0.1−0.0
X20.10.93.40.10.10.2
X30.21.93.10.20.10.2
X40.21.34.20.20.10.2
X50.7 ***4.84.60.60.60.6
X60.31.79.50.40.30.4
X7−0.0−0.04.4−0.1−0.1−0.1
X8−0.3 *−2.54.2−0.3−0.3−0.3
X9−0.2−1.33.5−0.1−0.2−0.1
X100.4 *2.55.30.40.40.4
X110.11.81.30.2−0.20.4
X12−0.0−0.32.80.0−0.10.6
X130.10.64.20.0−0.00.0
Adj.R20.66 0.69
AIC 148.2
Function Gaussian
2020Constant 7.7 0.0−0.00.0
X10.00.42.20.00.00.1
X2−0.0−0.04.80.0−0.00.0
X30.10.53.50.10.00.1
X40.10.63.30.1−0.10.2
X50.8 ***4.36.40.70.60.7
X60.31.19.40.20.20.3
X70.21.92.00.10.10.2
X8−0.1−0.67.6−0.0−0.00.0
X9−0.1−0.62.5−0.1−0.1−0.1
X100.10.64.40.10.10.1
X110.11.21.40.10.00.1
X12−0.0−0.13.80.10.00.2
X13−0.2−1.24.2−0.2−0.3−0.2
Adj.R20.57 0.61
AIC 164.1
Function Gaussian
Note: * denotes p < 0.05, ** denotes p < 0.01, and *** denotes p < 0.001.
Disclaimer/Publisher’s Note: The statements, opinions and data contained in all publications are solely those of the individual author(s) and contributor(s) and not of MDPI and/or the editor(s). MDPI and/or the editor(s) disclaim responsibility for any injury to people or property resulting from any ideas, methods, instructions or products referred to in the content.

