Abstract
The cultural and creative industries have garnered widespread attention as an important vehicle for promoting the transformation and upgrading of urban industrial structures. In this investigation, we take Harbin—a city in China with a strong industrial legacy—as a case study. Through kernel density analysis and the DBSCAN clustering algorithm, we identify and analyze the spatial distribution and spatiotemporal evolution patterns of 157 clusters of cultural and creative industries in Harbin. We construct a Geographic Weighted Regression (GWR) model using 20 indicators from three categories (i.e., social, cultural, and economic) to analyze the factors impacting the agglomeration of cultural and creative industries in Harbin. Our findings reveal that the cultural and creative industries exhibit an agglomeration pattern. A large-scale agglomeration area for large enterprises has formed in the city center, while scattered, small-scale agglomeration zones for emerging small enterprises have formed in newly developed areas on the urban periphery. The GWR analysis indicates that economic factors have the most significant impact on the agglomeration of cultural and creative industries; however, night-time economic facilities show a negative correlation. Among social factors, the convenience of public transportation and new energy transportation infrastructure have a significant impact on industrial agglomeration. Regarding cultural factors, cultural and sports facilities have the greatest influence, while public information kiosks and public arts education facilities exhibit spatial variability. These findings provide a scientific basis for policy formulation and contribute to promoting the healthy development of cultural and creative industries.
1. Introduction
With the increasing development of globalization and information technology, the cultural and creative industries have become important forces driving the transformation and upgrading of regional industrial structures and high-quality economic growth. These industries are viewed by various countries as a powerful means for economic transformation and development, gaining widespread attention and application in the context of urban renewal, spatial gentrification [1], local economic development [2], tourism [3], creative incubation, and shaping urban intellectual property. How do the spatial agglomeration and spatiotemporal evolution characteristics of cultural and creative industries influence the spatial structure of cities? What factors can continuously promote the agglomeration of cultural and creative industries, thereby enhancing the high-quality socio-economic development of regions? These have become core issues of ongoing interest for many researchers and urban planning managers.
The cultural and creative industries comprise an industry model that focuses on culture and utilizes technology, creativity, and industrialization to develop and market intellectual property. The concept of “cultural and creative industries” was first introduced in the “UK Creative Industry Path Document” issued by the British government in 1998 [4]. The concept of cultural industry clustering was first introduced by Wynne during his research on the development of urban cultural industries in the UK. He noted that various cultural and entertainment facilities tend to be highly concentrated in specific geographic areas within cities [5]. Florida believes that the concentration of creative industries is a gathering of “creative individuals” who have different perspectives on novelty. These gathering places should provide opportunities for interpersonal communication and the exchange of ideas among these “creative individuals” [6].
Many scholars have proposed constructive viewpoints on the factors influencing the agglomeration of cultural and creative industries from multiple perspectives. Lazzeretti analyzed cases in Italy and Spain, pointing out that human capital and economic agglomeration are determining factors for the concentration of cultural and creative industries, which tend to cluster in the core of the largest metropolitan areas [7]. Moreover, after analyzing the concentration of cultural and creative industries across different European countries, he believes that influencing factors vary among the countries [8]. De-Miguel-Molina suggested that higher levels of wealth accumulation and a sophisticated industrial structure are key factors influencing the clustering of cultural and creative industries. In areas with a high concentration of creative activities, there is often compatibility between high- and low-tech industries [9]. Potts emphasized the role of government policy in maintaining the dynamic connection between cultural and creative industries and the economy, advocating for the use of welfare subsidies, the establishment of industry standards, investment in growth policies, and the implementation of effective innovation policies [10].
Various scholars have used different analytical methods to quantitatively assess the spatial clustering of cultural and creative industries. Lazzeretti et al. adopted various analytical methods, including absolute or relative indices, relative deviations of absolute values, and parameterizing the location quotient into a normal distribution, to analyze the distribution characteristics of cultural and creative industries in Italy and Spain, explaining the different clustering patterns of cultural and creative industries in these two countries [11]. Coll-Martínez et al. innovatively used high-precision geographic location data, combined with distance-based M-functions, to quantify clustering intensity. They compared the clustering intensity of cultural and creative industries with that of other types of industries and calculated the strongest clustering distance for the cultural and creative industries [12]. Imperiale selected two geographically remote, economically weak, and outward-migrant areas in Italy and Greece. Utilizing channels such as chambers of commerce and enterprises, data on the cultural and creative industries were collected. The degree of specialization of the regional cultural and creative industries was evaluated according to three aspects: the number of enterprises, the types of enterprises, and the distribution of enterprises. Additionally, the factors influencing industry agglomeration were explored in depth from six perspectives: access to funding, market entry, intellectual property, entrepreneurial training and skills, and access to innovation and collaboration [13].
In recent years, China’s cultural industry has shown a rapid growth trend. According to data from the China National Bureau of Statistics, the value added of the Chinese cultural and related industries reached CNY 4.5 trillion in 2020, accounting for 4.43% of the GDP, marking an increase of over 60% compared to 2015. In addition, the phenomenon of uneven regional development is significant. The eastern coastal regions, leveraging their economic foundation and policy advantages, have developed cultural and creative industry clusters in cities such as Beijing, Shanghai, and Guangzhou with a focus on digital content and film and television production. In contrast, the central and western regions are developing based on local cultural resources with cities like Chengdu concentrating on the animation and gaming industry, while Xi’an aims to revitalize existing resources through a “historical culture + tourism performance” model. There are also notable differences in urban hierarchy: first-tier cities concentrate 68% of the leading cultural enterprises in the nation, focusing on global capital operations, while second- and third-tier cities nurture local brands through the integration of “culture + manufacturing”, as exemplified by the Sanxingdui Cultural Industry Park in Deyang, Sichuan [14]. Chen Guiling measured the agglomeration level of the cultural and creative industries in Shanghai via modeling the industry concentration and the Herfindahl index. She established a univariate regression model comprising four dimensions—urban economic conditions, cultural environment, human resources, and R&D investment—to analyze the impact factors of cultural and creative design agglomeration in Shanghai [15]. Ma Renfeng employed the location entropy method to analyze the spatial pattern of the cultural and creative industries in Zhejiang Province and used principal component analysis and the OLS model to examine the impact factors affecting their agglomeration [16]. Li Jianjun analyzed the interaction mechanism between the cultural and creative industries and urban economic development via a literature review, coupling theory, and structural analysis methods [17]. Wang Yumei established an evaluation index system for the development of cultural and creative industry clusters using the dimensions of nature, culture, services, capital, technology, and intelligence, providing a reference for the quantitative evaluation of cultural and creative industry clusters [18].
In studying the spatial agglomeration characteristics of the cultural and creative industries, scholars have investigated the clustering evolution, formation characteristics, driving mechanisms, and socio-economic impacts of cultural and creative industry clusters at various scales, including nationally, regionally, and in major urban areas. Many studies have focused on cultural and creative industry clusters in developed countries and regions as well as in major cities in China such as Beijing [19], Shanghai [20], and Guangzhou [21]. Most scholars generally adopt a nationwide or large metropolitan area perspective with a lack of related research conducted on the micro-scale in different city regions. Additionally, the data often lack comprehensive applications of micro-scale and more refined big data technologies [22]. Although these studies provide valuable insights at a theoretical level, deficiencies in quantitative analysis and detailed research remain [23].
This study follows the logical framework of “feature identification–mechanism analysis–policy response” to construct a composite analytical framework based on social support, cultural regulation, and economic dominance. By analyzing factors influencing the spatial aggregation of cultural and creative enterprises within different industrial clustering areas, establishing an analytical paradigm of “micro-data–intelligent algorithms–spatial models–policy responses”. Furthermore, from the practical perspective of industrial development, it proposes a stratified management strategy based on spatial heterogeneity, providing a scientific basis for site optimization, facility support, and policy design for Harbin’s development as a “City of Creative Design”. Additionally, it offers references and insights into the cultural and creative industry planning of similar industrial cities.
2. Materials and Methods
2.1. Research Data
2.1.1. Data Sources
Using the enterprise big data platform “Tianyancha” (www.tianyancha.com, accessed on 14 January 2024), this study selected enterprise samples in Harbin from 2000 to 2020, accumulating information on 108,412 companies in the cultural and creative industries and other related facilities, including company names, industry classifications, registered capital, establishment dates, and business scopes. First, entries with abnormal registration years and invalid statuses (such as cancellation or revocation) were removed, and contradictory establishment year data were corrected through the manual verification of business registration information. Next, duplicate records were eliminated using unified social credit codes and fuzzy matching techniques, merging entities with similar names and overlapping registration information to ensure the uniqueness of each enterprise. To address classification discrepancies, labels were re-mapped using the standards of the “National Economic Industry Classification (GB/T 4754-2017)” [24] and keywords from the business scope texts. At the spatial data level, the study defines the research area based on the central urban area delineated in the Harbin Territorial Space Planning (2021–2035). The map of the research area uses the Gauss–Krüger projection with the coordinate system being CGCS2000. Based on the A Map API, the enterprise big data location information is matched through Python 3.12 programming. By performing coordinate transformations, accurately matching POIs data with the map of the research area is achieved, constructing a geographic information database. Additionally, the geographic registration of raster data such as GDP raster and population density is implemented to achieve spatial alignment. The above processing avoided double counting, spatial–temporal distortion, and classification confusion, ensuring the spatial interpretability and statistical robustness of the kernel density analysis and GWR model. Ultimately, 98,373 cultural and creative enterprises within the study area were compiled.
According to the National Economic Industry Classification (GB/T 4754-2017), the cultural and creative industries in this study encompass six major types: handicrafts, internet information services, advertising and exhibition, design services, publishing and media, and cultural and sports activities. In 2020, among the six types of cultural and creative industries in Harbin, the number of enterprises in the internet information services category was the highest with 56,680 enterprises, accounting for 57.62%. In contrast, the number of handicraft enterprises was the lowest at only 1238, representing just 1.26%. Additionally, there were 8504 enterprises in the advertising and exhibition category, accounting for 8.64%; 6635 enterprises in design services, accounting for 6.74%; 11,110 enterprises in publishing and media, accounting for 11.29%; and 14,206 enterprises in cultural and sports activities, accounting for 14.44% (Table 1).

Table 1.
Statistical table of cultural and creative industries by category in Harbin City.
Using 2020 cross-sectional data for analysis, we found all explanatory variable data to be temporally consistent with the dependent variable. POI (Point of Interest) data were scraped using the A Map API with a data collection date in December 2020. Population-scale data were sourced from the World Pop dataset, while GDP data were obtained from the Chinese GDP spatial distributed dataset provided by the Resource and Environmental Science Data Center of the Chinese Academy of Sciences. For indicators with a time span, the nearest neighbor temporal interpolation method was employed for temporal alignment. A geographic information database comprising three major categories and 20 explanatory indicators was constructed within the study area using ArcGIS Pro 3.1 software [25].
Considering the magnitude difference in the number of POIs, all continuous independent variables were standardized using z-score normalization. Categorical variables were encoded using dummy variables. The standardization formula is as follows:
where μ is the meaning of the variable and σ is the standard deviation. This processing can eliminate the influence of units, making the regression coefficients comparable.
2.1.2. Research Area
As one of the representative cities of China’s old industrial bases, Harbin has faced significant pressure in the development of traditional manufacturing industries. In this context, promoting high-quality local economic development through the development of the “fourth industry”, represented by the cultural and creative industries, has been a focal point of concern for local urban managers [26].
The Harbin Municipal Government proposed the “Creative Design Capital Development Plan” in 2022. The plan aims to promote industrial transformation and urban development through creative design, striving to develop Harbin into the creative design hub of the province and for its recognition as a “City of Design” in the UNESCO Creative Cities of Design network by 2025.
The research area includes seven districts: Daoli, Daowai, Nangang, Xiangfang, Pingfang, Songbei, and Hulan. The total area is 1126.40 square kilometers with a total population of approximately 6.95 million and a GDP of RMB 391.236 billion as of 2023 [27]. According to the Harbin Urban Land and Space Master Plan (2021–2035), the old city is defined as the historical areas of Daoli, Daowai, and Nangang, which was formed with the construction of the Central Asian Railway (1903). This area includes 34 national-level cultural heritage sites and 79% of the historical building stock. The new city refers to the Songbei New District, which began development in 2004, and the Hanan Industrial New City, which expanded in 2015, accommodating 83% of the newly added cultural facilities (Figure 1).
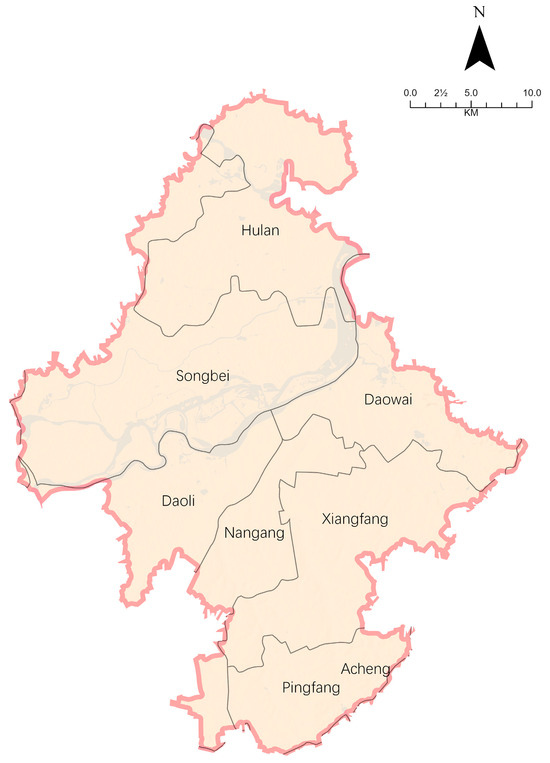
Figure 1.
Map of the research area.
2.1.3. Indicator System
To analyze the factors influencing the spatial agglomeration of the cultural and creative industries in Harbin, we referenced Scott’s three-dimensional “Cultural Production System–Local Embeddedness–Institutional Environment” model [28]. It is based on the theoretical framework of China’s “Three Spaces” (Production–Living–Ecological Space) [29] and the “implicit classification” observed in practical development [30] and also considers the classification standards for cultural and creative industries in European societies [31]. We selected 24 influencing indicators. After conducting multicollinearity testing, four factors—road network density, distance to green spaces, distance to water systems, and incubator density—were excluded to mitigate the effects of multicollinearity as their variance inflation factors (VIFs) exceeded 10. Ultimately, an influencing factor indicator system was established, consisting of 20 indicators across three dimensions: social influencing factors, cultural influencing factors, and economic influencing factors. Among these factors, the social impact factors include seven indicators such as population size and per capita GDP. The cultural impact factors encompass five indicators, including cultural heritage protection facilities and cultural sports facilities. The economic impact factors consist of eight indicators, including night-time economy facilities and accommodation.
In the process of constructing the indicator system, we developed a three-level classification framework based on the “service supply–demand matching” analysis logic of urban public service resource allocation. Through spatial normalization, the facility density indicator reveals the intensity of service supply per unit area of land. The per capita ownership indicator is based on population data to assess the matching degree from the demand side, reflecting the equity of resource allocation. It should be noted that mainly due to data availability constraints, some indicators do not have corresponding density or per capita metrics (Table 2).
Table 2.
Indicators of impact factors on the cultural and creative industries in Harbin City.
2.2. Research Methods
2.2.1. Research Process
This study constructed a micro-enterprise database for the cultural and creative industries of Harbin from 2000 to 2020 in addition to a geographic information database of the relevant socio-economic support systems. By comprehensively utilizing Global Moran’s I index and kernel density analysis, this study analyzes the spatial–temporal aggregation and evolution characteristics of the cultural and creative industries in Harbin over the past two decades. Subsequently, the DBSCAN algorithm is employed to identify and classify the cultural and creative industries in Harbin into 157 aggregation clusters. Based on a comparison of the statistical significance of OLS and GWR, a composite analytical framework is developed, focusing on social, cultural, and economic factors. The study also discusses the gradient effect of social support, bidirectional effects of cultural moderation, and spatial differentiation mechanism under economic dominance affecting the spatial agglomeration of the cultural and creative industries (Figure 2).
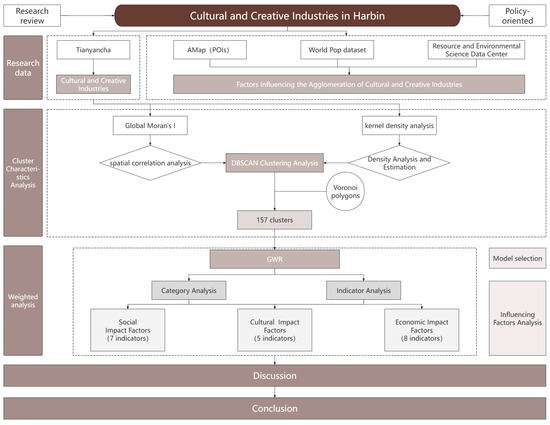
Figure 2.
Research flowchart.
2.2.2. Model Selection
This study, we construct a comparative framework that includes Ordinary Least Squares (OLS) and Geographically Weighted Regression (GWR) models to systematically address the complex, intertwined issues of multicollinearity and spatial heterogeneity in the spatial analysis of the cultural and creative industries. First, we use OLS as the baseline global model to reveal the inherent shortcomings of traditional regression with respect to collinearity and spatial dependence. The analysis shows that the factors impacting the agglomeration of cultural and creative industries exhibit significant spatial heterogeneity and lack a unified direction of influence, warranting further verification using other spatial econometric models.
To address this limitation, we further introduce Geographically Weighted Regression (GWR), the core advantage of which lies in its capacity for explicit spatial modeling. GWR constructs a geographical weighting matrix using a Gaussian kernel function, optimizing the bandwidth with the AICc criterion, which provides a strong collinearity resistance mechanism for local samples [32]. At the same time, GWR allows regression coefficients to dynamically vary with spatial location; for example, the regression coefficient for cultural and sports facilities reaches 31.25 in Nangang District, while it is only 2.45 in Pingfang District, accurately depicting the spatial differentiation of the impact factors. Based on the above analysis results, we will conduct a factor analysis of the cultural and creative industry clusters using GWR (Table 3).
Table 3.
AICc and R2 values of each regression model.
2.2.3. Kernel Density Estimation
Kernel Density Estimation (KDE) is a non-parametric method used to estimate the probability density function of data distribution; its theoretical basis is derived from Silverman’s bandwidth optimization criterion [33]. It aims to identify the distribution pattern of the data by smoothing it. KDE achieves smoothing and estimation by applying a kernel function at each data point. This method makes no assumptions about the form of data distribution, making it highly useful in many statistical analyses.
The key components of kernel density estimation are the kernel function and bandwidth. The kernel function K is a symmetric, non-negative function that determines the influence of each data point on the estimated point. Bandwidth is a smoothing parameter that controls the degree of smoothness of the estimate. The formula is
is the estimated density at point , n is the sample size, represents each data point in the dataset, is the bandwidth parameter, and is the kernel function.
Commonly used kernel functions include Gaussian, uniform, triangular, and Epanechnikov kernels. In data analysis, kernel density estimation provides an intuitive way to study the distribution pattern of data, especially when the form of the data distribution is unknown or irregular. It allows the potential distribution characteristics of the data to be displayed smoothly, thereby providing a foundation for further statistical analysis and pattern recognition.
Through kernel density analysis, we can identify areas with higher distribution densities in the cultural and creative industries, better understand the spatial distribution and agglomeration characteristics of the cultural and creative industries in Harbin, and explore their evolution patterns across multiple time and space dimensions.
2.2.4. Density-Based Spatial Clustering of Applications with Noise
DBSCAN (Density-Based Spatial Clustering of Applications with Noise) is a density-based clustering algorithm that aims to identify high-density areas within a dataset for clustering. The algorithm defines two types of points: core points and border points. A core point is a point that has at least points within its ϵ-radius, while a border point lies within the ϵ-neighborhood of a core point but has fewer than points in its own ϵ-neighborhood. Points that do not satisfy either of the two definitions above are called noise points. The formula is as follows:
In this formula, represents the -neighborhood of point . is the dataset, is the distance between point and point , and is the radius parameter.
Core point condition: If
then is considered a core point. In the formula, refers to the minimum number of points in the neighborhood.
The DBSCAN algorithm starts with an arbitrary point in the dataset. If the point is a core point, a new cluster is formed starting from that point, and all points within the ϵ-neighborhood of the core point are added to the new cluster. For newly added core points, the algorithm continues expanding their ϵ-neighborhood until no new core points are added. This process is repeated until all points are processed. At this point, the points are divided into multiple “clusters” with each cluster representing a group of points with higher density. Noise points are not included in these clusters. Points within the same cluster may share similar characteristics, while clusters may differ from each other.
In analyzing the distribution of the cultural and creative industries, DBSCAN offers several advantages. First, the distribution of the cultural and creative industries may have complex patterns, such as nonlinear or irregular shapes, which traditional classification methods find difficult to categorize scientifically. DBSCAN can identify clusters of arbitrary shapes, and the results are relatively scientifically rigorous. Second, some cultural and creative industries may exhibit non-agglomerative phenomena, which can interfere with classification. DBSCAN can effectively handle these noise points, reducing the impact of outliers on the analysis. Furthermore, DBSCAN only requires the setting of two parameters, ϵ and , making it relatively simple and easy to use in practical applications [34].
Through DBSCAN, we can effectively identify high-density areas in which cultural and creative industries cluster, segment the data into several datasets, and provide a clear spatial distribution pattern. This approach provides a foundation for analyzing the fine-grained aggregation and spatiotemporal evolution characteristics of the cultural and creative industries at the micro-scale [29].
2.2.5. GWR Geographic Weighted Regression Model
GWR (Geographically Weighted Regression) is a spatial regression analysis method that employs the locally weighted least squares method developed by Brunsdon et al. [35]. This model allows the parameters to vary with geographic location, effectively capturing spatial heterogeneity. Unlike traditional regression analysis, which assumes that model parameters remain constant across the entire domain, GWR provides local estimates of regression coefficients within geographic space. This approach better emphasizes the varying magnitudes of influence that different factors have in different regions [36,37], and it possesses a robust mechanism to combat multicollinearity [32]. The basic formula is
In this formula, is the dependent variable for the -th observation. is the position-related constant term regression coefficient for the -th observation. is the regression coefficient for the -th independent variable at the -th observation. is the value of the -th independent variable for the -th observation. is the error term for the -th observation. are the geographic coordinates of the -th observation.
GWR estimates the regression coefficients through weighted least squares with the weights adjusted based on geographic distance. Commonly used weighting functions include the Gaussian and the bi-logarithmic functions. In this study, the Gaussian function is used for weighting. The formula for the weighting function is as follows:
In this formula, is the weight of the -th observation on the -th observation. is the distance between the -th and -th observations, and is the bandwidth parameter.
First, the bandwidth parameter b is selected. This parameter determines the range of influence of the weight function, and an appropriate bandwidth can be chosen using methods such as cross-validation. Then, the weight for each observation with respect to other observations is calculated. For each observation, a local regression is performed under its respective weight to estimate the regression coefficients. Finally, by analyzing changes in the regression coefficients across the geographical space, the characteristics of different areas can be interpreted.
GWR enables the micro-scale analysis of how different built environments and impact factors affect the spatial clustering characteristics and spatiotemporal evolution processes of the cultural and creative industries. Since the characteristics of the industries within different clusters exhibit heterogeneity, GWR allows the regression coefficients to vary spatially, thereby describing the differences in the cultural and creative industries across various clusters and capturing the unique impact factors in each area. Additionally, the spatial variation in regression coefficients makes the model more flexible, allowing it to adapt to the complex spatial relationships found in real-world scenarios [38]. For example, certain areas may be more attractive to specific types of cultural and creative enterprises, while other areas may be more suitable for different types of businesses. The application of GWR in the analysis of the distribution of the cultural and creative industries can help identify spatial heterogeneity and areal characteristics, providing a deeper understanding of the distribution of the cultural and creative industries across different geographic areas and their impact factors.
3. Analysis Results
3.1. Growth Characteristics
Since 2000, the number of cultural and creative industries in Harbin has increased year by year with a growth trend resembling exponential growth. Among them, the internet information services industry has grown the most rapidly, increasing from 223 enterprises in 2000 to 56,625 in 2020: a 254-fold increase. The arts and crafts industry has grown the slowest, rising from 50 enterprises in 2000 to 1237 in 2020. Other cultural and creative industries have experienced more moderate growth (Figure 3).
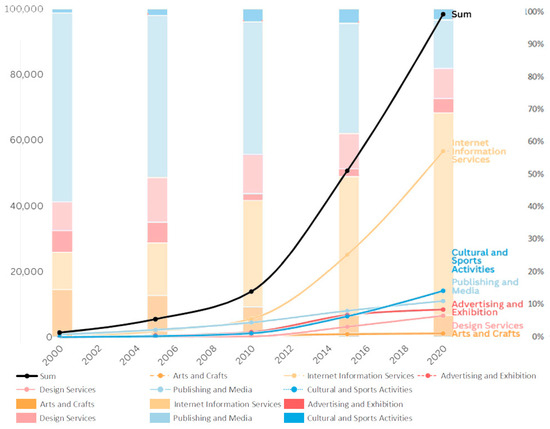
Figure 3.
Statistical growth and proportion change in cultural and creative industries in Harbin City.
The proportion of internet information services enterprises has been increasing year by year, rising from 14.97% in 2000 to 57.62% in 2020. In contrast, the proportion of publishing and media enterprises has been decreasing, falling from 62.13% in 2000 to 11.29% in 2020. The proportions of the other four categories have remained relatively stable. Specifically, design services and cultural and sports activities increased from 4.40% and 6.67% in 2000 to 6.74% and 14.44% in 2020, respectively. Meanwhile, arts and crafts and advertising and exhibition declined from 3.33% and 9.27% in 2000 to 1.26% and 8.64% in 2020, respectively (Figure 3).
3.2. Analysis of Agglomeration Characteristics
3.2.1. Kernel Density Analysis
To determine whether the cultural and creative industry in Harbin exhibits spatial agglomeration, we conducted a spatial correlation analysis of the dataset using the global Moran’s I index. Examining the Moran’s I values, the standardized value (z-score), and the significance level (p-value), we assessed the spatial agglomeration characteristics of Harbin’s cultural and creative industries (Table 4). Additionally, we used kernel density analysis to identify the spatial agglomeration patterns of this industry in Harbin.
Table 4.
Analysis of global Moran’s I values.
The results of the global Moran’s I index (Table 4) show that all cultural and creative industries have positive Moran’s I values, indicating the presence of agglomeration characteristics. The design service industry exhibits a strong agglomeration feature. In contrast, the low agglomeration of the publishing and media industry may stem from a decline in the demand for physical space due to digital transformation, reflecting the lagging transformation of traditional media in Harbin. The p-values for all types of cultural and creative industries show significant characteristics, suggesting that the cultural and creative industries in Harbin exhibit agglomeration.
Kernel density analysis shows that Nangang District has formed a dual-core agglomeration structure (Figure 4) with the primary core located in the Qiulin business area and the secondary core around the Haxi Wanda area. This is closely related to the status of the region as a historical commercial center and the sequence of development of newly established business areas. Additionally, the three major power roads in Xiangfang District exhibit a banded agglomeration distribution pattern, which corroborates the clustering effect of the transformation of industrial heritage from the “One Five” period on cultural and creative enterprises.
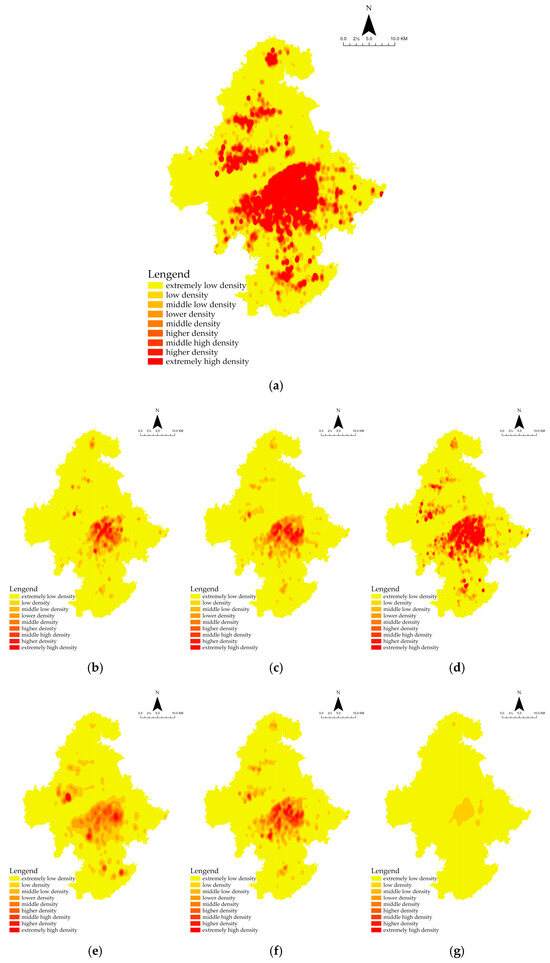
Figure 4.
Kernel density map of cultural and creative industries in Harbin. (a) Kernel density map of all cultural and creative industries. (b) Kernel density map of the publishing and media industry. (c) Kernel density map of the advertising and exhibition industry. (d) Kernel density map of the internet information services industry. (e) Kernel density map of the design services industry. (f) Kernel density map of the cultural and sports activities industry. (g) Kernel density map of the arts and crafts industry.
According to the kernel density analysis of 98,373 cultural and creative enterprises in the city for 2020 (Figure 4), the greatest agglomeration of cultural and creative industries is found in the Nangang, Xiangfang, and Daoli districts, which host 43.25%, 17.03%, and 15.22% of the enterprises, respectively. In contrast, the lowest agglomerations are observed in the Pingfang and Hulan districts, which hold only 1.76% and 4.07% of the enterprises, respectively (Figure 4a and Table 5).
Table 5.
Percentage of distribution of various types of cultural and creative industries in different districts.
In examining the six types of industries, Xiangfang District is found to have the highest agglomeration of internet information service enterprises, accounting for 48.23%. Daowai District has the highest agglomeration of arts and crafts enterprises with 29.85% of such enterprises. Nangang District hosts the most enterprises in the publishing and media, advertising and exhibition, design services, and cultural and sports industries with agglomerations of 43.71%, 38.74%, 45.05%, and 40.34%, respectively. The agglomeration of all six types of cultural and creative industries is the lowest in Pingfang District, where none exceed 2.00% (Figure 4b–g and Table 5).
3.2.2. DBSCAN Clustering Analysis
In this study, we use DBSCAN clustering analysis, combining references and multiple attempts [39,40], for which we selected a radius parameter of 200 m and a minimum neighborhood point count of 50. With these settings, the boundaries of the industrial zones were relatively clear, and the distribution range was more reasonable. The analysis identified a total of 157 areas with a high degree of agglomeration, dividing Harbin’s cultural and creative industries into 157 clusters, along with 14,508 noise points (Figure 5a). Subsequently, we used Voronoi polygons to delineate the boundaries of each cluster, forming clear boundary lines that facilitated subsequent analysis (Figure 5b).
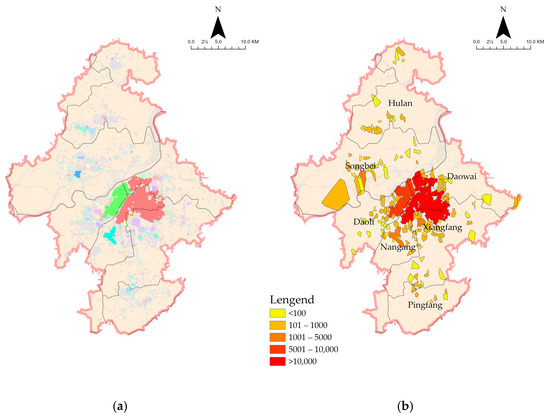
Figure 5.
DBSCAN clustering analysis. (a) DBSCAN clustering analysis result (points of the same color belong to the same cluster, and gray points are noise). (b) DBSCAN clustering analysis area division map.
Overall, the cultural and creative industry agglomeration areas formed in old urban areas such as Nangang District and Daoli District are characterized by many enterprises, extensive areas, and broad coverage. The old urban areas have developed two super-large-scale agglomeration areas. One agglomeration area covers 44.15 square kilometers and is home to 33,579 enterprises. The other agglomeration area spans 16.28 square kilometers and includes 8284 enterprises (Figure 5b).
In contrast, the new urban districts, such as Xiangfang District and Songbei District, as well as underdeveloped areas like Pingfang District, exhibit characteristics of smaller areas, scattered points, and small clusters. Qunli New District, located in the western part of Daoli District, is a newly developed urban area with a history of only 20 years, which initially formed a region containing 15 agglomeration areas. Songbei District, serving as the site of the national-level new area in Heilongjiang Province, has gradually developed one large agglomeration area with more than 2000 enterprises along with seven medium-sized agglomeration areas with more than 200 enterprises each and twenty-two small agglomeration areas with fewer than 200 enterprises. The development of the cultural and creative industries in Pingfang District is relatively lagging with the formation of one medium-sized agglomeration area with fewer than 2000 enterprises and four small agglomeration areas with fewer than 200 enterprises. In the newly developed regions, smaller, more scattered small agglomeration areas have emerged (Figure 5b).
3.3. Analysis of Impact Factors
3.3.1. OLS Analysis
We constructed an OLS model in GWR 4.0 software, yielding the analysis results (Table 6).
Table 6.
OLS coefficient statistics of innovation space.
Among the social impact factors, both public transportation convenience and new energy transportation infrastructure show a significant positive impact, demonstrating that accessibility plays a supportive role in the agglomeration of the cultural and creative industries. The density of public libraries exhibits a significant negative impact, which is possibly because its service radius covers the entire city, which weakens the proximity effect.
The overall impact of cultural impact factors is significant, with cultural and sports facilities and public art education facilities having relatively high regression coefficients, indicating that these physical cultural facilities can promote the formation of cultural creative clusters. Public information kiosks show a significant positive impact, proving that in the information age, the methods of public information dissemination still play an irreplaceable role in the agglomeration of the cultural and creative industries.
Economic impact factors exhibit the strongest explanatory power, with business office buildings having an exceptionally high regression coefficient, demonstrating the agglomeration effect of the business ecosystem in the CBD area on the cultural and creative industries. Night economic facilities show a significant negative impact, contrasting with findings from studies in southern cities, which is potentially due to the low-temperature environment leading to this difference. The positive impact of financial service facilities and dining service facilities indicates that the maturity of commercial supporting facilities plays a crucial role in the site selection of cultural and creative enterprises.
The regression results initially reveal the influence of the impact factors on the agglomeration of the cultural and creative industries. However, the traditional OLS model fails to account for the spatial heterogeneity of each factor, making it difficult to analyze the extent of the influence of each factor on the agglomeration of the cultural and creative industries. Therefore, a GWR approach is needed for a more detailed assessment.
3.3.2. Triple Impact Factor Comprehensive Analysis
We employ the GWR model to conduct local parameter estimation of the influencing factors of 20 indicators, revealing the spatial heterogeneity impact mechanisms of various factors on the agglomeration of the cultural and creative industries. The following sections systematically analyze the regression results from three dimensions, social, cultural, and economic, while also validating the rationality of the conclusions in conjunction with the characteristics of Harbin City and relevant domestic and international publications. We conducted a two-tailed t-distribution test. At a confidence level of α = 0.05, the degrees of freedom (df = 136) are calculated based on the sample size (n = 157) and the number of independent variables (k = 20), corresponding to a theoretical critical value of t ≈ 1.97. At a confidence level of α = 0.01, the corresponding theoretical critical value is t ≈ 2.62.
When the regression coefficient is greater than 1.97 or less than minus 1.97, it can be considered that there is a 95% probability of determining that the influence factor has a positive (negative) correlation with the cultural and creative industries, and when the regression coefficient is greater than 2.62 or less than minus 2.62, it can be considered that there is a 99% probability of determining that the influence factor has a positive (negative) correlation with the cultural and creative industries [41]. According to the size of the regression coefficient, we classify the size of the correlation between the influence factor and the cultural and creative industry agglomeration into six types as follows: absolute negative correlation (p ≤ −2.62), obvious negative correlation (−2.62 < p ≤ −1.97), probable negative correlation (−1.97 < p ≤ 0), probable positive correlation (0 < p ≤ 1.97), obvious positive correlation (1.97 ≤ p ≤ 2.62), and absolute positive correlation (2.62 ≤ p).
First, through performing GWR analysis on each indicator and calculating the arithmetic average of the regression coefficients for indicators within the same category, we obtain the correlation results between the three main dimensions of impact factors and the number of cultural and creative industries (Table 7).
Table 7.
Table of regression coefficients for three categories of impact factors.
The influence range of the social category influence factor is relatively small, the average regression coefficient is 1.578, and the positive correlation is not obvious for clusters that are smaller in size and farther away from the old city center (Figure 6a). The culture category has the widest influence with an average regression coefficient is 3.848. This indicates that the improvement of cultural facilities and information dissemination facilities is crucial for the clustering and development of cultural and creative industries (Figure 6b). The correlation of the economic category is also wide with an average regression coefficient of 2.691. Like the social category, the positive correlation shown for clusters which have a smaller area and are farther away from the old urban area is not obvious (Figure 6c). Overall, we find that the cultural and creative industries are affected by more impact factors, but there is spatial heterogeneity in the mechanism of various types of impact factors.
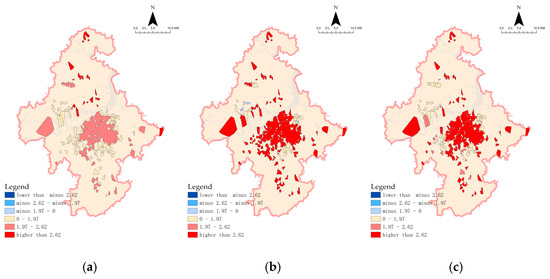
Figure 6.
GWR analysis of category impact factors. (a) Correlation GWR weight analysis map of social impact factors. (b) Correlation GWR weight analysis map of culture impact factors. (c) Correlation GWR weight analysis map of economic impact factors.
By observing the results of the analysis, we found that the percentage of correlation clusters of different classes of influence factors is different. The social, cultural and economic influence factor categories have a significant influence on 42.68%, 77.56%, and 63.06% of the clusters, respectively (Table 8).
Table 8.
Percentage of clusters of relevance for three broad categories of indicators.
3.3.3. 20 Impact Factor Regression Analysis
In the GWR analysis of 20 impact factors, each indicator has a unique regression coefficient in each cluster to illustrate its correlation with the dependent variable in that area, resulting in a total of 3140 regression coefficients (Table 9).
Table 9.
Comparison of indicators with regression coefficients.
The results show significant differences in the impact of various indicators on the development of the cultural and creative industries in Harbin. Among these, the popularity of new energy transportation infrastructure, cultural and sports facilities, entertainment service facilities, financial service facilities, convenience stores, business office buildings, and dining service facilities have statistically significant correlations with over 66.88% of the clusters in the study area, indicating that these seven indicators play a very important role in the overall agglomeration of the cultural and creative industries (Table 10).
Table 10.
Proportions of correlation clusters for indicators.
Additionally, the indicators of per capita GDP, public transportation accessibility, public information kiosks, public art education, night-time economy facilities, accommodation service facilities, and supermarkets show statistically significant correlations with 15.29% to 36.94% of the clusters. These factors significantly promote the agglomeration of the cultural and creative industries in specific areas, but their influence is not applicable to the entire study area (Table 10).
There are six indicators, including population size, public library density, parks and public art spaces, public safety facilities, cultural heritage protection facilities, and co-working spaces, that exhibit statistically significant correlations with less than 11.46% of the clusters. These indicators may not be the main impact factors in the agglomeration of Harbin’s cultural and creative industries, or their impact mechanisms may be more complex, requiring further in-depth analysis (Table 10).
- (1)
- Social impact factors
In terms of social impact factors, per capita GDP, the convenience of public transportation, and infrastructure for new energy transportation are significantly positively correlated with the agglomeration of the cultural and creative industries, exhibiting notable spatial heterogeneity, which is particularly reflected in the significant differences between the old and new urban areas. The distribution of population size, the density of public libraries, public art spaces in parks, and public safety facilities show no significant correlation with the agglomeration of the cultural and creative industries, and spatial heterogeneity is also not apparent.
The average regression coefficient for per capita GDP is 1.378. In the old urban area, there is a significant positive correlation between per capita GDP and the agglomeration of cultural industries, indicating that the cultural and creative industries in the old urban area tend to cluster in areas with higher economic development. The peak is observed in the South Gongqi Commercial Circle, where the output value of cultural enterprises per unit area far exceeds the citywide average of RMB 0.8 million per square meter. This supports Florida’s theory that “the creative class prefers high value-added areas” [6], but negative effects are observed in new urban areas such as the Pingfang Development District and Songbei District, indicating that traditional industrial areas have not yet completed the transition to a creative economy, leading to a disconnection between “GDP growth and industrial upgrading” (Figure 7a). The average regression coefficient for public transportation convenience is 1.541. This influencing indicator shows a strong correlation with the agglomeration of cultural and creative industries in the Daoli Qunli New District, where 22.3% of cultural and creative enterprises are located within 800 m of Subway Line 3 stations, confirming the attraction of “transit station economies” for startups (Figure 7b). The new energy transportation infrastructure shows a positive correlation with the number of cultural industries across the city with an average regression coefficient of 7.704. This is closely related to Harbin’s characteristics as a “cold region city”: the demand for the endurance of new energy vehicles in low-temperature environments drives a high-density infrastructure layout, while cultural and creative practitioners generally use electric vehicles for commuting, resulting in a supply–demand match. This reflects the collaborative development model of “low-carbon transportation + creative parks” in the planning of new districts (Figure 7c).
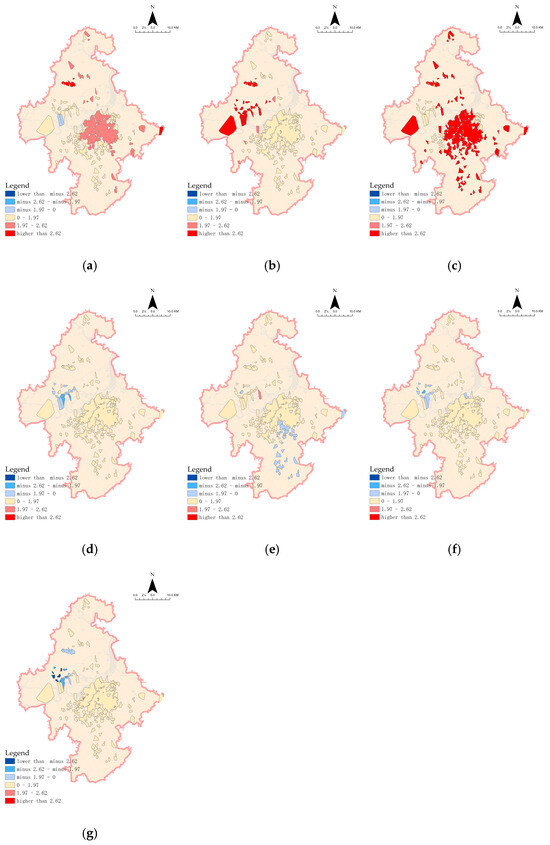
Figure 7.
GWR analysis on the social impact factors on the quantity of cultural and creative industries. (a) Per capita GDP. (b) Accessibility of public transport. (c) Popularity of new energy transportation infrastructure. (d) Population size. (e) Public library density. (f) Parks and public art spaces. (g) Public safety facilities.
By analyzing the impact of population size, we find that the correlation between population size and the agglomeration of cultural industries is small. The average regression coefficient is 0.517. Additionally, there are areas in Songbei District that exhibit a negative correlation. This may be due to the high cost of living in densely populated areas, which suppresses the agglomeration of the cultural and creative industries [42] (Figure 7d). The average regression coefficient for public library density is 0.007. This may be attributed to the fact that public libraries, as public service facilities, serve the entire district or city, allowing all areas within the city to benefit from this public service; therefore, the location choices of the cultural and creative industries do not seriously consider this factor (Figure 7e). The average regression coefficient for parks and public art spaces is −0.424. This may be because the core functions of parks and the cultural and creative industries differ. Parks primarily focus on providing natural environments, leisure spaces, and outdoor activities, emphasizing environmental sustainability, ecological protection, residents’ physical and mental health, and providing community recreational and social spaces. In contrast, the cultural and creative industries focus on the production and dissemination of cultural content, entertainment products, and creative design, requiring an environment that emphasizes the creation of economic value and cultural influence. This difference is specifically reflected in spatial utilization and industrial structure (Figure 7f). The average regression coefficient for public safety facilities is 0.320. This may be due to an overall good social security environment in which public safety facilities have not been a primary concern for practitioners, having received attention in only a few areas. In Songbei District, there may be a negative correlation between public safety facilities and the agglomeration of the cultural and creative industries due to the desire of practitioners for a diverse social atmosphere (Figure 7g).
Overall, in the old urban areas, the cultural and creative industries prefer to cluster in economically mature areas, while in the new urban areas, the agglomeration of cultural and creative industries is more influenced by public transportation facilities. Moreover, continuing to promote the proliferation of new energy transportation infrastructure may further facilitate the agglomeration and development of the cultural and creative industries across the city.
- (2)
- Cultural impact factors
In terms of cultural impact factors, cultural and sports facilities, public information kiosks, and public art education facilities are significantly positively correlated with the agglomeration of the cultural and creative industries in Harbin, exhibiting notable spatial heterogeneity, which is particularly reflected in the significant differences between different urban areas [43]. Conversely, the correlation between cultural heritage preservation facilities and co-working spaces with the agglomeration of cultural and creative industries is not significant, and spatial heterogeneity is also not apparent.
The average regression coefficient for cultural and sports facilities is 17.829. The distribution of cultural and sports facilities shows a very strong positive correlation with the agglomeration of the cultural and creative industries, especially in the cultural industry agglomeration zone of Nangang District. The β value around the Nangang Convention and Exhibition Center reaches as high as 31.254. Well-developed cultural and sports facilities provide a good environment and cultural atmosphere for the cultural and creative industries, while in turn, the development of these industries enhances the quality and quantity of the surrounding cultural and sports facilities [44] (Figure 8a). The average regression coefficient for public information kiosks is 0.755. This impact indicator shows a positive correlation in the old urban area but an absolute negative correlation in the new urban area of Songbei District. In areas like Daoli District, which contain both new and old urban areas, there is no obvious correlation. This may be because in the old urban area, public information kiosks are important places for exchanging business opportunities, where enterprises prefer to publish their commercial information. Practitioners in the cultural and creative industries find it easier to access business opportunities through these kiosks, resulting in greater reliance on them. In the new urban area, due to the smaller number of public information kiosks and the lack of rich commercial information compared to the old urban area, practitioners rely more on social media and internet platforms for information [42] (Figure 8b). According to research data from the Harbin New Area Management Committee, in 2023, 74.6% of enterprises in the new area use government service apps to obtain policy information, highlighting the differentiation in facility effectiveness caused by the digital divide. The average regression coefficient for public art education facilities is 1.548. This impact indicator shows a significant positive correlation in the cultural and creative industry agglomeration zones in the city center but no evident correlation in the peripheral areas of the city. This may be due to the greater awareness of public art education established in the old urban area, where practitioners value and recognize public art education facilities more [45]. According to data from the Municipal Bureau of Culture and Tourism, residents of Harbin’s central urban area participate in art training an average of 1.82 times per year, which is 75% higher than in the peripheral urban areas, confirming the positive feedback mechanism of “art literacy–industrial demand” (Figure 8c).
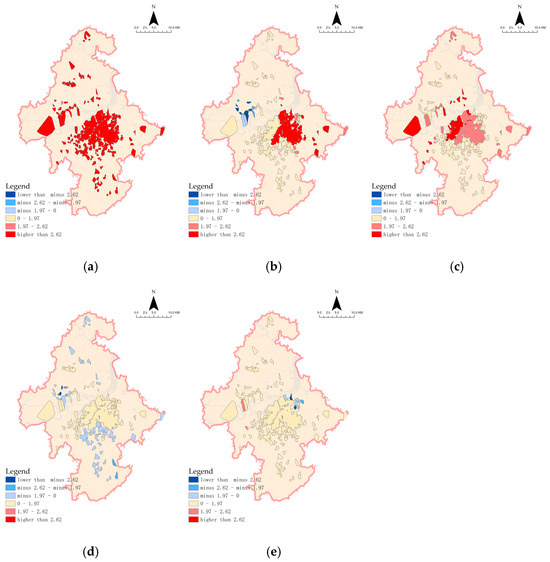
Figure 8.
GWR analysis of cultural factors impacting the quantity of cultural and creative industries. (a) Cultural and sports facilities. (b) Public information kiosks. (c) Public art education facilities. (d) Co-working spaces. (e) Cultural heritage protection facilities.
The average regression coefficient for cultural heritage preservation facilities is 0.023. The cultural heritage preservation facilities in Harbin are like public libraries; they have a broad service range and a minimal impact on the agglomeration of cultural and creative industries (Figure 8d). The average regression coefficient for co-working spaces is −0.916. Our analysis indicates that the current development scale of co-working spaces in Harbin is relatively small, and rental prices are generally high, resulting in a failure to influence on an industrial scale. Therefore, co-working spaces do not have a significant correlation with the agglomeration of cultural and creative industries (Figure 8e).
- (3)
- Economic impact factors
Economic impact factors are the most influential category affecting the agglomeration of the cultural and creative industries in Harbin. Entertainment, financial services, convenience stores, business office buildings, and dining service facilities show significant positive correlations with the agglomeration of cultural and creative industries in 67.52%, 70.06%, 66.88%, 76.43%, and 79.62% of clusters, respectively. Accommodation services and large supermarkets exhibit significant positive correlations with the agglomeration of creative industries in 36.94% and 32.48% of clusters, respectively, while night-time economic facilities show a significant negative correlation with the agglomeration of cultural and creative industries in 15.29% of cases.
The average regression coefficient for accommodation services is 1.841. The average regression coefficient for large supermarkets is 0.700. Both impact indicators exhibit a clear positive correlation with the agglomeration of cultural and creative industries in central urban areas, while there is no significant correlation in remote urban areas. This may be because there are fewer business cooperation opportunities between the cultural and creative industries and these facilities in remote areas, leading to a lower correlation. Additionally, the high land prices around accommodation services and large supermarkets may inhibit the agglomeration of cultural and creative industries [46] (Figure 9a,b).
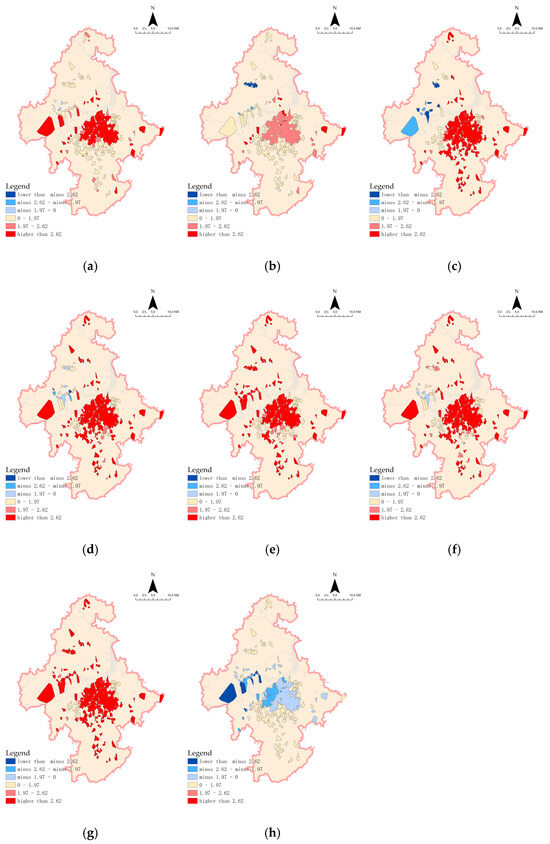
Figure 9.
GWR analysis of the economic factors impacting the quantity of cultural and creative industries. (a) Accommodation service facilities. (b) Supermarkets. (c) Business office buildings. (d) Entertainment service facilities. (e) Financial service facilities. (f) Convenience stores. (g) Dining service facilities. (h) Night-time economic facilities.
The average regression coefficient for business office buildings is 3.058. Their distribution shows a positive correlation with the agglomeration of cultural and creative industries in the old urban area while showing a negative correlation in the new urban area. The old urban area attracts cultural and creative enterprises to pay high rents for external benefits due to its central location, mature cultural facilities (such as theaters and galleries), and historically established creative community. In contrast, the new urban area struggles to attract cultural and creative enterprises due to a lack of cultural amenities, isolated industrial chains, and homogeneous commercial buildings, which fail to offset high costs, leading to difficulties in clustering such enterprises [47] (Figure 9c).
The average regression coefficient for entertainment service facilities is 3.086. The average regression coefficient for financial service facilities is 4.531. The average regression coefficient for convenience stores is 3.590. These impact indicators show a clear positive correlation with the agglomeration of cultural and creative industries across almost all clusters in the city, and their regression factors are generally high. This indicates that these impact factors are important references for the agglomeration of cultural and creative industries under various conditions. Additionally, the agglomeration of cultural and creative industries contributes to the development of nearby entertainment service facilities, financial service facilities and convenience stores. From the analysis of these impact factors, it can be seen that the cultural and creative industries tend to cluster in areas with high economic activity [48] (Figure 9d–f).
The average regression coefficient for dining service facilities is 5.606. Spatial matching analysis shows that on average, there are 8.3 dining establishments within 500 m of cultural enterprises with cafes accounting for 41.2% of the total. This confirms the supportive role of dining services in fostering creative exchanges. However, attention should be paid to optimizing the business structure—on Xuefu Road in Nangang, an excessive concentration of fast-food outlets has led to a loss of functionality for business negotiations (Figure 9g).
The average regression coefficient for the night-time economy is −0.883. In the new urban area, there is an absolute negative correlation with the agglomeration of cultural and creative industries. Contrary to the conclusions of Shang et al. regarding southern cities [49], the analysis of the “Night-time Economy Vitality Index of Chinese Cities” indicates that Harbin experiences an average of 156 days per year with night-time temperatures ≤ 5 °C. The low temperatures result in the outdoor night market in Songbei having a reduced average operating time of only 3–4 h in winter (compared to an average of 6.1 h in southern cities). The inefficient operation of night-time facilities in a low-temperature environment, in turn, encroaches upon the spatial resources of cultural enterprises (Figure 9h).
3.3.4. Summary of Results
This study reveals the multidimensional influencing factors of the spatial agglomeration of the cultural and creative industries of Harbin through GWR analysis. The results indicate that the economic, cultural, and social categories all exhibit significant spatial heterogeneity effects, and there are differentiated pathways of influence between the new and old urban areas. The main conclusions can be summarized in the following three aspects:
- (1)
- Gradient effect of social support
The influence of social category exhibits a “center–periphery” gradient characteristic. The old urban area is more driven by economic maturity indicators such as per capita GDP, while the new urban area significantly relies on the public transportation convenience and new energy transportation infrastructure. This spatial differentiation reveals the locational logic of the industry lifecycle: mature enterprises prefer the resource-intensive economic core, while startup companies pay more attention to the accessibility and operational costs in the new urban area. It is noteworthy that population density only shows a weak positive correlation in 11.46% of the clusters, indicating that Harbin’s cultural and creative industries have not yet formed a significant scale effect in terms of population, which may be constrained by insufficient talent structure compatibility.
- (2)
- Bidirectional effects of cultural moderation
Cultural category ranks second in overall influence; however, different impact indicators exhibit a “scale paradox”. Large cultural facilities (such as cultural heritage protection facilities and public libraries) have a service radius that covers the entire area, resulting in a weak proximity effect on agglomeration. In contrast, smaller cultural and sports facilities, as well as public art education facilities, demonstrate a strong localization effect, especially in old urban areas, where they form a symbiotic relationship between “cultural facilities and creative production”. Spatial heterogeneity analysis shows that public information kiosks are positively correlated in the old urban area, while exhibiting a negative correlation in the Songbei New District, reflecting the spatial substitution effects of traditional information carriers and digital platforms at different stages of development.
- (3)
- Spatial differentiation mechanism under economic dominance
Economic category has a significant impact on agglomeration across the entire area, but the direction and intensity of their effects exhibit a layered differentiation. The agglomeration in central urban areas (e.g., Nangang and Daoli) is primarily driven by indicators such as business office buildings, dining services facilities, and financial service facilities, confirming the agglomeration effect of a mature commercial ecosystem on cultural and creative enterprises. Notably, night economy facilities show a significant negative correlation in the new urban district, contrasting with traditional perceptions. This may stem from Harbin being a cold region city, where night-time economic activity is relatively low, and cultural and creative enterprises in the new district tend to adopt a “daytime creation + online operation” model, which has no obvious connection to the night-time economy (Table 11).
Table 11.
Spatial heterogeneity characteristics and typical regions.
4. Discussion
According to the results of the GWR analysis, the economic and cultural impact factors have a significant correlation with the clustering of the cultural and creative industries. The economic impact factors, except for night-time economic facilities, are strongly positively correlated with the cultural and creative industries. Among the cultural impact factors, the impacts of cultural and sports facilities, public information kiosks and cultural and art education facilities show a significant positive correlation. In the social category, GDP per capita, public transportation accessibility, and new energy transportation infrastructure have a particularly significant impact on the concentration of the cultural and creative industries in new urban areas [43].
4.1. Characteristics of Cultural and Creative Industry Agglomeration in Harbin
4.1.1. Differences in the Social Impact Factors on Old and New Urban Areas
There are significant spatial differences in the impact factors and mechanisms of impact between the new and old urban areas. In the new urban areas, there is a significant positive correlation between the social influence factors guided by policies, especially in transportation facilities, such as public transportation facilities and new energy infrastructure. On the other hand, in the old urban areas, economic and cultural influences have a high positive correlation with the clustering of the cultural and creative industries, with significant positive correlations for indicators such as public information kiosks, supermarkets, and convenience stores.
New urban areas, which have relatively low land prices, provide greater flexibility of location choice in the cultural and creative industries and usually prioritize areas with more robust social impact factors. Comparatively speaking, the construction level of social impact factors in old urban areas is generally higher, and city center locations are often accompanied by high rents, so in the site selection process, practitioners in the cultural and creative industries pay more attention to the cost of rent, access to information, and business opportunities rather than the impact of social cultural factors [44].
In the new urban area, the cultural and creative industries largely rely on social media and internet platforms to obtain relevant information, resulting in less attention paid to cultural facilities such as public information kiosks. In contrast, in the old urban area, cultural influence factors can provide cutting-edge business information for the cultural and creative industries, while economic influence factors offer diverse business opportunities. As a result, cultural and creative enterprises are more inclined to cluster near these facilities to gain a competitive advantage.
Coll-Martínez and Méndez-Ortega proposed that the co-working space has a strong correlation with the clustering of cultural and creative industries, identifying the location patterns of co-working spaces in Barcelona [12]. In this study, no significant correlation between shared office space and cultural and creative industry agglomeration was found. It is possible that the number of co-working spaces and their popularity vary in different countries and cities, and these factors affect the degree of correlation between this influence factor and cultural and creative industry agglomeration.
4.1.2. The Scale Paradox of Cultural Factors
The relevance of cultural facilities of different sizes to the agglomeration of the cultural and creative industries varies. Large-scale cultural facilities (e.g., cultural heritage, parks, etc.), despite their high cultural value and public service functions, usually service the entire city, so nearby cultural and creative industries do not have the advantage of more significant cultural and educational services. Although large cultural facilities can provide convenient cultural and educational services to the surrounding cultural and creative industries, their relative advantages are offset by factors such as the high cost of renting near large cultural facilities [50].
The relevance of small-scale cultural facilities (e.g., cultural and educational facilities) varies greatly between city center areas and urban fringe areas. Cultural and creative industry practitioners in city center areas are more receptive to cultural communication facilities (e.g., art schools) and are willing to invest time and money in in-depth study. In contrast, in urban fringe areas, the quantity and quality of cultural and educational facilities are lower and have not yet been systematically supported, resulting in less acceptance of these facilities by the cultural and creative industries [51].
He analyzed the cultural and creative industries in Chengdu City and concluded that cultural impact factors are the core factor influencing the agglomeration of the cultural and creative industries [52]. However, in this study, culture-based influence factors are not always significantly correlated with cultural and creative industry agglomeration. This may be because cultural impact factors exist in different forms in different cities, and the scale and number of cultural impact factors and the degree of recognition of residents all have an impact on the degree of correlation between cultural impact factors and cultural and creative industry agglomeration.
4.1.3. The Layered Effect of Economic Factors
There is a positive correlation between economic impact factors on the clustering of cultural and creative industries. In city center areas in particular, these impact factors not only provide quality services for cultural and creative industries but also provide the support and market resources needed for the daily operation of the cultural and creative industries and create good business opportunities. However, in some urban fringe areas, cultural and creative enterprises are less sensitive to economic facilities, which is mainly because these areas are more focused on low-rent and low-cost operations. For cultural and creative enterprises in urban fringe areas, controlling rental costs is prioritized over obtaining business opportunities, so they choose areas with lower rents and costs for their layouts. Despite the fact that there are fewer economic facilities in these places, enterprises can reduce their operating costs through internet e-commerce and other means to maintain their sustainable development.
In the small cultural and creative industry clusters located in the urban fringe areas, economic types of impact factors such as large supermarkets show an obvious negative correlation. Most of the cultural and creative enterprises located in the urban fringe areas of the city are in the initial stage and are mainly small studios, which struggle to afford large costs. Cultural and creative enterprises tend to choose areas with good services and abundant business opportunities, but these economic influences may drive up rent, thus reducing the possibility of cultural and creative enterprises choosing the location [53,54]. Therefore, it shows a negative correlation with economic types of impact factors such as supermarkets.
Shang et al. studied the “night scene cluster” in 243 cities in China and concluded that the night-time economy can promote the clustering of local cultural and creative industries [49]. However, in this study, the impact factor of the night-time economy does not show an obvious correlation with the clustering of cultural and creative enterprises. This may be because Shang and his team mostly focused on warm-climate areas, while the research scope of this study is Harbin, which is in a cold region. In Harbin, night-time economic vitality is low and thus fails to have an impact on cultural and creative industry agglomeration.
4.2. Spatial Agglomeration Driving Mechanism
4.2.1. Dependence of Industrial Heritage
Harbin relies on industrial buildings constructed during the early years of the founding of the country, which provide low-cost renovation spaces for the cultural and creative industries. The high ceilings and large spans of these industrial buildings offer cost-effective transformation opportunities for design service enterprises, making the occupancy costs lower than those of newly constructed office buildings. At the same time, the “industrial aesthetic” historical buildings in older districts such as Daoli and Nangang reinforce the identity of creativity. Most of the companies interviewed believe that “the background of industrial heritage helps enhance brand cultural premium”. This reveals Harbin’s unique “dual locking effect” regarding the integration of the industrial heritage value of physical spaces with cultural and creative value.
4.2.2. Constraints of Cold Climate Effects
The negative correlation of night-time economic facilities in the new urban area reveals the rigid constraints of climate conditions. Unlike the conclusions drawn by Shang et al., who examined warmer regions [49], the extreme low temperatures in Harbin, averaging minus 19 °C, significantly suppress outdoor cultural activities at night. The climatic limitations mean that cultural and creative enterprises that do not require outdoor operations account for the majority of Harbin’s cultural and creative sector (with internet information services comprising 57.62%). The strong positive correlation with new energy transportation facilities, such as charging stations, reflects the unique demand for travel in cold regions, indicating a strong dependence of enterprises on reliable commuting in low-temperature environments. All these factors suggest that the cultural and creative industries in cold cities like Harbin exhibit a distinct “cold-adaptive clustering” model.
4.2.3. Spatial Response of Policy
The implementation of Harbin’s “Creative Design Capital Plan” demonstrates a differential policy response between the “center and periphery”. In the old urban districts, such as Daoli and Nangang, which leverage existing cultural resources, policies are more focused on “stock optimization”, reflecting a certain inertia in policy implementation in these areas. In contrast, the leapfrog development of the 23 emerging clusters in the Songbei New Area validates Potts’ policy-driven theory [10]. However, characteristics of “policy discounting” are exhibited in which enterprises are more concerned with the long-term land incentives outlined in the “Creative Design Capital Plan” rather than short-term subsidies. This stands in contrast to the immediate policy response models seen in cities like Shanghai, reflecting a unique risk-averse tendency during the transformation of old industrial bases.
4.3. Supplement to Existing Research
4.3.1. Verification and Supplementation of the Creative Class Theory
Although this study verifies the core role of economic factors, it finds that the “creative class” exhibits spatial stratification. Practitioners in the old city conform to the “cultural mixing” characteristics described by Florida [6] with a high degree of overlap between their work and living spaces. In contrast, practitioners in Songbei New District have significantly longer commuting distances, and their lifestyles are more aligned with Scott’s characteristics of “cultural producers”, indicating the geographical boundaries of theoretical applicability [28]. This spatial stratification suggests that the applicability of Florida’s theory is constrained by the stage of urban development, exhibiting a “fragmented” nature in industrial cities undergoing a transformation period.
4.3.2. Differentiated Verification of the Policy-Driven Model
This study validates Lazzeretti’s “metropolitan core agglomeration” theory [55], but Harbin demonstrates local variations: a “policy-driven secondary center” has been identified. Through the implementation of the national-level New District policy, Songbei New District has cultivated 15.2% of the city’s enterprises, forming a “core–secondary center” structure. The policy dependence of cultural and creative enterprises in Songbei New District is approximately 18%, whereas similar enterprises in Europe generally have a policy dependence rate of less than 10%. Meanwhile, the five-year survival rate of cultural and creative enterprises in Songbei New District is only 58%, falling short of the over 70% survival rate in Barcelona. This suggests that while government-led secondary centers can rapidly overcome the speed limitations of natural market evolution, they exhibit greater policy vulnerability. This government-driven leapfrog development model is distinct from the multi-center models that emerge spontaneously in European countries.
4.3.3. Supplement to the Pathways of Urban Industrial Transformation
Compared to cities like Beijing and Shanghai, Harbin exhibits a unique “industrial culture +” agglomeration logic. In contrast to Beijing, where the 798 Art District relies on international capital [19], Harbin’s old town agglomeration depends on local industrial heritage. In comparison to Shanghai, where the cultural and creative industries are driven by financial capital, the impact of entertainment facilities on the cultural and creative industries is significantly higher than in Harbin [15]. Harbin demonstrates a distinctive path driven by a “policy–heritage” dual mechanism. It shows an “innovation within the system” approach—creative parks that have transformed from former state-owned factories host most of the design service enterprises in the old town, reflecting a transformation path that is representative of leveraging industrial heritage.
5. Conclusions
As a typical industrial city, Harbin faces numerous challenges relating to the transformation and upgrading of its industrial structure. In this context, the spatial agglomeration and high-quality development of its cultural and creative industries can inject new vitality into urban development [56,57]. In this study, we employed DBSCAN clustering analysis and kernel density analysis to examine the agglomeration characteristics and spatiotemporal evolution of Harbin’s cultural and creative industries in both new and old urban areas. We explored the factors influencing the agglomeration of the cultural and creative industries in Harbin from three perspectives—namely, social support, cultural regulation, and economic dominance—reaching the conclusions detailed below.
(1) The cultural and creative industries in the new urban area are more reliant on policy guidance and transport convenience, whereas the old urban area benefits from improved economic infrastructure. First, economic impact factors have the greatest impact on the agglomeration of the cultural and creative enterprises, particularly commercial opportunities, financial service facilities, and entertainment service facilities, which play a significant role in promoting industrial development. However, some economic facilities may increase business costs, inhibiting agglomeration [53,54]. Night-time economic factors exhibit a negative correlation, and the influence of shared office spaces is weak, which is possibly due to differences in the entrepreneurial ecosystem of cold-region cities.
Secondly, although cultural factors have a significant impact in the old urban area, their overall effect on the agglomeration of the cultural and creative industries is relatively weak, reflecting the inadequacy of Harbin’s cultural facility layout [58].
Finally, social factors play varying roles in different urban areas. In the old urban area, there is a positive correlation with per capita GDP, while the new urban area relies more on the convenience of public transportation. This reveals the importance of socio-economic development in the spatial layout of the cultural and creative industries.
(2) Based on the characteristics of spatial heterogeneity, we propose a three-level policy implementation strategy. First, in the core agglomeration area, the “Creative Ecological Circle” plan will be implemented, focusing on enhancing the accessibility of cultural and sports facilities (with a coverage rate of ≥85% within 500 m) and the density of financial service outlets (≥15 per square kilometer). Second, in the emerging agglomeration area, a “Transportation–Industry” coupled development approach will be adopted to ensure that new energy charging stations are developed in conjunction with subway stations (with an 800 m service radius). Finally, in the potential cultivation area, a pilot program for “Low-Cost Creative Communities” will be initiated, providing creative spaces at 30% below market rates through the renovation of existing industrial buildings, along with the establishment of digital information kiosks (≥2 per community), in order to break down information barriers and enhance the agglomeration of the cultural and creative industries.
This study has certain limitations. For instance, analyzing the spatiotemporal evolution and agglomeration characteristics of the cultural industry over a longer time scale requires further research. Future studies should incorporate more diverse impact factors and variables related to social, economic, cultural, and ecological dimensions to provide a more precise reference for urban planning policy formulation and industrial development planning [59].
Author Contributions
Conceptualization: Zuhang Liu and Daming Xu; methodology: Zuhang Liu and Daming Xu; software: Zuhang Liu; validation: Zuhang Liu, Daming Xu and Xinyang Wang; formal analysis: Zuhang Liu; investigation: Zuhang Liu; resources: Zuhang Liu; data curation: Zuhang Liu; writing—original draft preparation: Zuhang Liu; writing—review and editing: Zuhang Liu, Daming Xu and Xinyang Wang; visualization: Zuhang Liu; supervision: Daming Xu; project administration: Zuhang Liu and Daming Xu; funding acquisition: Zuhang Liu and Daming Xu. All authors have read and agreed to the published version of the manuscript.
Funding
This research was supported by “Specific subjects on the construction of Innovation and Entrepreneurship Ecosphere around the university, compound and institute in Harbin (No. 2022STQZXKT01)” and the HeiLongiiang Association of Higher Education, “Research on the construction path of Innovation and Entrepreneurship Ecosphere around the university, compound and institute in Heilongjiang province (No. 23GJZD001)”.
Data Availability Statement
The corresponding author will provide the data supporting the findings of this study upon reasonable request.
Conflicts of Interest
The authors declare no conflicts of interest.
References
- Boal-San Miguel, I.; Herrero-Prieto, L.C. A Spatial–Temporal Analysis of Cultural and Creative Industries with Micro-Geographic Disaggregation. Sustainability 2020, 12, 6376. [Google Scholar] [CrossRef]
- Shafi, A.A.; Sirayi, M.; Abisuga-Oyekunle, O.A. Issues, Challenges and Contributions of Cultural and Creative Industries (CCIs) in South African Economy. Creat. Ind. J. 2020, 13, 259–275. [Google Scholar] [CrossRef]
- Belfiore, E. Whose Cultural Value? Representation, Power and Creative Industries. Int. J. Cult. Policy 2020, 26, 383–397. [Google Scholar] [CrossRef]
- Simon, R. The Creative Industries: Definitions, Quantification and Practice; Cultural Industries: The British Experience in International Perspective; Humboldt University Berlin: Berlin, Germany, 2006; ISBN 978-3-86004-203-8. [Google Scholar]
- Derek, W. The Culture Industry: The Arts in Urban Regeneration; Avebury: Marlborough, UK, 1992. [Google Scholar]
- Florida, R. Cities and the Creative Class. City Community 2003, 2, 3–19. [Google Scholar] [CrossRef]
- Lazzeretti, L.; Capone, F.; Boix, R. Reasons for Clustering of Creative Industries in Italy and Spain. Eur. Plan. Stud. 2012, 20, 1243–1262. [Google Scholar] [CrossRef]
- Creative Industries and Innovation in Europe: Concepts, Measures and Comparative Case Studies; Lazzeretti, L., Ed.; Routledge: London, UK; New York, NY, USA, 2013; ISBN 978-0-415-67740-0. [Google Scholar]
- de-Miguel-Molina, B.; Hervas-Oliver, J.-L.; Boix, R.; De-Miguel-Molina, M. The Importance of Creative Industry Agglomerations in Explaining the Wealth of European Regions. Eur. Plan. Stud. 2012, 20, 1263–1280. [Google Scholar] [CrossRef]
- Potts, J.; Cunningham, S. Four Models of the Creative Industries. Int. J. Cult. Policy 2008, 14, 233–247. [Google Scholar] [CrossRef]
- Lazzeretti, L.; Boix, R.; Capone, F. Do Creative Industries Cluster? Mapping Creative Local Production Systems in Italy and Spain. Ind. Innov. 2008, 15, 549–567. [Google Scholar] [CrossRef]
- Coll-Martínez, E.; Méndez-Ortega, C. Agglomeration and Coagglomeration of Co-Working Spaces and Creative Industries in the City. Eur. Plan. Stud. 2023, 31, 445–466. [Google Scholar] [CrossRef]
- Imperiale, F.; Fasiello, R.; Adamo, S. Sustainability Determinants of Cultural and Creative Industries in Peripheral Areas. J. Risk Financ. Manag. 2021, 14, 438. [Google Scholar] [CrossRef]
- Shan, S. Chinese Cultural Policy and the Cultural Industries. City Cult. Soc. 2014, 5, 115–121. [Google Scholar] [CrossRef]
- Chen, G.; Zhao, Q. Agglomeration Effect of Cultural and Creative Industries for Shanghai. Doctoral Dissertation, Beijing Institute of Fashion Technology, Shenzhen, China, 23 January 2013. [Google Scholar]
- Ma, R. Location Model of Cultural & Creative Industry and Its Application in Zhejiang. Geogr. Res. 2018, 12, 379–390. [Google Scholar] [CrossRef]
- Li, J.; Wan, C. The Research on Interactive Operation Mechanism between Cultural Creative Industry and Urban Economic Development. Shanghai J. Econ. 2018, 1, 44–52. [Google Scholar] [CrossRef]
- Wang, Y.; Liu, S.; Wu, Y. Culture Creative Industry Cluster Development Evaluation Index System Construction. In Proceedings of the 2013 Conference on Education Technology and Management Science (ICETMS 2013), Nanjing, China, 8–9 June 2013. [Google Scholar]
- Li, X. The Research of Gathering Area Spatial Distribution Characteristics and Its Impact Factors of Cultural and Creative Industries in Beijing. Master’s Thesis, Central South University, Changsha, China, 2014. [Google Scholar]
- Luan, F.; He, Y.; Zhang, Y. Spatial Agglomeration Characteristics of Cultural and Creative Industries and Park Layout Planning Strategies--Analysis of Enterprise Location Selection Based on Shanghai Central District. Urban Plan. Forum 2019, 1, 40–49. [Google Scholar] [CrossRef]
- Fang, Y.; Zeng, Q.; Tang, Y.; Mao, Y. The spatial disparities of agglomeration of creative class and determinates in guangdong province. Hum. Geogr. 2016, 31, 58–65. [Google Scholar] [CrossRef]
- Sebova, M. Creative Industries and European Capital of Culture; TUKE: Kosice, Slovakia, 2015; pp. 805–815. [Google Scholar]
- Feng, M.; Li, Y. Study on the Development Characteristics and Spatial Impact of Creative Industry Parks in Nanjing City; Urban Planning Society of China: Beijing, China, 2014; p. 9. [Google Scholar]
- GB/T 4754-2017; National Economic Industry Classification. China National Standardization Administration: Beijing, China, 2017. Available online: http://www.heyuan.gov.cn/attachment/0/32/32862/460736.pdf (accessed on 27 January 2024).
- Xu, X. China GDP Spatial Distribution Kilometre Grid Dataset. Resource and Environmental Science Data Registration and Publishing System. 2017. Available online: https://www.resdc.cn/DOI/doi.aspx?DOIid=33 (accessed on 27 January 2024).
- Li, S.; Zhou, C.; Wang, S.; Gao, S.; Liu, Z. Spatial Heterogeneity in the Determinants of Urban Form: An Analysis of Chinese Cities with a GWR Approach. Sustainability 2019, 11, 479. [Google Scholar] [CrossRef]
- Bulletin of Main Data from the Seventh National Population Census of Harbin City. 2020. Available online: https://www.harbin.gov.cn/haerbin/c104569/202105/c01_70396.shtml (accessed on 27 January 2024).
- Scott, A.J. Creative Cities: Conceptual Issues and Policy Questions. J. Urban Aff. 2006, 28, 1–17. [Google Scholar] [CrossRef]
- Tu, X.; Fu, C.; Huang, A.; Chen, H.; Ding, X. DBSCAN Spatial Clustering Analysis of Urban “Production–Living–Ecological” Space Based on POI Data: A Case Study of Central Urban Wuhan, China. Int. J. Environ. Res. Public Health 2022, 19, 5153. [Google Scholar] [CrossRef]
- White, A.; Xu, S. A Critique of China’s Cultural Policy and the Development of Its Cultural and Creative Industries: The Case of Shanghai. Cult. Trends 2012, 21, 249–257. [Google Scholar] [CrossRef]
- Cooke, P.; De Propris, L. A Policy Agenda for EU Smart Growth: The Role of Creative and Cultural Industries. Policy Stud. 2011, 32, 365–375. [Google Scholar] [CrossRef]
- Fotheringham, A.S.; Oshan, T.M. Geographically Weighted Regression and Multicollinearity: Dispelling the Myth. J. Geogr. Syst. 2016, 18, 303–329. [Google Scholar] [CrossRef]
- Silverman, B.W. Density Estimation for Statistics and Data Analysis, 1st ed.; Routledge: London, UK, 2018; ISBN 978-1-315-14091-9. [Google Scholar]
- Lu, Z. Research on Location Characteristics of UCF Layout Based on DNSCAN Algorithm. Math. Probl. Eng. 2022, 2022, 2222232. [Google Scholar] [CrossRef]
- Brunsdon, C.; Fotheringham, S.; Charlton, M. Geographically Weighted Regression. J. R. Stat. Soc. D 1998, 47, 431–443. [Google Scholar] [CrossRef]
- Tsai, Y.-H. Quantifying Urban Form: Compactness versus “Sprawl”. Urban Stud. 2005, 42, 141–161. [Google Scholar] [CrossRef]
- Fotheringham, A.S.; Crespo, R.; Yao, J. Geographical and Temporal Weighted Regression (GTWR): Geographical and Temporal Weighted Regression. Geogr. Anal. 2015, 47, 431–452. [Google Scholar] [CrossRef]
- Raza, O.; Holakouie-Naieni, K. Geographically Weighted Regression Analysis: A Statistical Method to Account for Spatial Heterogeneity. Arch. Iran. Med. 2019, 22, 155–160. [Google Scholar]
- Xu, Z.; Cui, G.; Zhong, M.; Wang, X. Anomalous Urban Mobility Pattern Detection Based on GPS Trajectories and POI Data. ISPRS Int. J. Geo-Inf. 2019, 8, 308. [Google Scholar] [CrossRef]
- Li, F.; Shi, W.; Zhang, H. A Two-Phase Clustering Approach for Urban Hotspot Detection With Spatiotemporal and Network Constraints. IEEE J. Sel. Top. Appl. Earth Obs. Remote Sens. 2021, 14, 3695–3705. [Google Scholar] [CrossRef]
- Hu, S.; Yang, S.; Li, W.; Zhang, C.; Xu, F. Spatially Non-Stationary Relationships between Urban Residential Land Price and Impact Factors in Wuhan City, China. Appl. Geogr. 2016, 68, 48–56. [Google Scholar] [CrossRef]
- Cui, D.; Li, G.; Wu, D.; Sun, Y. Spatio-Temporal Patterns Evolution and Impact Mechanism of the Agglomeration of Creative Talents in China. Econ. Geogr. 2020, 40, 1–14. [Google Scholar] [CrossRef]
- Chen, L.; Dang, Y.; Zhang, W.; Ma, R.; Li, C.; Yunxiao, D.; Wenzhong, Z.; Renfeng, M. Satisfaction on urban cultural environment and influencing factors. Prog. Geogr. 2017, 36, 1119–1127. [Google Scholar] [CrossRef]
- Gross, J. Be Creative: Making a Living in the New Cultural Industries. Cult. Trends 2016, 25, 302–304. [Google Scholar] [CrossRef]
- Zhang, W. Research on the Spatial Distribution Characteristics and Optimization Strategies of Zhengzhou’s Cultural and Creative Industries. Master’s Thesis, Zhengzhou University, Zhengzhou, China, 2022. [Google Scholar]
- Xiong, J.; Xiao, C.; Ren, Y. Comparative study on the competitiveness of cultural industry agglomeration in Chinese cities. Stat. Decis. 2017, 1, 60–63. [Google Scholar] [CrossRef]
- Zhang, Z.; Li, Z.; Hu, X. Industrial Agglomeration, Spatial Spillover, and Regional Economic Resilience of Urban Agglomeration. East China Econ. Manag. 2021, 35, 59–68. [Google Scholar] [CrossRef]
- Yang, Y.; Tang, J.; Li, Z.; Gao, X.; Li, W. Study on the Spatial-temporal Distribution Patterns of Cultural Facilities in Changsha City Based on POI Data. Resour. Dev. Mark. 2021, 37, 1046–1052. [Google Scholar]
- Shang, K.; Zhang, Y.; Li, X.; Li, W.; Zhou, G. Spatial Characteristics and Influencing Factors of Night Cultural and Tourism Consumption Agglomeration Areas in China. IEEE J. Sel. Top. Appl. Earth Obs. Remote Sens. 2024, 17, 261–273. [Google Scholar] [CrossRef]
- Martin, R. (Ed.) Economy: Critical Essays in Human Geography; Contemporary Foundations of Space and Place; First Issued in Paperback; Routledge, Taylor & Francis Group: London, UK; New York, NY, USA, 2018; ISBN 978-1-351-15920-3. [Google Scholar]
- Vachet, J. Creative Justice: Cultural Industries, Work and Inequality. Cult. Trends 2017, 26, 272–274. [Google Scholar] [CrossRef]
- He, M. The Formation Mechanism of Spatial Agglomeration of Urban Cultural Industry—Case Study on Chengdu City. In Proceedings of the 2021 RSAI World Congress, Virtual, 25–28 May 2021. [Google Scholar]
- O’Connor, J. Intermediaries and Imaginaries in the Cultural and Creative Industries. Reg. Stud. 2015, 49, 374–387. [Google Scholar] [CrossRef]
- Skavronska, I.V. Creative Industries in Ukraine: Analysis and Prospects of the Development. Econ. Sociol. 2017, 10, 87–106. [Google Scholar] [CrossRef]
- Lazzeretti, L. (Ed.) Creative Industries and Innovation in Europe; Routledge: London, UK, 2012; ISBN 978-1-136-28290-4. [Google Scholar]
- Miles, M. Interruptions: Testing the Rhetoric of Culturally Led Urban Development. Urban Stud. 2005, 42, 889–911. [Google Scholar] [CrossRef]
- Yeoh, B.S.A. The Global Cultural City? Spatial Imagineering and Politics in the (Multi)Cultural Marketplaces of South-East Asia. Urban Stud. 2005, 42, 945–958. [Google Scholar] [CrossRef]
- O’Connor, J.; Wynne, D. From the Margins to the Centre: Cultural Production and Consumption in the Post-Industrial City, 1st ed.; Routledge: London, UK, 2017; ISBN 978-1-315-25486-9. [Google Scholar]
- Roberts, E.; Townsend, L. The Contribution of the Creative Economy to the Resilience of Rural Communities: Exploring Cultural and Digital Capital. Sociol. Rural 2016, 56, 197–219. [Google Scholar] [CrossRef]
Disclaimer/Publisher’s Note: The statements, opinions and data contained in all publications are solely those of the individual author(s) and contributor(s) and not of MDPI and/or the editor(s). MDPI and/or the editor(s) disclaim responsibility for any injury to people or property resulting from any ideas, methods, instructions or products referred to in the content. |
© 2025 by the authors. Published by MDPI on behalf of the International Society for Photogrammetry and Remote Sensing. Licensee MDPI, Basel, Switzerland. This article is an open access article distributed under the terms and conditions of the Creative Commons Attribution (CC BY) license (https://creativecommons.org/licenses/by/4.0/).