Abstract
The increasing demand for high-quality geospatial visualizations in scientific publications has highlighted the need for accessible and standardized tools that support reproducible research. Researchers from various disciplines—often without expertise in Geographic Information Systems (GIS)—frequently require a map figure to locate their study area. This paper presents the Study Area Map Generator, a web-based application developed using Shiny for Python, designed to automate the creation of country- and city-level study area maps. The tool integrates geospatial data processing, cartographic rendering, and user-friendly customization features within a browser-based interface. It enables users—regardless of GIS proficiency—to generate publication-ready maps with customizable titles, basemaps, and inset views. A usability survey involving 92 participants from diverse professional and geographic-based backgrounds revealed high levels of satisfaction, ease of use, and perceived usefulness, with no significant differences across GIS experience levels. The application has already been adopted in academic and policy contexts, particularly in low-resource settings, demonstrating its potential to democratize access to cartographic tools. By aligning with open science principles and supporting reproducible workflows, the Study Area Map Generator contributes to more equitable and efficient scientific communication. The application is freely available online. Future developments include support for subnational units, thematic overlays, multilingual interfaces, and enhanced export options.
1. Introduction
Geospatial visualization has become a critical and indispensable component of scientific communication across a wide range of disciplines. From environmental monitoring [1,2] and epidemiology [3,4] to urban planning [5] and agricultural research [6,7], maps serve as powerful tools for conveying spatial context, patterns, and relationships in a visually intuitive manner [8]. Their inclusion in scientific publications enhances the interpretability of research findings and facilitates interdisciplinary understanding [9].
Despite their importance, creating high-quality and accurate maps for academic purposes remains a technically demanding task. Traditional Geographic Information Systems (GIS) software such as QGIS [10] or ArcGIS PRO [11], while robust, often require significant training, access to specialized hardware, and familiarity with cartographic principles [12]. These requirements pose substantial barriers for early-career researchers, scholars in low-resource settings, and professionals from non-geospatial disciplines who nonetheless require spatial representations of their study areas [13].
The growing emphasis on open science and reproducibility has further underscored the need for accessible and standardized tools that support transparent research workflows. The FAIR principles—Findable, Accessible, Interoperable, and Reusable—have been widely adopted as a framework for improving the management and dissemination of scientific data and tools [14,15]. However, in the geospatial domain, the implementation of these principles is often hindered by fragmented software ecosystems, reliance on proprietary platforms, and the particular/national cartographic rules [16].
Moreover, several academic journals now encourage or mandate the inclusion of graphical abstracts or visual representations of study areas, particularly in fields with a spatial component. Yet, the generation of such maps is frequently ad hoc, with considerable variation in design, scale, and clarity. This lack of standardization not only affects the visual quality of publications but also limits the reproducibility, the accuracy of the representation and comparability of spatial analyses across studies [17].
To address these challenges, there is a clear need for lightweight, web-based tools that automate the generation of base study area maps. Such tools should require minimal technical expertise, operate directly within a browser, and produce publication-ready outputs with customizable elements. Ideally, they should be open-source, extensible, and compatible with reproducible research practices [18].
In this context, the development of interactive web applications built with frameworks such as Shiny for Python [19] offers a promising solution. These platforms enable the development of user-friendly interfaces that integrate geospatial data processing, cartographic rendering, and interactive customization within a single environment [20]. Leveraging libraries such as GeoPandas version 1.0.1 [21], Cartopy version 0.22.0 [22], and Matplotlib version 3.8.0 [23], developers can automate complex mapping tasks—such as geometry simplification, zoom level adjustment, and the inclusion of cartographic elements like scale bars and inset maps—while maintaining high visual standards. The Study Area Map Generator application was developed in response to this need. It provides a streamlined, open-access solution for generating country and city-level study area maps suitable for academic publication. By allowing users to select a country or city, customize map titles, and optionally include inset maps, the tool simplifies the map creation process and promotes visual consistency across research outputs. Its intuitive interface and automated rendering engine make it particularly valuable for users with limited GIS experience, while its open-source architecture ensures adaptability and integration into broader research workflows.
Ultimately, this tool contributes to the democratization of geospatial visualization by lowering technical barriers and enhancing the reproducibility of spatial representations in scientific communication. It aligns with the principles of open science and supports equitable access to high-quality cartographic tools, regardless of users’ institutional or geographic context [24]. Furthermore, its modular design allows for future extensions, including support for subnational units, thematic overlays, and multilingual interfaces, thereby expanding its applicability across disciplines and regions [25].
2. Methods and Software Description
2.1. Software Architecture and Workflow
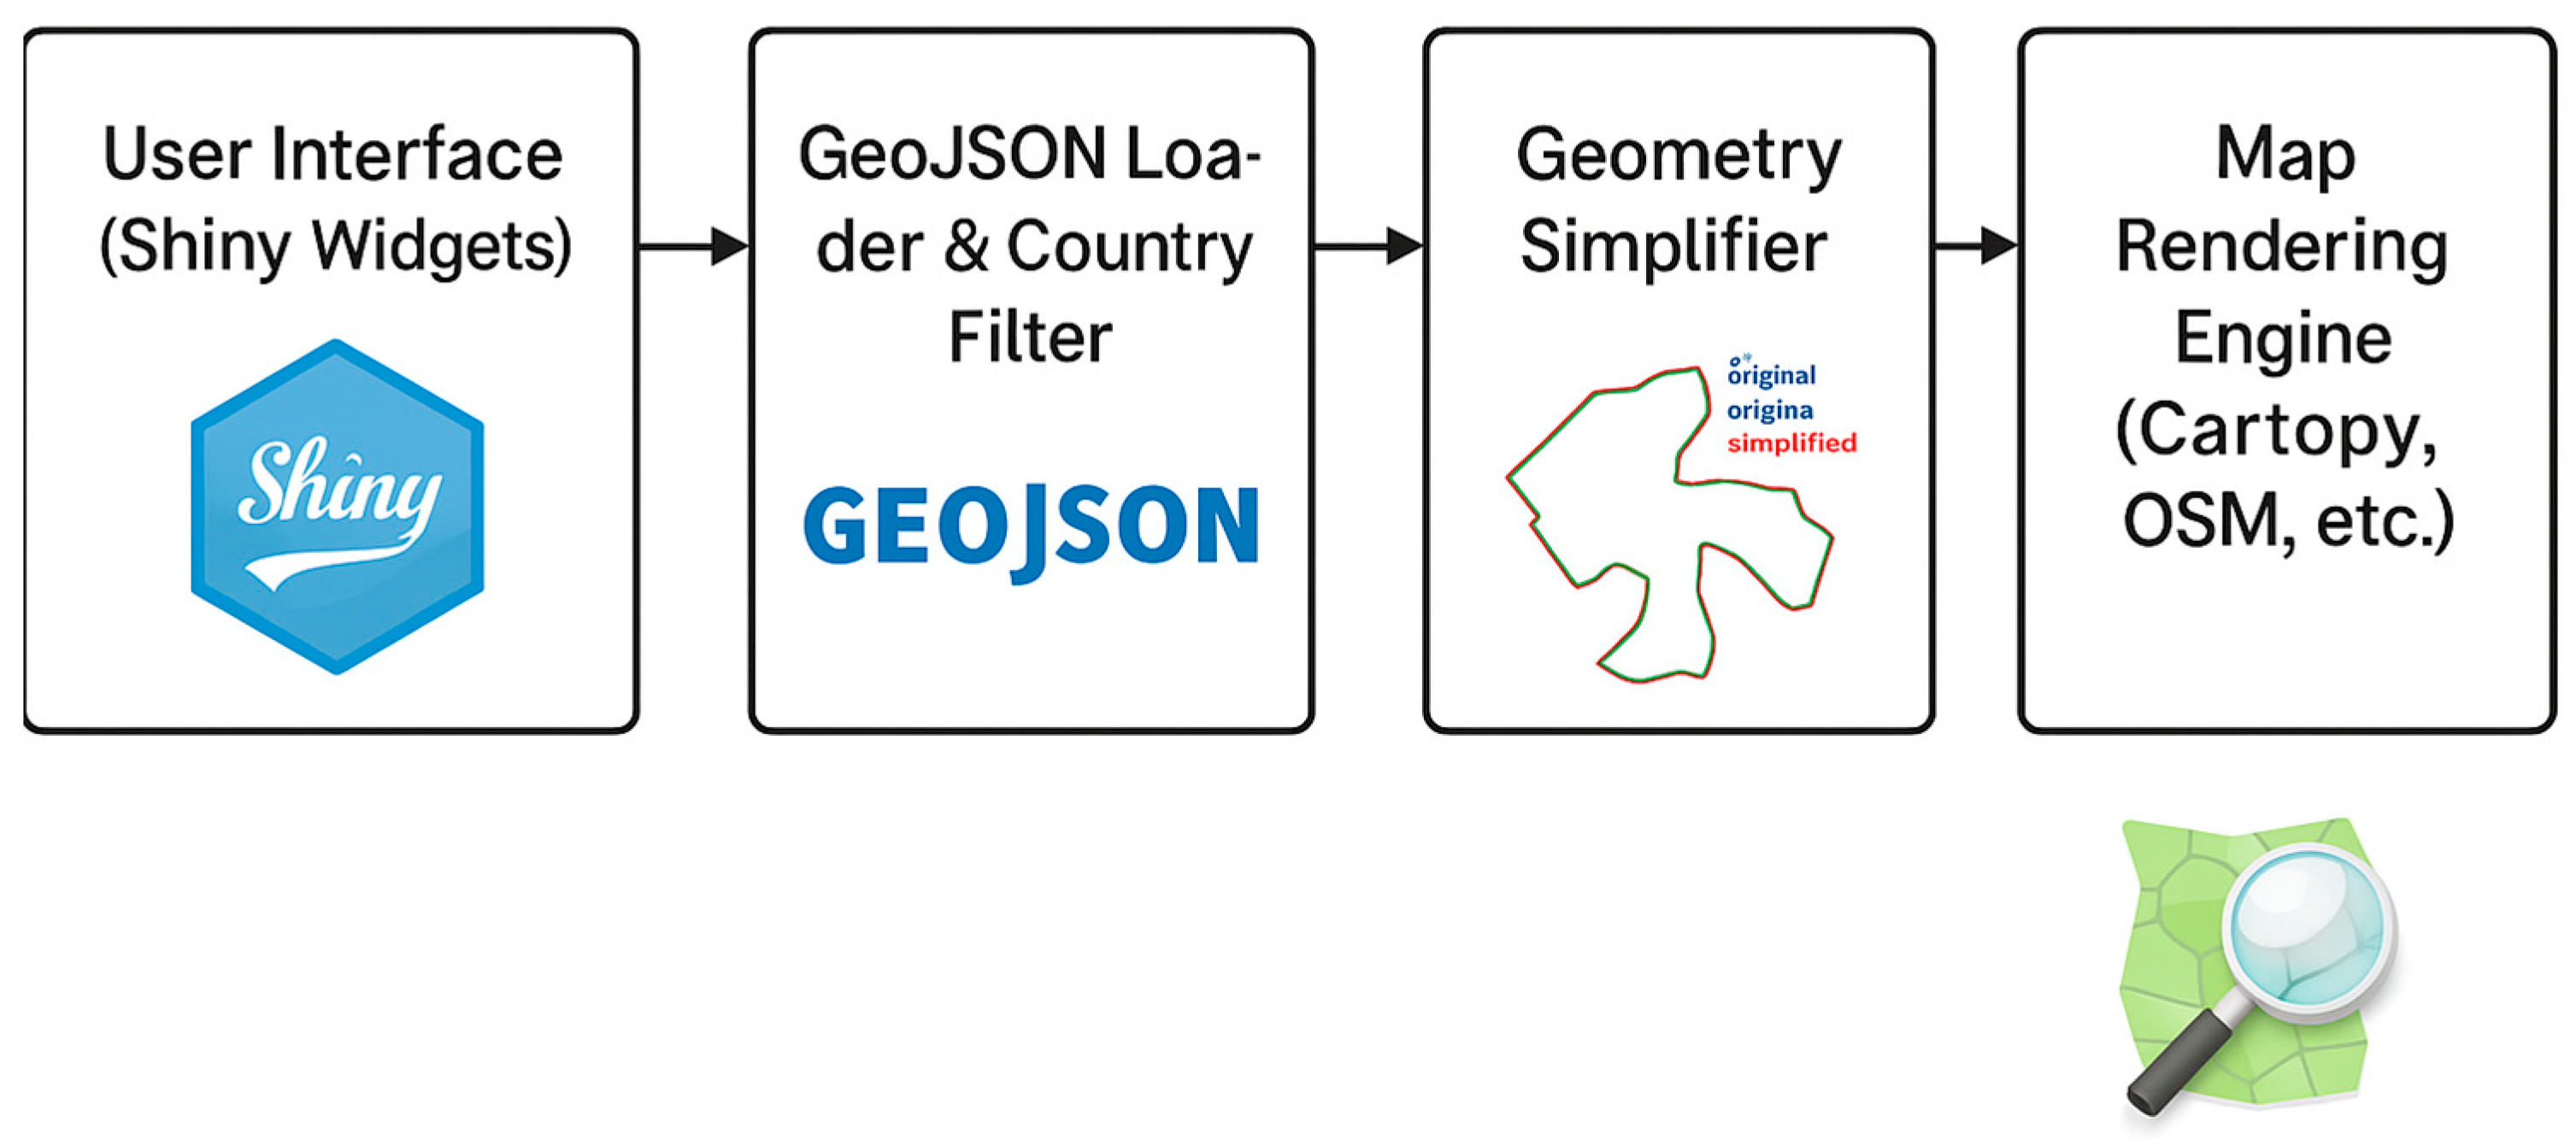
The Study Area Map Generator is designed using a modular, open-source software architecture to ensure usability, flexibility, and reproducibility (Figure 1). The tool allows users to generate static, high-resolution study area maps centered on a country or city, with minimal user input and no need for GIS expertise. The core components are as follows:
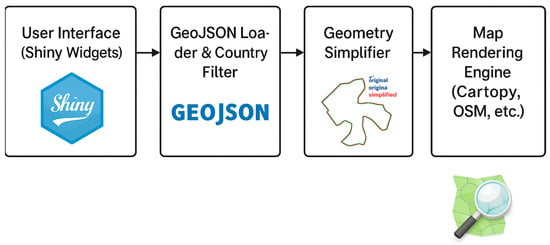
Figure 1.
Implementation flow diagram of the Study Area Map Generator.
- Frontend UI Layer: The interface is developed using Shiny for Python version 3.10, a web framework that supports reactive, browser-based applications. Key input controls include:
- ○
- A dropdown menu for country selection.
- ○
- A text input for custom map titles.
- ○
- A search box for city or place name using OpenStreetMap’s geocoding service.
- ○
- A numeric input for zoom radius (in decimal degrees).
- ○
- Radio buttons for inset position (top or bottom right).
- ○
- A selection box for basemap choice, including OpenStreetMap and Google Satellite (Hybrid).
The interface layout is implemented in ui.py and rendered using shinywidgets components.
- Data Input and Geolocation Module:
Country geometries are sourced from a GeoJSON file containing global administrative boundaries. When a country is selected, its corresponding polygon is extracted using GeoPandas version 1.0.1 and simplified using GeoSeries.simplify() to optimize performance. For city-level maps, the user-provided name is processed through the Nominatim geocoder via the geopy library to obtain bounding box coordinates. These coordinates define the visualization extent and location for the inset map.
- Map Rendering Engine:The application generates static maps using Cartopy (v0.22) and Matplotlib (v3.8), overlaid with:
- ○
- The selected basemap (either OpenStreetMap tiles or Google Hybrid Satellite imagery via mt1.google.com);
- ○
- Administrative boundaries, coastlines, and labels;
- ○
- A north arrow and scale bar, generated dynamically relative to the bounding box;
- ○
- An optional inset map that highlights the country or city within its continental context.
The function generate_map() in server.py handles all rendering logic and styling. Within this process, the application employs geometry simplification through the GeoSeries.simplify() method to optimize performance while preserving topological integrity. In addition, zoom levels are dynamically adjusted according to the bounding box dimensions, which ensures consistent levels of detail and readability for both small and large cities.
This method is based on the Douglas–Peucker algorithm, which recursively removes points from a line or polygon that do not deviate significantly from the overall shape. By retaining only the most essential vertices, the algorithm reduces geometric complexity while maintaining the visual and topological characteristics of the original feature [26].
- Logic and Control Layer:The application adjusts zoom levels based on the bounding box dimensions. For instance:
- ○
- Countries with widths or heights > 20° default to zoom level 5;
- ○
- Extents > 40° default to zoom level 4;
- ○
- Bounding boxes are padded using the user-defined zoom radius for optimal framing.
Conditional rendering hides or displays inset maps, handles missing inputs, and provides fallback behaviors for invalid or ambiguous city searches.
- Export and Output Module:
Final maps are saved as PNG images at 300 DPI, displayed within the application interface, and made downloadable for users. The resolution and image format are compatible with most of the academic publishing standards. Temporary files are managed using the tempfile module to ensure clean memory usage and session safety.
- Deployment and Repository:
The application is hosted on Shinyapps.io, supporting cloud deployment with reactive scaling. All code, data, and documentation are publicly available in the open-source GitHub repository:
https://github.com/osoivan/country-map-generator (accessed on 23 July 2025)
The repository includes:
- ○
- app.py (that includes user interface definition, server logic, map rendering and helper functions).
- ○
- requirements.txt (Python package dependencies).
- ○
- Sample output images and usage instructions in the README.md.
- ○
- World administrative boundaries in geojson format.
This modular and well-documented architecture supports future extensions, including support for subnational shapefiles, vector export formats (SVG, PDF), raster overlays, and multilingual interfaces.
2.2. Usability Survey
To evaluate the usability, performance, and perceived value of the Study Area Map Generator, a structured online survey was conducted. The primary objective was to gather feedback from a diverse group of users with varying levels of expertise in GIS, to inform future improvements and ensure that the tool aligns with the needs of its target audience.
The survey was developed using Microsoft Forms and consisted of both closed- and open-ended questions. It was distributed via professional platforms, including LinkedIn, academic mailing lists, and institutional networks, to reach GIS practitioners, researchers, and master’s students. The questionnaire was organized into four main sections: (1) Demographic and professional background, (2) GIS experience and tool usage, (3) Evaluation of the tool’s usability and performance, and (4) Qualitative feedback and suggestions for improvement.
Respondents rated the tool using Likert-scale items assessing ease of use, visual clarity, performance speed, perceived usefulness, and overall satisfaction. In addition, binary and multiple-choice questions addressed GIS proficiency, device compatibility, and prior experience with similar tools.
Participation was voluntary and anonymous. Data collection was conducted over a two-week period, resulting in 92 valid responses. The survey form is accessible at the following link: https://forms.office.com/r/DTfbymb1nF (accessed on 23 July 2025).
3. Results
3.1. App Functionalities
Below is an example of how a study area map is visualized as an output of the application, showing the respective functionalities. The application is freely available at: https://cesarivanalvarez.shinyapps.io/country-map (accessed on 23 July 2025).
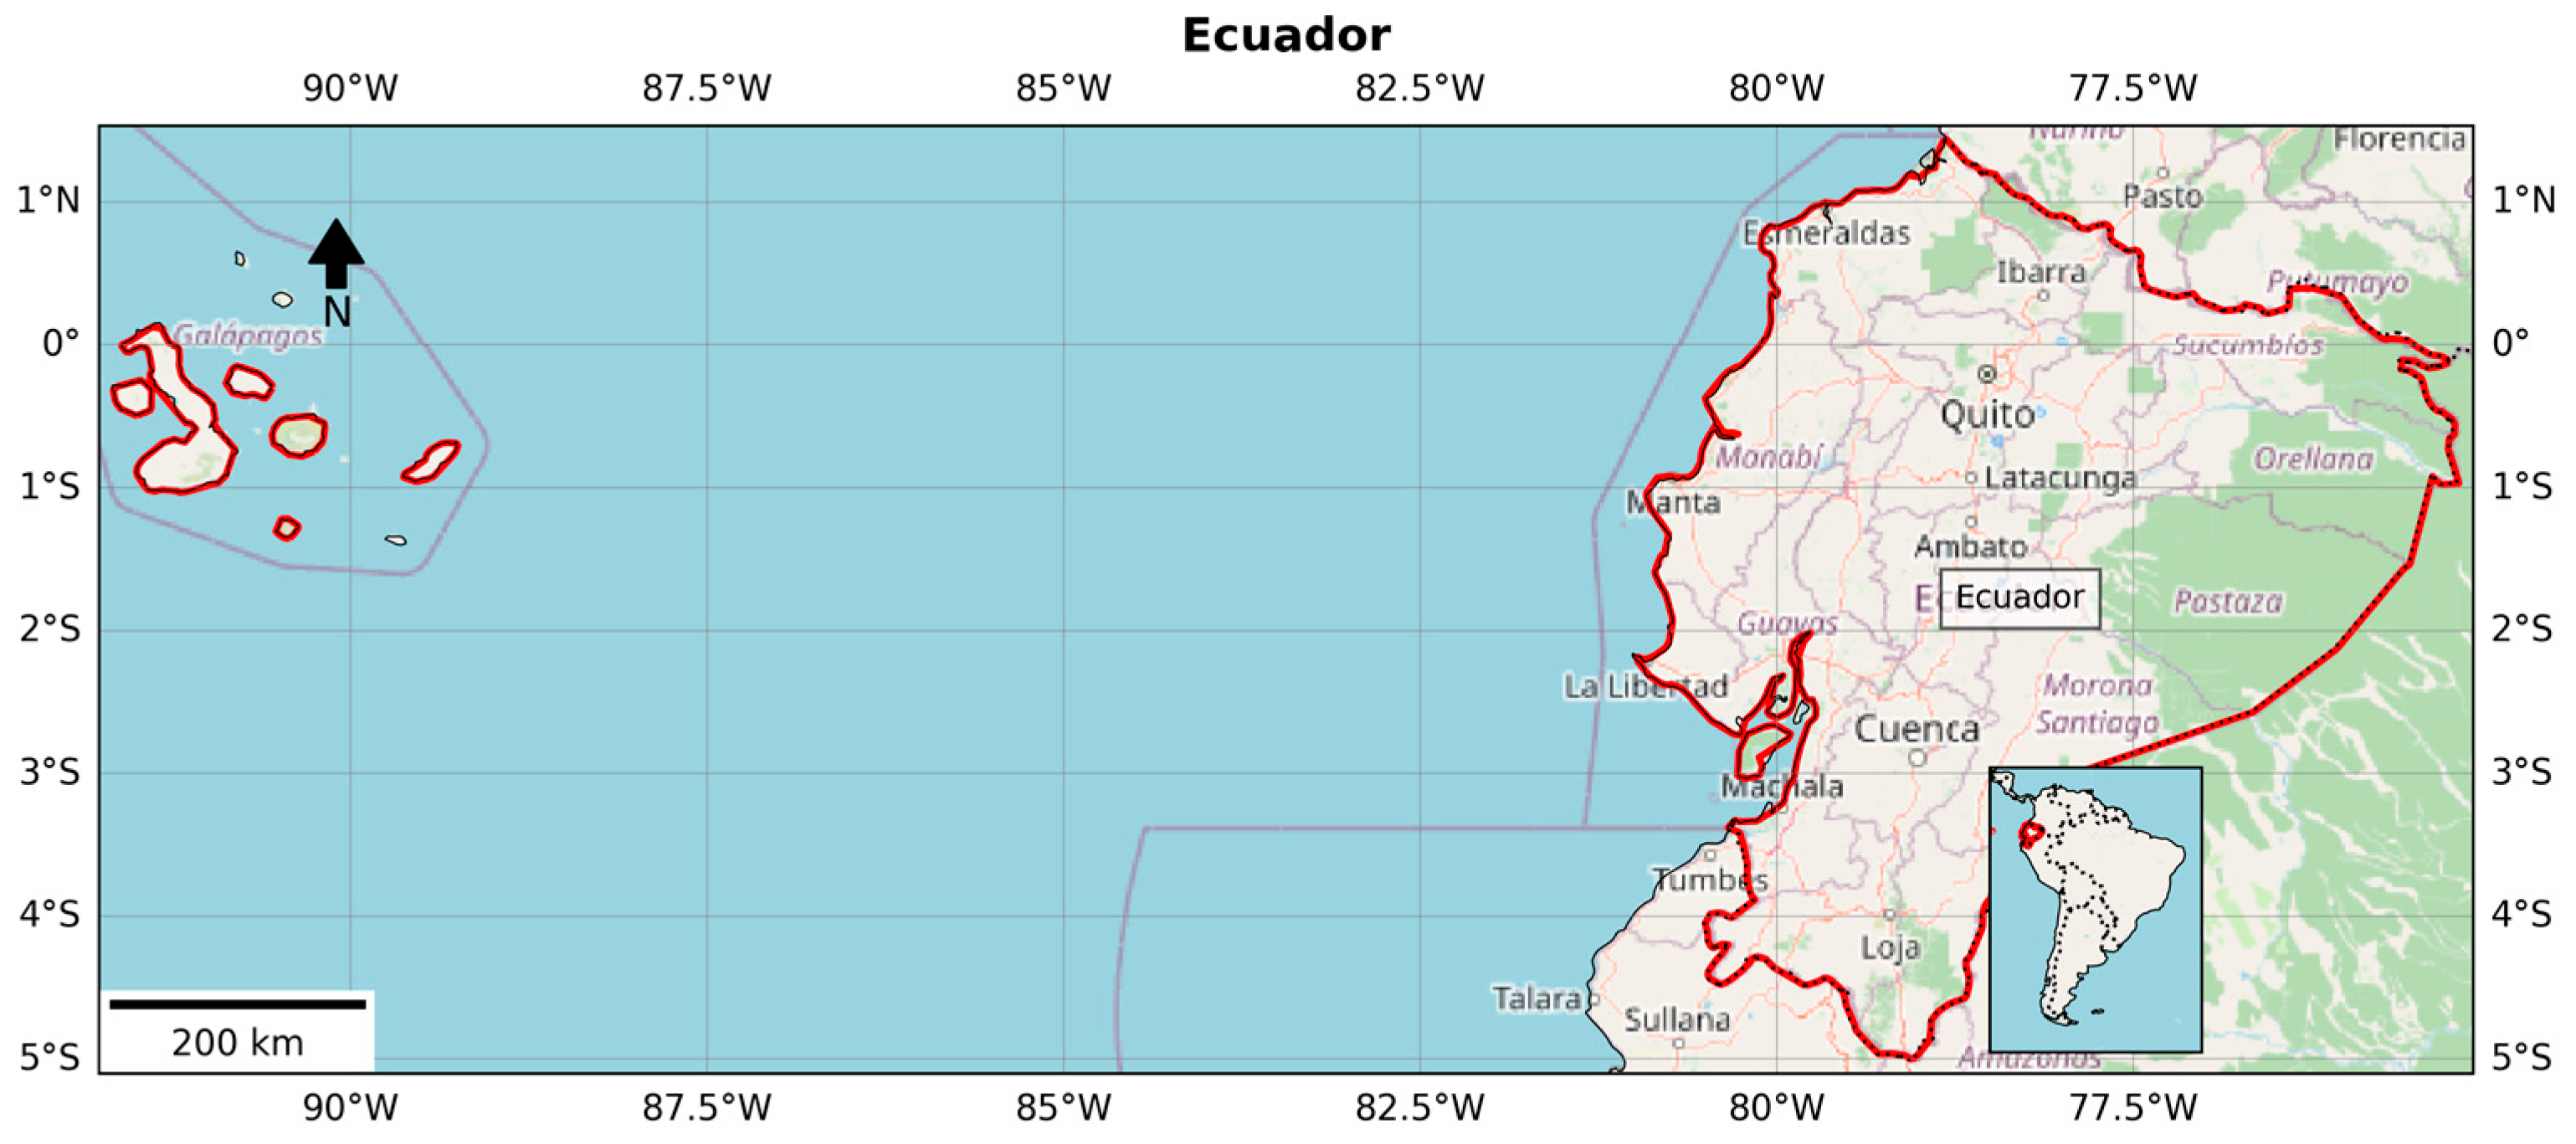
Figure 2 demonstrates the final output with title, base tiles, borders, labels, and an inset location map.
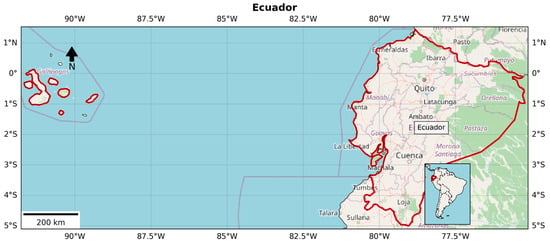
Figure 2.
Example map output for Ecuador.
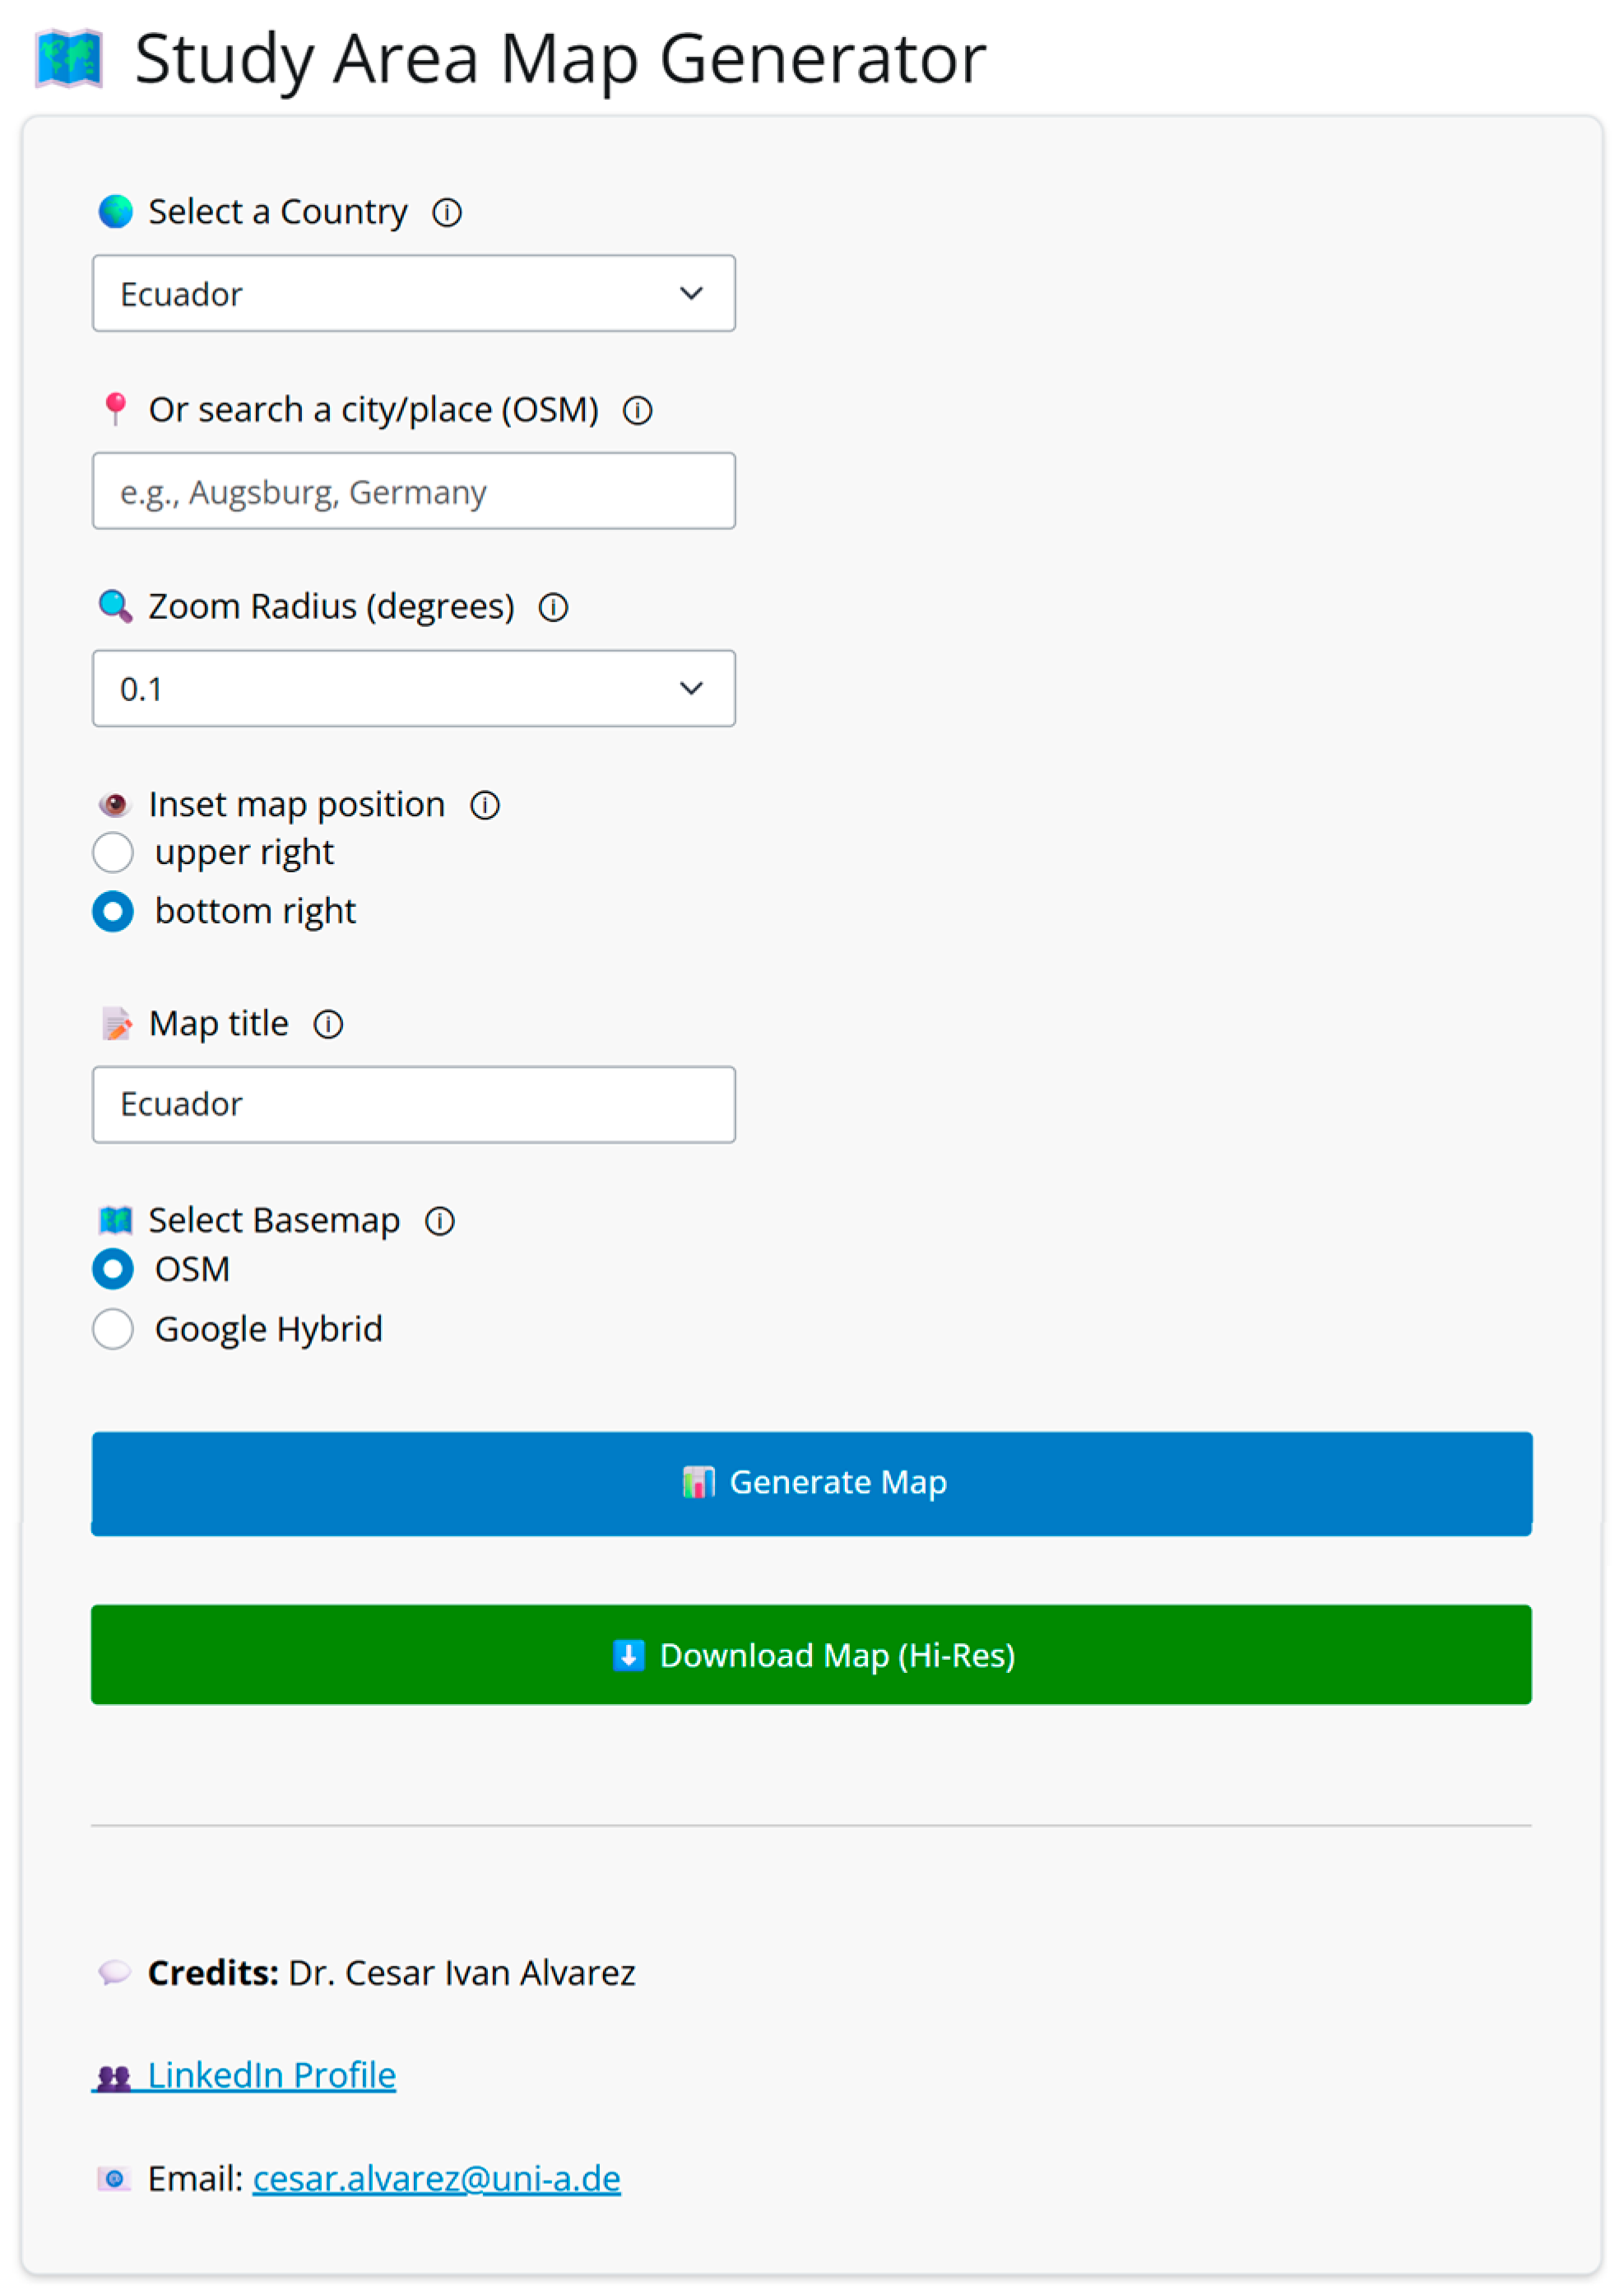
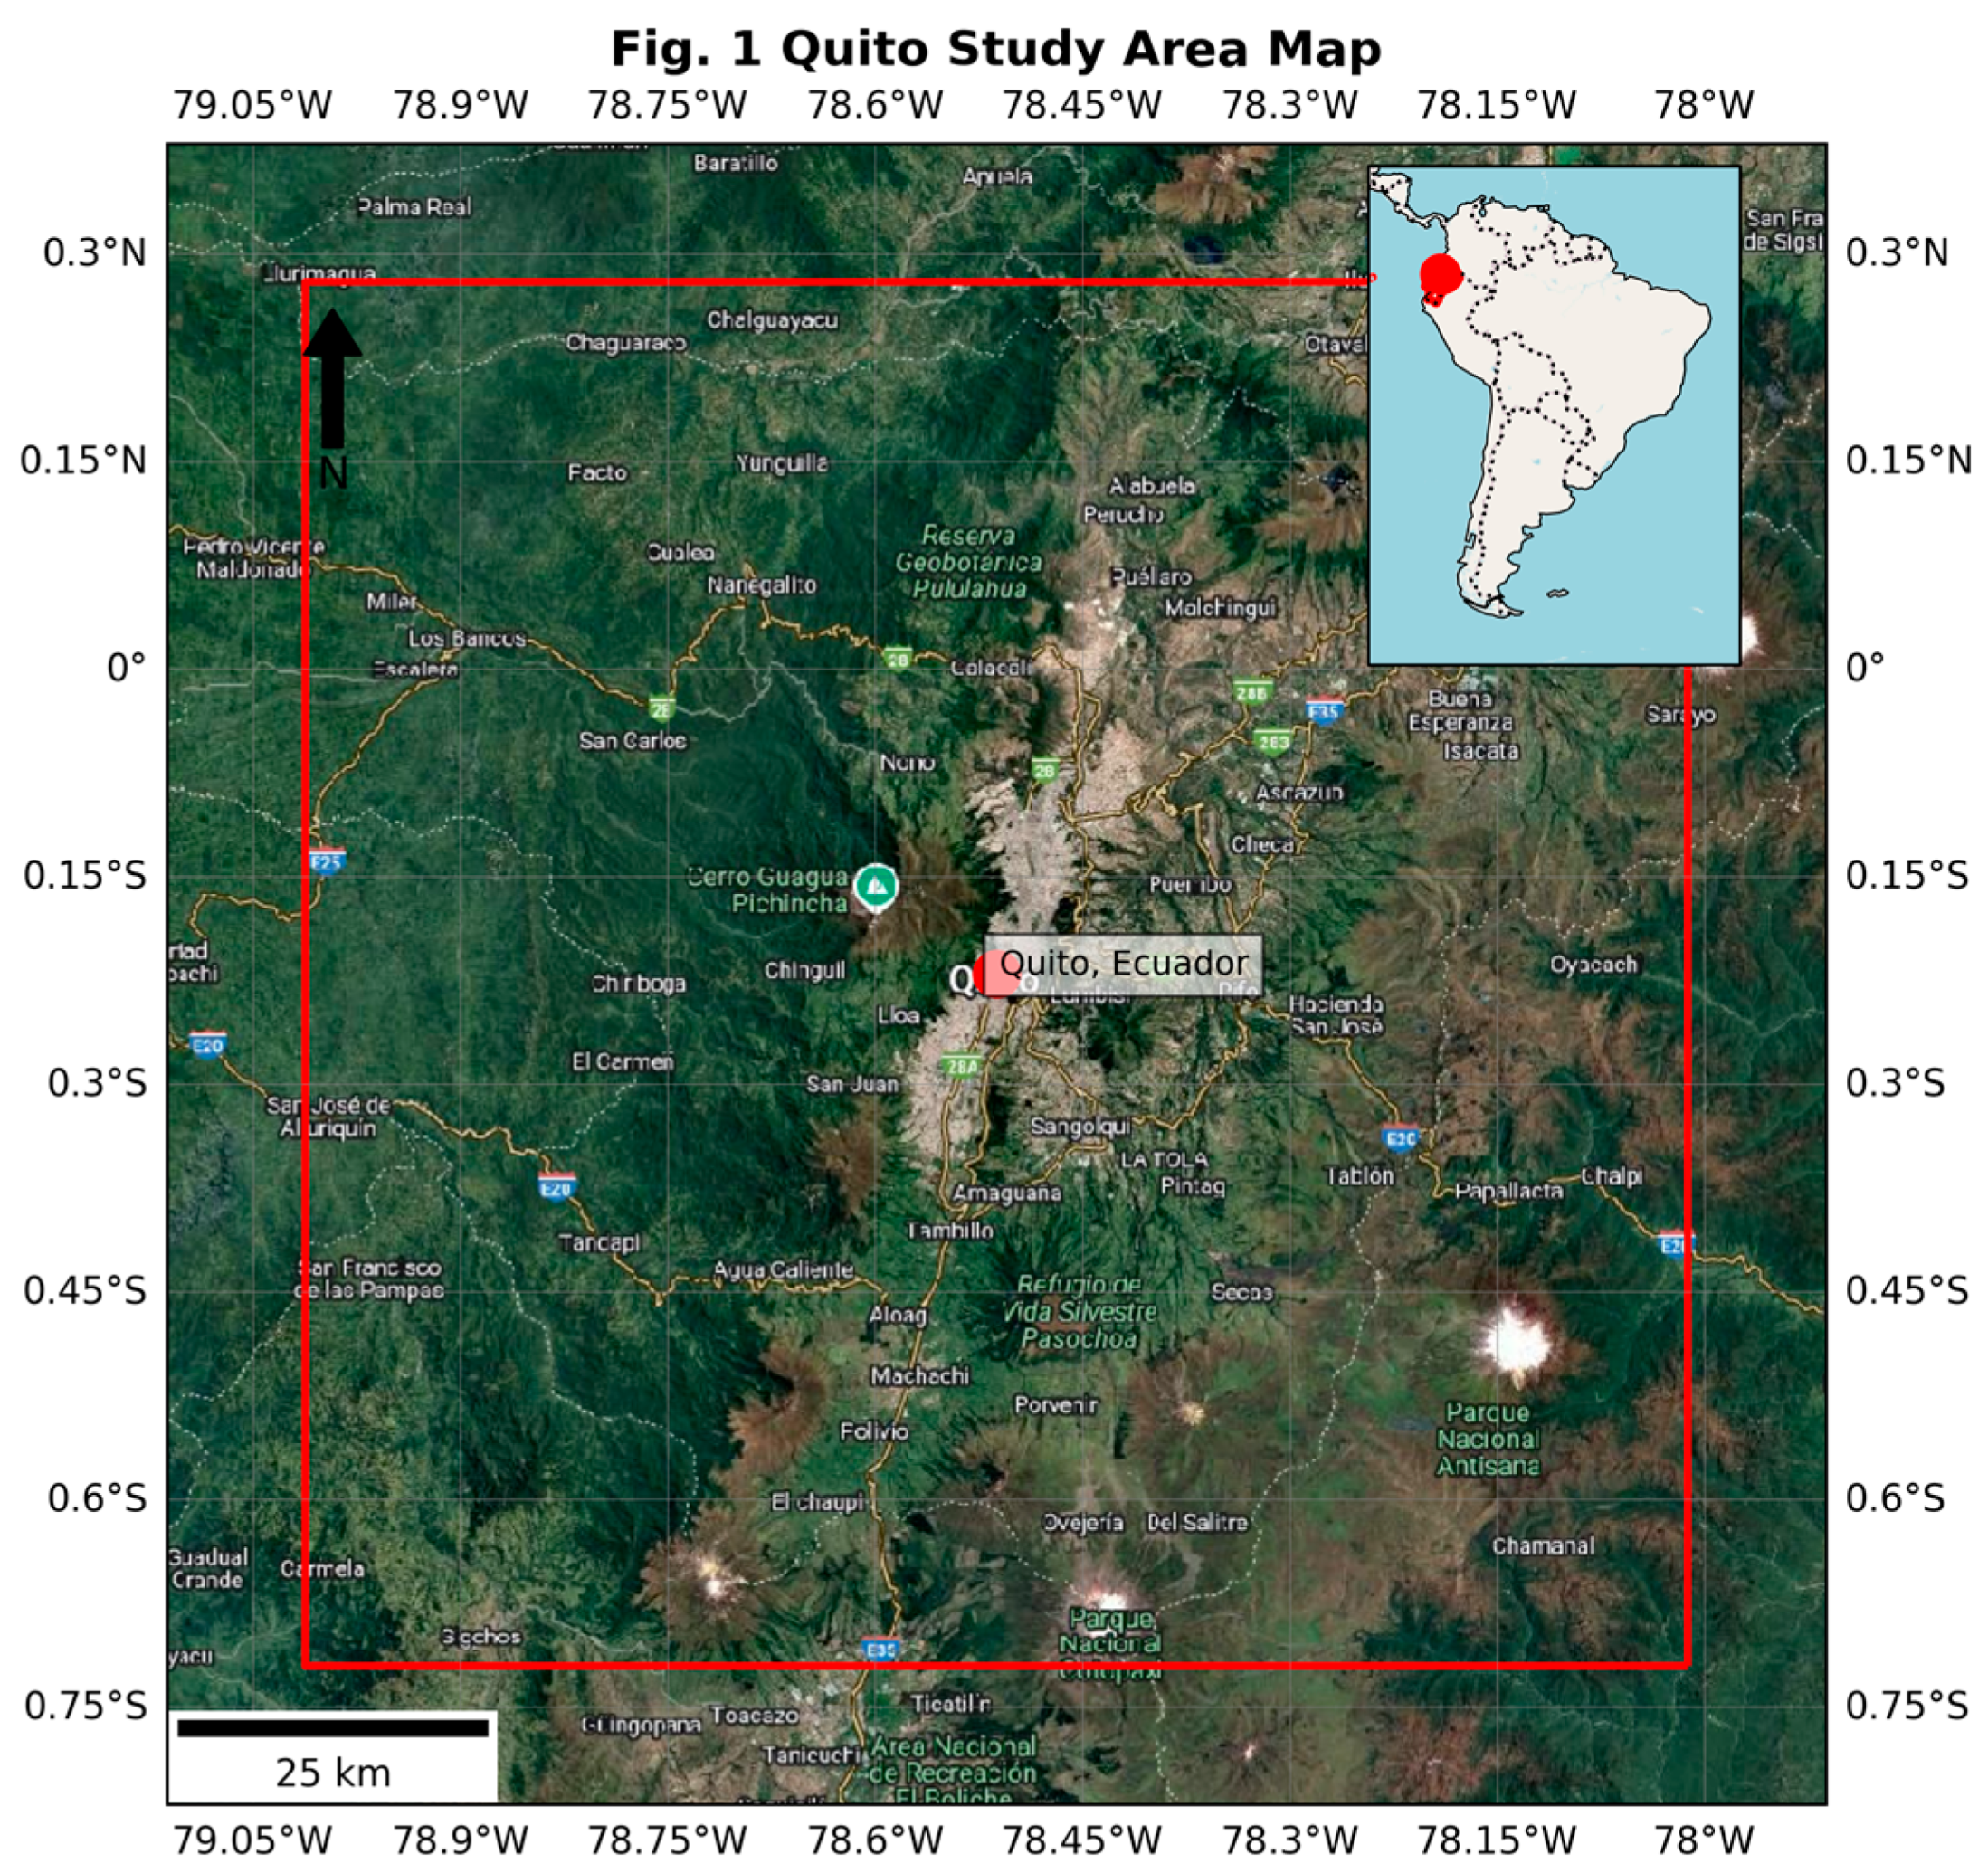
In Figure 3, the interface layout is shown, including the option to select the country for which the map is to be generated. If a city or town is requested, the user can type its name, and through the OpenStreetMap thesaurus, the corresponding location will be retrieved and visualized on the map (Figure 4).
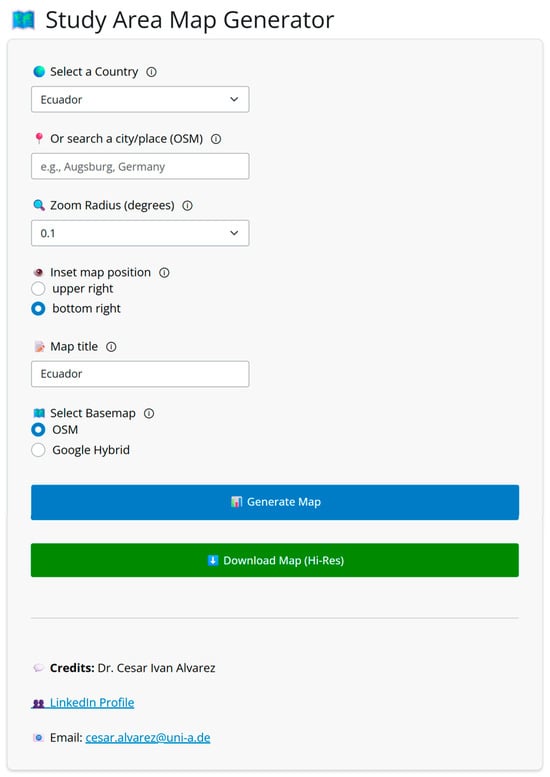
Figure 3.
Country Map Generator app interface.
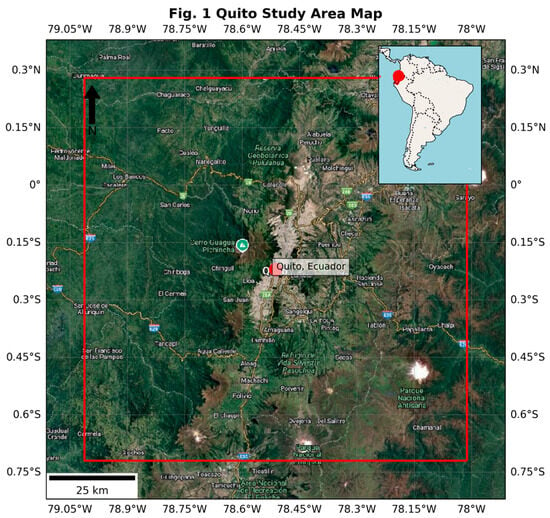
Figure 4.
Example map output for Quito city in Ecuador.
In addition to this, the application allows users to increase or decrease the viewing radius in decimal degrees, adjust the position of the inset map (top or bottom), assign a title to the map, and choose a basemap—either the default OpenStreetMap layer or a hybrid map from Google.
The app is accessible via web browser. For instance, a user interested in producing a study area map for Ecuador:
- Opens the app in the browser.
- Selects “Ecuador” from the dropdown list.
- Writes a custom map title, such as “Figure 1 Study Area in Ecuador”.
- Chooses whether the inset should appear in the upper or bottom right.
- Clicks “Generate Map”.
- The resulting map is displayed directly on the page with the customized elements.
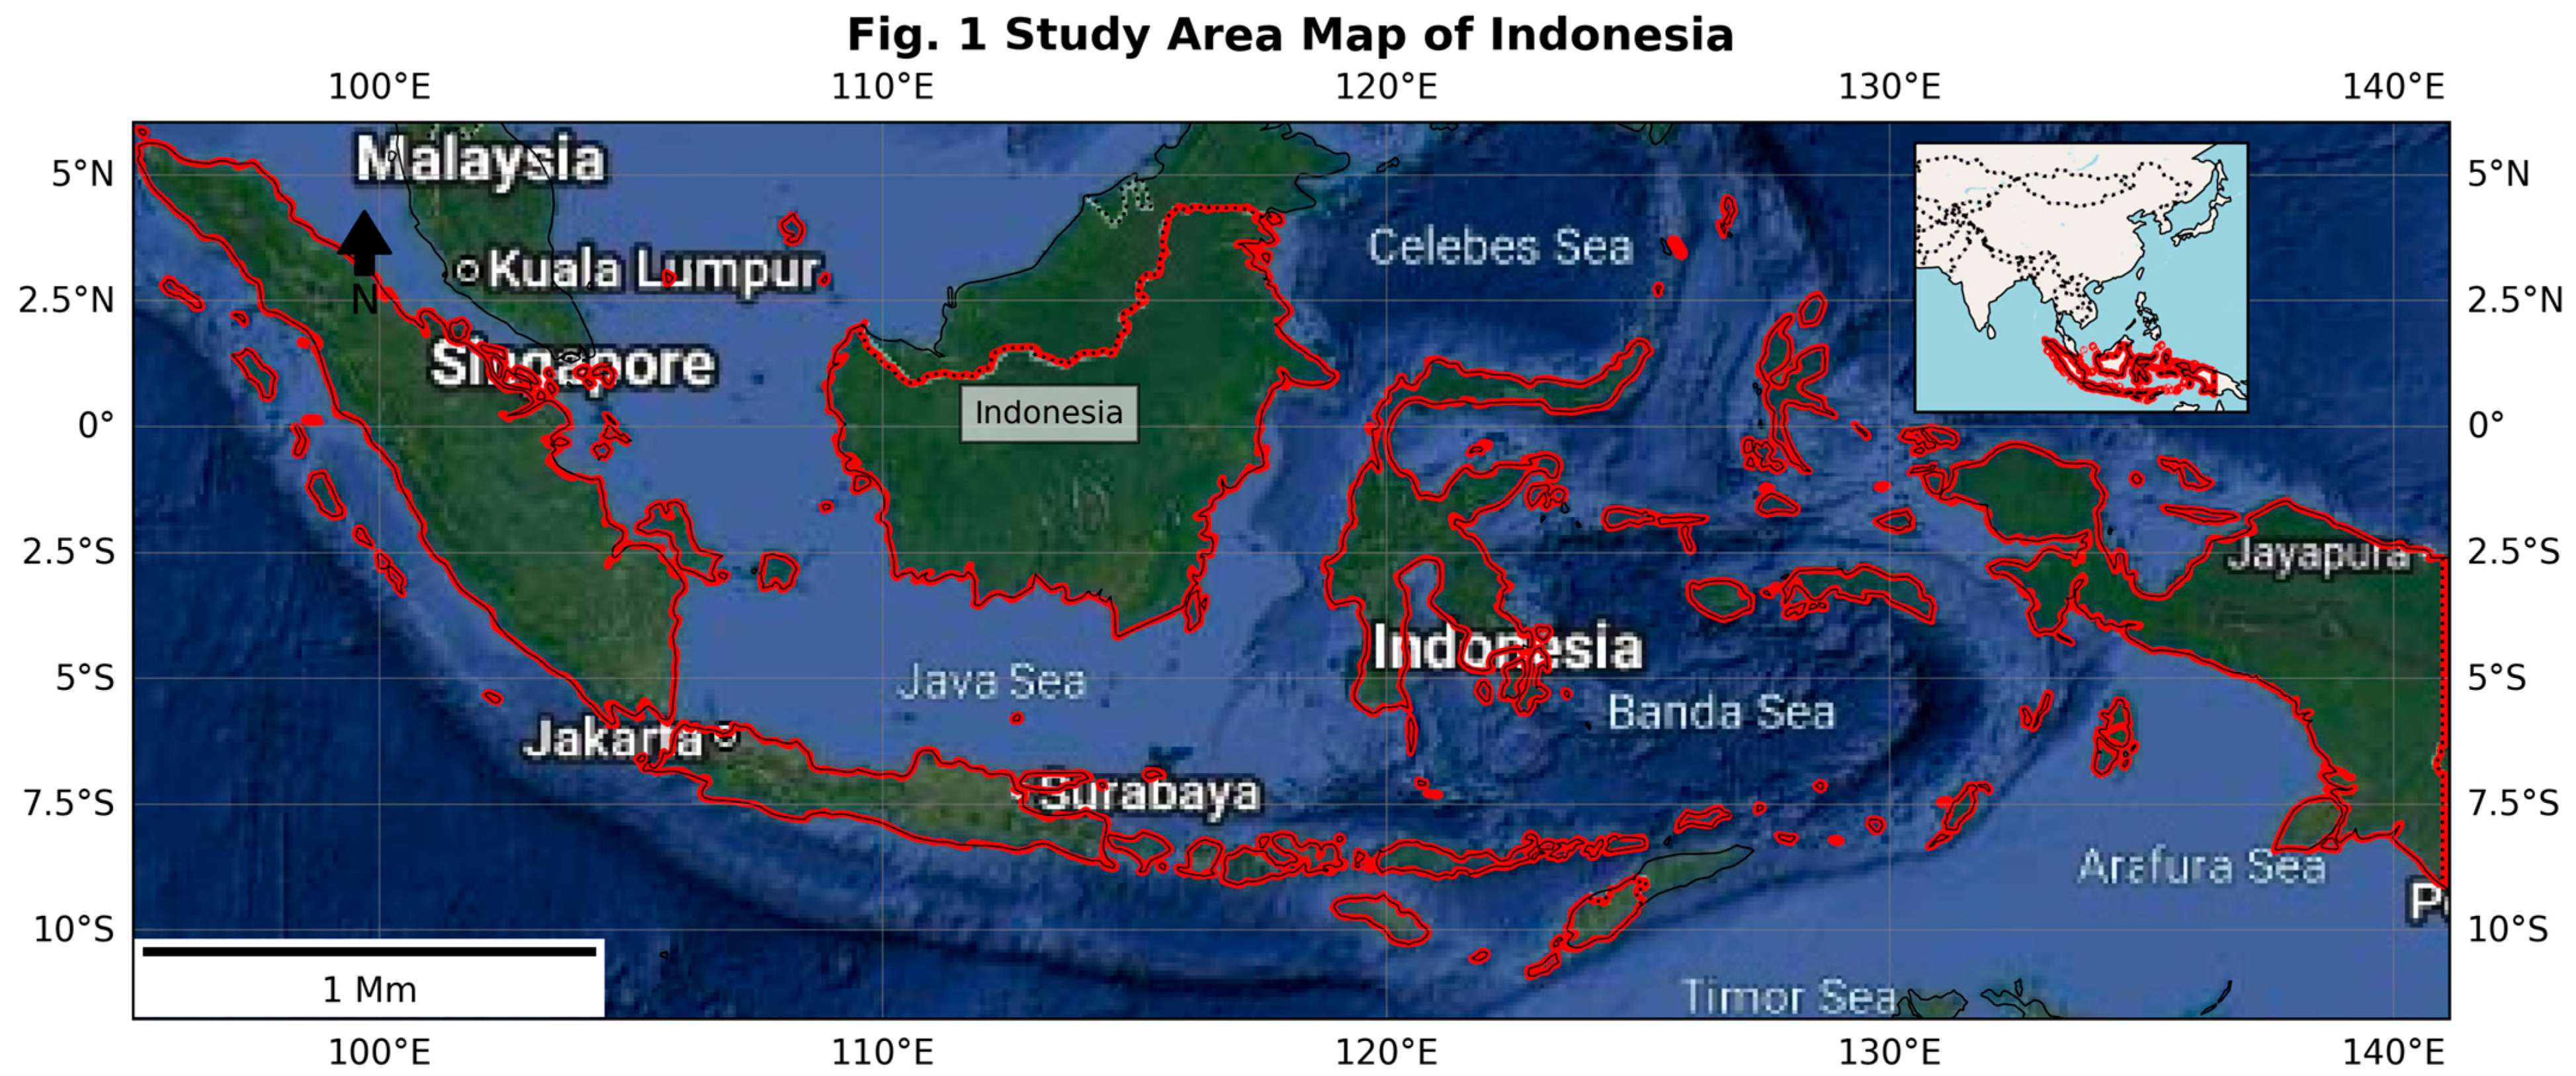
The application has been tested across a diverse set of countries, including landlocked nations like Chad and Nepal, island states such as Madagascar and Indonesia (Figure 5), and large continental regions such as Brazil and Canada. The app handles variable geometry sizes and automatically adjusts zoom levels to ensure optimal framing of the selected area. For countries with extensive spatial extent (e.g., Russia or Australia), the system defaults to a wider OpenStreetMap zoom to provide full visibility while maintaining clarity.
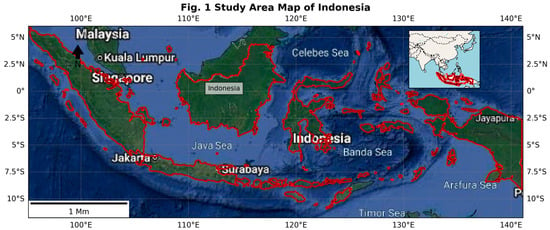
Figure 5.
Example of a map output generated by the Study Area Map Generator for a large country (Indonesia), demonstrating automatic zoom-level adjustment, country borders, coastline rendering, inset location map, and customizable title and basemap settings.
Furthermore, the simplified geometry feature reduces rendering time while preserving the topological integrity of the shapes. This is particularly useful when accessing the application on lower-end devices or slower internet connections.
The user can then download the image for use in articles, theses, presentations, or posters.
This section may be divided by subheadings. It should provide a concise and precise description of the experimental results, their interpretation, as well as the experimental conclusions that can be drawn.
3.2. Survey Results Analysis
To evaluate the usability, performance, and perceived value of the Study Area Map Generator, an updated online survey was conducted involving 92 participants from diverse geographic and professional backgrounds. The questionnaire included both closed- and open-ended questions, distributed via academic networks and professional platforms
Respondents represented a broad demographic spectrum, with the most common age group being 25–34 years (38%), followed by 35–44 years (27%) and 18–24 years (22%). Participants were based in over 20 countries, with the highest representation from Ecuador (56%), followed by Spain (18%), Mexico (6%), Germany (5%), and France (4%)
In terms of professional background, most respondents identified as science and engineering professionals or academic researchers, with a smaller proportion from the private sector, government, and non-governmental organizations. Notably, over 90% of participants reported using GIS tools regularly or occasionally in their work or studies.
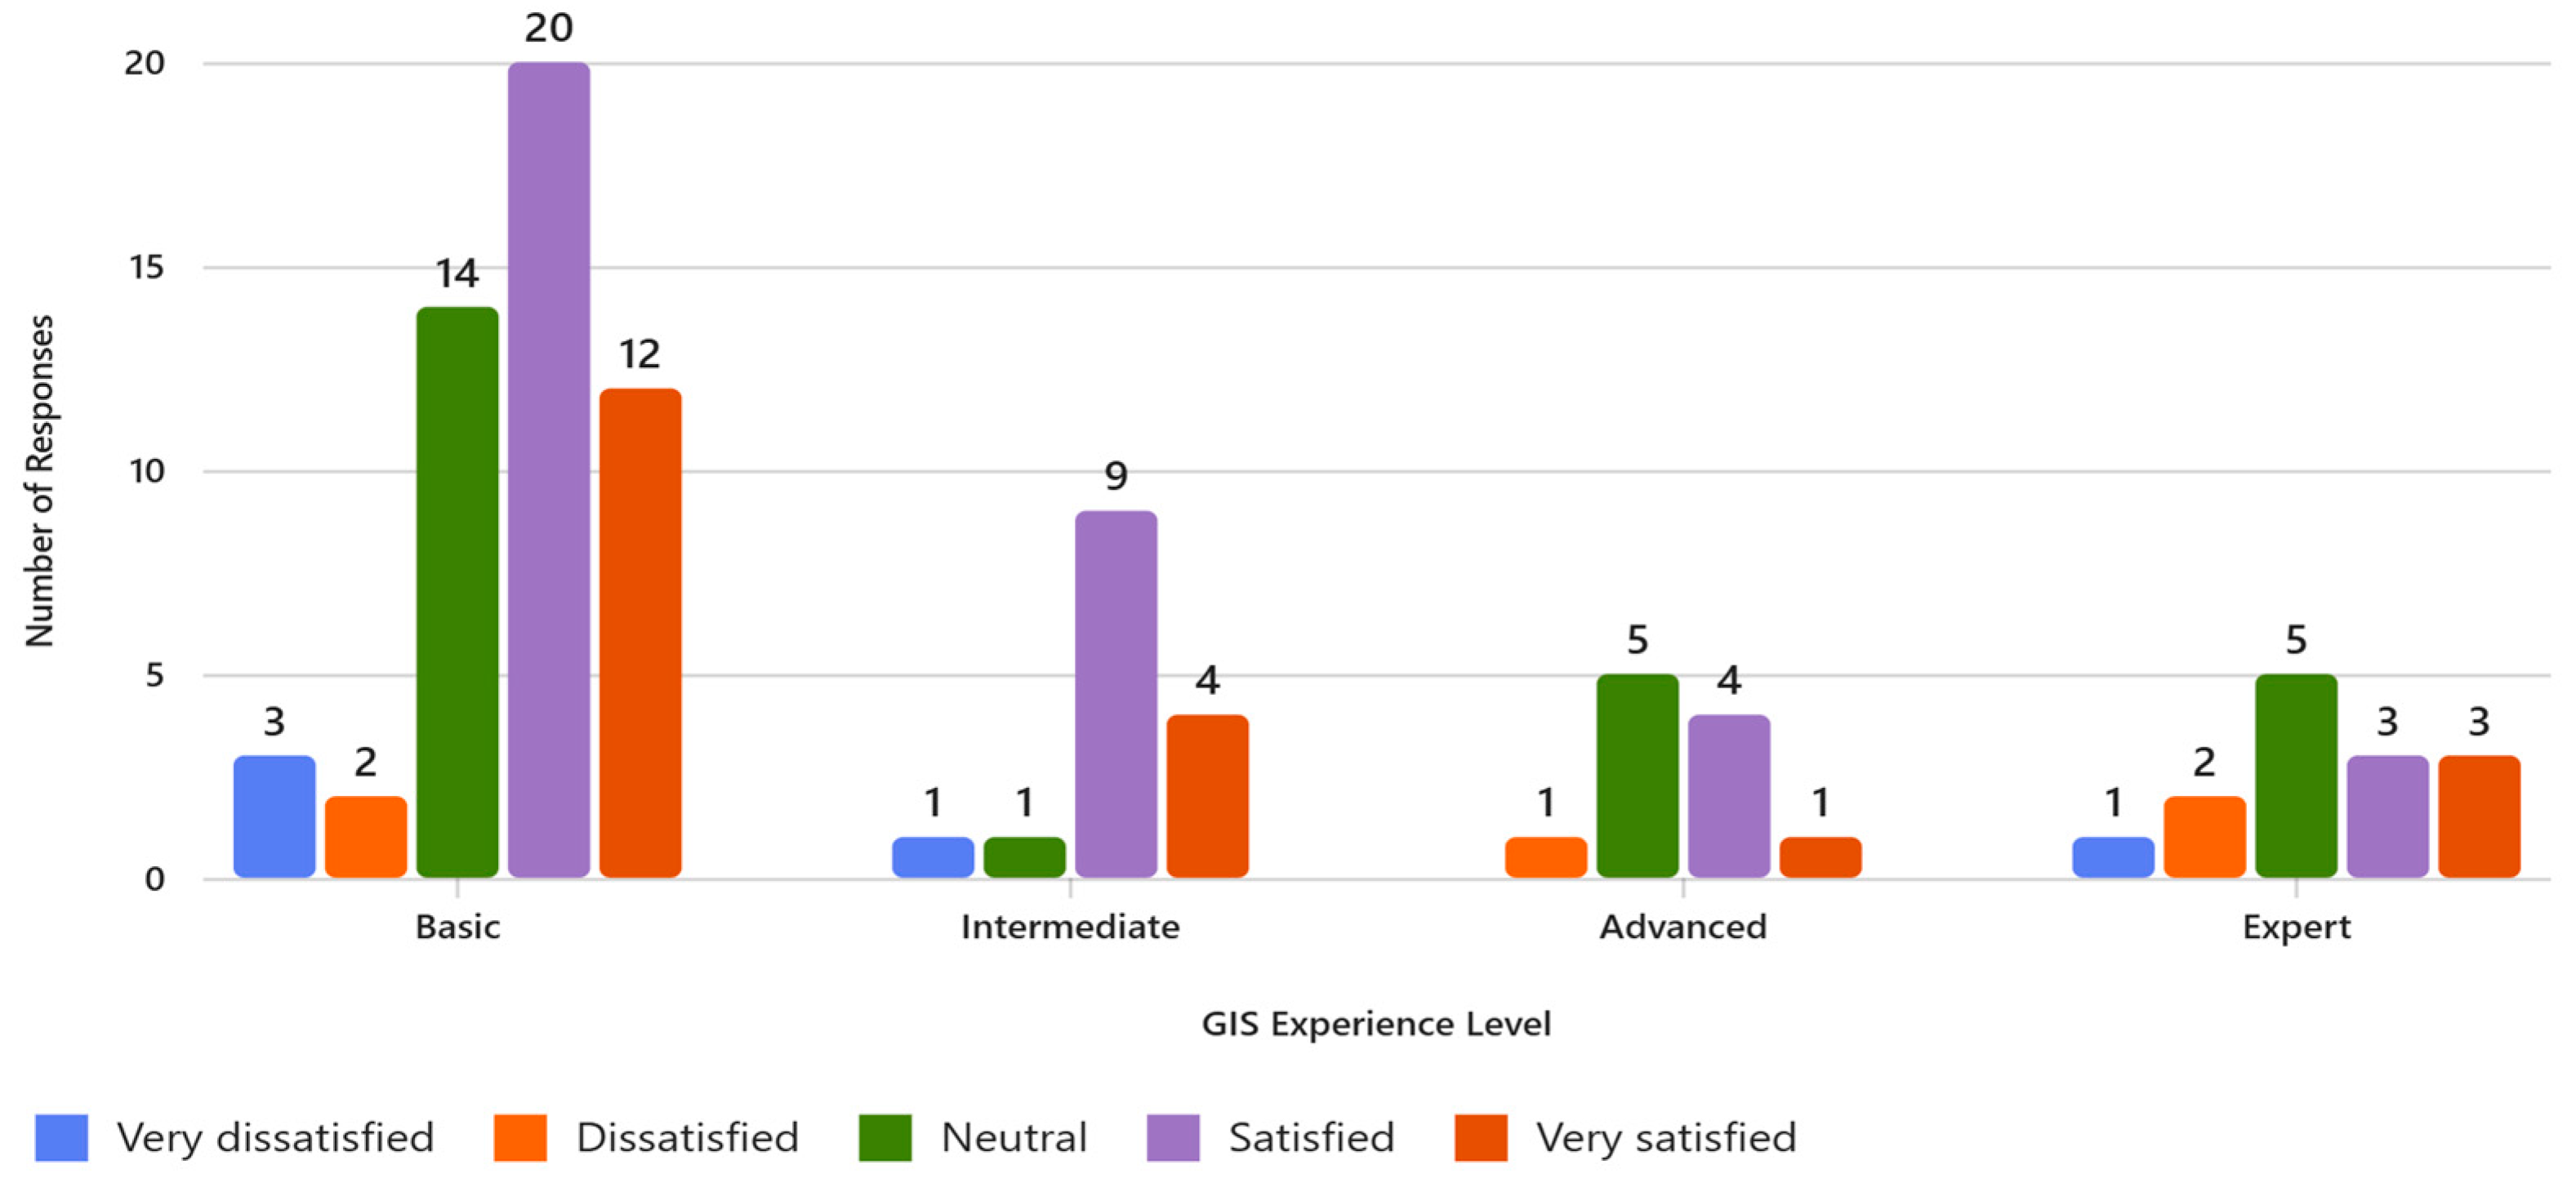
In terms of GIS proficiency, 53% of respondents reported basic experience (e.g., Google Maps), 18% intermediate (e.g., QGIS, ArcGIS Online), 16% advanced (regular spatial analysis), and 13% expert level (development or teaching of GIS tools). Most users accessed the tool via desktop or laptop computers, although mobile usage was also common and generally well-rated
Most users accessed the tool via desktop or laptop computers, although a significant number also tested it on mobile devices, with generally positive feedback regarding responsiveness and functionality.
The tool received consistently favorable evaluations across key usability dimensions. A total of 68% of respondents rated it as “easy” or “very easy” to use, while 61% found the resulting maps to be “very clear” or “extremely clear.” Regarding performance, 39% described the speed as “acceptable,” and 36% as “fast” or “very fast.” In terms of perceived usefulness, 49% considered the tool “very useful,” and 22% rated it as “extremely useful.” Overall satisfaction was also high, with 44% of participants reporting they were “satisfied” and 26% “very satisfied.” Notably, 91% of respondents indicated that they would recommend the Study Area Map Generator to others. These results suggest that the interface is generally intuitive and the tool performs reliably under typical usage conditions.
To explore whether users’ GIS experience influenced their perception of the tool, we conducted one-way ANOVA tests (checking normality and homoscedasticity before) comparing both perceived usefulness and overall satisfaction across four levels of GIS proficiency: basic, intermediate, advanced, and expert. Responses were first converted to ordinal scores to reflect the intensity of each rating. The analysis revealed no statistically significant differences in perceived usefulness among the groups (F(3, 88) = 1.37, p = 0.257), nor in satisfaction levels (F(3, 88) = 1.09, p = 0.354). These results suggest that users, regardless of their technical background, evaluated the tool in a relatively consistent manner. The satisfaction level results by Experience Level can be observed in Figure 6.
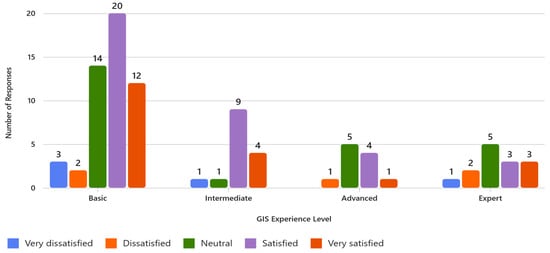
Figure 6.
Satisfaction levels by GIS experience level.
4. Discussion
The Study Area Map Generator improves reproducibility and efficiency for researchers across a wide range of disciplines. The growing availability of cloud-based platforms—such as Google Earth Engine (GEE), Google Colab, and others—has significantly expanded access to geospatial data and computational tools [27]. In this context, our application aims to be a valuable addition, offering a ready-to-use, browser-based solution for generating standardized maps. It:
- Enables rapid and automated generation of consistent, publication-ready maps;
- Reduces time and technical barriers for users without GIS expertise;
- Ensures esthetic and functional map quality suitable for scientific journals;
- Is openly available and adaptable to subnational or multi-country analyses;
- Can be embedded into teaching materials, research workflows, and science communication platforms.
The platform has already been applied in real-world contexts, including peer-reviewed manuscripts, academic theses, and policy briefs. Its intuitive user interface makes it particularly useful in educational settings, where students can explore country-level geography while learning about fundamental cartographic elements. Unlike previous tools, the Study Area Map Generator does not require technical expertise in GIS and allows users to produce publication-ready study area maps with customizable titles, basemaps, and inset views in a matter of minutes. In addition, the application is completely free to use, requires no registration, contains no advertising, and its open-source code enables researchers and institutions to improve and adapt it to their own needs. These characteristics make the tool particularly valuable in academic and educational contexts, especially in low-resource settings, while also promoting transparency, reproducibility, and collaborative development.
In line with the broader evolution of geospatial technologies, platforms like OpenStreetMap (OSM) have played a key role in democratizing access to geospatial data and enabling community-driven cartography [28]. Similarly, the open-source nature of our tool—available on GitHub—encourages collaborative development. Research groups and institutions can fork the repository to customize styling, integrate institutional branding, or extend the tool’s capabilities (e.g., adding population, land cover, or climate overlays). This aligns with contemporary efforts to promote open and reproducible science in software development and cartographic production [29,30].
From a usability standpoint, the survey results confirm that the application is accessible and functional for both novice and experienced users. The absence of significant differences in perceived usefulness and satisfaction across levels of GIS experience suggests that the tool’s interface and outputs are sufficiently intuitive to support a diverse user base. This reinforces the principle of universal usability, where improvements should focus on map clarity, export flexibility, and interface customization rather than on advanced features tailored only to expert users [31].
In practical applications, the Study Area Map Generator has been adopted by early-career researchers in Latin America, Africa, and, most recently, in Europe [32], particularly for climate vulnerability assessments and agricultural monitoring. For instance, graduate students at the University of Cuenca (Ecuador) have used the tool to produce standardized figures for thesis presentations and journal submissions. Similarly, collaborators in Senegal and Kenya have incorporated the application into regional GIS capacity-building workshops focused on climate adaptation planning. These examples demonstrate the tool’s utility in both high- and low-resource settings, particularly where access to licensed GIS software is limited.
Beyond academic use, the tool also contributes to the democratization of geospatial technologies, responding to global calls for equitable access to spatial analysis tools in research and policy [33]. Lightweight, web-based platforms like this one have proven critical for improving spatial literacy, enhancing open science workflows, and accelerating reproducible map production [34].
User feedback consistently emphasizes the tool’s time-saving potential, professional output design, and overall flexibility. As scientific journals increasingly require the inclusion of visual abstracts or geographic context figures, tools like the Study Area Map Generator are poised to become even more valuable in ensuring standardization and accelerating the production of high-quality geovisualizations.
Limitations
Several limitations should be acknowledged, especially when users attempt to zoom in more closely on the map. The OpenStreetMap (OSM) basemap in the current version can appear blurred at larger zoom levels (≈0.05°), reducing the clarity of coastlines and urban details at finer scales. In addition, the generalized coastline layer (shown in blue) does not always match the OSM basemap at these zoom levels. This occurs because the application deliberately applies geometry simplification (Douglas–Peucker algorithm) to the input data. The generalization step was implemented to reduce rendering time, lower computational load, and ensure smooth performance in the browser environment and on the free-tier hosting platform. While this approach improves responsiveness and accessibility, it sacrifices some cartographic detail, which may result in less precise representations of small geographic features.
The scale bar is currently basic and may not fully meet advanced cartographic design standards required by certain journals. Furthermore, the inset map is not always perfectly centered on the area of interest, particularly for elongated countries or island regions, sometimes leading to slight misalignment.
These limitations reflect the reliance on free and openly available resources—including OSM tiles, simplified global coastline data, and Shinyapps.io hosting—which allow the application to remain lightweight, fast, and accessible. Although these limitations exist, the tool still provides a free and open alternative for researchers and practitioners—particularly those with limited time, expertise, or financial resources—to produce standardized study area maps quickly and easily. Future versions will explore the integration of premium or cached high-resolution tiles, improved scale-bar rendering, refined inset-map centering, and an optional “high-resolution mode” to enhance cartographic quality while maintaining usability and accessibility.
5. Conclusions
This study presents the Study Area Map Generator, a lightweight, open-source web application designed to facilitate the automated creation of publication-ready country- and city-level maps. Developed using Shiny for Python and integrating widely used geospatial libraries, the tool provides a user-friendly interface for researchers with or without GIS expertise. By allowing rapid customization of titles, basemaps, labels, and inset views, the tool streamlines cartographic workflows and contributes to improving the reproducibility and visual quality of geographic visualizations in scientific outputs.
The usability survey involving participants from diverse geographic and professional backgrounds confirmed that the tool is intuitive, functional, and well-suited to various academic and educational use cases. Real-world adoption by researchers and students in Latin America, Africa, and Europe further supports its global applicability and relevance, especially in low-resource contexts where access to commercial GIS software is limited.
By aligning with open science principles and promoting broader access to cartographic production, the Study Area Map Generator contributes meaningfully to democratizing geospatial technologies. Future developments will focus on enabling subnational mapping, integrating thematic overlays, enhancing export options, and supporting multilingual interfaces to extend further the usability and impact of the application across disciplines and regions, and improve it based on user feedback.
Author Contributions
Conceptualization, Cesar Ivan Alvarez and Juan Gabriel Mollocana-Lara; methodology, Cesar Ivan Alvarez; software, Cesar Ivan Alvarez and Juan Gabriel Mollocana-Lara; validation, Izar Sinde-González and Ana Claudia Teodoro; formal analysis, Cesar Ivan Alvarez and Izar Sinde-González; investigation, Cesar Ivan Alvarez and Juan Gabriel Mollocana-Lara; data curation, Izar Sinde-González; writing—original draft preparation, Cesar Ivan Alvarez and Juan Gabriel Mollocana-Lara; writing—review and editing, Cesar Ivan Alvarez, Juan Gabriel Mollocana-Lara, Izar Sinde-González and Ana Claudia Teodoro; visualization, Cesar Ivan Alvarez and Izar Sinde-González; supervision, Ana Claudia Teodoro; funding acquisition, Juan Gabriel Mollocana-Lara All authors have read and agreed to the published version of the manuscript.
Funding
This research received no external funding.
Informed Consent Statement
Informed consent was obtained from all subjects involved in the study.
Data Availability Statement
The source code and sample outputs of the Study Area Map Generator are openly available at https://github.com/osoivan/country-map-generator (accessed on 23 July 2025). The online application can be accessed at https://cesarivanalvarez.shinyapps.io/country-map/ (accessed on 23 July 2025).
Acknowledgments
We thank the research team for all the help and support provided while developing this work.
Conflicts of Interest
The authors declare no conflicts of interest.
Abbreviations
The following abbreviations are used in this manuscript:
| GIS | Geographic Information System |
| FAIR | Findable, Accessible, Interoperable, and Reusable |
| ANOVA | Analysis Of Variance |
References
- Yang, J.; Huang, X. 30 m annual land cover and its dynamics in China from 1990 to 2019. Earth Syst. Sci. Data Discuss. 2021, 13, 1–29. [Google Scholar]
- Karra, K.; Kontgis, C.; Statman-Weil, Z.; Mazzariello, J.C.; Mathis, M.; Brumby, S.P. Global land use/land cover with Sentinel 2 and deep learning. In Proceedings of the 2021 IEEE International Geoscience and Remote Sensing Symposium IGARSS, Brussels, Belgium, 11–16 July 2021; IEEE: Piscataway, NJ, USA, 2021; pp. 4704–4707. [Google Scholar]
- Jia, J.S.; Lu, X.; Yuan, Y.; Xu, G.; Jia, J.; Christakis, N.A. Population flow drives spatio-temporal distribution of COVID-19 in China. Nature 2020, 582, 389–394. [Google Scholar] [CrossRef] [PubMed]
- Alvarez-Mendoza, C.I.; Teodoro, A.; Freitas, A.; Fonseca, J. Spatial estimation of chronic respiratory diseases based on machine learning procedures—An approach using remote sensing data and environmental variables in Quito, Ecuador. Appl. Geogr. 2020, 123, 102273. [Google Scholar] [CrossRef]
- Venter, Z.S.; Brousse, O.; Esau, I.; Meier, F. Hyperlocal mapping of urban air temperature using remote sensing and crowdsourced weather data. Remote Sens. Environ. 2020, 242, 111791. [Google Scholar] [CrossRef]
- Viera-Torres, M.; Sinde-González, I.; Gil-Docampo, M.; Bravo-Yandún, V.; Toulkeridis, T. Generating the baseline in the early detection of bud rot and red ring disease in oil palms by geospatial technologies. Remote Sens. 2020, 12, 3229. [Google Scholar] [CrossRef]
- Alvarez-Mendoza, C.I.; Guzman, D.; Casas, J.; Bastidas, M.; Polanco, J.; Valencia-Ortiz, M.; Montenegro, F.; Arango, J.; Ishitani, M.; Selvaraj, M.G. Predictive modeling of above-ground biomass in brachiaria pastures from satellite and UAV imagery using machine learning approaches. Remote Sens. 2022, 14, 5870. [Google Scholar] [CrossRef]
- Harrower, M.; Brewer, C.A. ColorBrewer.org: An online tool for selecting colour schemes for maps. Cartogr. J. 2003, 40, 27–37. [Google Scholar] [CrossRef]
- Salgado, L.; González, L.M.; Gallego, J.L.R.; López-Sánchez, C.A.; Colina, A.; Forján, R. Mapping Soil Organic Carbon in Degraded Ecosystems Through Upscaled Multispectral Unmanned Aerial Vehicle–Satellite Imagery. Land 2025, 14, 377. [Google Scholar] [CrossRef]
- QGIS Development Team. QGIS Geographic Information System, version 3.34; Open Source Geospatial Foundation Project: Chicago, IL, USA, 2025.
- Esri. ArcGIS Pro [Software de Sistema de Información Geográfica], versión 3.5; Environmental Systems Research Institute: Redlands, CA, USA, 2025. Available online: https://www.esri.com (accessed on 23 July 2025).
- Kraak, M. Cartographic principles. In Web Cartography; Taylor & Francis: London, UK, 2001; pp. 53–71. [Google Scholar]
- Heidari, N.; Schwippert, K.; Sprenger, S. Thinking. Speaking. Producing. Maps: Linking cartographic concepts and cartography-specific language use. Int. Res. Geogr. Environ. Educ. 2024, 1–23. [Google Scholar] [CrossRef]
- Lamprecht, A.L.; Garcia, L.; Kuzak, M.; Martinez, C.; Arcila, R.; Martin Del Pico, E.; Del Angel, V.D.; van de Sandt, S.; Ison, J.; Martinez, P.A.; et al. Towards FAIR principles for research software. Data Sci. 2020, 3, 37–59. [Google Scholar] [CrossRef]
- Kush, R.D.; Warzel, D.; Kush, M.A.; Sherman, A.; Navarro, E.A.; Fitzmartin, R.; Pétavy, F.; Galvez, J.; Becnel, L.; Zhou, F.; et al. FAIR data sharing: The roles of common data elements and harmonization. J. Biomed. Inform. 2020, 107, 103421. [Google Scholar] [CrossRef]
- Nivala, A.M.; Sarjakoski, L.T.; Sarjakoski, T. Usability methods’ familiarity among map application developers. Int. J. Hum.-Comput. Stud. 2007, 65, 784–795. [Google Scholar] [CrossRef]
- Norheim, R.A. Cartographic standards and practice in academic journals. In Proceedings of the ESRI International User Conference, San Diego, CA, USA, 23–27 July 2012; pp. 21–25. [Google Scholar]
- Ziemann, M.; Poulain, P.; Bora, A. The five pillars of computational reproducibility: Bioinformatics and beyond. Brief. Bioinform. 2023, 24, bbad375. [Google Scholar] [CrossRef] [PubMed]
- Posit, P.B.C. Shiny for Python [Software], version 0.6.2; Posit, PBC: Boston, MA, USA, 2023. Available online: https://shiny.posit.co/py (accessed on 23 July 2025).
- McNamara, A. Building Maps on the Web Using RStudio, Leaflet, & Shiny. In Proceedings of the ACM SIGGRAPH 2023 Labs, Los Angeles, CA, USA, 6–10 August 2023; pp. 1–2. [Google Scholar]
- Jordahl, K.; den Bossche, J.V.; Fleischmann, M.; Wasserman, J.; McBride, J.; Gerard, J.; Tratner, J.; Perry, M.; Garcia Badaracco, A.; Farmer, C.; et al. GeoPandas: Python Tools for Geographic Data [Software]; GeoPandas Development Team: Austin, TX, USA, 2024; Available online: https://geopandas.org (accessed on 23 July 2025).
- Met Office. Cartopy: A Cartographic Python Library with Matplotlib Support [Software], version 0.22.0; Met Office: Exeter, UK, 2010. Available online: https://scitools.org.uk/cartopy (accessed on 23 July 2025).
- Hunter, J.D. Matplotlib [Software], version 3.8.0; Matplotlib Development Team: Houston, TX, USA, 2003. Available online: https://matplotlib.org (accessed on 23 July 2025).
- Vicente-Saez, R.; Gustafsson, R.; Van den Brande, L. The dawn of an open exploration era: Emergent principles and practices of open science and innovation of university research teams in a digital world. Technol. Forecast. Soc. Chang. 2020, 156, 120037. [Google Scholar] [CrossRef]
- Yeganeh, S.H.; Tootoonchian, A.; Ganjali, Y. On scalability of software-defined networking. IEEE Commun. Mag. 2013, 51, 136–141. [Google Scholar] [CrossRef]
- Douglas, D.H.; Peucker, T.K. Algorithms for the reduction of the number of points required to represent a digitized line or its caricature. Cartogr. Int. J. Geogr. Inf. Geovisualization 1973, 10, 112–122. [Google Scholar] [CrossRef]
- Alvarez, C.I.; Govind, A. Environmental and climate variability in Senegal over the last two decades: A remote sensing approach to assessing climate vulnerability in a Sahelian country. Remote Sens. Appl. Soc. Env. 2025, 38, 101584. [Google Scholar] [CrossRef]
- Herfort, B.; Lautenbach, S.; Porto de Albuquerque, J.; Anderson, J.; Zipf, A. The evolution of humanitarian mapping within the OpenStreetMap community. Sci. Rep. 2021, 11, 3037. [Google Scholar] [CrossRef]
- Coetzee, S.; Ivánová, I.; Mitasova, H.; Brovelli, M.A. Open Geospatial Software and Data: A Review of the Current State and A Perspective into the Future. ISPRS Int. J. Geo-Inf. 2020, 9, 90. [Google Scholar] [CrossRef]
- Quarati, A.; De Martino, M.; Rosim, S. Geospatial Open Data Usage and Metadata Quality. ISPRS Int. J. Geo-Inf. 2021, 10, 30. [Google Scholar] [CrossRef]
- MacEachren, A.M.; Kraak, M.J. Research challenges in geovisualization. Cartogr. Geogr. Inf. Sci. 2001, 28, 3–12. [Google Scholar] [CrossRef]
- Çetin, M. Orman yangını yönetiminde Google Earth Engine (GEE) ve Python Engine (PE) ile yakıt yükü analizi: Karşılaşılan güçlükler ve sağlanan avantajlar. J. Anatol. Geogr. 2025, 2, 63–81. [Google Scholar]
- Goodchild, M.F. Citizens as sensors: The world of volunteered geography. GeoJournal 2007, 69, 211–221. [Google Scholar] [CrossRef]
- Al-Yadumi, S.; Xion, T.E.; Wei, S.G.W.; Boursier, P. Review on Integrating Geospatial Big Datasets and Open Research Issues. IEEE Access 2021, 9, 10604–10620. [Google Scholar] [CrossRef]
Disclaimer/Publisher’s Note: The statements, opinions and data contained in all publications are solely those of the individual author(s) and contributor(s) and not of MDPI and/or the editor(s). MDPI and/or the editor(s) disclaim responsibility for any injury to people or property resulting from any ideas, methods, instructions or products referred to in the content. |
© 2025 by the authors. Published by MDPI on behalf of the International Society for Photogrammetry and Remote Sensing. Licensee MDPI, Basel, Switzerland. This article is an open access article distributed under the terms and conditions of the Creative Commons Attribution (CC BY) license (https://creativecommons.org/licenses/by/4.0/).

