Abstract
Iraq, including the investigated watershed, has endured destructive floods and drought due to precipitation variability in recent years. Protecting susceptible areas from flooding and ensuring water supply is essential for maintaining basic human needs, agricultural production, and industry development. Therefore, locating and constructing storage structures is a significant initiative to alleviate flooding and conserve excessive surface water for future growth. This study aims to identify suitable locations for Runoff Harvesting (RH) and dam construction in the Hami Qeshan Watershed (HQW), Slemani Governorate, Iraq. We integrated in situ data, remotely sensed images, and Multi-Criteria Decision Analysis (MCDA) approaches for site selection within the Geographical Information Systems (GIS) environment. A total of ten criteria were employed to generate the RH suitability maps, including topographic position index, lithology, slope, precipitation, soil group, stream width, land cover, elevation, distance to faults, and distance to town/city. The weights of the utilized factors were determined via Weighted Linear Combination (WLC) and Analytic Hierarchy Process (AHP). The resulting RH maps were validated through 16 dam sites preselected by the Ministry of Agriculture and Water Resources (MAWR). Findings showed that the WLC method slightly outperformed AHP regarding efficiency and exhibited a higher overall accuracy. WLC achieved a higher average overall accuracy of 69%; consequently, it was chosen to locate new multipurpose dams for runoff harvesting in the study area. The overall accuracy of the 10 suggested locations in HQW ranged between 66% and 87%. Two of these sites align with the 16 locations MAWR has recommended: sites 2 and 5 in the northwest of HQW. It is noteworthy that all MAWR dam sites were situated in medium to excellent RH zones; however, they mostly sat on ineffective geological localities. It is concluded that a careful selection of the predictive factors and their respective weights is far more critical than the applied methods. This research offers decision-makers a practical and cost-effective tool for screening site suitability in data-scarce rugged terrains.
1. Introduction
Iraq confronts severe water challenges as a result of internal as well as external factors, such as ineffective management of its water resources, internal disputes over politics, and tense ties with its neighbors, particularly Iran, Turkey, and Syria [1]. The average surface water discharged to Iraq through the Tigris and Euphrates Rivers is anticipated to decline harshly by 2040 [2]. Moreover, the country experienced fast population growth in the past few decades, with a considerable expansion from 16.33 million in 1987 to 38.12 million in 2018 [3,4]. This growing population manifested in increased daily water consumption to meet the requirements of evolving economies, agriculture, and living standards. The absence of and non-compliance with regional and international treaties on shared water resources among riparian countries is another crucial problem reflected in water shortage in downstream countries, such as Iraq. Subsequently, the crisis over water resources is an inevitable threat that humankind will likely pass through in the foreseeable future [1,5,6]. Almost certainly as a result of climate change, variations in quantity and spatial distribution of precipitation have augmented the frequency and severity of weather extremes (i.e., floods and droughts), resulting in undesired socioeconomic and environmental repercussions in the regions concerned [7,8,9,10]. This complicated combination requires integrative and innovative strategies to alleviate flooding and water deficiency and ensure sustainable freshwater resource management.
Runoff Harvesting (RH) is an ancient practice in Middle East countries to counter drought seasons by constructing barriers or dams on stream courses to collect and store runoff water for later usage [11,12]. Dams are natural impediments or built structures that cross rivers and promote surface water levels by regulating or obstructing normal water flow. Although dam construction increases emitted greenhouse gases (e.g., CO2 and CH4) into the atmosphere, destabilizes ecosystems, disturbs runoff and sediment dynamics in the lower reaches, and traps deposits, it provides multiple benefits and advantages such as flood protection, secure water supply, crop irrigation, hydropower generation, aquaculture, groundwater recharge, soil moisture conservation, recreational development, and local community prosperity [13,14,15,16,17,18,19,20,21,22]. In other words, the economic merits of dams compensate for the construction/operation costs and relevant detriments [23]. However, not all dam construction procedures (e.g., site selection) are based on a scientific decision-making method. For instance, political variables could lead to neglecting systematic and technical aspects of ideal dam site selection. Inappropriate dam siting might cause adverse effects on processes such as runoff, erosion, and sedimentation, resulting in subsidence (e.g., Mosul Dam, Iraq) [24], landslides (e.g., Vajont Dam, Italy) [25], and mudflows (e.g., Brumadinho Tailings Dam, Brazil) [26], which eventually threaten downstream residents and ecosystems [27,28]. Therefore, analyzing and selecting suitable locations to construct new dams based on detailed scientific techniques are substantial procedures to conserve and manage water resources safely and efficiently.
Due to the progress and accessibility of computational systems and satellite products, identifying appropriate sites for dam construction has become an attractive and competitive practice in recent years [29]. The integrated approach involving Remotely Sensed (RS) data, Geographical Information Systems (GIS) techniques, and Multi-Criteria Decision Analysis (MCDA) is currently emerging as a powerful package to handle different terrain characteristics and hydrologic processes [30,31,32,33]. RS images and their advanced characteristics (e.g., spectral resolution) represent an integral tool that enables researchers to evaluate and monitor various water-related aspects (i.e., availability, quantity, and quality), as well as environmental concerns at different spatiotemporal scales [34]. GIS is a highly powered and still-evolving tool to store, visualize, convert, and analyze vast digital datasets efficiently and quickly. It is a potent and widely used system for generating geological maps and interpolating groundwater quality [35]. It is noteworthy that GIS also supports spatial optimization and location models that can find the best solutions to geographic decision problems under firmly defined circumstances [36,37]. On the other hand, MCDA techniques, such as Weighted Linear Combination (WLC) [38] and Analytic Hierarchy Process (AHP) [39], are among the frequently applied approaches to determine the relative rank of multiple interrelated factors, based on decision-making priorities, for different site selection projects (e.g., dams, landslides, groundwater recharge zonation, landfills, and civil defense centers) [4,40,41,42,43].
A topical literature review reveals that numerous regional and worldwide studies have developed and employed various MCDA approaches, combined with in situ measurements, RS data, hydrologic models, and GIS techniques, to identify optimal sites for runoff harvesting and dam construction (Table 1). In addition, determining suitable criteria is another significant element in effectively implementing MCDA and geospatial techniques for mapping potential RH zones [44]. According to the Food and Agriculture Organization (FAO), six influential factors were identified to categorize RH areas: topography, climate, hydrology, soil, agronomy, and socioeconomic criteria [45,46]. The most prominent criteria used in the reviewed articles to determine suitable locations for RH and multipurpose dams, as a percentage, were: slope (100%), land use/land cover (82%), soil (77%), rainfall/precipitation (64%), roads (55%), runoff (50%), drainage density (41%), geology/lithology, faults, and settlements (36%), elevation as a thematic layer (32%), stream order and rivers (27%), villages (18%), discharge, lineaments, sediment yield, topographic wetness index, and wells (14%). The remaining criteria (e.g., geomorphology, distance to existing dams, hypsometry, cost, temperature, evaporation, and erosion) were cited in less than 10% of these publications.

Table 1.
A literature review on frequently used approaches to identify suitable RH and dam sites.
The torrential rainfall and subsequent floods of spring 2019 that hit Iraq and neighboring countries [56,59] raised water levels in the Tigris River and its tributaries (Figure 1a). Consequently, water management features such as Dukan Reservoir (DR) reached its maximum safe storage capacity. In addition, the excessive flooding considerably damaged various agricultural fields and infrastructures and caused temporary human displacement (Figure 1b). These dramatic episodes inspired us to determine potential sites for RH and dam construction upstream of DR to prevent the adverse impacts of flood waters and secure aquatic demands for stable development in the Hami Qeshan Watershed (HQW), a mountainous catchment in the Iraqi Kurdistan Region (IKR) (Figure 2). Hereafter, the objectives of this study are threefold: (1) to create RH suitability maps based on the WLC and AHP models, (2) to validate the results attained through 16 preselected dam locations, and (3) to propose optimal sites for constructing new dams in HQW (Figure 2). Ten evaluative criteria were implemented to generate the RH maps and assess optimum dam siting: topographic position index, lithology, slope, stream width, precipitation, soil group, land cover, elevation, distance to faults, and distance to town/city. Although HQW has important characteristics for sustainable development, no studies have investigated surface runoff harvesting and dam siting based on in situ data, RS images, MCDA, and GIS. Therefore, our findings are anticipated to fill a significant gap in the scientific literature on improving surface water management through dam/reservoir site selection and flood effects mitigation.
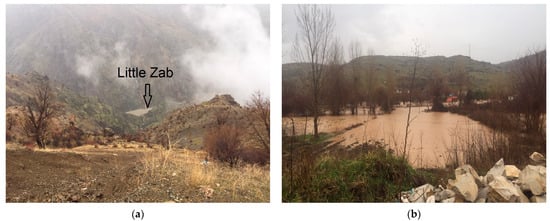
Figure 1.
Photographs depicting the extent of the flooding that happened in April 2019: (a) Elevated water level in the Little Zab River at the Iraqi-Iranian border; (b) Flooded agricultural land south of Chwarta town (images captured by the author). The location of these two field photographs is displayed in Figure 2.
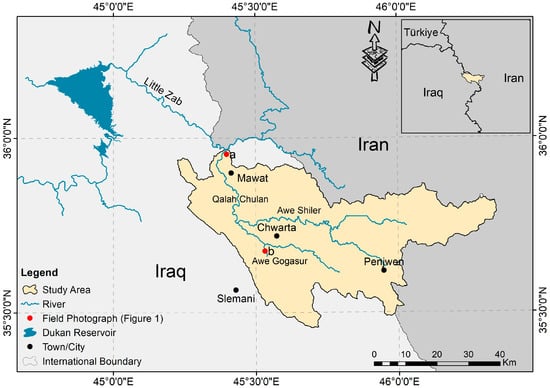
Figure 2.
The geographical location of HQW in Slemani Governorate, Kurdistan Region, Iraq.
2. Materials and Methods
2.1. Study Area
The mountainous HQW, the largest subbasin of the Little Zab River Basin (LZRB) within the Kurdistan Region, is situated in the far northeast of Iraq [60]. Geographically, it lies in Slemani Governorate between latitudes 35°27′19″ N and 35°57′56″ N and longitudes 45°13′32″ E and 46°20′57″ E (Figure 2). The study area covers about 2600 km2, including Penjwen, Chwarta, Mawat, and 560 villages. Also, this research excludes the eastern portion (i.e., 396 km2) of the drainage basin that is situated beyond the Iraqi border. The HQW was selected due to its significance in water resources, agricultural productivity, and recreational nature. The cultivation of crops, nuts, and fruits (e.g., barley, walnuts, and pomegranates) is dominant in the plain north of Penjwen and the surrounding mountains [61]. The elevation in the Hami Qeshan Watershed ranges from 632 m to 2755 m, and the slopes vary between flat and 76 degrees.
The climate of HQW is characterized by hot-dry summer and wet-humid winter, with substantial seasonal variability in precipitation, temperature, and potential evapotranspiration. From 2004 to 2018, the study area received average annual precipitation of 1057 mm through rainfall and snowfall. The precipitation mainly occurs from October to May; the highest average monthly precipitation of 207 mm was recorded in January. Similarly, the monthly mean temperature fluctuated between −0.5 °C in January and 27.9 °C in July. The Qala Chulan River (QCR), a sixth-order stream, is formed simply by the confluence of the Awe Gogasur and Awe Shiler Rivers. Further, QCR flows from east to northwest and joins the Little Zab River near Avcourta village. Rainwater, snowmelt, and springs are substantial feeding sources of these waterways, resulting in peak discharge in springtime and declining flow from June through September.
2.2. Conceptual Methodology
This study employs ten factors in addition to the WLC and AHP techniques to identify suitable sites for RH and dam construction in the GIS environment, as shown in Figure 3. The utilized criteria are Lithology (LI), Topographic Position Index (TPI), Slope (SP), Stream Width (SW), Precipitation (PCP), Soil Group (SG), Elevation (EL), Land Cover (LC), Distance to Faults (DF), and Distance to Town/City (DTC). The methodology consists of nine essential stages: (1) selection of criteria and preparation of raster layers, (2) reclassification of thematic maps in GIS, (3) assigning weights to all layers based on WLC and AHP, (4) integration of thematic layers using the weighted overlay technique in GIS, which eventually generates RH suitability maps, (5) applying the natural break (Jenks) scheme to classify the resulting suitability maps into five classes: excellent, high, moderate, low, and unsuitable, (6) validation of results through preselected dam sites, (7) choosing the best model, (8) proposing new dam/reservoir locations, and (9) analyzing proposed dam/reservoir properties. All the stages are thoroughly explained in Section 2.3, Section 2.4, Section 2.5 and Section 2.6.
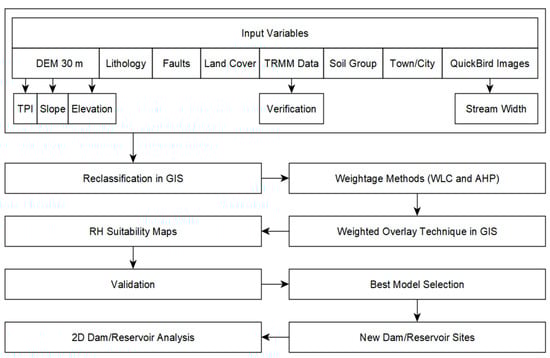
Figure 3.
Conceptual framework applied in this study.
2.3. Data Acquisition
In situ station measurements, RS data, and statistical models (i.e., WLC and AHP) were integrated into GIS to map potential RH suitability areas and determine optimum dam sites in the Hami Qeshan Watershed. As described in Section 2.2, ten influential factors were used to achieve these goals. The lithology and faults maps of HQW were prepared based on a printout of the geological map attained from Iraq Geological Survey (GEOSURV) at a 1:250,000 scale [62]. Further, both maps were first scanned at 300 dpi and then digitized and georeferenced in the GIS environment. The Copernicus Digital Elevation Model (CDEM), with a 30 m pixel resolution, was downloaded from the OpenTopography webpage [63]. In addition, CDEM was used to delineate the watershed boundary and extract the slope, drainage network, topographic position index, and elevation maps. The land cover map of HQW was obtained from GEOSURV at a 30 m raster resolution [64].
Two administrative layers (i.e., town/city and villages) were obtained in shapefile format from the Humanitarian Data Exchange platform [65]. As an alternative to discharge data, QuickBird images were used to generate the stream width layer in the ungauged HQW. The soil characteristics map was gathered from the Harmonized World Soil Database (HWSD) in raster format (30 arc-second) [66]. Due to the uneven distribution of rain gauges in the Hami Qeshan Watershed, the monthly Tropical Rainfall Measuring Mission (TRMM) 3B43-V7 dataset [67] was used for developing the precipitation layer. Also, TRMM possesses a spatial resolution of 0.25° × 0.25° [68] and has been verified and applied in different studies [69,70,71,72]. Preselected dam site data in HQW were collected from the Ministry of Agriculture and Water Resources (MAWR), IKR [73]. All thematic layers were reprojected to zone 38 north of the Universal Transverse Mercator (UTM) and resampled to 30 m spatial resolution.
2.4. Statistical Model
Although there are a variety of MCDA techniques, none are best suited for all kinds of decision-making circumstances [74,75]. Moreover, a critical characteristic of MCDA is that different methodologies might produce different outcomes when applied to a single problem [76]. As a result, choosing an ideal MCDA approach is challenging, and careful method selection should be emphasized [77]. Many legitimate examples of comparative assessments of various MCDA methods are found in the literature (Table 1). In this research, we utilized WLC and AHP techniques to determine the weighting/ranking of the evaluative factors for identifying proper RH areas and new dam sites in HQW (Table A1 and Table A2 in Appendix A). Accordingly, two RH suitability maps were obtained for the study area. Each suitability map was categorized based on the Jenks classification into five classes: unsuitable, low, moderate, high, and excellent. Results were eventually validated using 16 preselected dam locations in the ArcMap environment.
2.4.1. Weighted Linear Combination (WLC)
The WLC model has been previously adopted in several studies [47,49,51,54]. It standardizes numerous criteria to a comparable numeric range and then combines them based on a weighted average [78]. WLC is performed in five basic steps: (1) assigning weights to all criteria based upon their relative significance for locating RH areas; the higher weight, the more influential the factor, and vice versa, (2) classifying each criterion into five suitability classes: 5 = excellent, 4 = high, 3 = moderate, 2 = low, and 1 = unsuitable, (3) multiplying the weight of each criterion by the respective sub-criterion classes, (4) normalizing all resultant values, and (5) combining all thematic layers in the raster calculator of ArcMap and generating the final RH suitability map. As shown in Table A1 in Appendix A, weights of criteria (i.e., column “Criterion Weight%”) and classes of sub-criteria (i.e., column “Class”) were essentially defined based on published literature (Table 1) and the authors’ expertise. Hence, the summation of all criteria, as proposed by Drobne and Lisec [38], is achieved after Equation (1):
where RHS is the runoff harvesting suitability, wi denotes the weight of criterion i (Table A1, column “Criterion Weight%”), and xi refers to the class of sub-criterion i (Table A1, column “Class”).
2.4.2. Analytic Hierarchy Process (AHP)
Saaty published many articles and books on the AHP method and its applications [39,79,80,81,82]. AHP is the most frequently applied mathematical technique for analyzing and organizing complex multi-criteria decisions in a hierarchical structure. It empowers decision-makers to intuitively incorporate subjective knowledge and practice through pairwise comparisons to define parameters’ standard weights [81,83,84]. The AHP approach calculates each criterion weight and assigns distinct rankings to the range of sub-criteria in a given thematic layer based on the relative importance among all elements [85]. In this study, we identified potential RH areas in HQW by applying the AHP approach to ten thematic layers (i.e., Section 2.2). According to the fundamental scale of Saaty (Table 2), each variable was assigned a score for the pairwise comparisons between 1 and 9 based on its significance in comparison to the remaining variables.
Table 2.
The ranking scale of the AHP approach [86].
To sum up, the AHP technique consists of five stages [87]: (1) defining a multi-criteria problem, (2) structuring a hierarchy (a literature review, field research, and expert judgment help determine the criteria of the hierarchy), (3) building pairwise comparison matrices (Table 3), (4) normalizing pairwise comparison matrices (Table 4), and (5) calculating the Consistency Ratio (CR). The consistency of the decision-makers’ assessments is accepted if the CR is below 0.1 [88]. Also, the Consistency Index (CI) was utilized to evaluate the matrix’s consistency. Hence, the CI and CR were computed following Equations (2) and (3) [89]:
where CI indicates the consistency index, n represents the number of criteria, λmax denotes the maximum eigenvalue of a matrix, CR refers to the consistency ratio, and RI symbolizes the random index value that differs as per the number of criteria used. The RI utilized (Table 4) was based on the classification of Saaty [90].
Table 3.
Pairwise comparison matrix for the used criteria.
Table 4.
Normalized weights for the applied criteria.
As shown in Table 4, the eigenvalues of each matrix element were normalized; subsequently, the relative weight of each criterion was determined. Also, each sub-criterion of a thematic map was assigned a rank of 1–9 based on its impact on identifying appropriate RH zones [4,15,20,29,31]. The rankings of a sub-criterion indicated the following RH capabilities: 9 = excellent, 7 = high, 5 = moderate, 3 = low, and 1 = unsuitable. Thus, all criteria and sub-criteria were given weights and ranks, respectively (Table A2 in Appendix A). Lastly, the RH suitability map was generated in the ArcMap environment using Equation (4) [48,53]:
where RHS is the runoff harvesting suitability, TPI denotes the topographic position index, LI indicates the lithology, SW represents the stream width, SP refers to the slope, PCP stands for the precipitation, SG symbolizes the soil group, EL signalizes the elevation, LC refers to the land cover, DF marks the distance to faults, and DTC refers to the distance to town/city. In addition, c and sc are a criterion’s weight and a sub-criterion’s rank, respectively.
2.5. Evaluative Criteria
2.5.1. Geological Criteria
Geological characteristics in a particular region affect the stability and capability of dams to store water [4,91]. Therefore, we used two essential geological factors for this study to identify the best runoff harvesting areas: lithology and distance to faults [62]. Figure 4a shows 19 lithological units in the Hami Qeshan Watershed, encompassing diverse rock types. Tectonically, HQW is situated in the Zagros Suture Zone and part of the High Folded Zone [92,93]. All lithological units and their suitability for RH are described in Table 5 [94]. The WLC classes of a sub-criteria ranged from 1 to 5, whereas the AHP ranks ranged from 1 to 9. In addition, the lithology criterion was assigned a weight of 13 in both models (i.e., WLC and AHP). The weightage and class/rank of the lithology layer are illustrated in Table A1 and Table A2 of Appendix A.
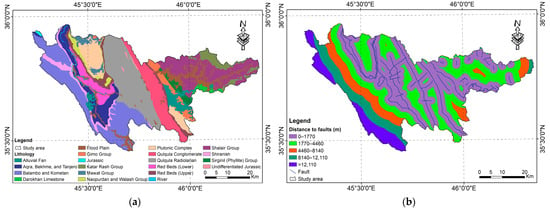
Figure 4.
Maps of the criteria: (a) Lithological units; (b) Distance to faults in the study area.
Table 5.
A concise description of all lithological units and geological formations in HQW [94].
It is recommended to locate a dam site at least 100 m from tectonic fractures and faults [29,95]. Therefore, an area with faults along a river course must be omitted from probable dam sites [96]. For this study, the map of active faults (i.e., distance to faults) was first converted from vector to raster format. After that, the Euclidean distance to the nearest faults was computed for each cell. HQW contains 47 fault segments, of which ten are normal faults, 15 are thrust faults, and the remainder are uncategorized. The length of faults ranges from 0.4 to 106 km, totaling 437.6 km. Remarkably, most of these faults are oriented in the NW-SE direction (Figure 4b) due to the collision of the Arabian and Iranian plates that ultimately formed the Zagros Mountains chain [93]. As shown in Table A1 and Table A2 of Appendix A, the distance to faults exceeds 12,110 m; the farther a site is from faults, the more suitable for constructing a dam, and vice versa.
2.5.2. Topographic Criteria
We used CDEM, with a 30 m pixel resolution, to derive three topographic aspects: TPI, slope, and elevation. As a landform indicator, TPI calculates the difference between the elevation at a central pixel (Ec) in CDEM and the average elevation in specific neighboring pixels (Ea) within a predefined radius [97,98]. The topographic features of a watershed significantly affect flow velocity, runoff generation, and sediment transport [99]. TPI is frequently applied in various research fields, such as hydrology, geomorphology, groundwater recharge, agriculture, wildlife management, and archaeology. Equations (5) and (6) illustrate the mathematical statements for computing TPI [100]:
where Ei is the elevation of the cell (i) within the kernel-matrix (M), which comprises the total number of cells (n).
According to [15,101], a positive TPI shows that the central pixel possesses a higher elevation than its average neighboring pixels (e.g., hill). In contrast, a negative value indicates that the central pixel has a lower elevation than its average surrounding neighbors (e.g., valley). Also, a zero TPI value could denote a flat or mid-slope terrain. We calculated TPI for HQW in ArcMap using a kernel of 9 × 9 pixels. TPI values in the investigated watershed ranged from −113 to 116, as revealed in Figure 5a.
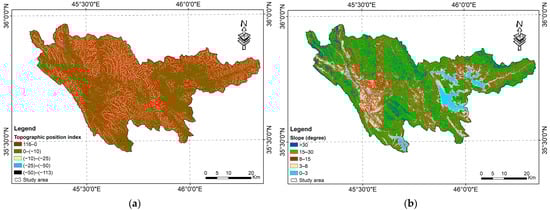
Figure 5.
Maps of the criteria: (a) Topographic position index; (b) Slope of HQW.
While selecting and establishing dam sites, slope gradient is another crucial factor in determining water flow direction and optimal RH locations [102,103,104]. The slope is the steepness of the earth’s surface, which can be measured in percentage or degrees from horizontal [35]. Terrains with gentle slopes are preferable for accumulating surface water and identifying dam sites; consequently, areas with slopes higher than 15 degrees are improper for constructing dams [45,105]. In this mountainous basin, the slope ranged from 0 to 76 degrees. The 30 m CDEM was used to create the slope map, and HQW was then categorized into five classes (Figure 5b). We characterized slopes between 0° and 3° as having excellent RH suitability and slopes greater than 30° as unsuitable for runoff harvesting and freshwater management structures. The overall ranks and classes of the slope criteria are listed in Table A1 and Table A2 within Appendix A.
For this study, CDEM itself is regarded as the elevation map, which is then arranged into five divisions (Figure 6). A low elevation provides more potential for surface water accumulation and infiltration, where water ultimately flows toward a lower altitude [106]. Therefore, such areas are best suited for siting and constructing dams [29]. The elevation raster of HQW ranged from 632 m to 2755 m a.s.l. (above sea level). As illustrated in Table A1 and Table A2, the highest RH suitability class/rank is given to the lowest elevation territories.
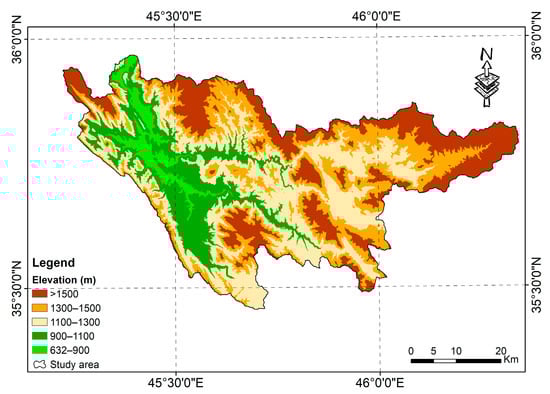
Figure 6.
The elevation map of the Hami Qeshan Watershed.
2.5.3. Hydrologic/Meteorologic Criteria
We employed for this study two substantial hydrological factors that influence water storage capacity in a reservoir: stream width and precipitation. Since HQW is an ungauged mountainous basin, we calculated the stream width of the drainage system as a substitute for in situ streamflow measurements [4]. The TecDEM software was applied to extract the drainage network for the study area. TecDEM analyzes topography and derives numerous geomorphologic parameters from digital elevation models (e.g., drainage density and watershed delineation) [107,108]. Several publications utilized stream order to assess the storage capacity of hydrologic basins [47,48,56]. Stream order describes the hierarchical connectivity of the stream system and enables size-based classification of drainage basins [2]. As implemented by an earlier investigation in the same region [4], we adopted streams that belong to 3rd–6th orders in this study because of their vast water accommodation capacity (Figure 7a). First, the streams were divided into 5 km segments to facilitate the measurement of stream width. Then, QuickBird images were used to calculate the stream width of each section. Due to the unavailability of recent QuickBird data, 30 scenes from 24 to 28 July 2005 were used for this study. Areas without streams were deemed inappropriate for the construction of dams. As dams are built on river courses, we applied a 1000 m buffer zone along the HQW stream channels to identify prospective dam locations, as illustrated in Figure 7b.
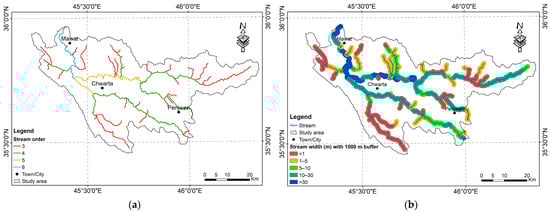
Figure 7.
Thematic maps: (a) Drainage network; (b) Stream width in the study area.
Although a few rain gauges are installed in HQW, they are unevenly distributed and might only represent the meteorological conditions over part of the study area. Therefore, monthly TRMM data were applied to generate the mean annual precipitation map for the entire watershed. Deus and Gloaguen [109] stated that TRMM 3B43-V7 is a valuable product that exhibits robust agreement with rain gauge measurements, particularly for water resources studies. TRMM data, as pixel-based data, were initially converted to points using the inverse distance weighting scheme to attain continuous coverage. Later, the reliability of TRMM in the Hami Qeshan Watershed was assessed via observed precipitation data from Penjwen meteorological station. The observed precipitation (i.e., 180 monthly readings) covered the period from January 2004 to December 2018. Evaluation results revealed a good correlation between TRMM and rain gauge data with a coefficient of determination (R2) and p-value of 0.79 and <0.05, respectively (Figure 8a). The highest precipitation of 709 mm.yr−1 was recorded in the center of HQW, whereas precipitation remarkably declined towards the east and west of the watershed (Figure 8b).
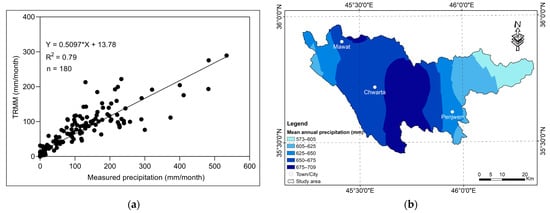
Figure 8.
(a) Linear correlation between TRMM data and observed precipitation data acquired from Penjwen meteorological station from January 2004 to December 2018 on a monthly time scale; (b) Precipitation distribution over HQW.
2.5.4. Environmental Criteria
Land cover and soil were chosen as environmental parameters that affect RH suitability in the study area. The land cover pattern substantially impacts the hydrological components of the basin. For instance, vegetation cover influences various water cycle processes: runoff, evapotranspiration, and infiltration [110,111]. Alrawi [112] reported that agricultural lands decelerate surface runoff and increase water infiltration. The LC map of HQW was provided by GEOSURV (Figure 9a). Moreover, it was generated from 2014 Landsat 8 OLI data, in which supervised classification through the maximum likelihood algorithm was applied at a 30 m pixel resolution [64]. Hami Qeshan Watershed was classified into ten LC classes: carbonate rocks, igneous/metamorphic rocks, clastic rocks, natural vegetation, mixed barren land, burned land, harvested land, cropland and pasture, cultivated land, and built-up land. Based on WLC and AHP models, seven LC classes were categorized under moderate suitability for runoff harvesting, while two showed excellent appropriateness. Unsurprisingly, built-up land was the only unsuitable class for RH.
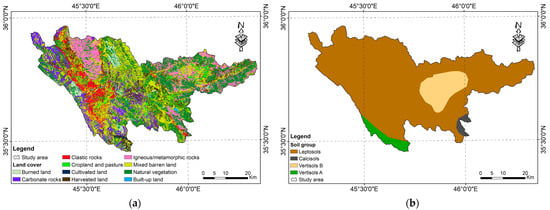
Figure 9.
Maps of the criteria: (a) Land cover types; (b) Soil groups in the Hami Qeshan Watershed.
The soil map of HQW was obtained in raster format from HWSD [66]. Soil texture represents an efficient indicator of infiltration rate and water-holding capacity in soil layers [113]. Therefore, soil characteristics are vital for identifying potential RH locations. Sand, silt, and clay percentages regulate the soil textural group. Fine and medium soil classes are more suited for RH because of their high water-retention capability; as a result, clay-predominant soil can hold harvested water for a long time. In contrast, soil with high sand content reveals a relatively higher infiltration ratio and lower runoff [114]. The study area (Figure 9b) includes three different soil groups: leptosols, vertisols (A and B), and calcisols. Leptosols prevail in most HQW parts, where sand and silt constitute major proportions. In addition, calcisols form an insignificant fraction of the soil groups south of Penjwen city. Vertisols comprise two sub-groups, A and B, of which the clay content in A (55%) is higher than in B (39%). Table A1 and Table A2 in Appendix A show the rank/class of soil groups for mapping runoff harvesting zones.
2.5.5. Socioeconomic Criteria
The existence of settlements and highways close to potential dam locations minimizes the cost of water transportation [4]. We applied distance to towns/cities as the chief socioeconomic criterion for identifying optimal RH and dam sites (Figure 10a). In comparison, the map of villages was utilized to determine the number of villages that could be adversely affected by the proposed dam/reservoir locations (Figure 10b). The shapefile layers of towns/cities and villages were acquired from the Humanitarian Data Exchange platform [65]. Buffer zones around Penjwen, Chwarta, and Mawat were applied to measure the distance to towns/cities. In the Hami Qeshan Watershed, the farthest pixel from towns/cities is greater than 15 km.
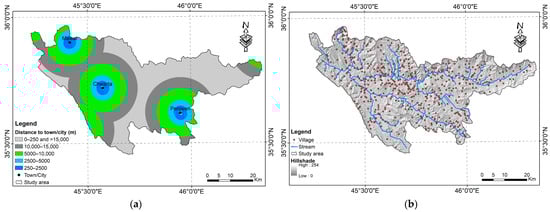
Figure 10.
Thematic maps: (a) Distance to towns/cities; (b) Villages in Hami Qeshan Watershed.
2.6. Model Validation
We adopted the Segmentation Accuracy Assessment (SAA) method [4] to evaluate the outcomes from the WLC and AHP models for RH and dam siting. The SAA approach uses the distinguished number of segments to compute the sum of distances from a reference point to appropriate pixels [31]. The preselected dam locations by MAWR were considered reference points [73]. Later, we produced three buffer zones of 1000 m, 500 m, and 250 m around the reference points. ArcMap tools were utilized to determine the statistics of relevant pixels inside each buffer zone, precisely the number of proper pixels (NP) and the total number of pixels (TP). Then, Equations (7)–(9) were utilized to compute the overall accuracy (OA) of the suitable pixels as follows:
where APn indicates the accuracy of the appropriate pixels by number, APw refers to the accuracy of the appropriate pixels by weight, and ∑PW denotes the sum of weights of all pixels.
The resulting maps based on the WLC and AHP approaches were grouped into five suitability classes: excellent, high, moderate, low, and unsuitable for harvesting surface runoff. We additionally used the threshold operation to refine our technique. Also, experimental analysis was applied to choose the threshold values for the best method. The pixels representing prospective dam sites were then located using the ultimate thresholded raster of the optimal approach. Thus, ideal dam locations have been established through point-type shapefiles.
3. Results
3.1. Generation of Runoff Harvesting Suitability Maps
Many insightful studies have revealed that integrating the WLC and AHP approaches with GIS is an effective and competent RH suitability technique [2,44,54]. The WLC and AHP models have been utilized to determine suitable RH locations by identifying the weights of various criteria and their sub-criteria [4,47,48,53]. WLC was used in this research because of its flexibility and efficiency in combining the normalized weights of factors and the reclassified thematic layers to create the RH suitability map. In contrast, AHP was employed due to its widely recognized capabilities in decision-making, which can be detected via pairwise comparisons. Thus, the RH maps of HQW were generated using a combined technique of MCDA, in situ/RS data, and GIS. First, the weights of the ten criteria and classes/ranks of each sub-criterion were calculated based on expert judgment and our literature review (Table 1). The weight and classes/ranks of each factor were then multiplied and allocated to the relevant raster file. Finally, the weighted overlay technique in ArcMap was utilized to combine all thematic layers and generate the ultimate RH suitability maps.
Since gorges and valleys represent ideal locations to collect and harvest surface runoff, a buffer zone of 1000 m has been applied along the drainage network to disregard inconsequential terrains, as shown in Figure 11. The WLC model grouped the RH suitability of the investigated watershed as follows: excellent (11%); high (23%); moderate (27%); low (25%); and unsuitable (14%). In contrast, AHP classified HQW as follows: excellent (12%); high (24%); moderate (27%); low (24%); and unsuitable (13%). The resulting RH maps show that most downstream territories across QCR, Awe Gogasur, and Awe Shiler possess competent aptitudes for runoff water harvesting (Figure 11). Even though the plain north of Penjwen city was situated in the moderate RH zone, many upstream and uplifted lands of the study area were categorized under low and unsuitable classes due to their high slope gradient.
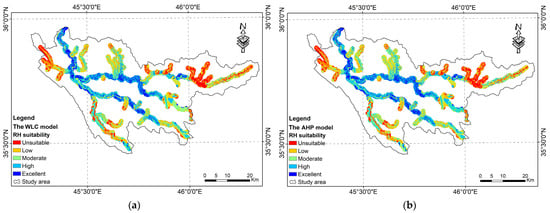
Figure 11.
Suitability maps of runoff harvesting with 1000 m buffer zone based on: (a) WLC; (b) AHP.
Some researchers [47,49,78] have considered the WLC technique a reliable decision-making system for detecting suitable RH areas and dam site selection. Nevertheless, others have found satisfactory results can be attained using AHP [4,33,48,58]. Although, in this study, both models produced homogenous results, we determined that the quality of the RH suitability maps generated using the WLC and AHP approaches depends mainly on the criteria implemented and the weights given in previous literature (Table 1). After examining different weightage scenarios, we found that minor adjustments to the layer weightings can considerably impact the results. In MCDA, the individual judgment of researchers while selecting the weights and effects of various parameters influences the development of the models. Therefore, the significance of the predictive factors and their impact on RH suitability should be prioritized over the applied methodology. Weight estimates can be derived from earlier research that explored regions with comparable climatic circumstances. Nevertheless, researchers must neglect outliers, illogical criteria, and weights applied in certain studies.
3.2. Validation of the WLC and AHP Models
One of the essential procedures in evaluating the accuracy of any model is the validation of results, where models might not be advantageous from a scientific perspective without verification [112]. In reviewing the literature, different methodologies are utilized to validate the RH maps, such as correlation analysis, segmentation accuracy assessment, receiver operating characteristic curve, and sensitivity analysis [4,20,31,44,56]. To examine the robustness and viability of the implemented models, WLC and AHP, the SAA method was performed by correlating the resulting suitability maps with the locations of 16 dams suggested by MAWR (Table A3 and Figure A1 in Appendix A). It should be clarified that selecting a dam site involves thorough investigation and testing; therefore, we supposed that MAWR dam sites are ideal for assessing and comparing the RH results. Simply put, the preselected dam locations in the study area were used to validate the outcomes of the models.
Figure 12 presents the OA for four buffer zones (i.e., 1000 m, 500 m, 250 m, mean of all buffer zones), as detailed for the two techniques in Table A4 of Appendix A. The accuracy of suitable pixels in terms of number and weight is implemented to evaluate the OA. The average overall accuracy for the WLC model is slightly higher than that for AHP, 69% and 66%, respectively. Thus, we chose the WLC model for this study to propose optimal locations for constructing new dams in HQW. The adopted model demonstrates that the best MAWR-preselected dams are at sites sorted: 1, 2, 3, 4, 5, 6, 7, 9, 11, 15, and 16. Concurrently, the preselected dams numbered 8, 10, 12, 13, and 14 are within the moderate RH suitability area. Significantly, none of the MAWR sites were situated in the low and unsuitable zones (Figure A1 of Appendix A and Figure 11a). Hence, a significant positive correlation between our model (i.e., WLC) and the preselected dam locations shows that about 70% of MAWR-proposed sites fall inside high and excellent runoff harvesting zones, which validates our methodology and research.
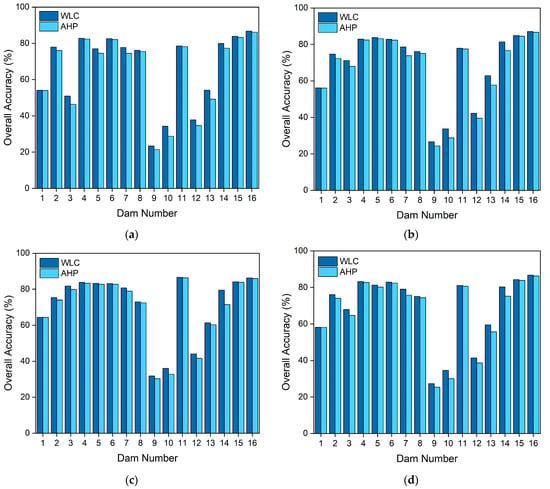
Figure 12.
Overall accuracy of the WLC and AHP models compared to MAWR dam sites using four buffer classes: (a) 1000 m; (b) 500 m; (c) 250 m; (d) mean of previously mentioned buffer zones.
3.3. Identification of New Sites for Dam Construction
An optimum dam site is where a broad valley with towering walls leads the way to a narrow canyon with massive cliffs [114]. After the accuracy assessment of the models, the threshold operation was used on the WLC raster with a suitable selected value of 0.8, which was determined experimentally for this study. Consequently, ten groupings of pixels made up the ultimate thresholded WLC layer; later, these zones were utilized to locate potential water management structures. The proposed dam locations in HQW have been selected in narrow gorges with steep slopes, where such geomorphological features considerably minimize dam establishment costs. Moreover, this research employed the CDEM data and drainage network to distinguish the preferred tight valleys for dam site selection. As revealed in Figure 13, a total of 10 positions have been characterized for constructing dams. Many of these suggested sites are scattered in the valleys between Mawat and Chwarta towns.
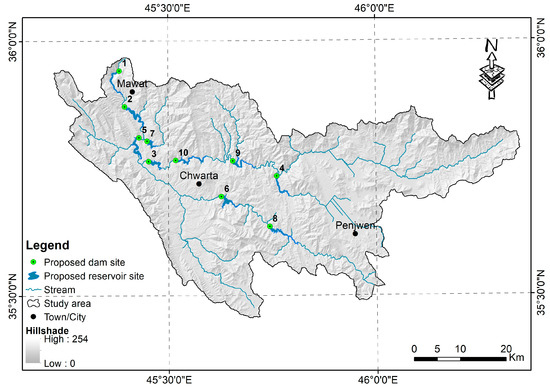
Figure 13.
Locations of the proposed dams/reservoirs in HQW based upon the WLC model.
Table 6 illustrates the attributes of the candidate dams and reservoirs in the investigated watershed. The maximum height and length of the proposed dams, as well as the cross-sectional profile of the suggested sites, were defined based on the CDEM layer, which was also utilized to calculate the storage capacity, surface area, and catchment area of the respective reservoirs through the tools of ArcMap. Eventually, the estimated number of inundated villages was extracted for each waterbody.
Table 6.
Characteristics of the proposed dams/reservoirs in HQW using the WLC model.
4. Discussion
Several studies have revealed that Iraq, including HQW, has undergone devastating floods and drought episodes in recent years [10,59,115,116,117,118]. However, despite receiving a substantial volume of precipitation, the surface water in HQW has not been adequately exploited due to a lack of runoff harvesting structures (e.g., dams), where most runoff waters are lost to drainage. Therefore, growing population and expansion schemes in areas susceptible to flooding necessitate a quick and effective response to alleviate overflow risks and guarantee water demands for dry periods. Within this framework, the current research applied the WLC and AHP approaches to generate two RH suitability maps for the Hami Qeshan Watershed and identify the best dam sites using ArcMap. The applied criteria/factors (i.e., TPI, LI, SW, SP, PCP, SG, EL, LC, DF, and DTC) for planning, implementing, and developing such techniques are described in Section 2.5. Ultimately, the present methodology was validated with preselected dam locations that MAWR determined to efficiently manage the surface water in Kurdistan Region.
RH and dam siting through GIS techniques are laborious and challenging due to the involvement of multiple variables that govern the outcomes. Therefore, a comprehensive analysis of predictive criteria is indispensable to accurately evaluate the weights of factors under particular geographical circumstances. According to published studies, as mentioned in Table 1, selecting dam sites requires considering several key factors such as slope, geology, streamflow, land cover, precipitation, soil, and socioeconomic concerns. Most earlier criteria were applied in regions with similar morphological, climatic, geological, and environmental characteristics, such as Duhok [2] and Erbil [31] governorates in northern Iraq. Few studies utilized TPI for dam site suitability assessment [48,56]; nonetheless, we assigned a significance weighting to this topographic criterion in which concave landform signifies ideal positions for surface water accumulation. The discharge of a river can be estimated by multiplying the water velocity by the average depth and width of the channel [119]. Because HQW is an ungauged basin, we used stream width measurements as an alternative to streamflow data to strengthen the efficacy of the employed methodology. Othman [4] reported that utilizing high-resolution satellite imagery (e.g., QuickBird) to measure stream width is a feasible mechanism to estimate streamflow for dam site selection. Furthermore, it outperforms other adopted criteria like stream density, which combines all drainages in a region irrespective of whether they are continual, seasonal, or dry outlets.
In this research, we created RH suitability maps for the mountainous Hami Qeshan Watershed using in situ data, RS imagery, and MCDA in ArcMap. The WLC model was employed herein due to its adaptability and effectiveness in merging the reclassified thematic layers and the normalized weights of factors to generate the RH map [47]. At the same time, AHP was applied because it represents a powerful technique for solving and decomposing complex decision problems into pairwise comparisons [23]. Both models, WLC and AHP, were further assessed and validated via the SAA method (Figure 11 and Figure 12). The truncated violin plot (Figure 14) demonstrates that the WLC model achieved, to some extent, a better result than AHP. The correctness of the WLC approach is attested through the dispersion of its weighted criteria, which is above 75% of the overall accuracy (Figure 14; green), as compared to that of AHP, whose percentage is fractionally below 75% (Figure 14; beige). Thus, the current investigation selected WLC as the best model to spot probable sites for constructing new dams in HQW. Based on our literature review (Table 1), most studies either applied the WLC approach as a primary and individual weighting methodology [47] or considered WLC as an overlay technique in GIS [2,44]. In other words, according to our knowledge, no controlled studies have compared the two methods (i.e., WLC and AHP) as independent weightage schemes for mapping runoff harvesting zones. Consequently, the findings should meaningfully contribute to understanding the remarkable differences between WLC and AHP as two different weighting methods for site suitability determination.
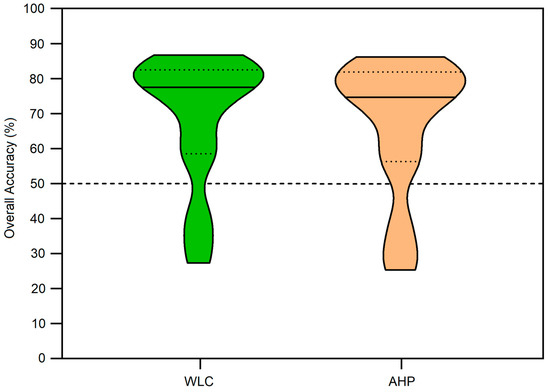
Figure 14.
Mean overall accuracy of the WLC and AHP models based on the 16 MAWR dam sites.
According to the adopted WLC model, 10 locations were distinguished as appropriate for dam construction in the Hami Qeshan Watershed (Figure 13). Two of these sites (i.e., numbers 2 and 5), which are located northwest of HQW, are compatible with those preselected by MAWR (i.e., numbers 15 and 11). In addition, the overall accuracy of these ten scheduled dam locations in HQW ranges between 66% and 87%, as revealed in Table 7. Each potential dam position was additionally evaluated by analyzing relevant characteristics, such as dam profile, maximum dam height, crest length, and reservoir storage capacity (Figure A2, Table 6). The reservoir volume was calculated by multiplying the mean elevation of the water column at each pixel by the reservoir’s surface area. Concurrently, the dam profile (i.e., height and length) was determined using CDEM and ArcMap tools. It is worthy of mention that evaporation loss might be very substantial in this semi-arid region, where it increases as the surface area of the waterbody expands. Therefore, optimum reservoirs with minimum surface area and maximum storage capacity are preferred to mitigate water loss through evaporation [11]. Ranking the proposed reservoirs in compliance with their maximum storage capacity, highest to lowest, puts them in the following order: 10, 6, 1, 2, 8, 4, 7, 9, 5, and 3 (Table 6).
Table 7.
Accuracy assessment of the proposed dam sites in HQW via the WLC model.
Based on Figure 4 and Table 6, some dam sites might not be feasible in practice due to their closeness to fault zones, namely locality numbers 4, 9, and 10. In contrast, the proposed dam number 1 can store a significant water quantity of 84,990,488 m3, and its construction will not adversely impact adjoining villages. The 924 m length of this dam could be its only drawback, which would raise the construction cost compared to the other nine structures. Geologically, dam 1 is situated on vigorous rock units of ABT formations, and the nearest fault line is located 2.3 km eastwards. Even though dam number 2 can collect a high amount of surface runoff (i.e., 64,985,592 m3), the large surface area of its potential reservoir (i.e., 3.09 km2) might lead to a high evaporation rate. This site has advantageous lithologic and structural features similar to dam site 1. Another important location is number 6, which has the second-largest reservoir volume of 100,715,685 m3 with a promising dam length (i.e., 523 m). Diverse and tolerable rock types of RBL, FP, and ABT crop out at site 6; nonetheless, the construction of dam number 6 will inundate minor settlements. Compared to the other sites, locations 7 and 8 could be categorized as intermediate reservoirs capable of holding runoff waters of 45,342,722 m3 and 55,517,400 m3 with a dam height of 88 m and 60 m, respectively. Water management features 3 and 5 have the lowest storage capacity of 25,636,552 m3 and 33,801,950 m3, respectively. In the future, strategic planners and policymakers could benefit enormously from this storage capacity evaluation of the recommended reservoirs at the designed dam sites. Such quantitative assessments will provide insight into the amount of water held in each reservoir with respect to the dam height. Consequently, it will assist in regulating water demand and supply for neighboring communities and imminent development.
Since MAWR dam sites are based on scanty field exploration and superficial GIS analysis that neglected vital aspects such as geology and streamflow [4], our study was intended to consider all essential criteria (i.e., Section 2.2) for dam site selection through systematic MCDA approaches and ArcMap techniques. This investigation identifies optimal dam locations and their respective reservoirs that might further be considered for in-depth site assessments. Unlike sites with critical constraints, investing resources in more appropriate places could result in substantial expense savings. These multipurpose dams have constructive implications for HQW, such as flood protection, crop irrigation, hydropower generation, aquaculture, developing the granite and marble industry, expanding recreational activities, and securing water supply for the local communities. Correspondingly, the quality of life for locals and the environment around the proposed dams can be improved. As sedimentation constantly and adversely affects the capacity limit of reservoirs [16], some of the proposed dams can be specified mainly to trap and prevent foreseeable sediments from entering Dukan Reservoir (Figure 2), thus increasing its lifetime.
Nevertheless, the findings of this research should be cautiously interpreted as there are limitations that should be considered in upcoming studies. For instance, this study was limited by the lack of river discharge gauges on the HQW drainage network. The insufficiency and absence of accurate and continuous streamflow measurements could lead to an erroneous estimation of the actual surface water quantity. Also, a factor that was not addressed in this investigation was the electrical grid infrastructure at the potential dam sites, which is a critical aspect of developing a hydropower project [120].
The adopted methodology, while preliminary, can be used as a scientific roadmap for a broader water management framework in mountainous regions. However, a detailed geological investigation of the recommended dam sites must be carried out before implementing any constructive action to shed light on the local geotechnical conditions and avoid potential failures [121]. Interestingly, this mountainous region has geological evidence of landslide-induced dammed lake(s) during the Quaternary Period [122], indicating mass-wasting hazards that could adversely affect the proposed dam/reservoir sites. Therefore, a supplementary study with more focus on landslides (i.e., frequency and magnitude) in HQW is suggested. As per global climate change, if the intensity and frequency of extreme events per year dramatically rise, it is crucial to develop flood susceptibility maps and scenarios for protective measures against disastrous phenomena. In future investigations, it might be possible to integrate the spatial optimization models recommended by Tong and Murray [36] into dam site selection. Another probable area of future research would be to estimate the annual soil loss that negatively impacts the functionality and lifespan of the proposed dams [70]. Decision-makers must also consider the additional greenhouse gases emitted due to dam construction that could result in human-induced climate change complications. Further research must be undertaken, which accounts for surface runoff volume generated within HQW. More studies can also compare the findings of the applied methodology with those of other approaches, such as machine learning [29,123,124] and TOPSIS [23], to strengthen the accuracy of the implemented model. All previous recommendations aim to improve the reliability and predictive capability of the proposed methodology and establish a practical framework for developing a sustainable and comprehensive water resource management scheme.
5. Conclusions
Even though surface runoff within a basin is one of the most crucial water resources, no previous researchers have attempted to determine optimal locations for harvesting this decent freshwater asset in the Hami Qeshan Watershed. In this study, we implemented an integrated methodology of in situ data, RS images, WLC, AHP, and GIS to determine feasible spots for harvesting surface runoff and constructing new multipurpose dams in the hilly HQW. The site assessment involved several vital factors, including geology, TPI, slope, precipitation, stream width, land cover, elevation, soil group, distance to faults, and distance to town/city. Attentively estimated criteria weights were assigned and evaluated for each MCDA method (i.e., WLC and AHP). After that, overlay analysis combined all the thematic layers into raster maps to provide the final RH suitability maps. The SAA method was used to validate the overall accuracy of the resulting maps based on 16 dam sites preselected by MAWR. The WLC model achieved, to a certain extent, higher overall accuracy than AHP. Consequently, based on the superior model (i.e., WLC), ten potential sites were identified for harvesting surface runoff and building new dams in HQW. The accuracy of these ten sites ranged between 66% and 87%.
Altogether, this study strengthens the idea that a thorough selection of the evaluative factors and their respective weights, which are far more critical than the employed methods, should be the main focus of future research. Despite the scarcity of on-site data, the current study provided insights into integrating satellite images, MCDA approaches, and GIS to delineate ideal RH areas and locate optimum dam sites in the ungauged HQW. Likewise, it is essential to note that the findings of the approach described herein can be continuously improved as the reliability of the data adopted increases. Developing countries like Iraq severely need such initiatives where large amounts of freshwater are drained during wet seasons, resulting in socioeconomic and environmental disasters. Although this research proposed ten runoff harvesting structures to control flooding and secure water supply, further studies are recommended to consider additional parameters, such as water quality, organic pollutants, and heavy metals within the relevant catchments. Ultimately, extensive fieldwork, including geophysical surveys and geotechnical investigations, must be conducted at the proposed dam sites before implementing any RH system.
Author Contributions
Omeed Al-Kakey: funding acquisition, conceptualization, resources, methodology, validation, formal analysis, visualization, writing—original draft. Arsalan Ahmed Othman: supervision, conceptualization, resources, methodology, validation, writing—review and editing. Mustafa Al-Mukhtar: writing—review and editing. Volkmar Dunger: funding acquisition, writing—review and editing. All authors have read and agreed to the published version of the manuscript.
Funding
This research was funded by Deutscher Akademischer Austauschdienst (DAAD) (grant number 57381412), as well as the DAAD STIBET Doktoranden Programme through TU Bergakademie Freiberg.
Data Availability Statement
Not applicable.
Acknowledgments
The authors are grateful to all data providers mentioned in the “Data Acquisition” section. Thanks also go to DAAD for funding this research. Finally, we thank the editors and anonymous reviewers for their valuable remarks and suggestions.
Conflicts of Interest
The authors declare no conflict of interest.
Appendix A
Table A1.
Assigned and normalized weights of RH factors using the WLC approach.
Table A1.
Assigned and normalized weights of RH factors using the WLC approach.
| Criterion | Sub-Criterion | Class | RH Suitability | WLC | |
|---|---|---|---|---|---|
| Criterion Weight% | Normalized Weight | ||||
| Lithology | River | 1 | US | 13 | 0.537 |
| FP | 1 | US | 0.537 | ||
| AF | 1 | US | 0.537 | ||
| RBU | 3 | MS | 1.611 | ||
| RBL | 3 | MS | 1.611 | ||
| NWG | 4 | HS | 2.148 | ||
| SH | 2 | LS | 1.074 | ||
| ABT | 5 | ES | 2.685 | ||
| KRG | 5 | ES | 2.685 | ||
| SPG | 5 | ES | 2.685 | ||
| QR | 5 | ES | 2.685 | ||
| QC | 3 | MS | 1.611 | ||
| PC | 5 | ES | 2.685 | ||
| GG | 5 | ES | 2.685 | ||
| BK | 4 | HS | 2.148 | ||
| SG | 5 | ES | 2.685 | ||
| MG | 5 | ES | 2.685 | ||
| JU | 5 | ES | 2.685 | ||
| UJ | 5 | ES | 2.685 | ||
| DL | 5 | ES | 2.685 | ||
| −113 to −50 | 5 | ES | 3.356 | ||
| −50 to −25 | 4 | HS | 2.685 | ||
| TPI | −25 to −10 | 3 | MS | 16 | 2.013 |
| −10 to 0 | 2 | LS | 1.342 | ||
| 0 to 116 | 1 | US | 0.671 | ||
| 0–3 | 5 | ES | 2.685 | ||
| 3–8 | 4 | HS | 2.148 | ||
| Slope (degree) | 8–15 | 3 | MS | 13 | 1.611 |
| 15–30 | 2 | LS | 1.074 | ||
| >30 | 1 | US | 0.537 | ||
| <605 | 1 | US | 0.403 | ||
| 605–625 | 2 | LS | 0.805 | ||
| Precipitation (mm/yr.) | 625–650 | 3 | MS | 10 | 1.208 |
| 650–675 | 4 | HS | 1.611 | ||
| >675 | 5 | ES | 2.013 | ||
| <1 | 1 | US | 0.671 | ||
| 1–5 | 2 | LS | 1.342 | ||
| Stream Width (m) | 5–10 | 3 | MS | 16 | 2.013 |
| 10–30 | 4 | HS | 2.685 | ||
| >30 | 5 | ES | 3.356 | ||
| Leptosols | 1 | US | 0.403 | ||
| Soil Group | Calcisols | 3 | MS | 10 | 0.805 |
| Vertisols B | 4 | HS | 1.611 | ||
| Vertisols A | 5 | ES | 2.013 | ||
| 632–900 | 5 | ES | 2.013 | ||
| 900–1100 | 4 | HS | 1.611 | ||
| Elevation (m) | 1100–1300 | 3 | MS | 10 | 1.208 |
| 1300–1500 | 2 | LS | 0.805 | ||
| >1500 | 1 | US | 0.403 | ||
| Built-up Land | 1 | US | 0.268 | ||
| Cropland and Pasture | 3 | MS | 0.805 | ||
| Cultivated Land | 3 | MS | 0.805 | ||
| Harvested Land | 3 | MS | 0.805 | ||
| Land Cover | Mixed Barren Land | 3 | MS | 6 | 0.805 |
| Natural Vegetation | 3 | MS | 0.805 | ||
| Clastic Rocks | 3 | MS | 0.805 | ||
| Burned Land | 3 | MS | 0.805 | ||
| Carbonate Rocks | 5 | ES | 1.342 | ||
| Igneous/Metamorphic Rocks | 5 | ES | 1.342 | ||
| 0–1770 | 1 | US | 0.134 | ||
| 1770–4460 | 2 | LS | 0.268 | ||
| Distance to Faults (m) | 4460–8140 | 3 | MS | 3 | 0.403 |
| 8140–12,110 | 4 | HS | 0.537 | ||
| >12,110 | 5 | ES | 0.671 | ||
| 0–250 | 1 | US | 0.134 | ||
| 250–2500 | 5 | ES | 0.671 | ||
| Distance to Town/City | 2500–5000 | 4 | HS | 3 | 0.537 |
| 5000–10,000 | 3 | MS | 0.403 | ||
| 10,000–15,000 | 2 | LS | 0.268 | ||
| >15,000 | 1 | US | 0.134 | ||
Table A2.
Assigned and normalized weights of RH factors using the AHP approach.
Table A2.
Assigned and normalized weights of RH factors using the AHP approach.
| Criterion | Sub-Criterion | Rank | RH Suitability | AHP | |
|---|---|---|---|---|---|
| Criterion Weight% | Normalized Weight | ||||
| River | 1 | US | 0.015 | ||
| FP | 1 | US | 0.015 | ||
| AF | 1 | US | 0.015 | ||
| RBU | 5 | MS | 0.074 | ||
| RBL | 5 | MS | 0.074 | ||
| NWG | 7 | HS | 0.104 | ||
| SH | 3 | LS | 0.044 | ||
| ABT | 9 | ES | 0.133 | ||
| KRG | 9 | ES | 0.133 | ||
| Lithology | SPG | 9 | ES | 13 | 0.133 |
| QR | 9 | ES | 0.133 | ||
| QC | 5 | MS | 0.074 | ||
| PC | 9 | ES | 0.133 | ||
| GG | 9 | ES | 0.133 | ||
| BK | 7 | HS | 0.104 | ||
| SG | 9 | ES | 0.133 | ||
| MG | 9 | ES | 0.133 | ||
| JU | 9 | ES | 0.133 | ||
| UJ | 9 | ES | 0.133 | ||
| DL | 9 | ES | 0.133 | ||
| −113 to −50 | 9 | ES | 0.190 | ||
| −50 to −25 | 7 | HS | 0.148 | ||
| TPI | −25 to −10 | 5 | MS | 19 | 0.106 |
| −10 to 0 | 3 | LS | 0.063 | ||
| 0 to 116 | 1 | US | 0.021 | ||
| 0–3 | 9 | ES | 0.133 | ||
| 3–8 | 7 | HS | 0.104 | ||
| Slope (degree) | 8–15 | 5 | MS | 13 | 0.074 |
| 15–30 | 3 | LS | 0.044 | ||
| >30 | 1 | US | 0.015 | ||
| <1 | 1 | US | 0.021 | ||
| 1–5 | 3 | LS | 0.063 | ||
| Stream Width (m) | 5–10 | 5 | MS | 19 | 0.106 |
| 10–30 | 7 | HS | 0.148 | ||
| >30 | 9 | ES | 0.190 | ||
| <605 | 1 | US | 0.010 | ||
| 605–625 | 3 | LS | 0.029 | ||
| Precipitation (mm/yr.) | 625–650 | 5 | MS | 9 | 0.048 |
| 650–675 | 7 | HS | 0.068 | ||
| >675 | 9 | ES | 0.087 | ||
| Soil Group | Leptosols | 1 | US | 9 | 0.010 |
| Calcisols | 5 | MS | 0.048 | ||
| Vertisols B | 7 | HS | 0.068 | ||
| Vertisols A | 9 | ES | 0.087 | ||
| 632–900 | 9 | ES | 0.087 | ||
| 900–1100 | 7 | HS | 0.068 | ||
| Elevation (m) | 1100–1300 | 5 | MS | 9 | 0.048 |
| 1300–1500 | 3 | LS | 0.029 | ||
| >1500 | 1 | US | 0.010 | ||
| Built-up Land | 1 | US | 0.006 | ||
| Cropland and Pasture | 5 | MS | 0.031 | ||
| Cultivated Land | 5 | MS | 0.031 | ||
| Harvested Land | 5 | MS | 0.031 | ||
| Land Cover | Mixed barren Land | 5 | MS | 5 | 0.031 |
| Natural Vegetation | 5 | MS | 0.031 | ||
| Clastic Rocks | 5 | MS | 0.031 | ||
| Burned Land | 5 | MS | 0.031 | ||
| Carbonate Rocks | 9 | ES | 0.055 | ||
| Igneous/Metamorphic Rocks | 9 | ES | 0.055 | ||
| 0–1770 | 1 | US | 0.002 | ||
| 1770–4460 | 3 | LS | 0.006 | ||
| Distance to Faults (m) | 4460–8140 | 5 | MS | 2 | 0.010 |
| 8140–12,110 | 7 | HS | 0.014 | ||
| >12,110 | 9 | ES | 0.019 | ||
| 0–250 | 1 | US | 0.002 | ||
| 250–2500 | 9 | ES | 0.019 | ||
| Distance to Town/City | 2500–5000 | 7 | HS | 2 | 0.014 |
| 5000–10,000 | 5 | MS | 0.010 | ||
| 10,000–15,000 | 3 | LS | 0.006 | ||
| >15,000 | 1 | US | 0.002 | ||
Table A3.
Characteristics of MAWR dams/reservoirs used for model validation [70].
Table A3.
Characteristics of MAWR dams/reservoirs used for model validation [70].
| Site | River Order | Latitude | Longitude | Main Purpose | Dam Height | Storage Capacity | Catchment |
|---|---|---|---|---|---|---|---|
| No. | (m) | (Million m3) | Area (km2) | ||||
| 1 | Qala Chulan 2 | 35.5736 | 45.9236 | Irrigation, Energy | 30 | 8 | 178.4 |
| 2 | Qala Chulan 2 | 35.6830 | 45.6534 | Irrigation, Energy | 25 | 1.45 | 313.6 |
| 3 | Unk 4 | 35.7241 | 45.9424 | Irrigation | 17 | 2 | 8.8 |
| 4 | Siway 3 | 35.7555 | 45.7240 | Irrigation, Energy | 50 | 40 | 1152.3 |
| 5 | Siway 3 | 35.7500 | 45.6667 | Irrigation, Energy | 43 | 29 | 1202.5 |
| 6 | Siway 3 | 35.7667 | 45.5350 | Energy | 50 | 40 | 1480.7 |
| 7 | Siway 3 | 35.7634 | 45.5081 | Irrigation, Energy | 23 | 11 | 1509.9 |
| 8 | Qala Chulan 2 | 35.7595 | 45.4284 | Irrigation, Energy | 56 | 300 | 2425.8 |
| 9 | Unk 4 | 35.8037 | 45.3094 | Irrigation | 20 | 2 | 23.4 |
| 10 | Capelon 3 | 35.7903 | 45.3806 | Irrigation | 28 | 6 | 152.3 |
| 11 | Qala Chulan 2 | 35.8097 | 45.4280 | Irrigation, Energy | 12 | 11 | 2642 |
| 12 | Mawat 3 | 35.8615 | 45.4756 | Irrigation | 44 | 2 | 48 |
| 13 | Mawat 3 | 35.7925 | 45.4648 | Irrigation, Energy | 39 | 3 | 104.3 |
| 14 | Mawat 3 | 35.8085 | 45.4430 | Energy | 75 | 18 | 114.3 |
| 15 | Qala Chulan 2 | 35.8679 | 45.3983 | Energy | 29 | 50 | 2828.3 |
| 16 | Qala Chulan 2 | 35.9661 | 45.3974 | Energy | 34 | 10 | 2875.7 |
Table A4.
Accuracy assessment of dam site selection via the WLC and AHP techniques.
Table A4.
Accuracy assessment of dam site selection via the WLC and AHP techniques.
| Buffer | Method-Scenario | Suitability Measure | MAWR Dam Site | |||||||||||||||
|---|---|---|---|---|---|---|---|---|---|---|---|---|---|---|---|---|---|---|
| 1 | 2 | 3 | 4 | 5 | 6 | 7 | 8 | 9 | 10 | 11 | 12 | 13 | 14 | 15 | 16 | |||
| 1000 m | TP | 3487 | 3488 | 3488 | 3487 | 3488 | 3487 | 3490 | 3488 | 3490 | 3488 | 3487 | 3487 | 3487 | 3488 | 3487 | 1896 | |
| NP | 1948 | 3084 | 1584 | 3487 | 3004 | 3487 | 3144 | 3108 | 205 | 534 | 3197 | 834 | 1700 | 3147 | 3402 | 1884 | ||
| AHP | APn | 55.86 | 88.42 | 45.41 | 100 | 86.12 | 100 | 90.09 | 89.11 | 5.87 | 15.31 | 91.68 | 23.92 | 48.75 | 90.22 | 97.56 | 99.37 | |
| APw | 52.29 | 63.68 | 47.40 | 64.73 | 62.93 | 64.26 | 58.94 | 61.89 | 37.01 | 42.20 | 64.74 | 45.50 | 49.77 | 64.50 | 69.06 | 73.00 | ||
| OA | 54.08 | 76.05 | 46.41 | 82.37 | 74.53 | 82.13 | 74.51 | 75.50 | 21.44 | 28.75 | 78.21 | 34.71 | 49.26 | 77.36 | 83.31 | 86.18 | ||
| TP | 3487 | 3487 | 3487 | 3487 | 3487 | 3488 | 3487 | 3487 | 3488 | 3488 | 3488 | 3488 | 3487 | 3487 | 3487 | 1896 | ||
| NP | 1948 | 3179 | 1820 | 3487 | 3130 | 3488 | 3336 | 3121 | 283 | 858 | 3208 | 974 | 1989 | 3308 | 3419 | 1893 | ||
| WLC | APn | 55.86 | 91.17 | 52.19 | 100 | 89.76 | 100 | 95.67 | 89.50 | 8.11 | 24.60 | 91.97 | 27.92 | 57.04 | 94.87 | 98.05 | 99.84 | |
| APw | 52.36 | 64.81 | 49.74 | 65.73 | 64.28 | 65.21 | 59.84 | 62.89 | 38.67 | 44.03 | 65.15 | 47.66 | 51.45 | 65.04 | 69.84 | 73.82 | ||
| OA | 54.11 | 77.99 | 50.97 | 82.87 | 77.02 | 82.60 | 77.76 | 76.20 | 23.39 | 34.31 | 78.56 | 37.79 | 54.25 | 79.95 | 83.95 | 86.83 | ||
| 500 m | TP | 873 | 873 | 873 | 873 | 873 | 873 | 873 | 873 | 873 | 873 | 873 | 873 | 873 | 873 | 873 | 626 | |
| NP | 518 | 725 | 702 | 873 | 873 | 873 | 768 | 760 | 81 | 133 | 781 | 282 | 556 | 780 | 851 | 626 | ||
| AHP | APn | 59.34 | 83.05 | 80.41 | 100 | 100 | 100 | 87.97 | 87.06 | 9.28 | 15.23 | 89.46 | 32.30 | 63.69 | 89.35 | 97.48 | 100 | |
| APw | 52.85 | 61.45 | 55.64 | 64.91 | 66.43 | 64.78 | 59.77 | 63.11 | 39.46 | 42.26 | 65.66 | 46.86 | 51.77 | 64.09 | 71.62 | 73.43 | ||
| OA | 56.09 | 72.25 | 68.03 | 82.45 | 83.21 | 82.39 | 73.87 | 75.08 | 24.37 | 28.75 | 77.56 | 39.58 | 57.73 | 76.72 | 84.55 | 86.71 | ||
| TP | 873 | 873 | 873 | 873 | 873 | 873 | 873 | 873 | 873 | 873 | 873 | 873 | 873 | 873 | 873 | 626 | ||
| NP | 518 | 759 | 736 | 873 | 873 | 873 | 843 | 768 | 106 | 205 | 784 | 310 | 631 | 858 | 851 | 626 | ||
| WLC | APn | 59.34 | 86.94 | 84.31 | 100 | 100 | 100 | 96.56 | 88.07 | 12.16 | 23.48 | 89.81 | 35.51 | 72.28 | 98.28 | 97.48 | 100 | |
| APw | 52.94 | 62.51 | 58.14 | 65.84 | 67.47 | 65.73 | 60.67 | 64.19 | 41.19 | 44.00 | 66.05 | 49.02 | 53.50 | 64.62 | 72.23 | 74.16 | ||
| OA | 56.14 | 74.72 | 71.22 | 82.92 | 83.74 | 82.87 | 78.62 | 76.13 | 26.67 | 33.74 | 77.93 | 42.26 | 62.89 | 81.45 | 84.86 | 87.08 | ||
| 250 m | TP | 218 | 218 | 218 | 218 | 218 | 218 | 218 | 218 | 218 | 219 | 219 | 220 | 218 | 218 | 218 | 197 | |
| NP | 161 | 186 | 215 | 218 | 218 | 218 | 208 | 186 | 41 | 47 | 218 | 80 | 149 | 183 | 208 | 197 | ||
| AHP | APn | 73.85 | 85.32 | 98.62 | 100 | 100 | 100 | 95.41 | 85.32 | 18.81 | 21.46 | 99.54 | 36.36 | 68.35 | 83.94 | 95.41 | 100 | |
| APw | 54.98 | 62.74 | 61.03 | 66.64 | 65.50 | 65.49 | 62.44 | 59.66 | 41.87 | 44.10 | 73.22 | 47.01 | 52.37 | 59.13 | 72.27 | 71.87 | ||
| OA | 64.42 | 74.03 | 79.83 | 83.32 | 82.75 | 82.74 | 78.93 | 72.49 | 30.34 | 32.78 | 86.38 | 41.69 | 60.36 | 71.54 | 83.84 | 85.93 | ||
| TP | 218 | 218 | 218 | 218 | 218 | 218 | 218 | 218 | 219 | 218 | 218 | 218 | 218 | 218 | 218 | 197 | ||
| NP | 161 | 190 | 218 | 218 | 218 | 218 | 214 | 186 | 44 | 57 | 217 | 85 | 150 | 217 | 208 | 197 | ||
| WLC | APn | 73.85 | 87.16 | 100 | 100 | 100 | 100 | 98.17 | 85.32 | 20.09 | 26.15 | 99.54 | 38.99 | 68.81 | 99.54 | 95.41 | 100 | |
| APw | 55.06 | 63.63 | 63.50 | 67.51 | 66.53 | 66.42 | 63.33 | 60.71 | 43.60 | 45.85 | 73.65 | 49.25 | 54.05 | 59.45 | 72.79 | 72.55 | ||
| OA | 64.46 | 75.39 | 81.75 | 83.76 | 83.27 | 83.21 | 80.75 | 73.02 | 31.85 | 36.00 | 86.60 | 44.12 | 61.43 | 79.49 | 84.10 | 86.28 | ||
| Mean | OA (AHP) | 58.20 | 74.11 | 64.76 | 82.71 | 80.16 | 82.42 | 75.77 | 74.36 | 25.38 | 30.09 | 80.72 | 38.66 | 55.78 | 75.21 | 83.90 | 86.28 | |
| OA (WLC) | 58.23 | 76.04 | 67.98 | 83.18 | 81.34 | 82.89 | 79.04 | 75.12 | 27.30 | 34.68 | 81.03 | 41.39 | 59.52 | 80.30 | 84.30 | 86.73 | ||

Figure A1.
Location map of preselected dam sites in HQW by MAWR [70].
Figure A1.
Location map of preselected dam sites in HQW by MAWR [70].


Figure A2.
Cross-sectional profile of the proposed dam sites based on the WLC model.
Figure A2.
Cross-sectional profile of the proposed dam sites based on the WLC model.


References
- Al-Muqdadi, S.W.; Omer, M.F.; Abo, R.; Naghshineh, A. Dispute over Water Resource Management-Iraq and Turkey. J. Environ. Prot. 2016, 7, 1096–1103. [Google Scholar] [CrossRef]
- Ibrahim, G.R.F.; Rasul, A.; Hamid, A.A.; Ali, Z.F.; Dewana, A.A. Suitable Site Selection for Rainwater Harvesting and Storage Case Study Using Dohuk Governorate. Water 2019, 11, 864. [Google Scholar] [CrossRef]
- CityPopulation. Available online: http://www.citypopulation.de/Iraq-Cities.html (accessed on 28 December 2022).
- Othman, A.A.; Al-Maamar, A.F.; Al-Manmi, D.A.M.A.; Liesenberg, V.; Hasan, S.E.; Obaid, A.K.; Al-Quraishi, A.M.F. GIS-Based Modeling for Selection of Dam Sites in the Kurdistan Region, Iraq. ISPRS Int. J. Geo Inf. 2020, 9, 244. [Google Scholar] [CrossRef]
- Rezaei, P.; Rezaie, K.; Nazari-Shirkouhi, S.; Tajabadi, M.R.J. Application of Fuzzy Multi-Criteria Decision Making Analysis for Evaluating and Selecting the Best Location for Construction of Underground Dam. Acta Polytech. Hung. 2013, 10, 187–205. [Google Scholar]
- Al-Muqdadi, S.W.H. Developing Strategy for Water Conflict Management and Transformation at Euphrates–Tigris Basin. Water 2019, 11, 2037. [Google Scholar] [CrossRef]
- Abbas, N.; Wasimi, S.A.; Al-Ansari, N.; Baby, S.N. Recent Trends and Long-Range Forecasts of Water Resources of Northeast Iraq and Climate Change Adaptation Measures. Water 2018, 10, 1562. [Google Scholar] [CrossRef]
- Umugwaneza, A.; Chen, X.; Liu, T.; Mind’je, R.; Uwineza, A.; Kayumba, P.M.; Uwamahoro, S.; Umuhoza, J.; Gasirabo, A.; Maniraho, A.P. Integrating a GIS-Based Approach and a SWAT Model to Identify Potential Suitable Sites for Rainwater Harvesting in Rwanda. AQUA Water Infrast. Ecosyst. Soc. 2022, 71, 415–432. [Google Scholar] [CrossRef]
- Rincón, D.; Khan, U.; Armenakis, C. Flood Risk Mapping Using GIS and Multi-Criteria Analysis: A Greater Toronto Area Case Study. Geosciences 2018, 8, 275. [Google Scholar] [CrossRef]
- Gaznayee, H.A.A.; Al-Quraishi, A.M.F.; Mahdi, K.; Messina, J.P.; Zaki, S.H.; Razvanchy, H.A.S.; Hakzi, K.; Huebner, L.; Ababakr, S.H.; Riksen, M.; et al. Drought Severity and Frequency Analysis Aided by Spectral and Meteorological Indices in the Kurdistan Region of Iraq. Water 2022, 14, 3024. [Google Scholar] [CrossRef]
- Adham, A.; Sayl, K.N.; Abed, R.; Abdeladhim, M.A.; Wesseling, J.G.; Riksen, M.; Fleskens, L.; Karim, U.; Ritsema, C.J. A GIS-Based Approach for Identifying Potential Sites for Harvesting Rainwater in the Western Desert of Iraq. Int. Soil Water Conserv. Res. 2018, 6, 297–304. [Google Scholar] [CrossRef]
- Alem, F.; Abebe, B.A.; Degu, A.M.; Goitom, H.; Grum, B. Assessment of Water Harvesting Potential Sites Using GIS-Based MCA and a Hydrological Model: Case of Werie Catchment, Northern Ethiopia. Sustain. Water Resour. Manag. 2022, 8, 70. [Google Scholar] [CrossRef]
- Güven, A.; Aydemir, A. Risk Assessment of Dams, 1st ed.; Springer Nature: Cham, Switzerland, 2020; p. 89. [Google Scholar]
- Chen, Y.; Li, J.; Jiao, J.; Wang, N.; Bai, L.; Chen, T.; Zhao, C.; Zhang, Z.; Xu, Q.; Han, J. Modeling the Impacts of Fully-Filled Check Dams on Flood Processes Using CAESAR-Lisflood Model in the Shejiagou Catchment of the Loess Plateau, China. J. Hydrol. Reg. Stud. 2023, 45, 101290. [Google Scholar] [CrossRef]
- Al-Kakey, O.H.; Othman, A.A.; Merkel, B.J. Identifying Potential Sites for Artificial Groundwater Recharge Using GIS and AHP Techniques: A Case Study of Erbil Basin, Iraq. Kuwait J. Sci. 2023, 50, 1–22. [Google Scholar] [CrossRef]
- Munir, B.A.; Ahmad, S.R.; Rehan, R. Torrential Flood Water Management: Rainwater Harvesting through Relation Based Dam Suitability Analysis and Quantification of Erosion Potential. ISPRS Int. J. Geo Inf. 2021, 10, 27. [Google Scholar] [CrossRef]
- Mullo-Sinaluisa, A.; Oquendo-Borbor, C.; Velastegui-Montoya, A.; Merchan-Sanmartín, B.; Chávez-Moncayo, M.; Herrera-Matamoros, V.; Carrión-Mero, P. Hill Dam Design to Improve Water Use in Rural Areas—Case Study: Sacachún, Santa Elena. Sustainability 2022, 14, 12268. [Google Scholar] [CrossRef]
- Amarandei, C.; Negru, A.-G.; Soroaga, L.-V.; Cucu-Man, S.-M.; Olariu, R.-I.; Arsene, C. Assessment of Surface Water Quality in the Podu Iloaiei Dam Lake (North-Eastern Romania): Potential Implications for Aquaculture Activities in the Area. Water 2021, 13, 2395. [Google Scholar] [CrossRef]
- Nowak, B.; Andrzejak, A.; Filipiak, G.; Ptak, M.; Sojka, M. Assessment of the Impact of Flow Changes and Water Management Rules in the Dam Reservoir on Energy Generation at the Jeziorsko Hydropower Plant. Energies 2022, 15, 7695. [Google Scholar] [CrossRef]
- Aghaloo, K.; Chiu, Y.-R. Identifying Optimal Sites for a Rainwater-Harvesting Agricultural Scheme in Iran Using the Best-Worst Method and Fuzzy Logic in a GIS-Based Decision Support System. Water 2020, 12, 1913. [Google Scholar] [CrossRef]
- Ion, I.V.; Ene, A. Evaluation of Greenhouse Gas Emissions from Reservoirs: A Review. Sustainability 2021, 13, 11621. [Google Scholar] [CrossRef]
- Sinthumule, N.I. Window of Economic Opportunity or Door of Exclusion? Nandoni Dam and Its Local Communities. Sustainability 2021, 13, 2502. [Google Scholar] [CrossRef]
- Jozaghi, A.; Alizadeh, B.; Hatami, M.; Flood, I.; Khorrami, M.; Khodaei, N.; Ghasemi Tousi, E. A Comparative Study of the AHP and TOPSIS Techniques for Dam Site Selection Using GIS: A Case Study of Sistan and Baluchestan Province, Iran. Geosciences 2018, 8, 494. [Google Scholar] [CrossRef]
- Milillo, P.; Bürgmann, R.; Lundgren, P.; Salzer, J.; Perissin, D.; Fielding, E.; Biondi, F.; Milillo, G. Space Geodetic Monitoring of Engineered Structures: The Ongoing Destabilization of the Mosul Dam, Iraq. Sci. Rep. 2016, 6, 37408. [Google Scholar] [CrossRef]
- Dykes, A.P.; Bromhead, E.N. The Vaiont Landslide: Re-Assessment of the Evidence Leads to Rejection of the Consensus. Landslides 2018, 15, 1815–1832. [Google Scholar] [CrossRef]
- Grebby, S.; Sowter, A.; Gluyas, J.; Toll, D.; Gee, D.; Athab, A.; Girindran, R. Advanced Analysis of Satellite Data Reveals Ground Deformation Precursors to the Brumadinho Tailings Dam Collapse. Commun. Earth Environ. 2021, 2, 2. [Google Scholar] [CrossRef]
- Othman, A.A.; Al-Maamar, A.F.; Al-Manmi, D.A.M.; Liesenberg, V.; Hasan, S.E.; Al-Saady, Y.I.; Shihab, A.T.; Khwedim, K. Application of DInSAR-PSI Technology for Deformation Monitoring of the Mosul Dam, Iraq. Remote Sens. 2019, 11, 2632. [Google Scholar] [CrossRef]
- Wang, Y.; Tian, Y.; Cao, Y. Dam Siting: A Review. Water 2021, 13, 2080. [Google Scholar] [CrossRef]
- Al-Ruzouq, R.; Shanableh, A.; Yilmaz, A.G.; Idris, A.; Mukherjee, S.; Khalil, M.A.; Gibril, M.B. Dam Site Suitability Mapping and Analysis Using an Integrated GIS and Machine Learning Approach. Water 2019, 11, 1880. [Google Scholar] [CrossRef]
- Al-Abadi, A.M.; Shahid, S.; Ghalib, H.B.; Handhal, A.M. A GIS-Based Integrated Fuzzy Logic and Analytic Hierarchy Process Model for Assessing Water-Harvesting Zones in Northeastern Maysan Governorate, Iraq. Arab. J. Sci. Eng. 2017, 42, 2487–2499. [Google Scholar] [CrossRef]
- Noori, A.M.; Pradhan, B.; Ajaj, Q.M. Dam Site Suitability Assessment at the Greater Zab River in Northern Iraq Using Remote Sensing Data and GIS. J. Hydrol. 2019, 574, 964–979. [Google Scholar] [CrossRef]
- Tiwari, K.; Goyal, R.; Sarkar, A. GIS-Based Methodology for Identification of Suitable Locations for Rainwater Harvesting Structures. Water Resour. Manag. 2018, 32, 1811–1825. [Google Scholar] [CrossRef]
- Shao, Z.; Jahangir, Z.; Muhammad Yasir, Q.; Atta-ur-Rahman; Mahmood, S. Identification of Potential Sites for a Multi-Purpose Dam Using a Dam Suitability Stream Model. Water 2020, 12, 3249. [Google Scholar] [CrossRef]
- Dube, T.; Shekede, M.D.; Massari, C. Remote Sensing for Water Resources and Environmental Management. Remote Sens. 2023, 15, 18. [Google Scholar] [CrossRef]
- Bajjali, W. ArcGIS for Environmental and Water Issues; Springer Nature: Cham, Switzerland, 2018; p. 363. [Google Scholar]
- Tong, D.; Murray, A.T. Spatial Optimization in Geography. Ann. Assoc. Am. Geogr. 2012, 102, 1290–1309. [Google Scholar] [CrossRef]
- Murray, A.T.; Xu, J.; Wang, Z.; Church, R.L. Commercial GIS Location Analytics: Capabilities and Performance. Int. J. Geogr. Inf. Sci. 2019, 33, 1106–1130. [Google Scholar] [CrossRef]
- Drobne, S.; Lisec, A. Multi-Attribute Decision Analysis in GIS: Weighted Linear Combination and Ordered Weighted Averaging. Informatica 2009, 33, 459–474. [Google Scholar]
- Saaty, T.L. How to Make a Decision: The Analytic Hierarchy Process. Eur. J. Oper. Res. 1990, 48, 9–26. [Google Scholar] [CrossRef]
- Yıldırım, Ü. Identification of Groundwater Potential Zones Using GIS and Multi-Criteria Decision-Making Techniques: A Case Study Upper Coruh River Basin (NE Turkey). ISPRS Int. J. Geo Inf. 2021, 10, 396. [Google Scholar] [CrossRef]
- Kouli, M.; Loupasakis, C.; Soupios, P.; Rozos, D.; Vallianatos, F. Landslide susceptibility mapping by comparing the WLC and WofE multi-criteria methods in the West Crete Island, Greece. Environ. Earth Sci. 2014, 72, 5197–5219. [Google Scholar] [CrossRef]
- Bashir, B.; Alsalman, A.; Othman, A.A.; Obaid, A.K.; Bashir, H. New Approach to Selecting Civil Defense Centers in Al-Riyadh City (KSA) Based on Multi-Criteria Decision Analysis and GIS. Land 2021, 10, 1108. [Google Scholar] [CrossRef]
- Othman, A.A.; Obaid, A.K.; Al-Manmi, D.A.M.; Pirouei, M.; Salar, S.G.; Liesenberg, V.; Al-Maamar, A.F.; Shihab, A.T.; Al-Saady, Y.I.; Al-Attar, Z.T. Insights for Landfill Site Selection Using GIS: A Case Study in the Tanjero River Basin, Kurdistan Region, Iraq. Sustainability 2021, 13, 12602. [Google Scholar] [CrossRef]
- Doulabian, S.; Ghasemi Tousi, E.; Aghlmand, R.; Alizadeh, B.; Ghaderi Bafti, A.; Abbasi, A. Evaluation of Integrating SWAT Model into a Multi-Criteria Decision Analysis towards Reliable Rainwater Harvesting Systems. Water 2021, 13, 1935. [Google Scholar] [CrossRef]
- Jha, M.K.; Chowdary, V.M.; Kulkarni, Y.; Mal, B.C. Rainwater Harvesting Planning Using Geospatial Techniques and Multicriteria Decision Analysis. Resour. Conserv. Recycl. 2014, 83, 96–111. [Google Scholar] [CrossRef]
- Adham, A.; Riksen, M.; Ouessar, M.; Ritsema, C. Identification of Suitable Sites for Rainwater Harvesting Structures in Arid and Semi-Arid Regions: A Review. Int. Soil Water Conserv. Res. 2016, 4, 108–120. [Google Scholar]
- Preeti, P.; Shendryk, Y.; Rahman, A. Identification of Suitable Sites Using GIS for Rainwater Harvesting Structures to Meet Irrigation Demand. Water 2022, 14, 3480. [Google Scholar] [CrossRef]
- Ettazarini, S. GIS-Based Land Suitability Assessment for Check Dam Site Location, Using Topography and Drainage Information: A Case Study from Morocco. Environ. Earth Sci. 2021, 80, 567. [Google Scholar] [CrossRef]
- Hashim, H.Q.; Sayl, K.N. Detection of Suitable Sites for Rainwater Harvesting Planning in an Arid Region Using Geographic Information System. Appl. Geomat. 2021, 13, 235–248. [Google Scholar] [CrossRef]
- Sayl, K.N.; Muhammad, N.S.; El-Shafie, A. Robust Approach for Optimal Positioning and Ranking Potential Rainwater Harvesting Structure (RWH): A Case Study of Iraq. Arab. J. Geosci. 2017, 10, 413. [Google Scholar] [CrossRef]
- Sayl, K.N.; Sulaiman, S.O.; Kamel, A.H.; Muhammad, N.S.; Abdullah, J.; Al-Ansari, N. Minimizing the Impacts of Desertification in an Arid Region: A Case Study of the West Desert of Iraq. Adv. Civ. Eng. 2021, 2021, 5580286. [Google Scholar] [CrossRef]
- Al-Damat, R.; Al-shabeeb, A.A.; Al-Fugara, A.; Al-Amoush, H. The Use of Vector-Based GIS and Multi-Criteria Decision Making (MCDM) for Siting Water Harvesting Dams in Karak Governorate/ South Jordan. J. Nat. Sci. Res. 2017, 7, 28–35. [Google Scholar]
- Al-shabeeb, A.R. The Use of AHP within GIS in Selecting Potential Sites for Water Harvesting Sites in the Azraq Basin—Jordan. J. Geogr. Inf. Syst. 2016, 8, 73–88. [Google Scholar] [CrossRef]
- Aklan, M.; Al-Komaim, M.; de Fraiture, C. Site Suitability Analysis of Indigenous Rainwater Harvesting Systems in Arid and Data-Poor Environments: A Case Study of Sana’a Basin, Yemen. Environ. Dev. Sustain. 2023, 25, 8319–8342. [Google Scholar] [CrossRef]
- Jamali, I.A.; Mörtberg, U.; Olofsson, B.; Shafique, M. A Spatial Multi-Criteria Analysis Approach for Locating Suitable Sites for Construction of Subsurface Dams in Northern Pakistan. Water Resour. Manag. 2014, 28, 5157–5174. [Google Scholar] [CrossRef]
- Rahmati, O.; Kalantari, Z.; Samadi, M.; Uuemaai, E.; Moghaddam, D.D.; Nalivan, O.A.; Destouni, G.; Tien Bui, D. GIS-Based Site Selection for Check Dams in Watersheds: Considering Geomorphometric and Topo-Hydrological Factors. Sustainability 2019, 11, 5639. [Google Scholar] [CrossRef]
- Karimi, H.; Zeinivand, H. Integrating Runoff Map of a Spatially Distributed Model and Thematic Layers for Identifying Potential Rainwater Harvesting Suitability Sites Using GIS Techniques. Geocarto Int. 2021, 36, 320–339. [Google Scholar] [CrossRef]
- Luís, A.d.A.; Cabral, P. Small Dams/Reservoirs Site Location Analysis in a Semi-Arid Region of Mozambique. Int. Soil Water Conserv. Res. 2021, 9, 381–393. [Google Scholar] [CrossRef]
- Askar, S.; Zeraat Peyma, S.; Yousef, M.M.; Prodanova, N.A.; Muda, I.; Elsahabi, M.; Hatamiafkoueieh, J. Flood Susceptibility Mapping Using Remote Sensing and Integration of Decision Table Classifier and Metaheuristic Algorithms. Water 2022, 14, 3062. [Google Scholar] [CrossRef]
- Al-Saady, Y.I.; Al-Suhail, Q.A.; Al-Tawash, B.S.; Othman, A.A. Drainage Network Extraction and Morphometric Analysis Using Remote Sensing and GIS Mapping Techniques (Lesser Zab River Basin, Iraq and Iran). Environ. Earth Sci. 2016, 75, 1243. [Google Scholar] [CrossRef]
- Othman, A.A.; Gloaguen, R. Improving Lithological Mapping by SVM Classification of Spectral and Morphological Features: The Discovery of a New Chromite Body in the Mawat Ophiolite Complex (Kurdistan, NE Iraq). Remote Sens. 2014, 6, 6867–6896. [Google Scholar] [CrossRef]
- Ma’ala, K.A. The Geology of Sulaimaniya Quadrangle Sheet No. NI-38-3, Scale 1:250000; GEOSURV: Baghdad, Iraq, 2008. [Google Scholar]
- OpenTopography. Available online: https://portal.opentopography.org/raster?opentopoID=OTSDEM.032021.4326.3 (accessed on 22 July 2022).
- Al-Saady, Y.; Merkel, B.; Al-Tawash, B.; Al-Suhail, Q. Land Use and Land Cover (LULC) Mapping and Change Detection in the Little Zab River Basin (LZRB), Kurdistan Region, NE Iraq and NW Iran. Freib. Online Geosci. 2015, 43, 1–32. [Google Scholar]
- The Humanitarian Data Exchange. Available online: https://data.humdata.org/dataset/iraq-populated-places-2021 (accessed on 12 August 2022).
- Fischer, G.; Nachtergaele, F.; Prieler, S.; van Velthuizen, H.T.; Verelst, L.; Wiberg, D. Global Agro-Ecological Zones Assessment for Agriculture (GAEZ 2008); IIASA: Laxenburg, Austria; FAO: Rome, Italy, 2008; Available online: https://www.fao.org/soils-portal/data-hub/soil-maps-and-databases/harmonized-world-soil-database-v12/en/ (accessed on 1 July 2022).
- Tropical Rainfall Measurement Mission Project (TRMM_3B43). Available online: https://disc.gsfc.nasa.gov/datasets/TRMM_3B43_7/summary (accessed on 14 June 2022).
- Kummerow, C.; Barnes, W.; Kozu, T.; Shiue, J.; Simpson, J. The Tropical Rainfall Measuring Mission (TRMM) Sensor Package. J. Atmos. Ocean. Technol. 1998, 15, 809–817. [Google Scholar] [CrossRef]
- Park, S.; Lee, J.; Yeom, J.; Seo, E.; Im, J. Performance of Drought Indices in Assessing Rice Yield in North Korea and South Korea under the Different Agricultural Systems. Remote Sens. 2022, 14, 6161. [Google Scholar] [CrossRef]
- Othman, A.A.; Ali, S.S.; Salar, S.G.; Obaid, A.K.; Al-Kakey, O.; Liesenberg, V. Insights for Estimating and Predicting Reservoir Sedimentation Using the RUSLE-SDR Approach: A Case of Darbandikhan Lake Basin, Iraq–Iran. Remote Sens. 2023, 15, 697. [Google Scholar] [CrossRef]
- Madani, A.; Niyazi, B. Groundwater Potential Mapping Using Remote Sensing and Random Forest Machine Learning Model: A Case Study from Lower Part of Wadi Yalamlam, Western Saudi Arabia. Sustainability 2023, 15, 2772. [Google Scholar] [CrossRef]
- Liu, J.; Huang, B.; Chen, L.; Yang, J.; Chen, X. Evaluation of GPM and TRMM and Their Capabilities for Capturing Solid and Light Precipitations in the Headwater Basin of the Heihe River. Atmosphere 2023, 14, 453. [Google Scholar] [CrossRef]
- Ministry of Agriculture and Water Resources (MAWR). Dams Master Plan for Kurdistan; Ministry of Agriculture and Water Resources (MAWR): Erbil, Iraq, 2013. [Google Scholar]
- Guitouni, A.; Martel, J.-M. Tentative Guidelines to Help Choosing an Appropriate MCDA Method. Eur. J. Oper. Res. 1998, 109, 501–521. [Google Scholar] [CrossRef]
- Roy, B.; Słowiński, R. Questions guiding the choice of a multicriteria decision aiding method. EURO J. Decis. Process. 2013, 1, 69–97. [Google Scholar] [CrossRef]
- Triantaphyllou, E. Multi-Criteria Decision Making Methods: A Comparative Study, 1st ed.; Springer: New York, NY, USA, 2000; p. 290. [Google Scholar]
- Mulliner, E.; Malys, N.; Maliene, V. Comparative Analysis of MCDM Methods for the Assessment of Sustainable Housing Affordability. Omega 2016, 59, 146–156. [Google Scholar] [CrossRef]
- Diouf, R.; Ndiaye, M.L.; Traore, V.B.; Sambou, H.; Giovani, M.; Lo, Y.; Sambou, B.; Diaw, A.T.; Beye, A.C. Multi Criteria Evaluation Approach Based on Remote Sensing and GIS for Identification of Suitable Areas to the Implantation of Retention Basins and Artificial Lakes in Senegal. Am. J. Geogr. Inf. Syst. 2017, 6, 1–13. [Google Scholar]
- Wind, Y.; Saaty, T.L. Marketing Applications of the Analytic Hierarchy Process. Manag. Sci. 1980, 26, 641–658. [Google Scholar] [CrossRef]
- Saaty, T.L. The Analytic Hierarchy Process in Conflict Management. Int. J. Confl. Manag. 1990, 1, 47–68. [Google Scholar] [CrossRef]
- Saaty, T.L.; Vargas, L.G. Models, Methods, Concepts & Applications of the Analytic Hierarchy Process, 2nd ed.; Springer: New York, NY, USA, 2012; p. 346. [Google Scholar]
- Saaty, T.L. Decision Making with the Analytic Hierarchy Process. Int. J. Serv. Sci. 2008, 1, 83–98. [Google Scholar] [CrossRef]
- Jiang, Y.; Lv, A.; Yan, Z.; Yang, Z. A GIS-Based Multi-Criterion Decision-Making Method to Select City Fire Brigade: A Case Study of Wuhan, China. ISPRS Int. J. Geo Inf. 2021, 10, 777. [Google Scholar] [CrossRef]
- Al-Abadi, A.; Al-Shamma’a, A. Groundwater Potential Mapping of the Major Aquifer in Northeastern Missan Governorate, South of Iraq by Using Analytical Hierarchy Process and GIS. J. Environ. Earth Sci. 2014, 4, 125–150. [Google Scholar]
- Ki, S.J.; Ray, C. Using Fuzzy Logic Analysis for Siting Decisions of Infiltration Trenches for Highway Runoff Control. Sci. Total Environ. 2014, 493, 44–53. [Google Scholar] [CrossRef]
- Radulović, M.; Brdar, S.; Mesaroš, M.; Lukić, T.; Savić, S.; Basarin, B.; Crnojević, V.; Pavić, D. Assessment of Groundwater Potential Zones Using GIS and Fuzzy AHP Techniques—A Case Study of the Titel Municipality (Northern Serbia). ISPRS Int. J. Geo Inf. 2022, 11, 257. [Google Scholar] [CrossRef]
- Alemdar, K.D.; Kaya, Ö.; Çodur, M.Y.; Campisi, T.; Tesoriere, G. Accessibility of Vaccination Centers in COVID-19 Outbreak Control: A GIS-Based Multi-Criteria Decision Making Approach. ISPRS Int. J. Geo Inf. 2021, 10, 708. [Google Scholar] [CrossRef]
- Pathmanandakumar, V.; Thasarathan, N.; Ranagalage, M. An Approach to Delineate Potential Groundwater Zones in Kilinochchi District, Sri Lanka, Using GIS Techniques. ISPRS Int. J. Geo Inf. 2021, 10, 730. [Google Scholar] [CrossRef]
- Pilevar, A.R.; Matinfar, H.R.; Sohrabi, A.; Sarmadian, F. Integrated Fuzzy, AHP and GIS Techniques for Land Suitability Assessment in Semi-Arid Regions for Wheat and Maize Farming. Ecol. Indic. 2020, 110, 105887. [Google Scholar] [CrossRef]
- Saaty, T.L.; Ozdemir, M.S. Why the Magic Number Seven Plus or Minus Two. Math. Comput. Model. 2003, 38, 233–244. [Google Scholar] [CrossRef]
- Njiru, F.M.; Siriba, D.N. Site Selection for an Earth Dam in Mbeere North, Embu County—Kenya. J. Geosci. Environ. Prot. 2018, 6, 113–133. [Google Scholar] [CrossRef]
- Lawa, F.A.; Koyi, H.; Ibrahim, A. Tectono-Stratigraphic Evolution of the NW Segment of the Zagros Fold-Thrust Belt, Kurdistan, NE Iraq. J. Pet. Geol. 2013, 36, 75–96. [Google Scholar] [CrossRef]
- Othman, A.A.; Gloaguen, R. Automatic Extraction and Size Distribution of Landslides in Kurdistan Region, NE Iraq. Remote Sens. 2013, 5, 2389–2410. [Google Scholar] [CrossRef]
- Jassim, S.Z.; Goff, J.C. Geology of Iraq, 1st ed.; Dolin: Prague, Czech Republic; Moravian Museum: Brno, Czech Republic, 2006; p. 486. [Google Scholar]
- Ghazal, N.K.; Salman, S.R. Determining the Optimum Site of Small Dams Using Remote Sensing Techniques and GIS. Int. J. Sci. Eng. Res. 2015, 3, 69–73. [Google Scholar]
- Forzieri, G.; Gardenti, M.; Caparrini, F.; Castelli, F. A Methodology for the Pre-Selection of Suitable Sites for Surface and Underground Small Dams in Arid Areas: A Case Study in the Region of Kidal, Mali. Phys. Chem. Earth Parts A/B/C 2008, 33, 74–85. [Google Scholar] [CrossRef]
- Kramm, T.; Hoffmeister, D.; Curdt, C.; Maleki, S.; Khormali, F.; Kehl, M. Accuracy Assessment of Landform Classification Approaches on Different Spatial Scales for the Iranian Loess Plateau. ISPRS Int. J. Geo Inf. 2017, 6, 366. [Google Scholar] [CrossRef]
- Mokarrama, M.; Hojati, M. Landform Classification Using a Sub-Pixel Spatial Attraction Model to Increase Spatial Resolution of Digital Elevation Model (DEM). Egypt. J. Remote Sens. Space Sci. 2018, 21, 111–120. [Google Scholar] [CrossRef]
- Nellemann, C.; Reynolds, P.E. Predicting Late Winter Distribution of Muskoxen Using an Index of Terrain Ruggedness. Arct. Alp. Res. 1997, 29, 334. [Google Scholar] [CrossRef]
- De Reu, J.; Bourgeois, J.; Bats, M.; Zwertvaegher, A.; Gelorini, V.; De Smedt, P.; Chu, W.; Antrop, M.; De Maeyer, P.; Finke, P.; et al. Application of the Topographic Position Index to Heterogeneous Landscapes. Geomorphology 2013, 186, 39–49. [Google Scholar] [CrossRef]
- Tagil, S.; Jenness, J. GIS-Based Automated Landform Classification and Topographic, Landcover and Geologic Attributes of Landforms Around the Yazoren Polje, Turkey. J. Appl. Sci. 2008, 8, 910–921. [Google Scholar] [CrossRef]
- Lewis, S.M.; Fitts, G.; Kelly, M.; Dale, L. A Fuzzy Logic-Based Spatial Suitability Model for Drought-Tolerant Switchgrass in the United States. Comput. Electron. Agric. 2014, 103, 39–47. [Google Scholar] [CrossRef]
- Aluko, O.E.; Igwe, O. An Integrated Geomatics Approach to Groundwater Potential Delineation in the Akoko-Edo Area, Nigeria. Environ. Earth Sci. 2017, 76, 240. [Google Scholar] [CrossRef]
- Elewa, H.H.; Qaddah, A.A.; El-feel, A.A. Determining Potential Sites for Runoff Water Harvesting Using Remote Sensing and Geographic Information Systems-Based Modeling in Sinai. Am. J. Environ. Sci. 2012, 8, 42–55. [Google Scholar]
- Sayl, K.N.; Muhammad, N.S.; Yaseen, Z.M.; El-shafie, A. Estimation the Physical Variables of Rainwater Harvesting System Using Integrated GIS-Based Remote Sensing Approach. Water Resour. Manag. 2016, 30, 3299–3313. [Google Scholar] [CrossRef]
- Salar, S.G.; Othman, A.A.; Hasan, S.E. Identification of Suitable Sites for Groundwater Recharge in Awaspi Watershed Using GIS and Remote Sensing Techniques. Environ. Earth Sci. 2018, 77, 701. [Google Scholar] [CrossRef]
- Shahzad, F.; Gloaguen, R. TecDEM: A MATLAB Based Toolbox for Tectonic Geomorphology, Part 1: Drainage Network Preprocessing and Stream Profile Analysis. Comput. Geosci. 2011, 37, 250–260. [Google Scholar] [CrossRef]
- Shahzad, F.; Gloaguen, R. TecDEM: A MATLAB Based Toolbox for Tectonic Geomorphology, Part 2: Surface Dynamics and Basin Analysis. Comput. Geosci. 2011, 37, 261–271. [Google Scholar] [CrossRef]
- Deus, D.; Gloaguen, R. Remote Sensing Analysis of Lake Dynamics in Semi-Arid Regions: Implication for Water Resource Management. Lake Manyara, East African Rift, Northern Tanzania. Water 2013, 5, 698–727. [Google Scholar] [CrossRef]
- Rana, V.K.; Suryanarayana, T.M.V. GIS-Based Multi Criteria Decision Making Method to Identify Potential Runoff Storage Zones within Watershed. Ann. GIS 2020, 26, 149–168. [Google Scholar] [CrossRef]
- Yegizaw, E.S.; Ejegu, M.A.; Tolossa, A.T.; Teka, A.H.; Andualem, T.G.; Tegegne, M.A.; Walle, W.M.; Shibeshie, S.E.; Dirar, T.M. Geospatial and AHP Approach Rainwater Harvesting Site Identification in Drought-Prone Areas, South Gonder Zone, Northwest Ethiopia. J. Indian Soc. Remote Sens. 2022, 50, 1321–1331. [Google Scholar] [CrossRef]
- Alrawi, I.; Chen, J.; Othman, A.A. Groundwater Potential Zone Mapping: Integration of Multi-Criteria Decision Analysis (MCDA) and GIS Techniques for the Al-Qalamoun Region in Syria. ISPRS Int. J. Geo Inf. 2022, 11, 603. [Google Scholar] [CrossRef]
- Glendenning, C.J.; van Ogtrop, F.F.; Mishra, A.K.; Vervoort, R.W. Balancing Watershed and Local Scale Impacts of Rain Water Harvesting in India—A Review. Agric. Water Manag. 2012, 107, 1–13. [Google Scholar] [CrossRef]
- Karmakar, M.; Ghosh, D. A GIS-Based Approach for Identification of Optimum Runoff Harvesting Sites and Storage Estimation: A Study from Subarnarekha-Kangsabati Interfluve, India. Appl. Geomat. 2022, 14, 253–266. [Google Scholar] [CrossRef]
- M Amen, A.R.; Mustafa, A.; Kareem, D.A.; Hameed, H.M.; Mirza, A.A.; Szydłowski, M.; Saleem, B.K.M. Mapping of Flood-Prone Areas Utilizing GIS Techniques and Remote Sensing: A Case Study of Duhok, Kurdistan Region of Iraq. Remote Sens. 2023, 15, 1102. [Google Scholar] [CrossRef]
- AL-Hussein, A.A.M.; Khan, S.; Ncibi, K.; Hamdi, N.; Hamed, Y. Flood Analysis Using HEC-RAS and HEC-HMS: A Case Study of Khazir River (Middle East—Northern Iraq). Water 2022, 14, 3779. [Google Scholar] [CrossRef]
- Sissakian, V.K.; Al-Ansari, N.; Adamo, N.; Abdul Ahad, I.D.; Abed, S.A. Flood Hazards in Erbil City Kurdistan Region Iraq, 2021: A Case Study. Engineering 2022, 14, 591–601. [Google Scholar] [CrossRef]
- Al-Nassar, A.R.; Kadhim, H. Mapping Flash Floods in Iraq by Using GIS. Environ. Sci. Proc. 2021, 8, 39. [Google Scholar]
- Shaw, E.M.; Beven, K.J.; Chappell, N.A.; Lamb, R. Hydrology in Practice, 4th ed.; CRC Press: London, UK, 2011; p. 546. [Google Scholar]
- Kucukali, S.; Al Bayatı, O.; Maraş, H.H. Finding the Most Suitable Existing Irrigation Dams for Small Hydropower Development in Turkey: A GIS-Fuzzy Logic Tool. Renew. Energy 2021, 172, 633–650. [Google Scholar] [CrossRef]
- Kalogeropoulos, K.; Stathopoulos, N.; Psarogiannis, A.; Pissias, E.; Louka, P.; Petropoulos, G.P.; Chalkias, C. An Integrated GIS-Hydro Modeling Methodology for Surface Runoff Exploitation via Small-Scale Reservoirs. Water 2020, 12, 3182. [Google Scholar] [CrossRef]
- Khanaqa, P.; Karim, K.H.; Riegel, W. Evidence of a Quaternary Dammed Lake in the Mawat-Chwarta Area, Western Zagros, Kurdistan Region, NE-Iraq. Catena 2015, 125, 74–81. [Google Scholar] [CrossRef]
- Elbeltagi, A.; Al-Mukhtar, M.; Kushwaha, N.L.; Al-Ansari, N.; Vishwakarma, D.K. Forecasting Monthly Pan Evaporation Using Hybrid Additive Regression and Data-Driven Models in a Semi-Arid Environment. Appl. Water Sci. 2023, 13, 42. [Google Scholar] [CrossRef]
- Al-Mukhtar, M. Modeling of Pan Evaporation Based on the Development of Machine Learning Methods. Theor. Appl. Climatol. 2021, 146, 961–979. [Google Scholar] [CrossRef]


Disclaimer/Publisher’s Note: The statements, opinions and data contained in all publications are solely those of the individual author(s) and contributor(s) and not of MDPI and/or the editor(s). MDPI and/or the editor(s) disclaim responsibility for any injury to people or property resulting from any ideas, methods, instructions or products referred to in the content. |
© 2023 by the authors. Licensee MDPI, Basel, Switzerland. This article is an open access article distributed under the terms and conditions of the Creative Commons Attribution (CC BY) license (https://creativecommons.org/licenses/by/4.0/).