Article

Usefulness of an Urban Growth Model in Creating Scenarios for City Resilience Planning: An End-User Perspective

by
Ripan Debnath
*,
Christopher Pettit
,
Balamurugan Soundararaj
,
Sara Shirowzhan
and
Ajith Shamila Jayasekare
City Futures Research Centre, University of New South Wales, Sydney 2052, Australia
*
Author to whom correspondence should be addressed.
ISPRS Int. J. Geo-Inf. 2023, 12(8), 311; https://doi.org/10.3390/ijgi12080311
Submission received: 3 June 2023 / Revised: 20 July 2023 / Accepted: 28 July 2023 / Published: 30 July 2023

Abstract

:
Urban growth models are increasingly being used to generate scenarios within city and regional planning support systems (PSS). However, their usefulness in land use planning applications, particularly in city resilience planning, is not fully understood. Thus, we developed a cellular automata model using Metronamica PSS for the Greater Sydney region and assessed its usefulness as perceived by planning and policy practitioners. The study was implemented through a collaborative geodesign workshop where participants (n = 19) were guided to an understanding of the modelling process and to create and validate alternative policy scenarios for 2050 that reflected Business-As-Usual, Bushfire resilience, Flood resilience, and Combined resilience. We conducted two surveys and a SWOT analysis to assess the usefulness of the PSS and its outputs. We found that the PSS created credible scenarios using collaborative inputs from the participants. The PSS had perceived value for informing participants about land use changes in the resilience planning contexts with high flexibility and granularity. The plausibility of the scenario outputs, a usefulness parameter, was readily accepted, but the model’s transparency (another parameter) was seen as potentially inhibiting application in real-world planning. Future research should involve a broader audience, including the local community, in analysing the usefulness of PSS.

1. Introduction

In the last two decades urban growth models (UGMs) have been increasingly adopted in planning to create future scenarios [1,2]. UGMs analyse spatial interactions within a complex urban system to model and forecast land use/cover change [3]. Such models are diverse in their methodologies and principles and deal with diverse problems [4], including urban sprawl [5], city vertical growth [6], and sustainability [7], as well as natural resource management, including farm lands [8], protected areas [9], and urban ecology [10]. In a context of increasing uncertainty from climate change, UGMs can assist by modelling and visualising alternative scenarios for climate-conscious development [11], as well as manage context-specific natural hazard risks, for example, flood [2] and urban heat island [12]. UGMs constitute a specialised branch of digital tools known as planning support systems (PSS) [3]. Such data-driven PSS offer great potential for city and regional planners in enabling them to formulate and evaluate urban growth and change scenarios [13,14].
Given their potential for enhancing urban planning, assessing the usefulness of PSS has been a subject of great interest to the scientific community [14,15,16,17,18]. The usefulness of a PSS is a function of its utility and its useability. A PSS must fit its use context: task, available technology, and user [15,17]. The ‘user’ in this process is typically the developer or the expert user/modeller who implements the tool. For example, a pioneering study by Vonk, et al. [19] asked nearly 100 PSS experts to identify the usefulness of such tools and the bottlenecks in planning application. In a recent study, Jiang, Geertman and Witte [15] further explored the usefulness of PSS tools by surveying 268 experts with pertinent knowledge and specialised skills.
There are exceptions, but stakeholder or end-user experience with PSS is not typically evaluated [20], and usefulness is rarely assessed. Exceptions include a study by Rzeszewski and Kotus [21], who analysed the usefulness of an online participatory mapping platform/PSS using observations, eye tracking, and surveys with 30 participants in a controlled environment. Similarly, Pelzer [17] assessed PSS usefulness based on surveys, observations, and qualitative assessment with multidisciplinary stakeholders using a workshop approach in a technology-enabled environment. Several studies have reported on the utility to stakeholders of PSS tools [22,23,24]. The other aspect of usefulness, useability, has been evaluated and documented by Afrooz, et al. [25], Debnath, Pettit, Leao and Lock [20], and Kuby, et al. [26].
Still, to the best of our knowledge, the usefulness of UGMs has not been rigorously assessed. Triantakonstantis and Mountrakis [27] surveyed 242 modelling and planning experts to get their views on the potential of such models in decision making. Although usefulness was not specifically assessed, their approach and findings were similar to those of Vonk, Geertman and Schot [19]. Local stakeholders have been involved, in many instances, in the provision of UGM inputs and in reviewing results [1,28,29,30]. However, reports on these endeavours said little about PSS usefulness in addressing their planning needs. Castella, Trung and Boissau [28] performed a ‘social validation’ to understand if the modelling results accurately represented reality but reported no further stakeholder insights about the generated scenarios.
Overall, a broader perspective on the usefulness of PSS is largely absent. Stakeholders, who include non-expert users such as policy makers and decision makers, as well as the community, have been insufficiently consulted. This is particularly true of PSS that use complex system models like UGMs. This paper reports on research addressing this gap. The usefulness of a UGM and its generated outputs were assessed by non-expert stakeholders (potential end users). In particular, the research sought their views on the potential and limitations of the PSS for creating plausible scenarios. To this end, we adapted the usefulness assessment framework of Jiang, Geertman and Witte [15] and extended it to include non-expert stakeholders (Figure 1). Although experts also have a role in usefulness assessment, stakeholders are critical, as they determine whether a PSS is useful in practice and whether the outputs are implemented in planning.

2. Materials and Method

A cellular automata (CA) model was adopted to simulate the intricate spatial processes of land use/cover change [31,32]. Geodesign was used as the collaborative planning framework for multistakeholder engagement. We collected primary data for usefulness assessment of the data-driven modelling during a collaborative geodesign workshop held in a planning support theatre [33]. The ex post of a developed UGM, creating plausible scenarios, is the main focus of this usefulness study. As a result, the model development process is covered briefly here, but a greater emphasis is placed on explaining the interfacing of stakeholders with the model to help them in perceiving its usefulness. The following sections provide more information on these.

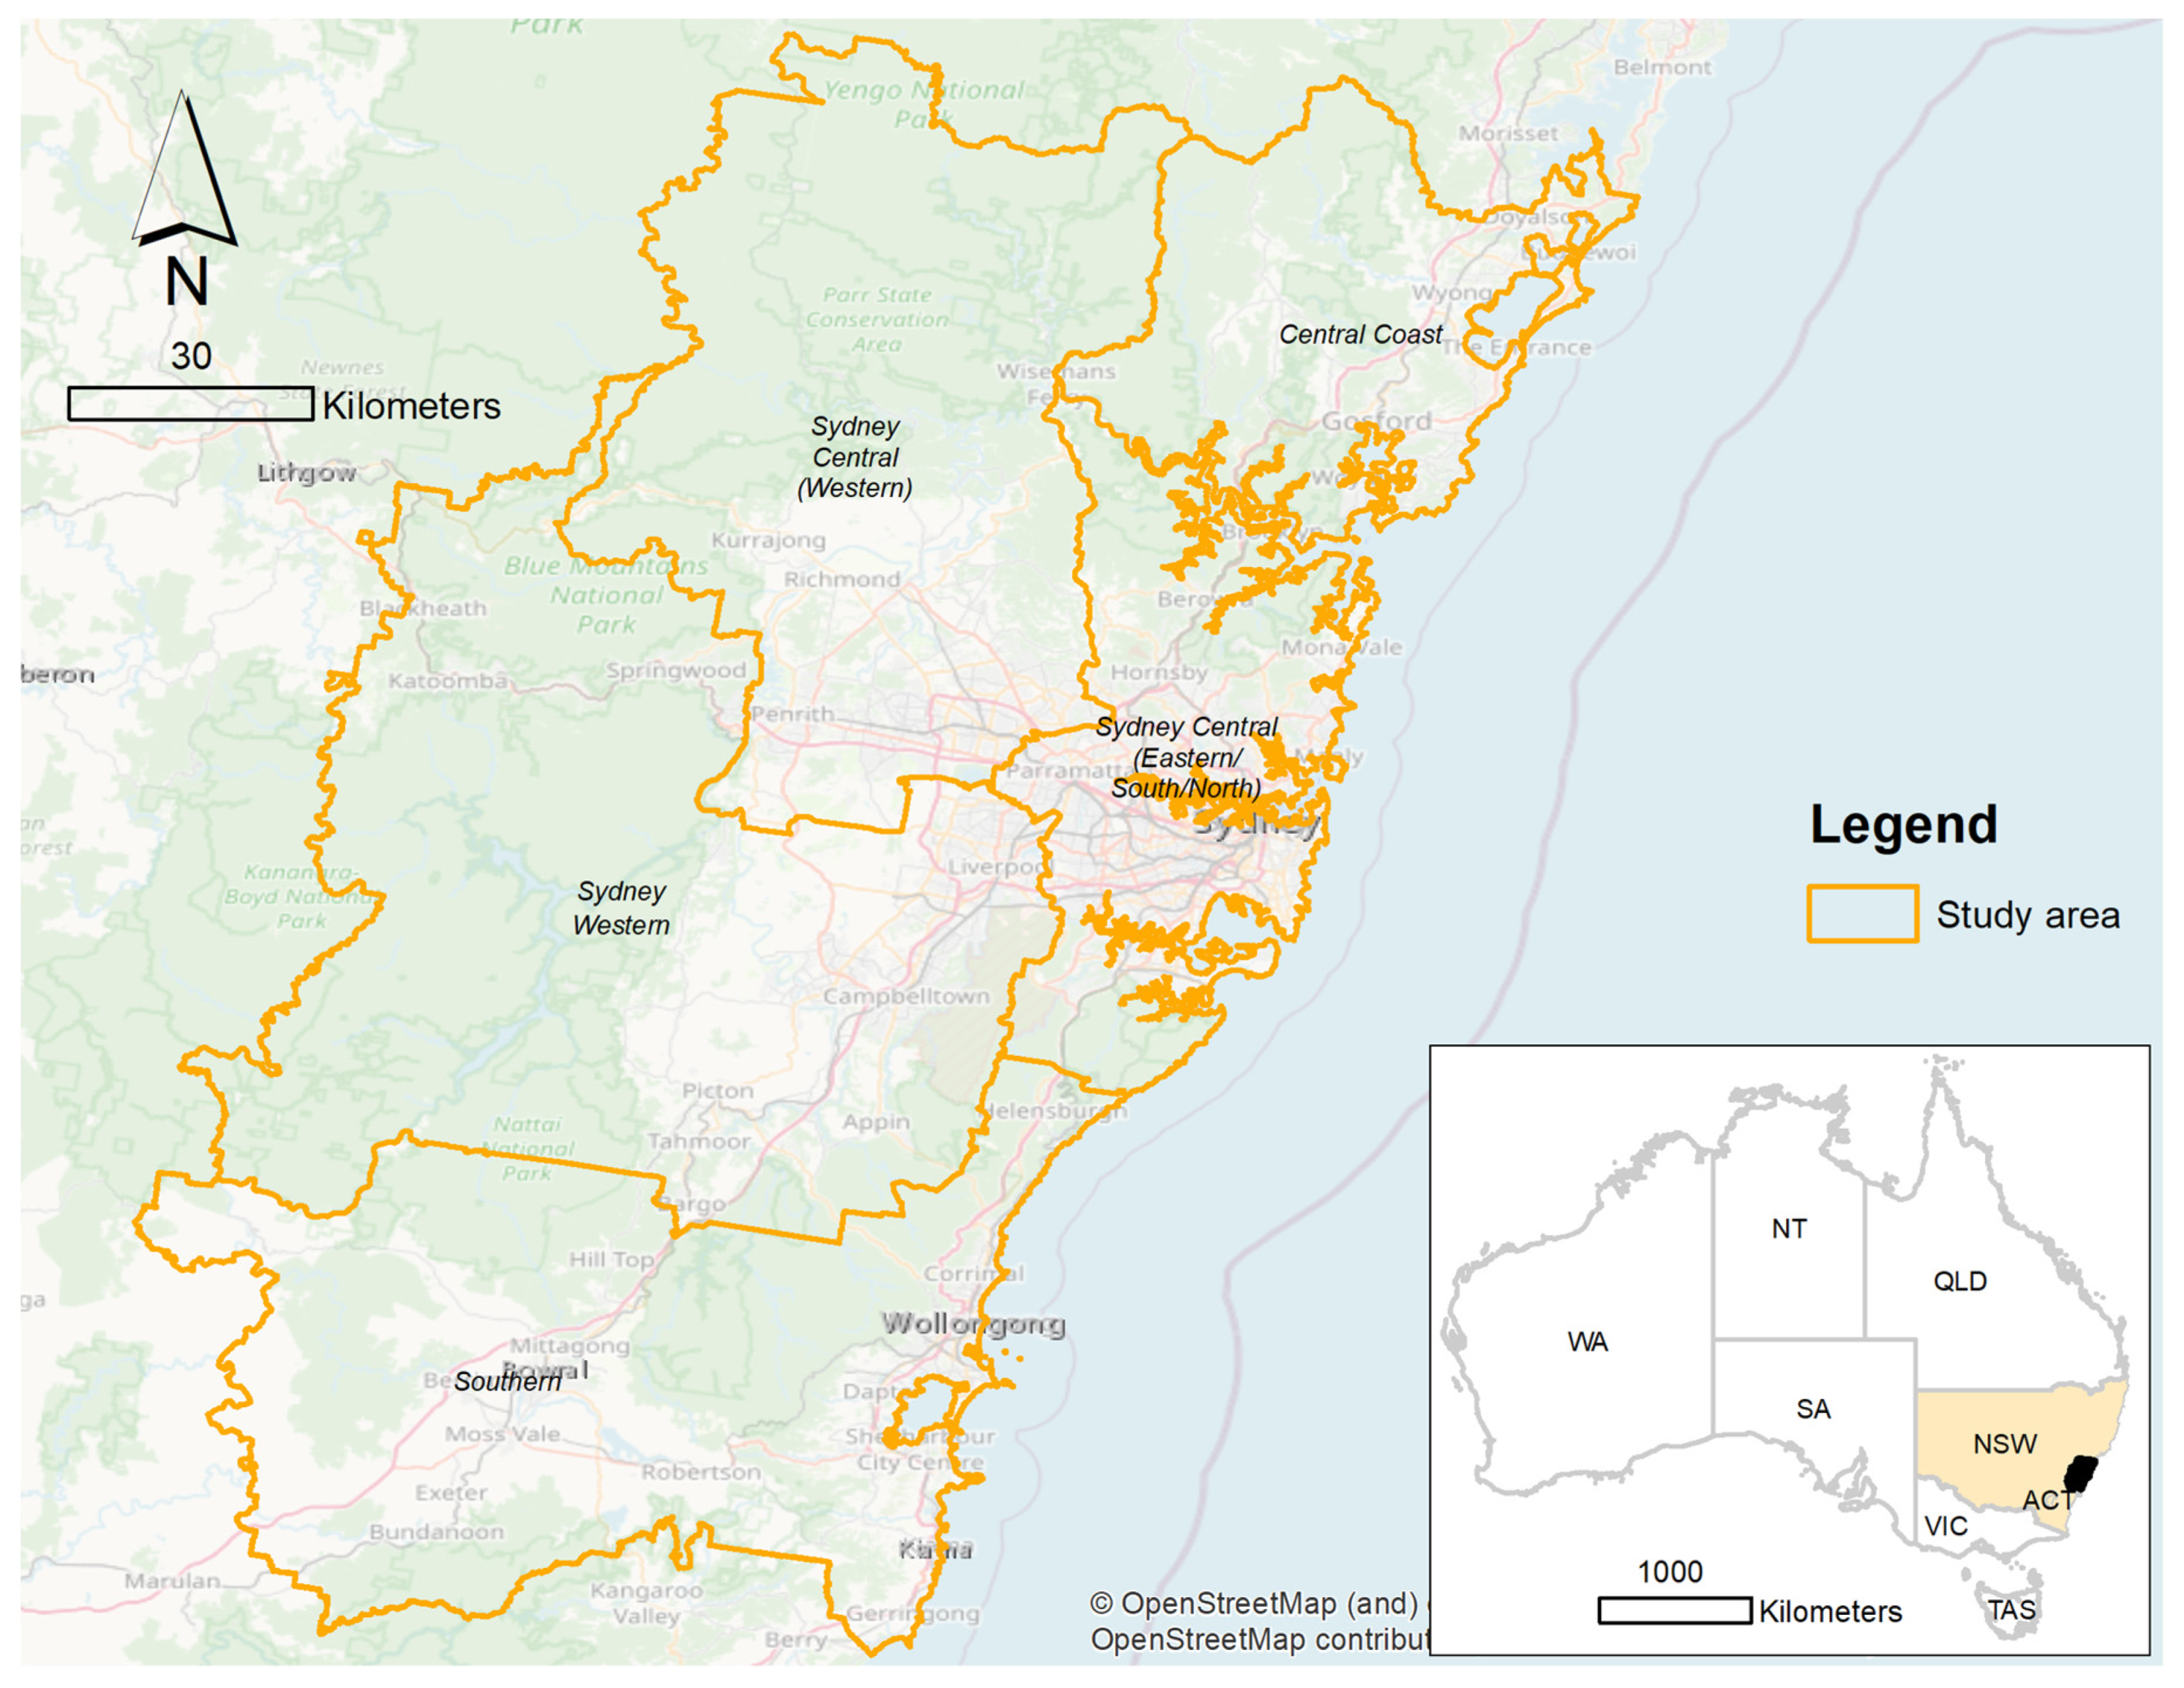
2.1. Study Area and End-User Selection

This research was implemented through a case study undertaken in the Greater Sydney metropolitan region and adjoining local government areas (LGAs) in New South Wales (NSW), Australia (Figure 2). This region is prone to floods and bushfires, and its city resilience strategy [34] advocates for minimising the associated hazards. Furthermore, NSW’s Climate Change Policy [35] aspires to make the region more resilient by 2050, which requires that the modelling timeframe align with it for the resilience scenario planning case study.
We considered a situation, like Rzeszewski and Kotus [21], in which applying a UGM is highly relevant to resilient Greater Sydney policy making, and its usefulness is evaluated in that process. Hence, involving key stakeholders from various agencies with strong roles in planning and policy making for the study area was critical. Therefore, we sent invitations out to various government agencies, including the NSW Department of Planning and Environment, the NSW Department of Premier and Cabinet, the NSW Treasury, the Greater Cities Commission, the City of Sydney, and Penrith City Council, as well as private organisation like AECOM. The targeted participants had expertise in development planning in urban areas, research and analysis, disaster risk management, sustainability, economic growth, housing, infrastructure, and policy making.

2.2. Urban Growth Modelling Process

CAs are discrete dynamic models that have gained a lot of attention and been widely used for their simplicity, flexibility, and intuitiveness [3,4,6,32]. CA modelling has a long history of development, dating back to the 1940s [4], having been popularised through Conway’s Game of Life in 1970 [36]. The evolution of CA modelling has been tracked by Li and Gong [4] and Yeh, Li and Xia [32]. Among hundreds of available CA models [36], SLEUTH [37] and Metronamica [38] are noteworthy for their extensive use in urban and regional planning.
Metronamica (www.metronamica.nl accessed on 17 March 2021), a constraint CA-based modelling software/PSS [39], was selected for this study. It is recognised for its efficiency in multiclass land use change simulation and its strong integration with geographic information systems (GIS) [40]. Metronamica PSS models cell transition within a 196-cell concentric neighbourhood and uniquely incorporates distance decay functions. Growth modelling using Metronamica PSS requires five GIS input layers: land use, suitability, zoning, accessibility, and a boundary layer. A regional migration model and a transport model can optionally feed these drivers of land use change back into the model as it iterates to the next time step [41].
A regional migration model with population and economic parameters was developed within the Metronamica PSS. This model estimated the exogenous parameters that globally constrain the growth to allocate and simulate across the study area. The modelled area was subdivided into five geographic regions (Figure 2), each with dynamic population and employment changes based on their relative growth potentials. The spatial resolution of the configured model was one hectare (100 × 100 metre), in accord with García-Álvarez, et al. [42].
The model was configured using initial land use data for 2007 provided by the NSW Department of Planning and Environment [43] and was calibrated using land use data for 2020 provided by the Australian Bureau of Agricultural and Resource Economics and Sciences [44]. It was set up with 13 broad land use classes, of which 9 were actively simulated during the projection of scenarios for 2050.
The modelling process relied on only open-source data collected through different data-sharing portals such, as Sharing and Enabling Environmental Data in NSW (SEED), NSW’s Spatial Collaboration, Transport for NSW’s (TfNSW) Open Data, the Australian Urban Research Infrastructure Network (AURIN), and the Department of Agriculture. Table 1 lists the core datasets used in this model. The standard configuration processes of Metronamica PSS [38,45] were followed in setting up the model.
After setup, the modelling process initiates calibration and determines a total transition potential score of each cell (c) at time t. Based on the transition potential scores (equation below), the model allocates space for each land use without encroaching on any constrained areas defined during setup. The model was manually calibrated, including setting the neighbourhood effect ( t V f c ), using Metronamica’s usual process [45]. At this stage, several factors that influence suitability were introduced into the model, including slope, strategic agricultural land, future residential and employment lands, and school locations. The model data also included accessibility parameters: road network, railway network with stations, and airport locations. The study area’s local environmental plan (LEP) was used as the zoning parameter in the model. The model’s random disturbance coefficient was calibrated to 0.65, which influences the model seeding and subsequent growth dynamics in the planning zones [47]. The transition potential score ( t P f c ) is then a function (f) of the neighbourhood potential ( t R f c ), accessibility ( t A f c ), zoning ( t Z f c ), and suitability ( t S f c ) parameters:
t P f c = t V f c t A f c t Z f c t S f c t V f c   2 t A f c t Z f c t S f c                   i f   t V f c 0 e l s e
where t V f c = t R f c   1 + e t R f c     i f   α > 0 e l s e .
The calibrated model was evaluated and compared with the performance of a neutral model—a random constraint match (RCM) model [48] in this case—in simulating actual land use in 2020. Standard Kappa [49] and Fuzzy Kappa [50] statistics were used for comparison. The Kappa index indicates the degree of agreement between the corresponding cell values in two maps. Fuzzy Kappa also performs a cell-by-cell comparison for a fuzzy set map, which takes the neighbourhood of a cell into account to express the similarity of that cell. Higher values between 0 and 1 in each index imply a better-performing model. Our model outperformed the RCM in both Kappa (0.973 vs. 0.893) and Fuzzy Kappa (0.981 vs. 0.921).
Using this calibrated model, a baseline, business-as-usual (BAU) scenario for 2050 was developed. This BAU scenario was guided by existing planning and infrastructure strategies such as the Western Sydney Aerotropolis [51] plan and the Greater Sydney Services and Infrastructure Plan [52]. Until this stage, stakeholders had not been involved. Their interaction with the model began with creation of resilience scenarios.

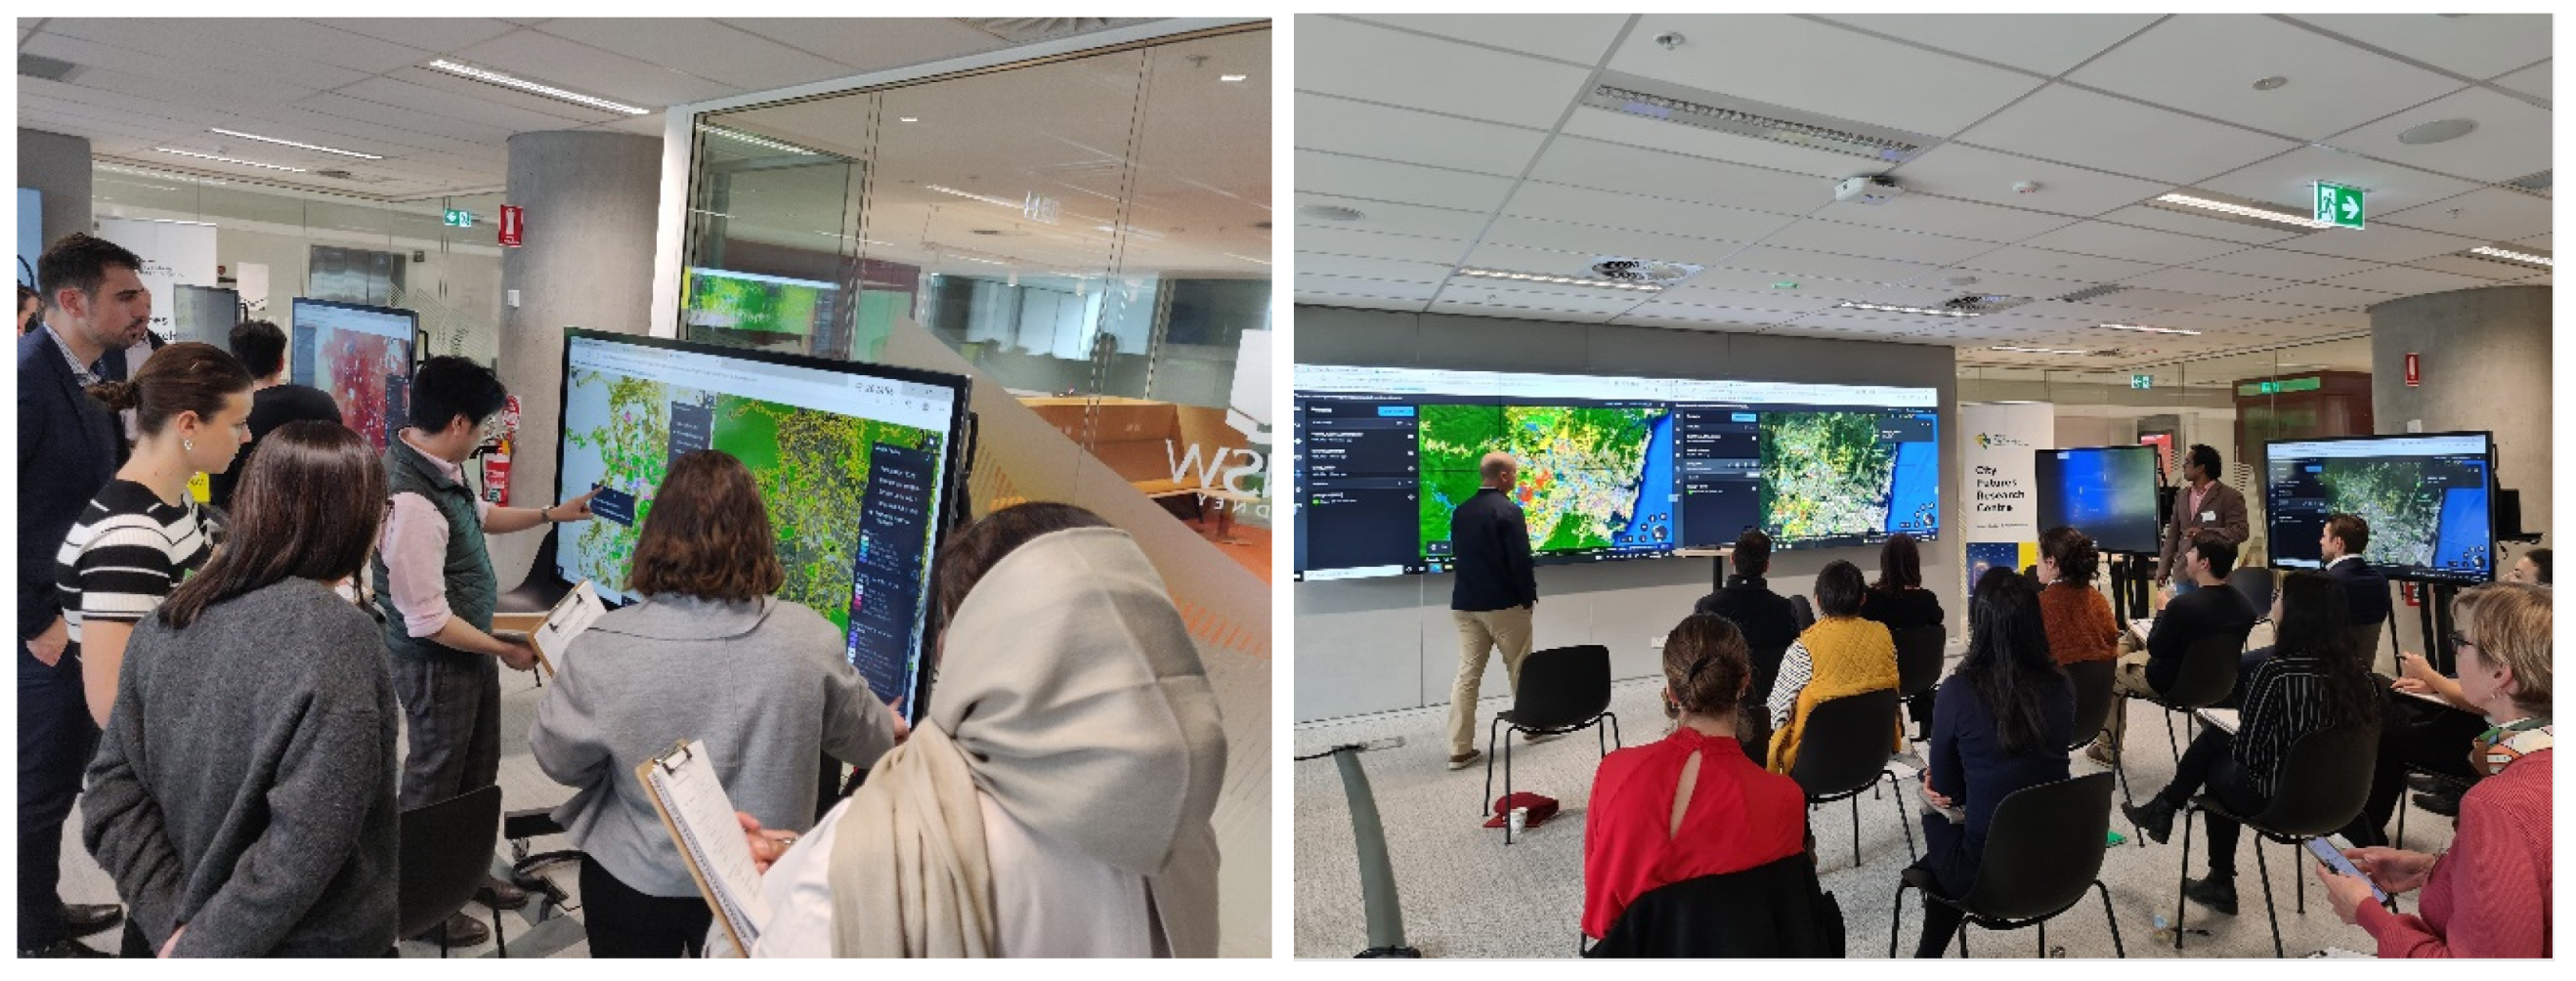
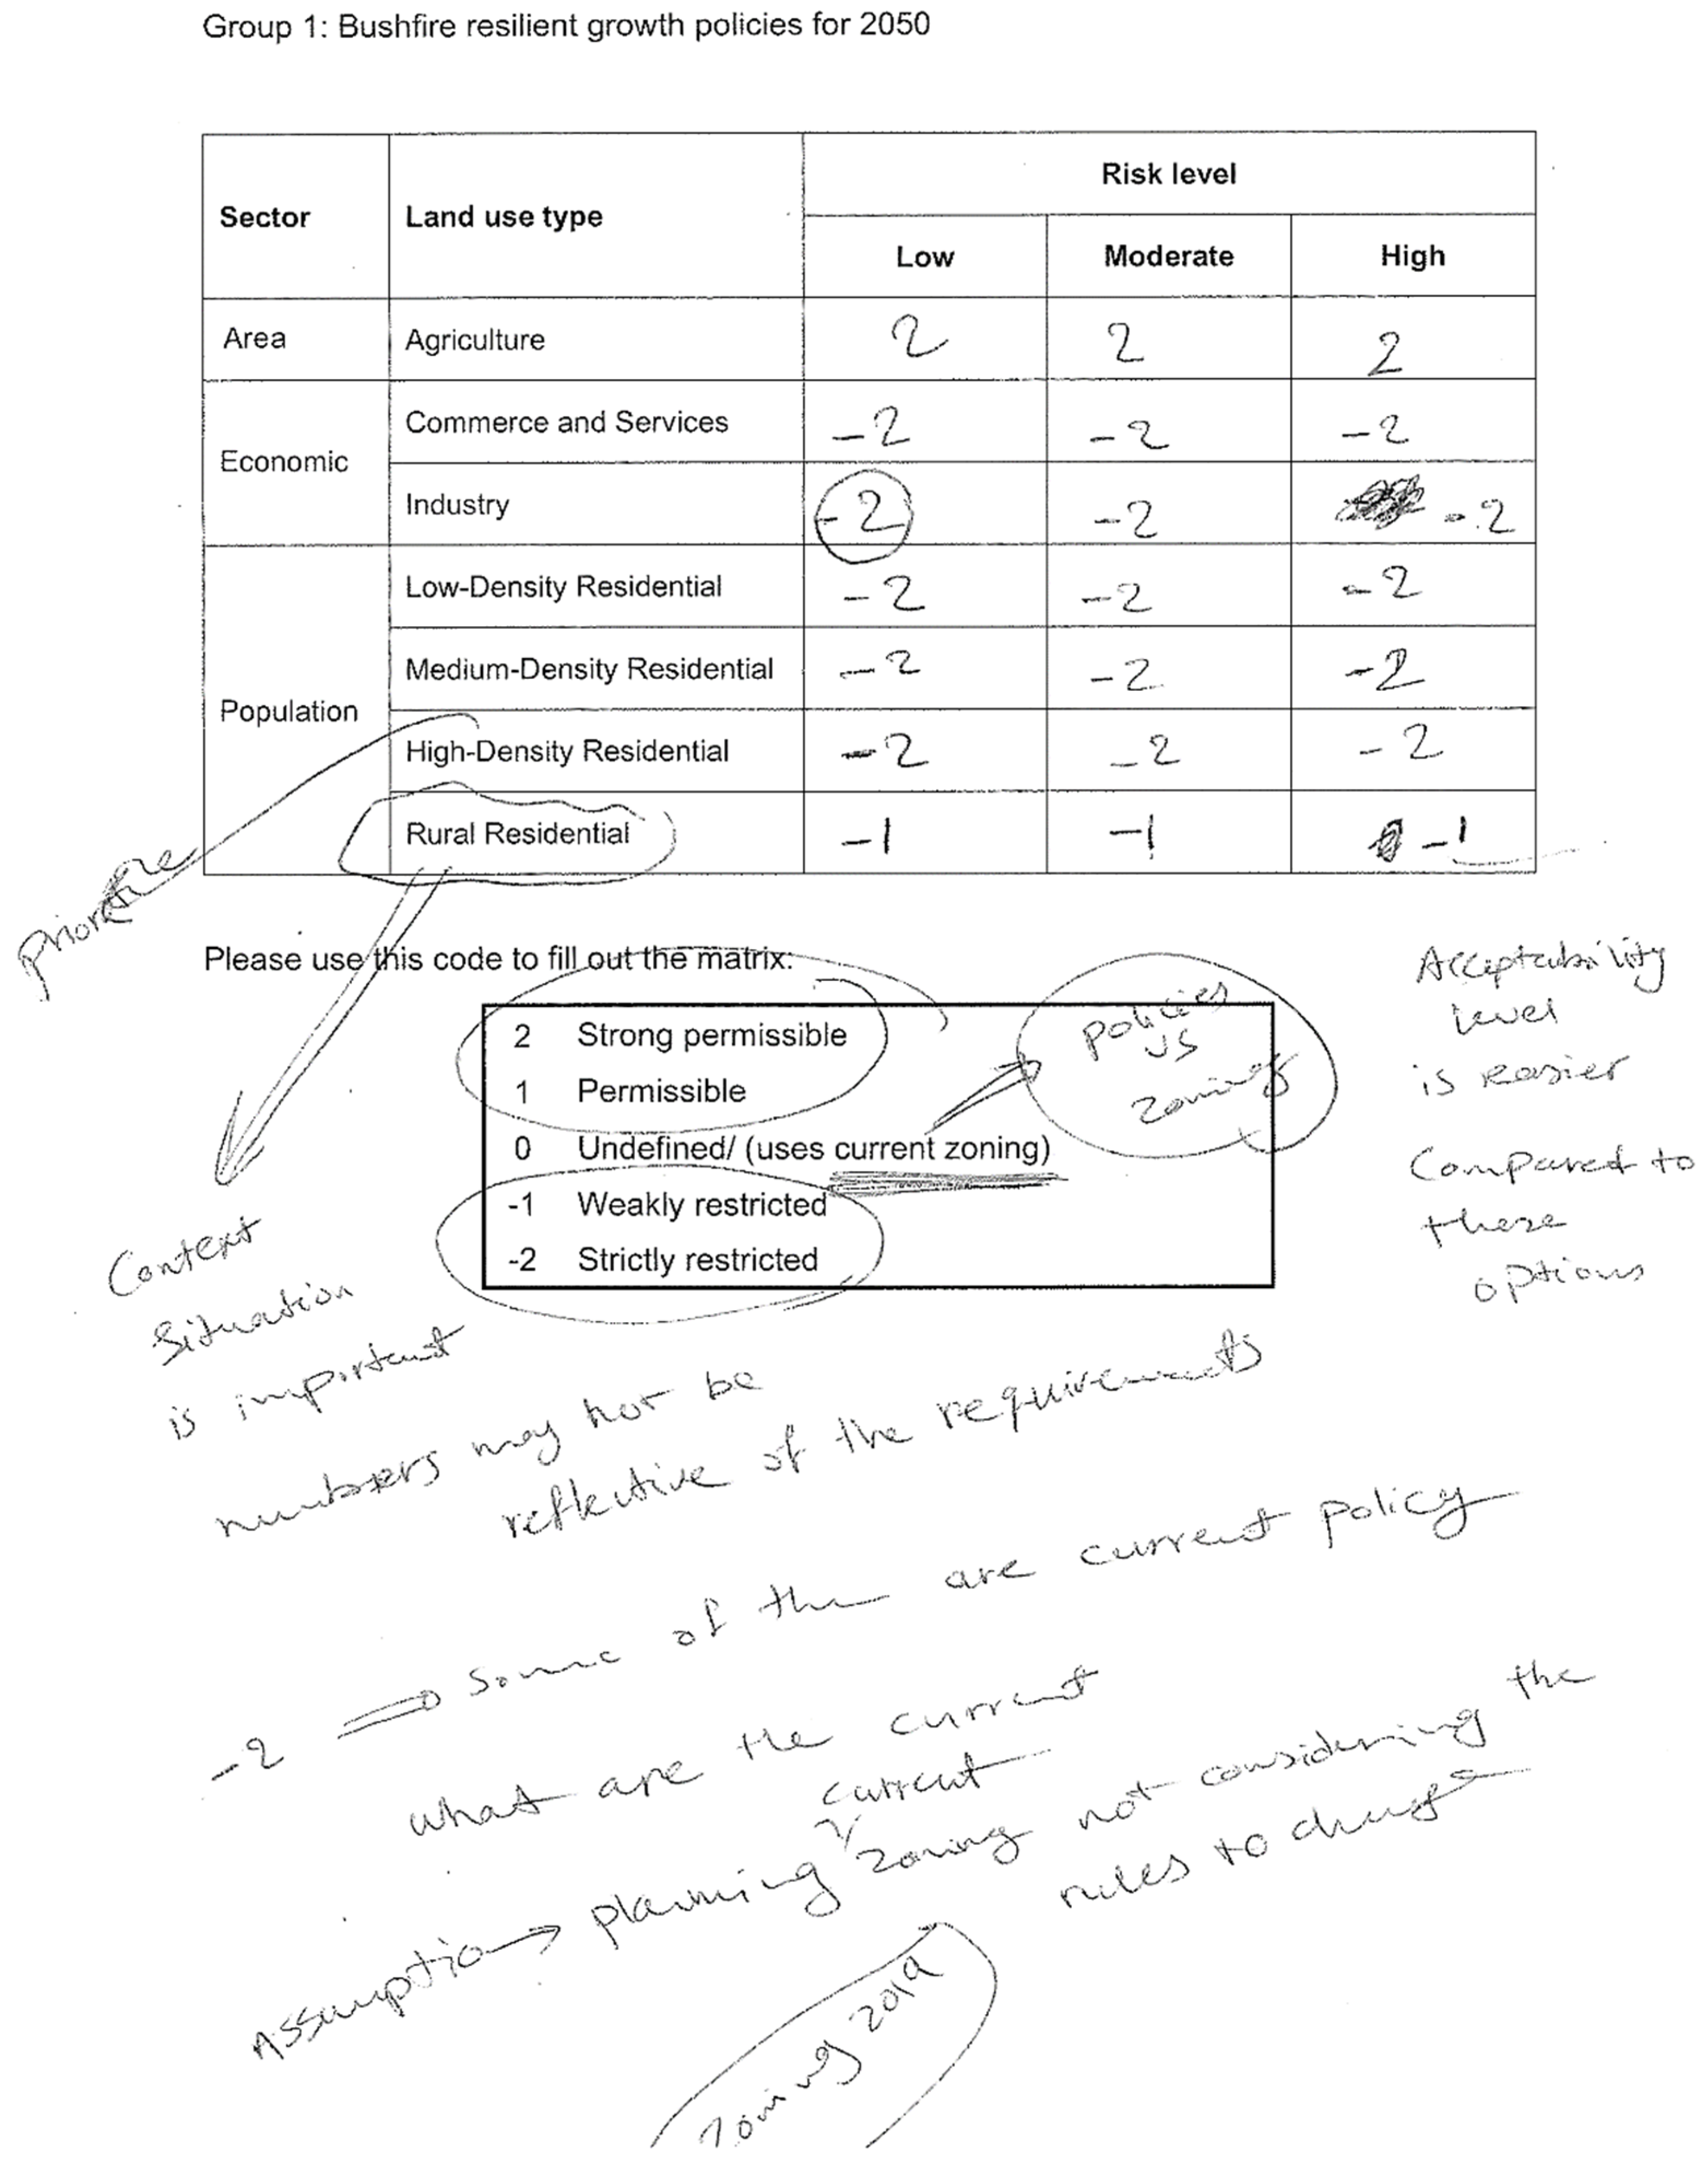
2.3. Experimental Design and Implementation

Relevant past studies [17,21] report that usefulness assessment experiments involving end users require a systematic method of introducing them to the technology and tools in a controlled environment. For our study, we chose a geodesign approach to implement in a technology-enabled planning support theatre [33] because geodesign is an iterative and collaborative design and planning method underscored by data, models, digital technology, and PSS tools [53]. Moreover, like city resilience planning, the geodesign process requires the involvement of a team of multidisciplinary experts to collaborate in the design and decision-making process [53,54]. Therefore, a geodesign approach is extremely beneficial in city resilience planning, provided that PSS tools and simulation models are integrated into the process [55,56].
We adapted the Steinitz (2012) geodesign framework here. It has six stages, namely representation, process, evaluation, change, impact, and decision models. All six stages iterate three times to decide on the study’s context, methods, and implementation aspects sequentially. The first and fourth stages of the framework rely on spatial data inputs, whereas the second and fifth stages take knowledge-based input. The third and sixth stages assess the merit of the existing and future circumstances, respectively. Thus, it offered us an ideal and flexible workflow and iterative stages to introduce data, integrate model, and evaluate the PSS and its output. Accordingly, the use of digital technology and spatial modelling to develop future scenarios and compare those against desired performance criteria are recognised as the framework’s added advantages [57].
For this study, we organised a geodesign workshop at the University of New South Wales (UNSW) Paramatta Planning Support Theatre on 25 August 2022. The theatre is a purpose-built facility that has six networked interactive multitouch tables with pen support for codesigning and collaborative planning. It is also equipped with three interactive panels, a media wall, and cameras and microphones for both in-person and online participation. The workshop ran for four hours in three different sessions with 19 participants. It was facilitated by five researchers from the UNSW City Futures Research Centre.
During the workshop sessions, participants were split into two resilience groups namely: bushfire and flood. Each group was further divided into two teams for convenience in using the multitouch tables. The four teams had access to identical data displayed and communicated in the sessions. As non-expert users, stakeholders had limited proficiency in examining the actual data underpinning the model within the PSS. Therefore, we used an independent open-source visualisation tool, Kepler.GL (https://kepler.gl/ accessed on 25 August 2022). The tool has been proven to facilitate collaborative and codesign workshops involving similar tasks [20,58].
In the first session, participants were progressively introduced to the data essential to the activities of the workshop. For example, the geodesign framework’s representation model related tasks involved in the exploration of the study area’s location and extent, as well as socioeconomic and infrastructure information. The process models examined the evolution of the urban area from 2007 to 2020. Participants evaluated the potential for 2050 growth against environmental risks in the evaluation stage (Figure 3). Table 1 shows the data used in each of these geodesign tasks.
The second session of the workshop began with a multimedia presentation on the Metronamica-based modelling process, including the configuration of land use, suitability, zoning, and accessibility parameters, followed by the model calibration and evaluation processes. After the presentation, growth scenarios were created and reviewed as part of the change model activities within the geodesign framework. The groups collaborated in the creation of alternative growth policies by filling out a bushfire and flood resilience policy prioritisation matrix (Figure 4). These matrices were essentially the participants’ policy measures as they established which land uses were allowed at each risk level.
Maps with low-, medium-, and high-risk zones had been prepared previously and were presented at the workshop. The bushfire risk map combined historical bushfire and bushfire-prone mapping (see Table 1). Similarly, the flood risk map integrated flood-affected areas with flood-prone lands. The matrix-based policy measures were then included in the modelling, with priority over existing policies such as LEP zoning, and the Bushfire resilience and Flood resilience scenarios were simulated (Figure 5). A mix of these two resilience policy matrices was used during the Combined resilience scenario simulation.
In the third session, participants examined all four scenarios for 2050 (Figure 3) using the free-to-use digital tool Google Earth (web version, https://earth.google.com/web/ accessed on 25 August 2022), which allows a user to sketch on screen and online, with a provision to synchronise spatial and annotation data automatically in a Google Drive to support collaborative planning [59]. Each group visually compared the three resilience scenarios with the BAU scenario and provided feedback on screen. Following this, an open discussion focused the resilience scenarios, their differences from BAU, and identification of preferred outcomes.

2.4. Primary Data Collection and Assessment of Usefulness

Assessing the usefulness of a PSS depends on its role in the planning process, including aspects of collaboration, communication, and informed decision making [17]. Evaluation of PSS in these roles may involve several common and contextual elements. The latter include the characteristics of the applied data, the PSS tool, its users, and their existing knowledge [15]. Pelzer [17] and Jiang, Geertman and Witte [15] have summarised a wide range of PSS useability types and indicators. This study therefore only evaluated the specific types of usefulness that an UGM offers. A data-driven CA model primarily contributes to informed policy and decision making by projecting future growth under diverse scenarios [32]. Modern CA tools such as Metronamica are increasingly being applied in collaborative settings [1], which adds to their usefulness.
A widely used PSS like Metronamica has already established its utility in the context of future growth simulation. Its adoption for many studies in Australia [42,60], New Zealand [41], Colombia [61], South Korea [40], England [62], Denmark [63], and Spain [38,64] makes apparent its fitness for such tasks. Given the established utility of Metronamica PSS, this study focused on the useability parameters of a PSS [17] to evaluate its usefulness.
Since the participants had a limited scope to test the full functionality of the Metronamica PSS in detail, several useability indicators of the PSS, such as user friendliness, computation speed, interactivity, and level of integration, were beyond the scope of this usefulness assessment. However, they were asked to provide their feedback on the developed model’s levels of detail, data quality, transparency, flexibility, and reliability and value for communication as part of the useability criteria [17]. For this, we applied two user survey instruments.
The survey-1 questionnaire addressed the data used in the model, their level of detail, the parameters in the model, and the modelling process. It was implemented after the modelling presentation. Survey-2, with questions about the modelling results, visualisation tools, and the collaborative process, was run after checking the scenarios. In both surveys (1 and 2), stakeholder opinions were recorded on a five-point Likert scale (not at all < slightly < moderately < very < extremely) with the option of open-ended feedback. The data from the survey instruments were analysed after the workshop using a mixed-method approach [65].
To capture stakeholders’ feedback and insights about the overall usefulness of the PSS, we collected the perceived strengths, weakness, opportunities, and threats (SWOT) of using a UGM for city resilience planning. During SWOT analysis, we used the Miro tool (https://miro.com/ accessed on 25 August 2022), since it provides great drawing and annotation functions for online collaboration [66]. The two groups collaborated on a single Miro whiteboard using two multitouch tables to post their SWOT notes.

3. Results

The following sections report our specific findings regarding the useability and usefulness of the Metronamica PSS and its outputs based on the surveys and SWOT analysis (Figure 6). The surveys and SWOT analysis were implemented sequentially upon introducing stakeholders to the whole modelling process, including the type and usage of data and simulations. Stakeholders visually assessed and contrasted the simulated scenarios during the workshop. Any post-workshop analysis of these scenarios has little bearing for this study’s findings because their feedback on the usefulness parameters came after visual inspections. However, some statistical information on the scenarios is presented here to support the survey outcomes.

3.1. Levels of Detail

The model’s spatial resolution (100 × 100 metres) was not prescriptive but was chosen because it is common among urban modellers [42,67,68]. Moreover, García-Álvarez, Pettit, Leao and Van Delden [42] found it effective in simulating Sydney’s urban residential land use. Survey results show that the majority of the participants (n = 14) considered the model’s spatial resolution appropriate for resilience planning. However, a small number of the participants (n = 3) recommended a finer resolution of 50 × 50 metres. A reason for this recommendation reported by participant 1 was, “… finer grain is required to identify residential properties”.
A reclassification of the study’s land use mapping, separating commerce and service into independent classes, was suggested by five participants. They also recommended adding special infrastructure land use classes to the prepared maps, especially incorporating tunnels, bridges, ports, international terminals, and utility networks. The model already included those special infrastructures, but they were parts of a single land use class that the model does not simulate (non-transferrable use).
Participants also suggested the use of additional suitability parameters to exclude critical lands from future development, such as lands adjacent to bushfire- and flood-prone areas and areas associated with storm water, open space, riparian corridors, coasts, erosion, and high-value ecological corridors and habitats. To expand on accessibility, more parameters were proposed, such as access to seaports, airports, and overseas (cruise) passenger terminals.

3.2. Data Quality

The availability and quality of input data determine the modelling process and its outputs, including the spatial resolution. In this case, the two essential land use datasets differed in spatial resolution, as they came from different sources and were released for different purposes. The initial land use map of 2007 [43] was available in vector format for urban planning purposes, whereas the 2020 map [44] was a 50 × 50 metre raster dataset designed to support agricultural land use. Therefore, the land use reclassification of the 2020 map, which was necessary for the CA model, omitted or underrepresented residential, commercial, and industrial land uses. In this regard, local stakeholders and community people could provide a contextual check of the input data (i.e., its quality in context). The participants deemed this essential for a robust model, but communication barriers remain.
With regard to the model’s zoning and related policy measures, participant 8 recommended updating those that included employment lands, which were being reviewed at that time in Sydney and other urban centres. The resilient growth scenarios were based on proposed government policy measures to limit bushfire and flood risks. These measures entered the model as pre-prepared risk maps, and their adequacy and quality were critical to the resilience scenario development process. Four participants suggested amending these data/maps to reflect the intensification of risks under climate change. Also suggested as components of flood risk mapping were the effects of sea level rise, storm surge, high tides, coastal flooding, tidal and beach overflow, and water ingress. While anticipated changes to bushfire and flood risks were considered particularly important to resilience planning, no spatially explicit assessments were available as open data layers.

3.3. Transparency

To describe the model development process and its performance results, an early presentation was made by the study team. This process was further assisted by the Kepler.GL tool for communication and interrogation of the input data and model outputs. However, the modelling process was ‘transparent’ to only seven participants. Participants, as indicated, required greater transparency and clearer explanations of the underlying assumptions and weights used to inform the model.

3.4. Flexibility

The simplicity of modifying preconfigured parameters/data layers within the Metronamica PSS was noted by the participants during SWOT analysis (Figure 6). This flexibility aspect was evident when the pre-existing policy measures were altered to incorporate the proposed resilience policies. Although the PSS makes adding or editing of data easy, adding new data can have consequences for the model’s calibration and, hence, the simulation results. Although it was not tested in our case, modellers [69] have reported Metronamica PSS as a highly flexible PSS allowing (end) users to change neighbourhood rules and parameter weights easily.

3.5. Reliability/Plausibility

Growth simulations using a complex system model are ‘plausible’, but it is not possible to establish whether they are ‘reliable’. The reliability of a model is measured in terms of correct or incorrect results [70], but future growth simulations cannot be judged as correct; they are plausible alternatives [71]. Despite the quality issues with 2020 land use data (above), three participants found the study’s simulated scenarios ‘very’ plausible, and another eleven found them ‘moderately’ plausible. Only two participants viewed the scenarios as ‘slightly’ plausible, and the remaining three were unable to specify plausibility, citing a lack of time in the workshop to assimilate the information needed for a considered response. None of the participants judged the scenarios as ‘not at all’ plausible.

3.6. Value for Communication

In support of the PSS and its scenarios’ communication value, participant 6 specified that they can “guide where more focused investigations and policy considerations are needed” to improve regional resilience. The collaborative modelling of scenarios allowed participants to test resilience growth policies that restricted urbanisation in risk-prone areas (Figure 7). As such, they were able to understand “how much restrictions based on flood/bushfire prone land limit particular land use types” (participant 10). It further helped participant 11, for example, “to think about the relationship between spatial and environmental factors” when proposing resilience growth policies.
According to participant 3, “the model was able to visually show scenarios and the effects they may have on the land use” based on alternative growth policies. For instance, the resilience scenarios significantly departed from the existing policy-abiding BAU scenario. Furthermore, the resilience scenarios exhibited notable variations when compared to each other due to the policy constraints aimed at mitigating alternative risks. Most significantly, in the Bushfire resilience scenario, 18,600 ha of low-density residential land was relocated from BAU locations, and 5400 ha were relocated in the Flood resilience scenario. The combined commerce and service and industrial land uses experienced a relocation of 4500 ha in the Bushfire resilience scenario, while in the Flood resilience scenario, the relocation amounted to 1500 ha compared to the BAU locations.
These spatially explicit changes through the “modelling of alternative future scenarios was useful [for participant 2] to informing costs and benefits of different land use planning decisions”. In summary, as perceived by participant 7, the scenarios were able to provide “a visual evidence-base, with an emphasis on the necessity for and use of open data, as well as [for creating] … better policy through collaboration”.

4. Discussion

The reported usefulness of the analysed PSS is based on the perceptions of 19 participants, which is adequate for this exploration of the topic in such a user test setting [18]. However, given the limited number of participants, one needs to be cautious of the generalisation of the results to other studies. Among the participants, seven had more than five years of planning-related experience, while the remainder had up to three years. Thirteen participants had acquired some knowledge of UGMs from their colleagues, but only two had done any pertinent training. Except for two, they had a thorough understanding of such a tool’s applicability in urban and regional planning. Some participants (n = 10) had experience, through their agencies, with other forecasting tools like Sydney Housing Supply Forecast [72]. However, none of the participants had previously used Metronamica PSS. Clearly, they comprised a stakeholder group with relevant domain knowledge and a significant stake in the planning of the study area. Consequently, they offered thoughtful and practical feedback on the modelling and PSS for contextual application.

4.1. Overall Usefulness of the PSS

The potential of Metronamica PSS was obvious to the participants, as they reported during the SWOT analysis (Figure 6). The PSS provides opportunities for key agencies to access open data and apply it to resilience planning with clear communications, cross-government policy development, and decision testing. These opportunities were apparent because participants were able to seamlessly add alternative policies (data) to create different scenarios and could display them immediately using a simple visualisation tool. However, participant 13 said, “the [PSS] tool is only as good as the data inputs”. The credibility of model outputs was limited by deficiencies in the quality and granularity of the open data.
Metronamica PSS proved useful to participants for exploring both macro= (region) and micro (LGA)-level growth scenarios to inform decision making. Its in-built regional migration model was particularly helpful in this regard, and a CA model alone might not provide that utility. Relating to this, multiscale models have a history of having strong forecast accuracy [9]. However, it was felt that the modelling and simulation of growth scenarios require large volumes of data and, therefore, diverse data management skills and modelling experience. Judgment of appropriate spatial and classificatory resolutions is important in developing and informing models within PSS like Metronamica.
Still, the flexible Metronamica PSS allowed for interaction and control, enabling multidisciplinary teams to collaborate during the workshop. This is extremely pertinent to city resilience planning, as stakeholder involvement is a key to that process [73]. The model’s capacity to demonstrate linkage between future growth scenarios and input assumptions at a level that aligns with audience maturity was also highly regarded. In the context of collaborative resilience planning, the application of Metronamica PSS was rated favourably by 15 of the 19 participants (including 11 ‘very’ or ‘extremely’ effective responses).
The modelling process demonstrated to the participants the use of open data in constructing a large-scale UGM and the application of such data to empirically inform the planning and policy-making processes. This is particularly relevant when open data initiatives are gaining momentum in support of smart city planning, development, and governance activities related to sustainable and resilience-based outcomes [74].

4.2. Prospects and Challenges with the Modelling and PSS

Although the PSS and modelling process were judged useful in many ways, there were some shortcomings. Those shortcomings are commonly related to the development of the current version of the model within Metronamica PSS, which has prospects for future improvement. Those are broadly related to the model configuration, input data, transparency, and communication challenges.
To start with, we reflect upon the needing of a model’s high spatial resolution for resilience planning and policy making. There may be a fine line between the chosen spatial resolution and the model’s intended purpose. If the modelling purpose is to support precinct planning, it may require finer spatial representation than the study’s 100-metre grid resolution, which is more suited for regional planning applications [67]. Here, it is important to mention that a finer resolution may result in significant runtime costs when simulating a large geographic extent, such as our study area. Therefore, the benefits of higher resolution must be balanced against the increased computational burden [75] worth taking on for actual application.
The availability and quality of open data also added challenges to the modelling process. In this regard, participant 4 reflected on the “difficulty of getting data at the scale [smallest] that makes it most useful”. Inconsistent spatial and temporal resolutions in raw data may cause conversion errors. Yeh, Li and Xia [32] considered such errors in input data as a major challenge in applying CA models to planning. Perhaps more recent and precise versions of datasets such as land use maps exist but were not publicly accessible. This calls for making consistent and high-quality data widely available, including zoning, land use, and climate change projections [76,77].
The complexity of UGMs is a long-known issue inhibiting wider understanding and adoption [19]. Thus, stakeholder engagement in the UGM process has tended to be limited. To overcome this, we recommend three alternative options. Firstly, to alleviate the transparency issue, engaging stakeholders throughout the development of a model in a participatory modelling process [1,78] may be effective, which was not the case in our study. In contrast, when participants cannot be directly involved, a more detailed communication of the model focused on explaining the parameters used and their corresponding weights may also increase perceived transparency.
However, in our case, the limited time that busy people could commit to the workshop meant that the CA modelling process could not be explained in detail. Consequently, low transparency was a reported weakness of the modelling PSS, and, to some extent, this impeded our analysis of usefulness. Distribution to participants of a preworkshop information pack might have raised their judgement of model transparency.
Although the aim of this study was not to recreate a real-world planning process, the participants felt that their experiences would have been richer if the workshop took place in an environment where the results meet immediate needs. Such an environment would ideally include both skilled practitioners and executive decision makers, as well as community people with a deep understanding of the context and knowledge of existing projects, plans, and policies in the region. Therefore, participants advocated for more engagement of the local community in future modelling and associated research. While wide community participation has many challenges, including the enabling digital environments [79], another option mentioned at the workshop is the use of online or hybrid workshops in the planning support theatre. The theatre is fully equipped to support this approach. However, explaining the processes and outputs online may be even more challenging than in person.
While the PSS showed its capacity to support integration and collaboration across government agencies, breaking down their siloed approach, full and open communications still depend on widespread acceptance of a robust model and is necessary for access to the best possible data. A geodesign approach, ideally on a less compressed schedule, can help in achieving that end [23]. However, as mentioned as threats in the SWOT analysis, there remain risks of tailoring the data to support a prejudged policy and misinterpretation of modelling results in subsequent planning and decision making. Furthermore, the participants were concerned that because Metronamica PSS is a commercial tool, it might be—or become—unaffordable for some potential users/agencies.

4.3. Reflection on the Collaboration Process and Tools

Because CA model configuration and calibration are time-consuming tasks [80], stakeholders often have limited direct involvement. However, when collaborative planning is essential, such as in city resilience planning, a geodesign approach (Steinitz, 2012) can draw on a previously developed CA and encourage stakeholder engagement. Our study’s systematic collaboration process helped participant 9 to better understand the sources of data and the parameters that shaped the growth simulations. These activities were critical to build trust among the participants about the model, its processes, and its outputs, given that a lack of trust leads to low scenario credibility [78] and, hence, limits the usefulness of a PSS.
As a result, adoption of the geodesign approach for the creation of resilient growth scenarios was seen as ‘very’ to ‘extremely’ important by 14 participants. It was ‘moderately’ (n = 3) and ‘slightly’ (n = 1) important to four participants, while one participant did not answer this question. Importantly, no one was against the collaborative approach, underlining its critical role in resilient urban and regional planning. To further improve the process, explicit display of the data sources and the use of more detailed data for specific communities were recommended. Overall, the collaborative resilience scenario-planning approach leveraging a computational modelling and geodesign framework was clearly viewed as a useful combination of methods.
An interfacing of stakeholders with the PSS tools through a data-augmented collaborative approach is therefore useful in resilience planning and decision making. The modelling of urban growth integrated within a collaborative geodesign approach involving non-expert end users offers significant synergistic potential to address the complexity of decision making in cities and regions. This is because the model provides stakeholders with a deeper understanding of variable risks and decision consequences simulated through alternative scenarios, thereby facilitating more informed decision making [81]. In this process, stakeholder involvement brings local knowledge and context-specific inputs, e.g., risk mitigation and adaptation policies, enriching the model and ensuring its fit for real-world decision needs. However, a key challenge is the appropriate use of PSS in urban governance processes. The smart urban governance approach [82] offers one such approach to better integrate technology such as PSS into governance frameworks to tackle complex and wicked urban problems.
During the workshop, two different digital tools were used to share data and scenarios with participants, as well as to collect feedback from them. These tools carry extreme importance in connecting end users with a complex system model. They were chosen based on past applications in similar settings [20,59]. Kepler.GL was a new tool to all participants (n = 19), while seven had previously used Google Earth Web before attending the workshop. In the workshop, they were given a demonstration of these tools before using them, and prior training was considered unnecessary. Most people (n = 14) were able to interact with the tools often or always, indicating a reasonable level of useability of these simple tools.
However, Kepler.GL was noted for its inability to always keep the legend menu on the screen. This reduced the legibility of the maps. Furthermore, if the tool’s data filtering technique had been explained to the participants prior to use, a more seamless comparison of datasets would have been possible. The Google Earth Web tool, which has potential as a decision support tool [59], was rated relatively poorly, as participants encountered some issues. For example, participant 12 reported that when zooming in on a map, the background satellite image became blurry, reducing the effectiveness of the tool. This may have occurred because the browser memory cache reached its maximum while displaying the many loaded data/scenario layers.
A noteworthy limitation of this study is the omission of capturing feedback on the software tools. Specifically, we did not ask for separate perceptions of the multitouch table experience, given that six had used multitouch tables before this workshop. However, participants reported some frustrations because the multitouch tables were highly sensitive when zooming to a place of interest. This did not limit their interactions with the tables, and the sensitivity level can be adjusted. Upon seeing the great potential of these simple tools for mapping and visualisation on multitouch tables, participants endorsed their adoption for future collaborative planning exercises.

5. Conclusions

PSS have, to date, mostly been evaluated from the perspective of expert users. End-user perceptions of usefulness have not been well-documented, especially in cases of urban growth modelling. We sought to fill this gap through a resilience planning case study involving multi-stakeholders and a data-driven CA model. The study adopted a collaborative geodesign workshop approach. The interdisciplinary setting facilitated by the geodesign approach offered participants an opportunity to work with others with diverse skills and knowledge. The workshop process was designed to modulate people’s policy assumptions using qualitative assessments, and the PSS was able to consistently test/simulate scenarios based on the different policy settings.
Participants were helped to understand and evaluate modelling inputs (data) and methods, as well as to create and validate future growth scenarios. They all had a vested interest in envisioning the region’s future growth and policy options and freely joined in the process. The PSS provided high granularity and great visual interpretation, which were commonly appreciated by participants. There was, however, no expectation that the workshop would lead directly to implementable policy.
The usefulness of a PSS is a combination of its utility and its useability. We used a mature PSS—Metronamica—whose utility has been substantiated in many contexts internationally. Consequently, we concentrated on its perceived useability by potential end-users. However, utility and useability are inexorably linked. It was not possible for our participants to think only in terms of useability because, for at least some of them, the technology was new, the application was innovative, and the geodesign approach took them, perhaps, outside their comfort zone. So, they also reflected on the system’s utility.
Participants gained considerable insights into the tool, the modelling process, and the scenario outputs. They developed a solid understanding of and reflected upon the usage of open data for UGM, the geodesign approach, and collaborative scenario-planning processes. They found the PSS to be highly flexible, supportive of stakeholder collaboration, and informative for city resilience planning. The adoption of simple visualisation tools in this context helped to reduce the need for expert knowledge in checking and comparing modelling outputs, adding to both useability and utility.
The process used here, based within a geodesign framework, could be readily expanded such that PSS utility, useability, and usefulness are assessed by a considerable number of (expert) practitioners and end users, including community people. Unfortunately, it was not possible to engage the community as end users in the usefulness study due to its limited capacity. Future application of similar studies centred upon the use of a UGM would benefit from the inputs of community representatives, referred to as ‘people of the place’ by Steinitz (2012). The planning support theatre can play a critical role in this context to overcome participation barriers [79], which should be studied further.
As urban systems are complex, so are their modelling processes. Numerous data inputs are required, and their interactions within the model can be complex. These tasks still demand a certain level of expertise for configuration and application of a modelling PSS. Complexity and useability challenges will remain unless rapid analytic PSS for similar purposes are developed and proven sufficient for non-expert end users to simply insert data and immediately receive simulated scenarios. Our research represents one step in this direction by showing that outputs of a complex system model can be represented with simple visualisation tools that non-expert users can understand. Ultimately, this can contribute to making urban growth models more accessible and, hence, useful for collaborative planning and decision making, making cities more resilient. Future research should explore further integration of digital tools, including PSS, in the management and governance processes to address complex challenges in making our cities and regions more resilient.

Author Contributions

Conceptualization, Ripan Debnath and Christopher Pettit; Formal analysis, Ripan Debnath; Investigation, Ripan Debnath, Christopher Pettit, Balamurugan Soundararaj, Sara Shirowzhan, and Ajith Shamila Jayasekare; Methodology, Ripan Debnath and Christopher Pettit; Software, Ripan Debnath; Writing—original draft, Ripan Debnath; Writing—review and editing, Ripan Debnath, Christopher Pettit, Balamurugan Soundararaj, Sara Shirowzhan, and Ajith Shamila Jayasekare. All authors have read and agreed to the published version of the manuscript.

Funding

This research received no external funding.

Data Availability Statement

Publicly available datasets were used in this study for the modelling purpose. This data can be found here: https://datasets.seed.nsw.gov.au/dataset.

Acknowledgments

We are grateful to the geodesign workshop participants for their critical inputs on the modelling PSS and its outputs, which are presented here. We would also like to thank Rohan Wickramasuriya Denagamage and Hedwig van Delden for their contributions to land use model development. This work was developed as part of a PhD research project, which was supported by the UNSW’s University International Postgraduate Award (UIPA).

Conflicts of Interest

The authors declare no conflict of interest.

References

  1. Hewitt, R.; van Delden, H.; Escobar, F. Participatory land use modelling, pathways to an integrated approach. Environ. Model. Softw. 2014, 52, 149–165. [Google Scholar] [CrossRef]
  2. Rifat SA, A.; Liu, W. Predicting future urban growth scenarios and potential urban flood exposure using Artificial Neural Network-Markov Chain model in Miami Metropolitan Area. Land Use Policy 2022, 114, 105994. [Google Scholar] [CrossRef]
  3. Klosterman, R.E.; Pettit, C.J. An Update on Planning Support Systems. Environ. Plan. B Plan. Des. 2005, 32, 477–484. [Google Scholar] [CrossRef]
  4. Li, X.; Gong, P. Urban growth models: Progress and perspective. Sci. Bull. 2016, 61, 1637–1650. [Google Scholar] [CrossRef]
  5. Agyemang, F.S.K.; Silva, E. Simulating the urban growth of a predominantly informal Ghanaian city-region with a cellular automata model: Implications for urban planning and policy. Appl. Geogr. 2019, 105, 15–24. [Google Scholar] [CrossRef]
  6. Lin, J.; Huang, B.; Chen, M.; Huang, Z. Modeling urban vertical growth using cellular automata—Guangzhou as a case study. Appl. Geogr. 2014, 53, 172–186. [Google Scholar] [CrossRef]
  7. Kamusoko, C.; Aniya, M.; Adi, B.; Manjoro, M. Rural sustainability under threat in Zimbabwe—Simulation of future land use/cover changes in the Bindura district based on the Markov-cellular automata model. Appl. Geogr. 2009, 29, 435–447. [Google Scholar] [CrossRef]
  8. Martellozzo, F.; Amato, F.; Murgante, B.; Clarke, K.C. Modelling the impact of urban growth on agriculture and natural land in Italy to 2030. Appl. Geogr. 2018, 91, 156–167. [Google Scholar] [CrossRef] [Green Version]
  9. Xia, C.; Zhang, A.; Wang, H.; Liu, J. Delineating early warning zones in rapidly growing metropolitan areas by integrating a multiscale urban growth model with biogeography-based optimization. Land Use Policy 2020, 90, 104332. [Google Scholar] [CrossRef]
  10. Dinda, S.; Das Chatterjee, N.; Ghosh, S. An integrated simulation approach to the assessment of urban growth pattern and loss in urban green space in Kolkata, India: A GIS-based analysis. Ecol. Indic. 2021, 121, 107178. [Google Scholar] [CrossRef]
  11. Zhou, Y.; Huang, B.; Wang, J.; Chen, B.; Kong, H.; Norford, L. Climate-Conscious Urban Growth Mitigates Urban Warming: Evidence from Shenzhen, China. Environ. Sci. Technol. 2019, 53, 11960–11968. [Google Scholar] [CrossRef] [PubMed]
  12. Deilami, K.; Kamruzzaman, M. Modelling the urban heat island effect of smart growth policy scenarios in Brisbane. Land Use Policy 2017, 64, 38–55. [Google Scholar] [CrossRef]
  13. Geertman, S.; Stillwell, J. Planning support science: Developments and challenges. Environ. Plann. 2020, 47, 1326–1342. [Google Scholar] [CrossRef]
  14. Pettit, C.; Bakelmun, A.; Lieske, S.N.; Glackin, S.; Hargroves, K.; Thomson, G.; Shearer, H.; Dia, H.; Newman, P. Planning support systems for smart cities. City Cult. Soc. 2018, 12, 13–24. [Google Scholar] [CrossRef]
  15. Jiang, H.; Geertman, S.; Witte, P. Ignorance is bliss? An empirical analysis of the determinants of PSS usefulness in practice. Comput. Environ. Urban Syst. 2020, 83, 101505. [Google Scholar] [CrossRef]
  16. Te Brömmelstroet, M.; Curtis, C.; Larsson, A.; Milakis, D. Strengths and weaknesses of accessibility instruments in planning practice: Technological rules based on experiential workshops. Eur. Plan. Stud. 2016, 24, 1175–1196. [Google Scholar] [CrossRef] [Green Version]
  17. Pelzer, P. Usefulness of planning support systems: A conceptual framework and an empirical illustration. Transp. Res. Part A Policy Pract. 2017, 104, 84–95. [Google Scholar] [CrossRef]
  18. Russo, P.; Lanzilotti, R.; Costabile, M.F.; Pettit, C.J. Towards satisfying practitioners in using Planning Support Systems. Comput. Environ. Urban Syst. 2018, 67, 9–20. [Google Scholar] [CrossRef]
  19. Vonk, G.; Geertman, S.; Schot, P. Bottlenecks Blocking Widespread Usage of Planning Support Systems. Environ. Plan. A Econ. Space 2005, 37, 909–924. [Google Scholar] [CrossRef] [Green Version]
  20. Debnath, R.; Pettit, C.; Leao, S.Z.; Lock, O. The Role of Technology Tools to Support Geodesign in Resilience Planning. In Urban Informatics and Future Cities; Geertman, S.C.M., Pettit, C., Goodspeed, R., Staffans, A., Eds.; Springer International Publishing: Cham, Switzerland, 2021. [Google Scholar]
  21. Rzeszewski, M.; Kotus, J. Usability and usefulness of internet mapping platforms in participatory spatial planning. Appl. Geogr. 2019, 103, 56–69. [Google Scholar] [CrossRef]
  22. Slotterback, C.S.; Runck, B.; Pitt, D.G.; Kne, L.; Jordan, N.R.; Mulla, D.J.; Zerger, C.; Reichenbach, M. Collaborative Geodesign to advance multifunctional landscapes. Landsc. Urban Plann. 2016, 156, 71–80. [Google Scholar] [CrossRef] [Green Version]
  23. Pettit, C.J.; Hawken, S.; Ticzon, C.; Leao, S.Z.; Afrooz, A.E.; Lieske, S.N.; Canfield, T.; Ballal, H.; Steinitz, C. Breaking down the silos through geodesign—Envisioning Sydney’s urban future. Environ. Plann. 2019, 46, 1387–1404. [Google Scholar] [CrossRef]
  24. Pettit, C.J. Use of a collaborative GIS-based planning-support system to assist in formulating a sustainable-development scenario for Hervey Bay, Australia. Environ. Plan. B Plan. Des. 2005, 32, 523–545. [Google Scholar] [CrossRef]
  25. Afrooz, A.; Ballal, H.; Pettit, C. Implementing augmented reality sandbox in geodesign: A future for geodesign. ISPRS Ann. Photogramm. Remote Sens. Spat. Inf. Sci. 2018, IV-4, 5–12. [Google Scholar] [CrossRef] [Green Version]
  26. Kuby, M.; Bailey, K.; Wei, F.; Fowler, J.; Tong, D.; Zhong, Q.; Lopez, O.; Sheaffer, W. Collaborative geodesign for alternative-fuel station location using “collablocation” software. In Transportation Research Record; SAGE Publications Ltd.: New York, NY, USA, 2018; Volume 2672, pp. 98–108. [Google Scholar]
  27. Triantakonstantis, D.; Mountrakis, G. Urban Growth Prediction: A Review of Computational Models and Human Perceptions. J. Geogr. Inf. Syst. 2012, 4, 555–587. [Google Scholar] [CrossRef] [Green Version]
  28. Castella, J.-C.; Trung, T.N.; Boissau, S. Participatory Simulation of Land-Use Changes in the Northern Mountains of Vietnam: The Combined Use of an Agent-Based Model, a Role-Playing Game, and a Geographic Information System. Ecol. Soc. 2005, 10, 32. [Google Scholar] [CrossRef] [Green Version]
  29. Walz, A.; Lardelli, C.; Behrendt, H.; Grêt-Regamey, A.; Lundström, C.; Kytzia, S.; Bebi, P. Participatory scenario analysis for integrated regional modelling. Landsc. Urban Plan. 2007, 81, 114–131. [Google Scholar] [CrossRef]
  30. Johnston, R.A.; McCoy, M.; Kirn, M.; Fell, M. Streamlining the national environmental policy act process through cooperative local-state-federal transportation and land use planning. Transp. Res. Rec. 2004, 1880, 135–143. [Google Scholar] [CrossRef]
  31. Falah, N.; Karimi, A.; Harandi, A.T. Urban growth modeling using cellular automata model and AHP (case study: Qazvin city). Model. Earth Syst. Environ. 2020, 6, 235–248. [Google Scholar] [CrossRef] [Green Version]
  32. Yeh, A.G.O.; Li, X.; Xia, C. Cellular Automata Modeling for Urban Regional Planning. In Urban Informatics; Shi, W., Goodchild, M.F., Batty, M., Kwan, M.-P., Zhang, A., Eds.; Springer: Singapore, 2021; pp. 865–883. [Google Scholar]
  33. Punt, E.P.; Geertman SC, M.; Afrooz, A.E.; Witte, P.A.; Pettit, C.J. Life is a scene and we are the actors: Assessing the usefulness of planning support theatres for smart city planning. Comput. Environ. Urban Syst. 2020, 82, 12. [Google Scholar] [CrossRef]
  34. City of Sydney. Resilient Sydney: A Strategy for City Resilience; City of Sydney: Sydney, Australia, 2018.
  35. NSW EPA. EPA Climate Change Policy; EPA 2023P4264; NSW Environment Protection Authority (EPA): Parramatta, Australia, 2023. Available online: https://www.epa.nsw.gov.au/-/media/epa/corporate-site/resources/climate-change/23p4264-climate-change-policy.pdf (accessed on 29 April 2023).
  36. Liolis, O.; Sirakoulis, G.C.; Adamatzky, A. Conway’s Game of Life in Quantum-dot Cellular Automata. Microelectron. J. 2021, 109, 104972. [Google Scholar] [CrossRef]
  37. Silva, E.A.; Clarke, K.C. Calibration of the SLEUTH urban growth model for Lisbon and Porto, Portugal. Comput. Environ. Urban Syst. 2002, 26, 525–552. [Google Scholar] [CrossRef]
  38. Van Delden, H.; Escudero, J.C.; Uljee, I.; Engelen, G. METRONAMICA: A Dynamic Spatial Land Use Model Applied to Vitoria-Gasteiz; Paper presented at the Virtual Seminar of the MILES Project; Institute of Town Planners Sri Lanka: Vitoria-Gasteiz, Spain, 2005. [Google Scholar]
  39. Van Delden, H.; Hurkens, J. A generic Integrated Spatial Decision Support System for urban and regional planning. In Proceedings of the MODSIM 2011, Perth, Australia, 12–16 December 2011. [Google Scholar]
  40. Kim, D.; Batty, M. Calibrating Cellular Automata Models for Simulating Urban Growth: Comparative Analysis of SLEUTH and Metronamica. In UCL Working Papers Series; Paper 176; UCL Centre for Advanced Spatial Analysis: London, UK, 2011; pp. 1–38. [Google Scholar]
  41. Van Delden, H.; McDonald, G.; Shi Y-e Hurkens, J.; van Vliet, J.; van den Belt, M. Integrating socio-economic and land-use models to support urban and regional planning. In Proceedings of the AGILE 2011, Utrecht, The Netherlands, 18–22 April 2011. [Google Scholar]
  42. García-Álvarez, D.; Pettit, C.J.; Leao, S.Z.; Van Delden, H. Setting up a Land Use Cover Change model application for Greater Sydney Lessons learnt challenges ahead. In Mapping and Forecasting Land Use; Pereira, P., Gomes, E., Rocha, J., Eds.; Elsevier: Amsterdam, The Netherlands, 2022; Chapter 10; pp. 223–242. [Google Scholar]
  43. DPE. NSW Landuse 2007, 3rd ed.; Department of Planning and Environment (DPE): Sydney, Australia, 2010. Available online: https://datasets.seed.nsw.gov.au/dataset/nsw-landuseac11c (accessed on 13 February 2019).
  44. ABARES. Catchment Scale Land Use of Australia—Update December 2020; Australian Bureau of Agricultural and Resource Economics and Sciences: Canberra, Australia, 2021. Available online: https://www.agriculture.gov.au/abares/aclump/catchment-scale-land-use-of-australia-update-december-2020 (accessed on 15 April 2021).
  45. RIKS. Metronamica Documentation. Maastricht: Research Institute for Knowledge Systems (RIKS). 2013. Available online: www.riks.nl/resources/documentation/Metronamica%20documentation.pdf (accessed on 11 April 2020).
  46. EROS. USGSEROSArchive—Digital Elevation—Shuttle Radar Topography Mission (SRTM) 1 Arc-Second Global; Publication no 105066/F7PR7TFT; U.S. Geological Survey’s Earth Resources Observation and Science (EROS) Center: Sioux Falls, SD, USA, 2018. Available online: https://www.usgs.gov/centers/eros/science/usgs-eros-archive-digital-elevation-shuttle-radar-topography-mission-srtm-1-arc?qt-science_center_objects=0#qt-science_center_objects (accessed on 19 July 2021).
  47. Liang, X.; Liu, X.; Li, D.; Zhao, H.; Chen, G. Urban growth simulation by incorporating planning policies into a CA-based future land-use simulation model. Int. J. Geogr. Inf. Sci. 2018, 32, 2294–2316. [Google Scholar] [CrossRef]
  48. Hagen-Zanker, A.; Lajoie, G. Neutral models of landscape change as benchmarks in the assessment of model performance. Landsc. Urban Plan. 2008, 86, 284–296. [Google Scholar] [CrossRef] [Green Version]
  49. Monserud, R.A.; Leemans, R. Comparing global vegetation maps with the Kappa statistic. Ecol. Model. 1992, 62, 275–293. [Google Scholar] [CrossRef]
  50. Hagen-Zanker, A. An improved Fuzzy Kappa statistic that accounts for spatial autocorrelation. Int. J. Geogr. Inf. Sci. 2009, 23, 61–73. [Google Scholar] [CrossRef] [Green Version]
  51. DPE. Western Sydney Aerotropolis Precinct Plan; NSW, Department of Planning and Environment: Parramatta, Australia, 2022. Available online: https://www.planning.nsw.gov.au/-/media/Files/DPE/Plans-and-policies/Plans-for-your-area/Western-Sydney-Aerotropolis-Precinct-Plan-March-2022-final.pdf?la=en (accessed on 17 September 2022).
  52. TfNSW. Greater Sydney Services and Infrastructure Plan; Transport for NSW: Chippendale, Australia, 2018. Available online: https://future.transport.nsw.gov.au/sites/default/files/2022-06/greater_sydney_services_and_infrastructure_plan.pdf (accessed on 19 September 2020).
  53. Steinitz, C. A Framework for Geodesign: Changing Geography by Design, 1st ed.; ESRI Press: Redlands, CA, USA, 2012. [Google Scholar]
  54. Steiner, F.R.; Shearer, A.W. Geodesign-Changing the world, changing design. Landsc. Urban Plan. 2016, 156, 1–4. [Google Scholar] [CrossRef]
  55. Eikelboom, T.; Janssen, R.; Stewart, T.J. A spatial optimization algorithm for geodesign. Landsc. Urban Plann. 2015, 144, 10–21. [Google Scholar] [CrossRef]
  56. Gu, Y.; Deal, B.; Larsen, L. Geodesign processes and ecological systems thinking in a coupled human-environment context: An integrated framework for landscape architecture. Sustainability 2018, 10, 3306. [Google Scholar] [CrossRef] [Green Version]
  57. Foster, K. Geodesign parsed: Placing it within the rubric of recognized design theories. Landsc. Urban Plann. 2016, 156, 92–100. [Google Scholar] [CrossRef] [Green Version]
  58. Lock, O.; Bain, M.; Pettit, C. Towards the collaborative development of machine learning techniques in planning support systems—A Sydney example. Environ. Plan. B-Urban Anal. City Sci. 2021, 48, 484–502. [Google Scholar] [CrossRef]
  59. Smith, K.; Berry, R.; Clarke, L.E. Exploring the potential of Google Earth as a communication and engagement tool in collaborative Natural Flood Management planning. Geogr. J. 2020, 186, 171–185. [Google Scholar] [CrossRef]
  60. Perez, P.; Wickramasuriya, R.; Forehead, H.; Ramezani, F.; Barthélemy, J. Breaking away from trend-based analysis for regional modelling and planning. In Proceedings of the 22nd International Congress on Modelling and Simulation, Hobart, Australia, 3–8 December 2017. [Google Scholar]
  61. Guzman, L.A.; Escobar, F.; Peña, J.; Cardona, R. A cellular automata-based land-use model as an integrated spatial decision support system for urban planning in developing cities: The case of the Bogotá region. Land Use Policy 2020, 92, 104445. [Google Scholar] [CrossRef]
  62. Stanilov, K.; Batty, M. Exploring the Historical Determinants of Urban Growth Patterns through Cellular Automata. Trans. Gis 2011, 15, 253–271. [Google Scholar] [CrossRef]
  63. Fertner, C.; Jørgensen, G.; Nielsen, T.S. Land use scenarios for greater Copenhagen: Modelling the impact of the Fingerplan. J. Settl. Spat. Plan. 2012, 3, 50. [Google Scholar]
  64. Navarro Cerrillo, R.M.; Palacios Rodríguez, G.; Clavero Rumbao, I.; Lara, M.Á.; Bonet, F.J.; Mesas-Carrascosa, F.-J. Modeling major rural land-use changes using the GIS-based cellular automata metronamica model: The case of Andalusia (Southern Spain). ISPRS Int. J. Geo-Inf. 2020, 9, 458. [Google Scholar] [CrossRef]
  65. Sandelowski, M. Combining qualitative and quantitative sampling, data collection, and analysis techniques in mixed-method studies. Res. Nurs. Health 2000, 23, 246–255. [Google Scholar] [CrossRef]
  66. Brandao, E.; Adelfio, M.; Hagy, S.; Thuvander, L. Collaborative Pedagogy for Co-creation and Community Outreach: An Experience from Architectural Education in Social Inclusion Using the Miro Tool; Paper presented at the Advances in Human Dynamics for the Development of Contemporary Societies; Springer International Publishing: Cham, Switzerland, 2021. [Google Scholar]
  67. Zhou, L.; Dang, X.; Sun, Q.; Wang, S. Multi-scenario simulation of urban land change in Shanghai by random forest and CA-Markov model. Sustain. Cities Soc. 2020, 55, 102045. [Google Scholar] [CrossRef]
  68. Han, Y.; Jia, H. Simulating the spatial dynamics of urban growth with an integrated modeling approach: A case study of Foshan, China. Ecol. Model. 2017, 353, 107–116. [Google Scholar] [CrossRef]
  69. García-Álvarez, D.; Camacho Olmedo, M.T.; Van Delden, H.; Mas, J.-F.; Paegelow, M. Comparing the structural uncertainty and uncertainty management in four common Land Use Cover Change (LUCC) model software packages. Environ. Model. Softw. 2022, 153, 105411. [Google Scholar] [CrossRef]
  70. Prentice, I.C.; Liang, X.; Medlyn, B.E.; Wang, Y.-P. Reliable, robust and realistic: The three R’s of next-generation land-surface modelling. Atmos. Chem. Phys. 2015, 15, 5987–6005. [Google Scholar] [CrossRef] [Green Version]
  71. DasGupta, R.; Hashimoto, S.; Okuro, T. Basu, MScenario-based land change modelling in the Indian Sundarban delta: An exploratory analysis of plausible alternative regional futures. Sustain. Sci. 2019, 14, 221–240. [Google Scholar] [CrossRef]
  72. DPE. Sydney Housing Supply Forecast. 2022. Available online: https://www.planning.nsw.gov.au/Research-and-Demography/Sydney-Housing-Supply-Forecast (accessed on 22 September 2022).
  73. Debnath, R.; Pettit, C.; Leao, S.Z. Geodesign Approaches to City Resilience Planning: A Systematic Review. Sustainability 2022, 14, 938. [Google Scholar] [CrossRef]
  74. Neves, F.T.; de Castro Neto, M.; Aparicio, M. The impacts of open data initiatives on smart cities: A framework for evaluation and monitoring. Cities 2020, 106, 102860. [Google Scholar] [CrossRef]
  75. Horritt, M.S.; Bates, P.D. Effects of spatial resolution on a raster based model of flood flow. J. Hydrol. 2001, 253, 239–249. [Google Scholar] [CrossRef]
  76. van Oldenborgh, G.J.; Krikken, F.; Lewis, S.; Leach, N.J.; Lehner, F.; Saunders, K.R.; van Weele, M.; Haustein, K.; Li, S.; Wallom, D.; et al. Attribution of the Australian bushfire risk to anthropogenic climate change. Nat. Hazards Earth Syst. Sci. 2021, 21, 941–960. [Google Scholar] [CrossRef]
  77. PIA. Discussion Paper: Role of Planning in Adapting to a Changing Climate; ACT: Canberra, Australia, 2021; Available online: https://www.planning.org.au/documents/item/11209 (accessed on 10 March 2023).
  78. Volkery, A.; Ribeiro, T.; Henrichs, T.; Hoogeveen, Y. Your Vision or My Model? Lessons from Participatory Land Use Scenario Development on a European Scale. Syst. Pract. Action Res. 2008, 21, 459–477. [Google Scholar] [CrossRef]
  79. Falco, E.; Kleinhans, R. Beyond technology: Identifying local government challenges for using digital platforms for citizen engagement. Int. J. Inf. Manag. 2018, 40, 17–20. [Google Scholar] [CrossRef]
  80. Deal, B.; Sun, Z. A spatially explicit urban simulation model: Land use evolution impact assessment model (LEAM). In Smart Growth and Climate Change: Regional Development, Infrastructure and Adaptation; Ruth, M., Ed.; Edward Elgar: Northhampton, UK, 2006; pp. 181–203. [Google Scholar]
  81. Pettit, C.; Wentz, E.; Randolph, B.; Sanderson, D. Tackling the challenge of growing cities: An informed urbanisation approach. In Open Cities|Open Data; Hawken, S., Han, H., Pettit, C., Eds.; Palgrave Macmillan: Singapore, 2020; pp. 197–219. [Google Scholar]
  82. Jiang, H.; Geertman, S.; Witte, P. Smart urban governance: An alternative to technocratic “smartness”. GeoJournal 2020. [Google Scholar] [CrossRef]
Figure 1. An extended conceptual framework based on Jiang, Geertman and Witte [15] for understanding the usefulness of a PSS.
Ijgi 12 00311 g001
Figure 2. Extent of the study area subdivided into five regions.
Ijgi 12 00311 g002
Figure 3. Participants evaluating growth potentials of the study area using contextual data (left) and gaining an understanding of the simulated scenarios (right).
Ijgi 12 00311 g003
Figure 4. The resilience policy recommendation matrix filled out by the bushfire group.
Ijgi 12 00311 g004
Figure 5. A screenshot from Metronamica PSS showing the simulated Bushfire resilience scenario for 2050. The underlined land use classes (top left) were actively simulated by the model.
Ijgi 12 00311 g005
Figure 6. SWOT analysis outcome (recreated from the posted notes on Miro’s whiteboard).
Ijgi 12 00311 g006
Figure 7. Illustrations of low-density residential zoning policies applied in the model, defined with spatially explicit permissibility for future development under BAU, Bushfire resilience, and Flood resilience scenarios. The clear area of a region on the maps, created using ArcGIS v.10.6, indicates strictly restricted locations for such growth.
Ijgi 12 00311 g007
Table 1. Open data sources and their usage in the CA modelling and geodesign workshop stages.
Data DescriptionData CustodianUsage Detail by Process
CA ModellingGeodesign Activity
  • ─ Study area/LGA
  • ─ Regional boundary
  • ─ Existing land use (2020)
  • ─ Australian Bureau of Statistics (ABS)
  • ─ ABS
  • ─ Department of Agriculture
Configuration/setupRepresentation models
  • ─ Population and density maps
  • ─ Service and industrial jobs and their density maps
  • ─ NSW Department of Planning and Environment (DPE)
  • ─ Transport for NSW (TfNSW)
Regional migration model
  • ─ National parks and reserves
  • ─ DPE
Constraints
  • ─ Existing road/railway
Accessibility
  • ─ Historical land use (2007)
  • ─ Land use change (2007–2020)
  • ─ DPE
  • ─ Calculated
Land use input/setupProcess models
  • ─ Digital elevation/slope
  • ─ Strategic agriculture land
  • ─ U.S. Geological Survey 1
  • ─ DPE
Suitability
  • ─ Local environmental plan (LEP) zoning
  • ─ DPE
Policy measure
  • ─ Distance to work
  • ─ Distance to recreation
  • ─ Calculated
Spatial indicator
  • ─ Socioeconomic indexes for areas (SEIFA)
  • ─ ABS
-
  • ─ Projected population
  • ─ Projected jobs in services and industrial sectors
  • ─ DPE
  • ─ TfNSW
Regional migration model (2050)Evaluation models
  • ─ New motorway and metro network with stations
  • ─ TfNSW
Accessibility (2050)
  • ─ Future residential lands
  • ─ Future employment lands
  • ─ DPE
  • ─ DPE
Suitability
  • ─ Aerotropolis plan/zoning
  • ─ Bushfire history (since 2000)
  • ─ Bushfire-prone land
  • ─ Flood history (2021–2022)
  • ─ Flood-prone land
  • ─ DPE
  • ─ DPE
  • ─ NSW Rural Fire Services (RFS)
  • ─ NSW State Emergency Service
  • ─ DPE
Policy measure (2050)
  • ─ Heat vulnerability index
  • ─ DPE
-
1 Shuttle Radar Topography Mission (SRTM) 1 Arc-Second Global data [46]
Disclaimer/Publisher’s Note: The statements, opinions and data contained in all publications are solely those of the individual author(s) and contributor(s) and not of MDPI and/or the editor(s). MDPI and/or the editor(s) disclaim responsibility for any injury to people or property resulting from any ideas, methods, instructions or products referred to in the content.

