Article

Mobile Collaborative Heatmapping to Infer Self-Guided Walking Tourists’ Preferences for Geomedia

Graduate School of Engineering Science, Akita University, Akita 010-8502, Japan
*
Author to whom correspondence should be addressed.
ISPRS Int. J. Geo-Inf. 2023, 12(7), 283; https://doi.org/10.3390/ijgi12070283
Submission received: 29 May 2023 / Revised: 10 July 2023 / Accepted: 13 July 2023 / Published: 15 July 2023
(This article belongs to the Special Issue Urban Geospatial Analytics Based on Crowdsourced Data)

Abstract

:
This paper proposes a model-less feedback system driven by tourist tracking data that are automatically collected through mobile applications to visualize the gap between geomedia recommendations and the actual routes selected by tourists. High-frequency GPS data essentially make it difficult to interpret the semantic importance of hot spots and the presence of street-level features on a density map. Our mobile collaborative framework reorganizes tourist trajectories. This processing comprises (1) extracting the location of the user-generated content (UGC) recording, (2) abstracting the locations where tourists stay, (3) discarding locations where users remain stationary, and (4) simplifying the remaining points of location. Then, our heatmapping system visualizes heatmaps for hot streets, UGC-oriented hot spots, and indoor-oriented hot spots. According to our experimental study, this method can generate a trajectory that is more adaptable for hot street visualization than the raw trajectory and a simplified trajectory according to its geometry. This paper extends our previous work at the 2022 IEEE International Conference on Big Data, providing deeper discussions on application for local tourism. The framework allows us to derive insights for the development of guide content from mobile sensor data.

1. Introduction

Walking tourism is a fascinating aspect of tourism businesses, offering visitors authentic and unique local experiences [1]. Well-designed guide content including regional resources with interesting stories, such as history and nature, can play an important role in promoting destinations through guidebooks and tour events. In recent years, the development of location-based services (LBSs) has not only replaced printed guidebooks with geomedia delivery via mobile applications and web browsers but also enhanced immersive self-guided walking tours [2,3]. For example, the authors of this paper, Lu and Arikawa, developed a framework to enable the integration of illustrated maps with basic LBS functions, such as positioning current user locations without distorting their original appearance [4]. While mobile environments are becoming powerful tools for building local storytelling for organizers of walking tours, there needs to be more discussion on methods to evaluate the attractiveness and appropriateness of the story itself and to justify or improve their businesses. The recent digitalization in the field of tourism can accelerate local community-led and urban-scale analytics based on mobile device data [5,6]. In particular, tourists’ mobility data, such as GPS data, have the potential to provide a richer understanding of destination marketing [7]. Our research contributes to a mobile-driven feedback system for the development of local tourism businesses.
As one of the essential indices for understanding the user preferences of the geomedia of self-guided walking tours, this paper proposes an approach that visualizes trends in tourists’ access to geographic features, such as spots and streets. If the similarity between the recommended routes and the routes that the actual users select is low, this could indicate that the content of the walking guide has some unattractive or inappropriate recommendations for users. Participants in self-guided walking tourism continually input interpretations of regions using two sources before and during their walk: geomedia and the real world. At the same time, they employ an algorithm depending on various factors, such as their character (e.g., hasty, optimistic) and situation (e.g., time to get home), to decide their destinations and the paths they will use [8]. A walking tourism report illustrates good walking route characterizations as insights for the policy of their algorithm—attractiveness, safety, level of difficulty, and access [1]. Based on this decision-making process, tourists’ actual movement can imply their acceptance or refusal of tourism organizers’ recommendations.
While many studies recognize that explorations of meaningful spots in destinations are a primary task in itinerary planning and intelligent transportation [9,10,11], movement as a tour experience and pedestrian mobility based on qualitative factors, except for the shortest route principle, tend to be underestimated [12]. Some research on the automatic generation of a tour itinerary has proposed movement routes based on time saving or querying Google Maps [13,14,15,16]. From the perspective of walking tours, they only take access into account, not all factors in the policy of route selection. Some people may be willing to stroll along a road brimming with cherry blossoms on the way to their destination. Others may take a detour to avoid streets without many pedestrians. Our research highlights the necessity of feedback not only on tourists’ preferred spots but also on streets—namely, the inference of hot spots and hot streets.
A variety of visualization methods that infer the amount of access to each spot and street in a city using GPS log data with and without logic models have been proposed (Table 1). Thanks to the recent availability of crowdsourced road networks and region-of-interest models via online services, model-based methods have become popular and reasonable solutions [17,18]. Utilizing geometry data assuming candidates of a hot spot, spatial intersections with point data of user trajectories would present staying at each spot in a city [19,20]. Road networks are also used to detect urban hot spots [21]. Furthermore, a map-matching algorithm with road network data, one of the most important and useful approaches in urban analysis, can capture street-level congestion based on geometry, topology, probability, and other advanced algorithms, such as a hidden Markov model and a particle filter [22,23]. However, they still have problems with uncertainty and mismatching due to the noise of GPS trajectory logs [24]. Community streets tend to mistakenly map GPS point data into wrong road segments because their structures are more complicated and denser than arterial roads [25]. Additionally, the coverage and completeness of road maps can be challenging for inclusive urban analysis [26]. Model-based approaches always offer stability under strictly defined conditions and technical limitations. Even without a pre-defined model, some researchers attempt to extract points of staying based on proximity of time and space [27]; grid clustering [28]; density-based clustering, such as K-means and DBSCAN [29,30]; and others [31]. However, such model-less methods for hot spots may not fully consider application-dependent definitions of hot spots—that is, kinds of user behavior regarded as hot spots—and may extract undesirable results for analysts [32] (refer to Section 2.2 for details). In contrast with hot spot analysis, there seem to be few model-less methods on hot streets due to the irregularity of GPS log data (refer to Section 2.3 for details).
This paper proposes a coordinated model-less solution—that is, a spatial density-based visualization of hot spots and hot streets—for the following reasons: (1) walking tourists have a higher degree of freedom of movement that is not necessarily limited by the road network, such as parks and off-streets; (2) recognizing potential attractive spots and streets can also be useful feedback for the improvement of tourism media; and (3) model-less methods for hot streets have not been discussed sufficiently and can be a novel option in the field of urban analytics. The remainder of this paper is organized as follows. Section 2 explains the fundamental heatmapping approach for visualizing tourists’ movements using GPS location data that smartphones can collect to clarify the difficulties of density-based visualization. To overcome these challenges, Section 3 illustrates a novel framework that reconstructs GPS log data together with other mobile sensor data and an adaptable client system for visualization, which allows for inferring hot spots and hot streets. Section 4 evaluates the reliability and robustness of hot street inference. Using metrics of distance errors and ground truth data will verify that our advanced trajectory can draw a walker’s movement with the road segment as a unit. Finally, we apply the framework to the actual geomedia to demonstrate how it depicts tourists’ movements. This paper extends and refines our previous work presented at the 2022 IEEE International Conference Big Data [33], providing deeper discussions on applications and insights for actual local tourism with more tourist data and another user experiment, especially in Section 5.

2. Difficulty in Heatmapping with High-Frequency GPS Trajectories

This section highlights some difficulties in inferring tourists’ preferred spots and streets from simple heatmaps using only raw GPS data and clarifies the importance of the breakthrough proposed in Section 3.

2.1. Preliminaries of Heatmapping

We examined heatmap generation using raw GPS trajectory data collected from mobile devices to visualize the extent to which tourists access each local resource as a model-less approach. Heatmaps are useful for intuitive understanding by visualizing the distribution of GPS locations and their association with environmental features. For example, they have been used to capture human activity for planning urban green spaces [34] and to analyze the distribution of bus travel demand [35]. We assumed that more GPS points would be concentrated in the areas that more users visit, which could be an evaluation index of the tourist’s attention. The density value was calculated using kernel density estimation (KDE), a common method for spatial interpolation [36]. To visually represent the density gradient in each position from the minimum to the maximum value, we employ a continuous color map known as jet, transitioning from blue to green, yellow, and red. Additionally, this paper introduces a threshold, denoted as T h c . r . , to constrain the gradation range’s maximum to specific values. A higher T h c . r . allows the visualization of clusters in sparser areas. Let λ ^ u j be the density value at position u j in two-dimensional space; the gradation range is defined as follows:
0 λ ^ u j max λ ^ u j T h c . r .

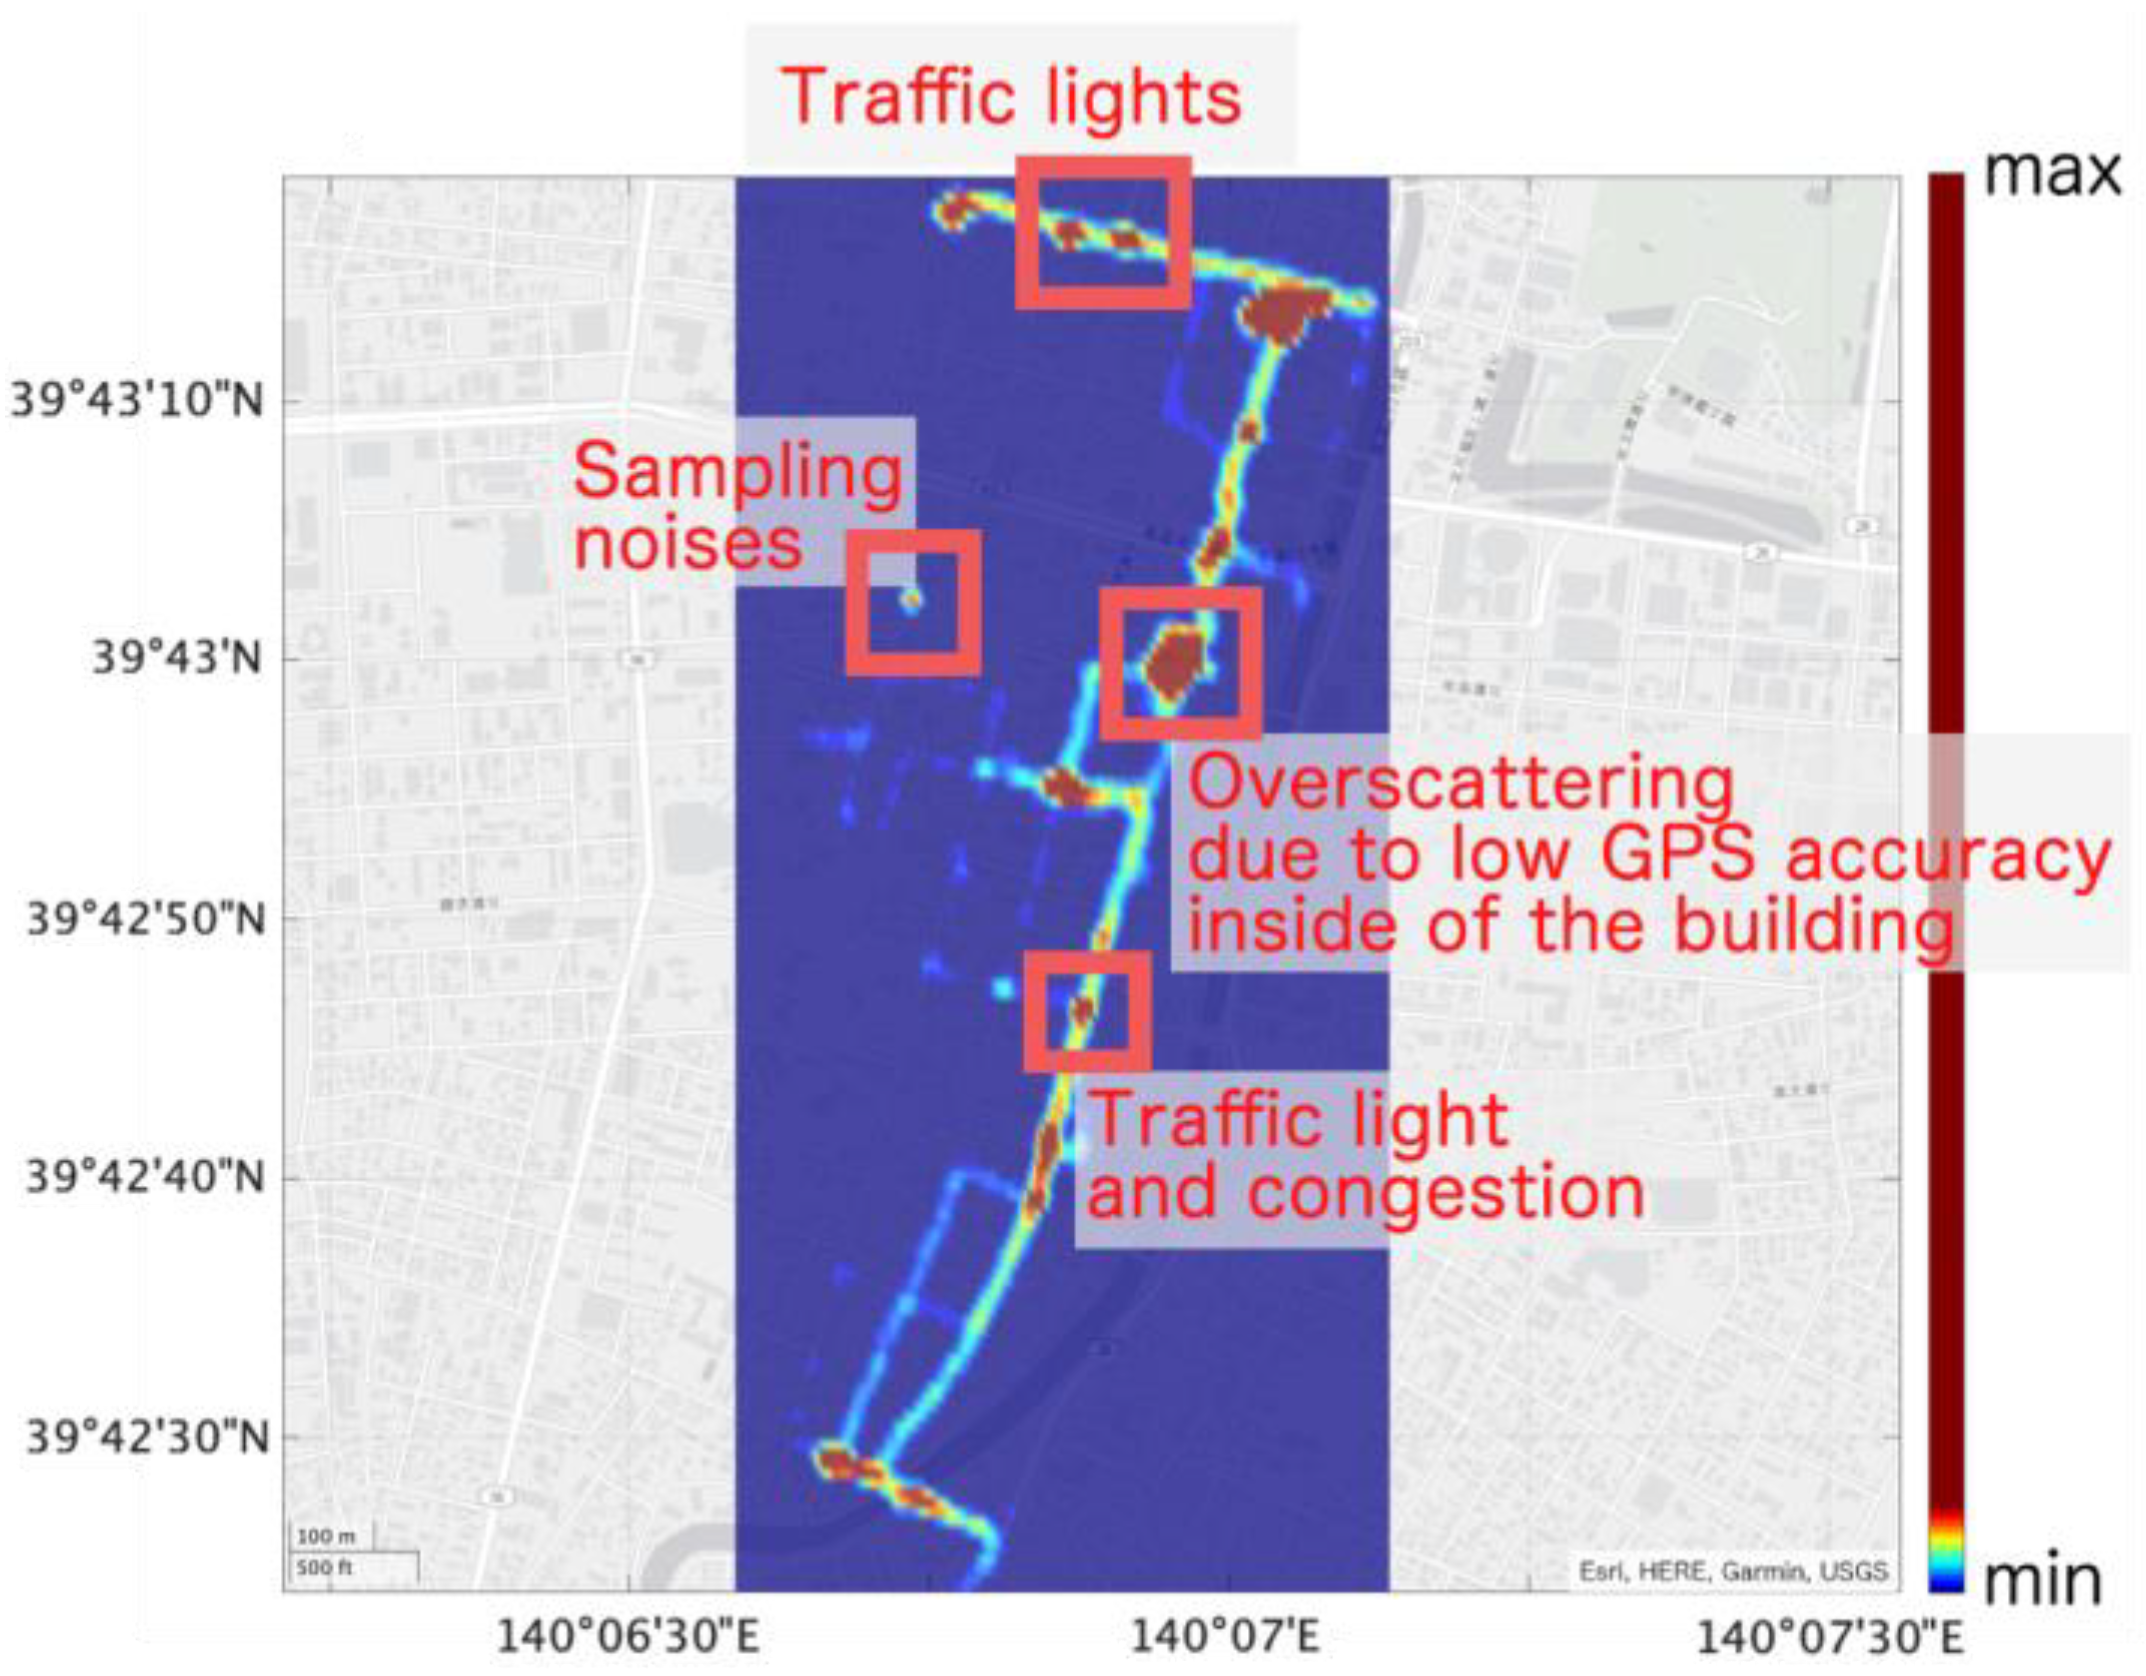
2.2. From the Perspective of Hot Spot Inferences

Heatmaps with raw GPS tracking data are semantically ambiguous. Although Figure 1 depicts some scattered high-density areas, these are not necessarily pure reflections of tourists’ intrinsic motivations. For example, areas with a large number of traffic lights and heavy traffic are relatively dense because pedestrians cannot walk without interruption. Furthermore, walking speeds depend on the user’s age, body size, and other conditions, leading to different degrees of density in the trajectory data. In other words, heatmapping with GPS data reflects a variety of technical, environmental, and user factors in outputs, making it impossible to interpret the backgrounds of hot spots on the map explicitly.

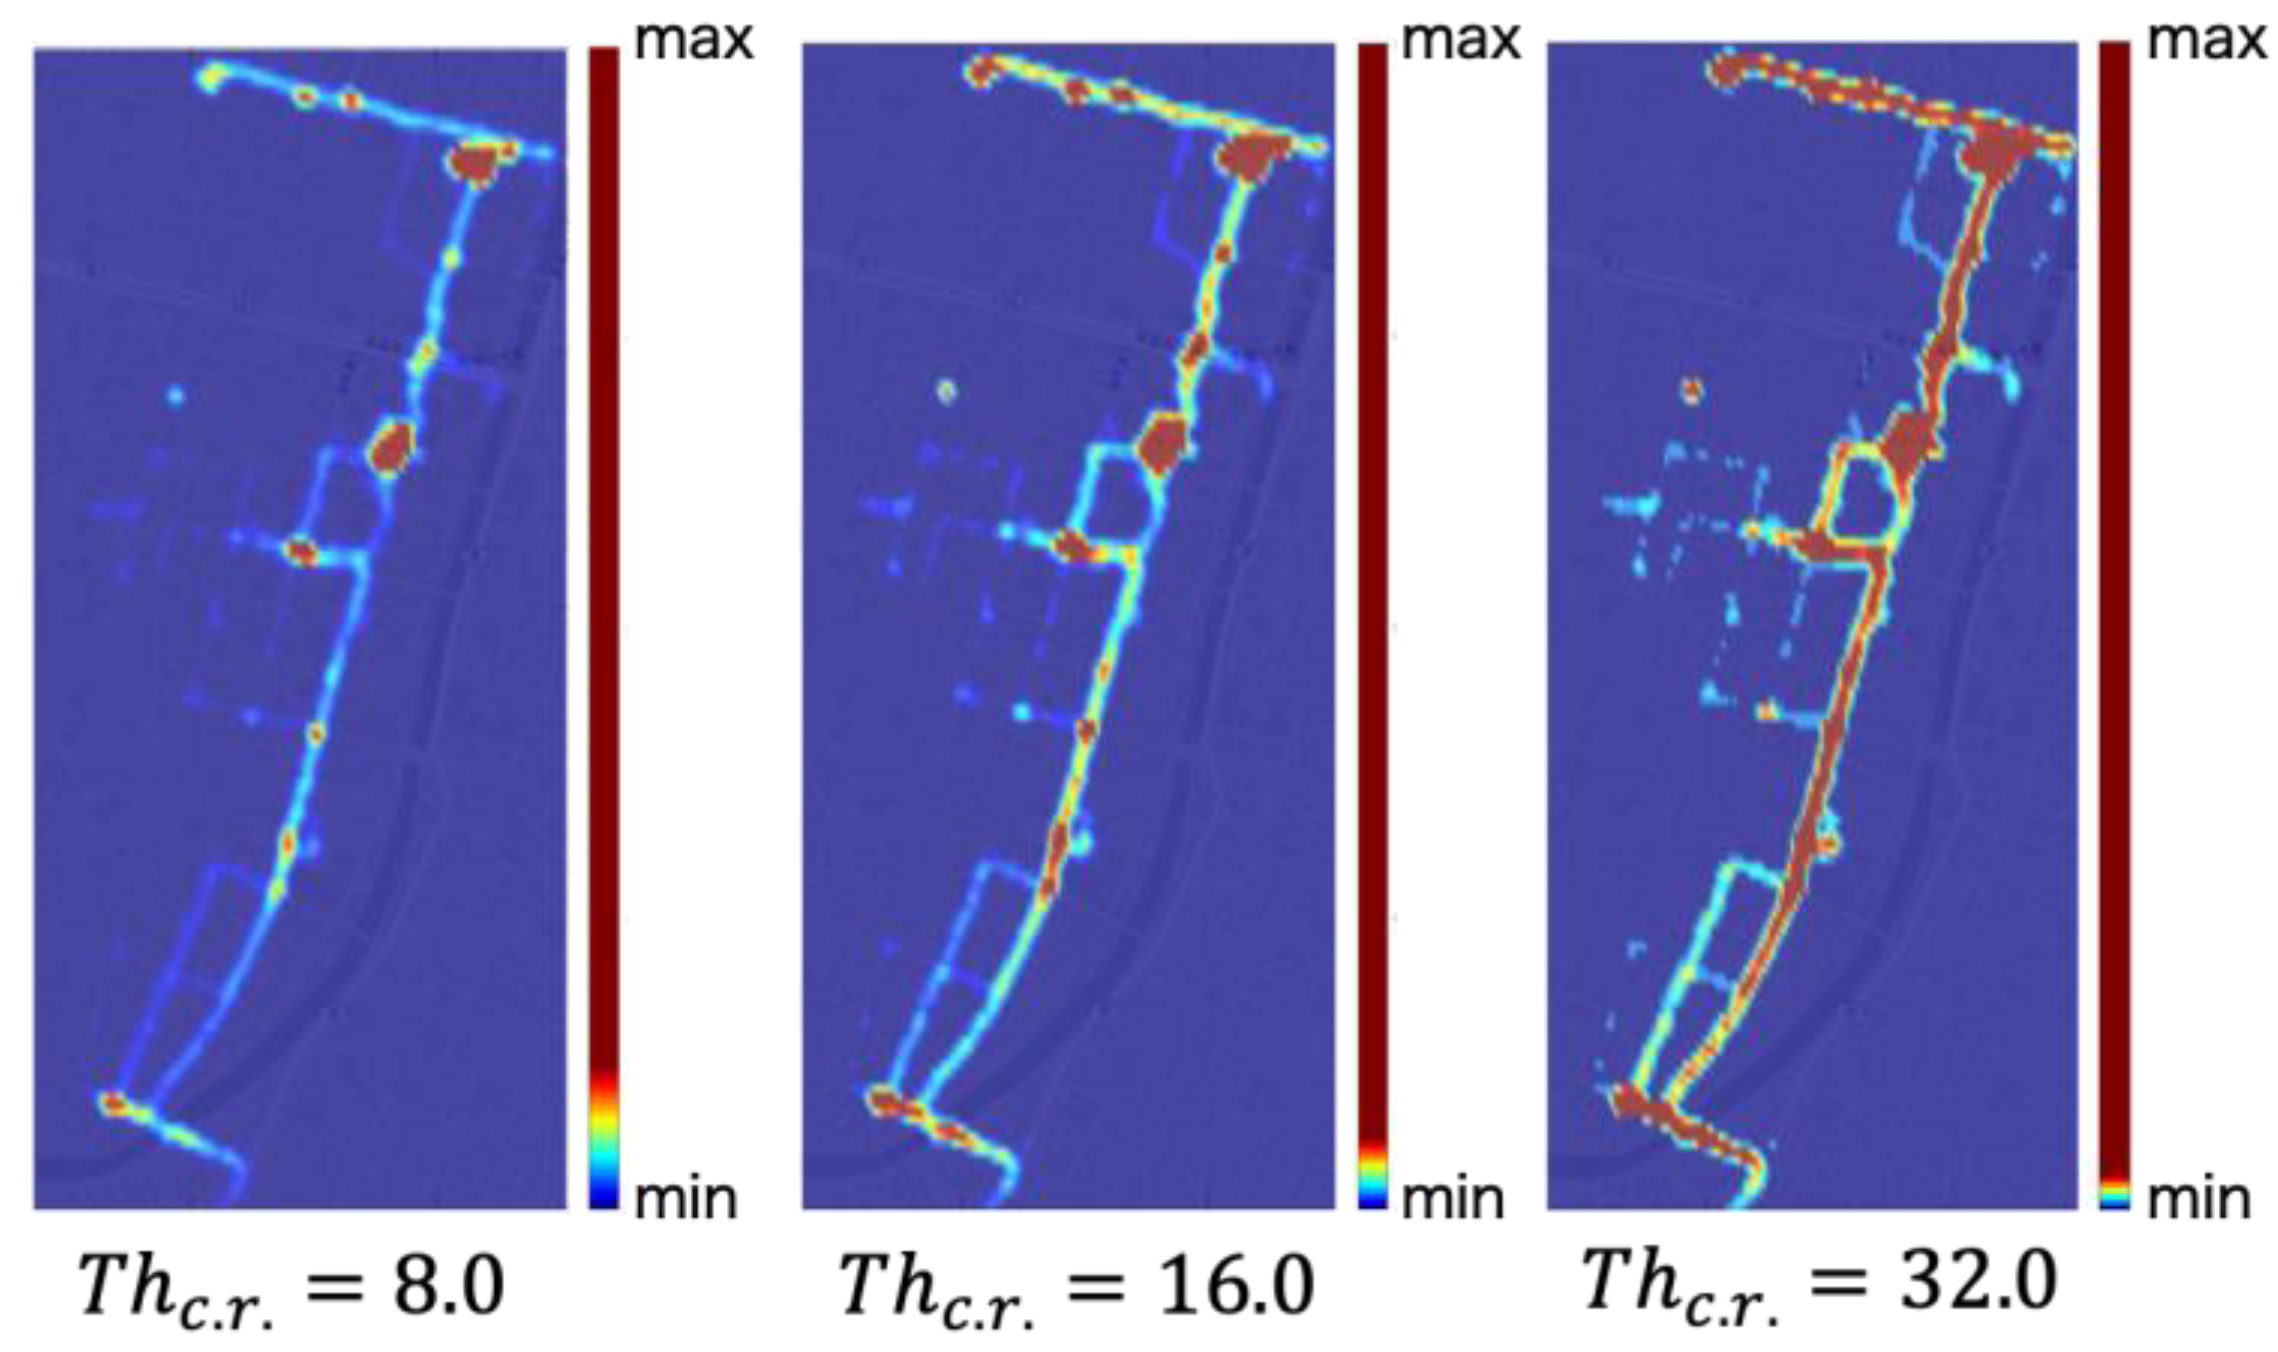
2.3. From the Perspective of Hot Street Inferences

GPS logs are discretely recorded with random noises, and tourists’ moving distance per unit of time is irregular. This prevents basic heatmaps from forming clusters describing each road segment. In other words, it may be impossible to find hot streets from raw GPS trajectories. As shown in Figure 2, dense sections of a city appear in small areas that overshadow polyline-shaped features. Even if the color range changes, the problem remains difficult to solve because a GPS trajectory contains various degrees of locally dense areas.

3. Methodology: Heatmapping Framework with Data from Multiple Mobile Sensors

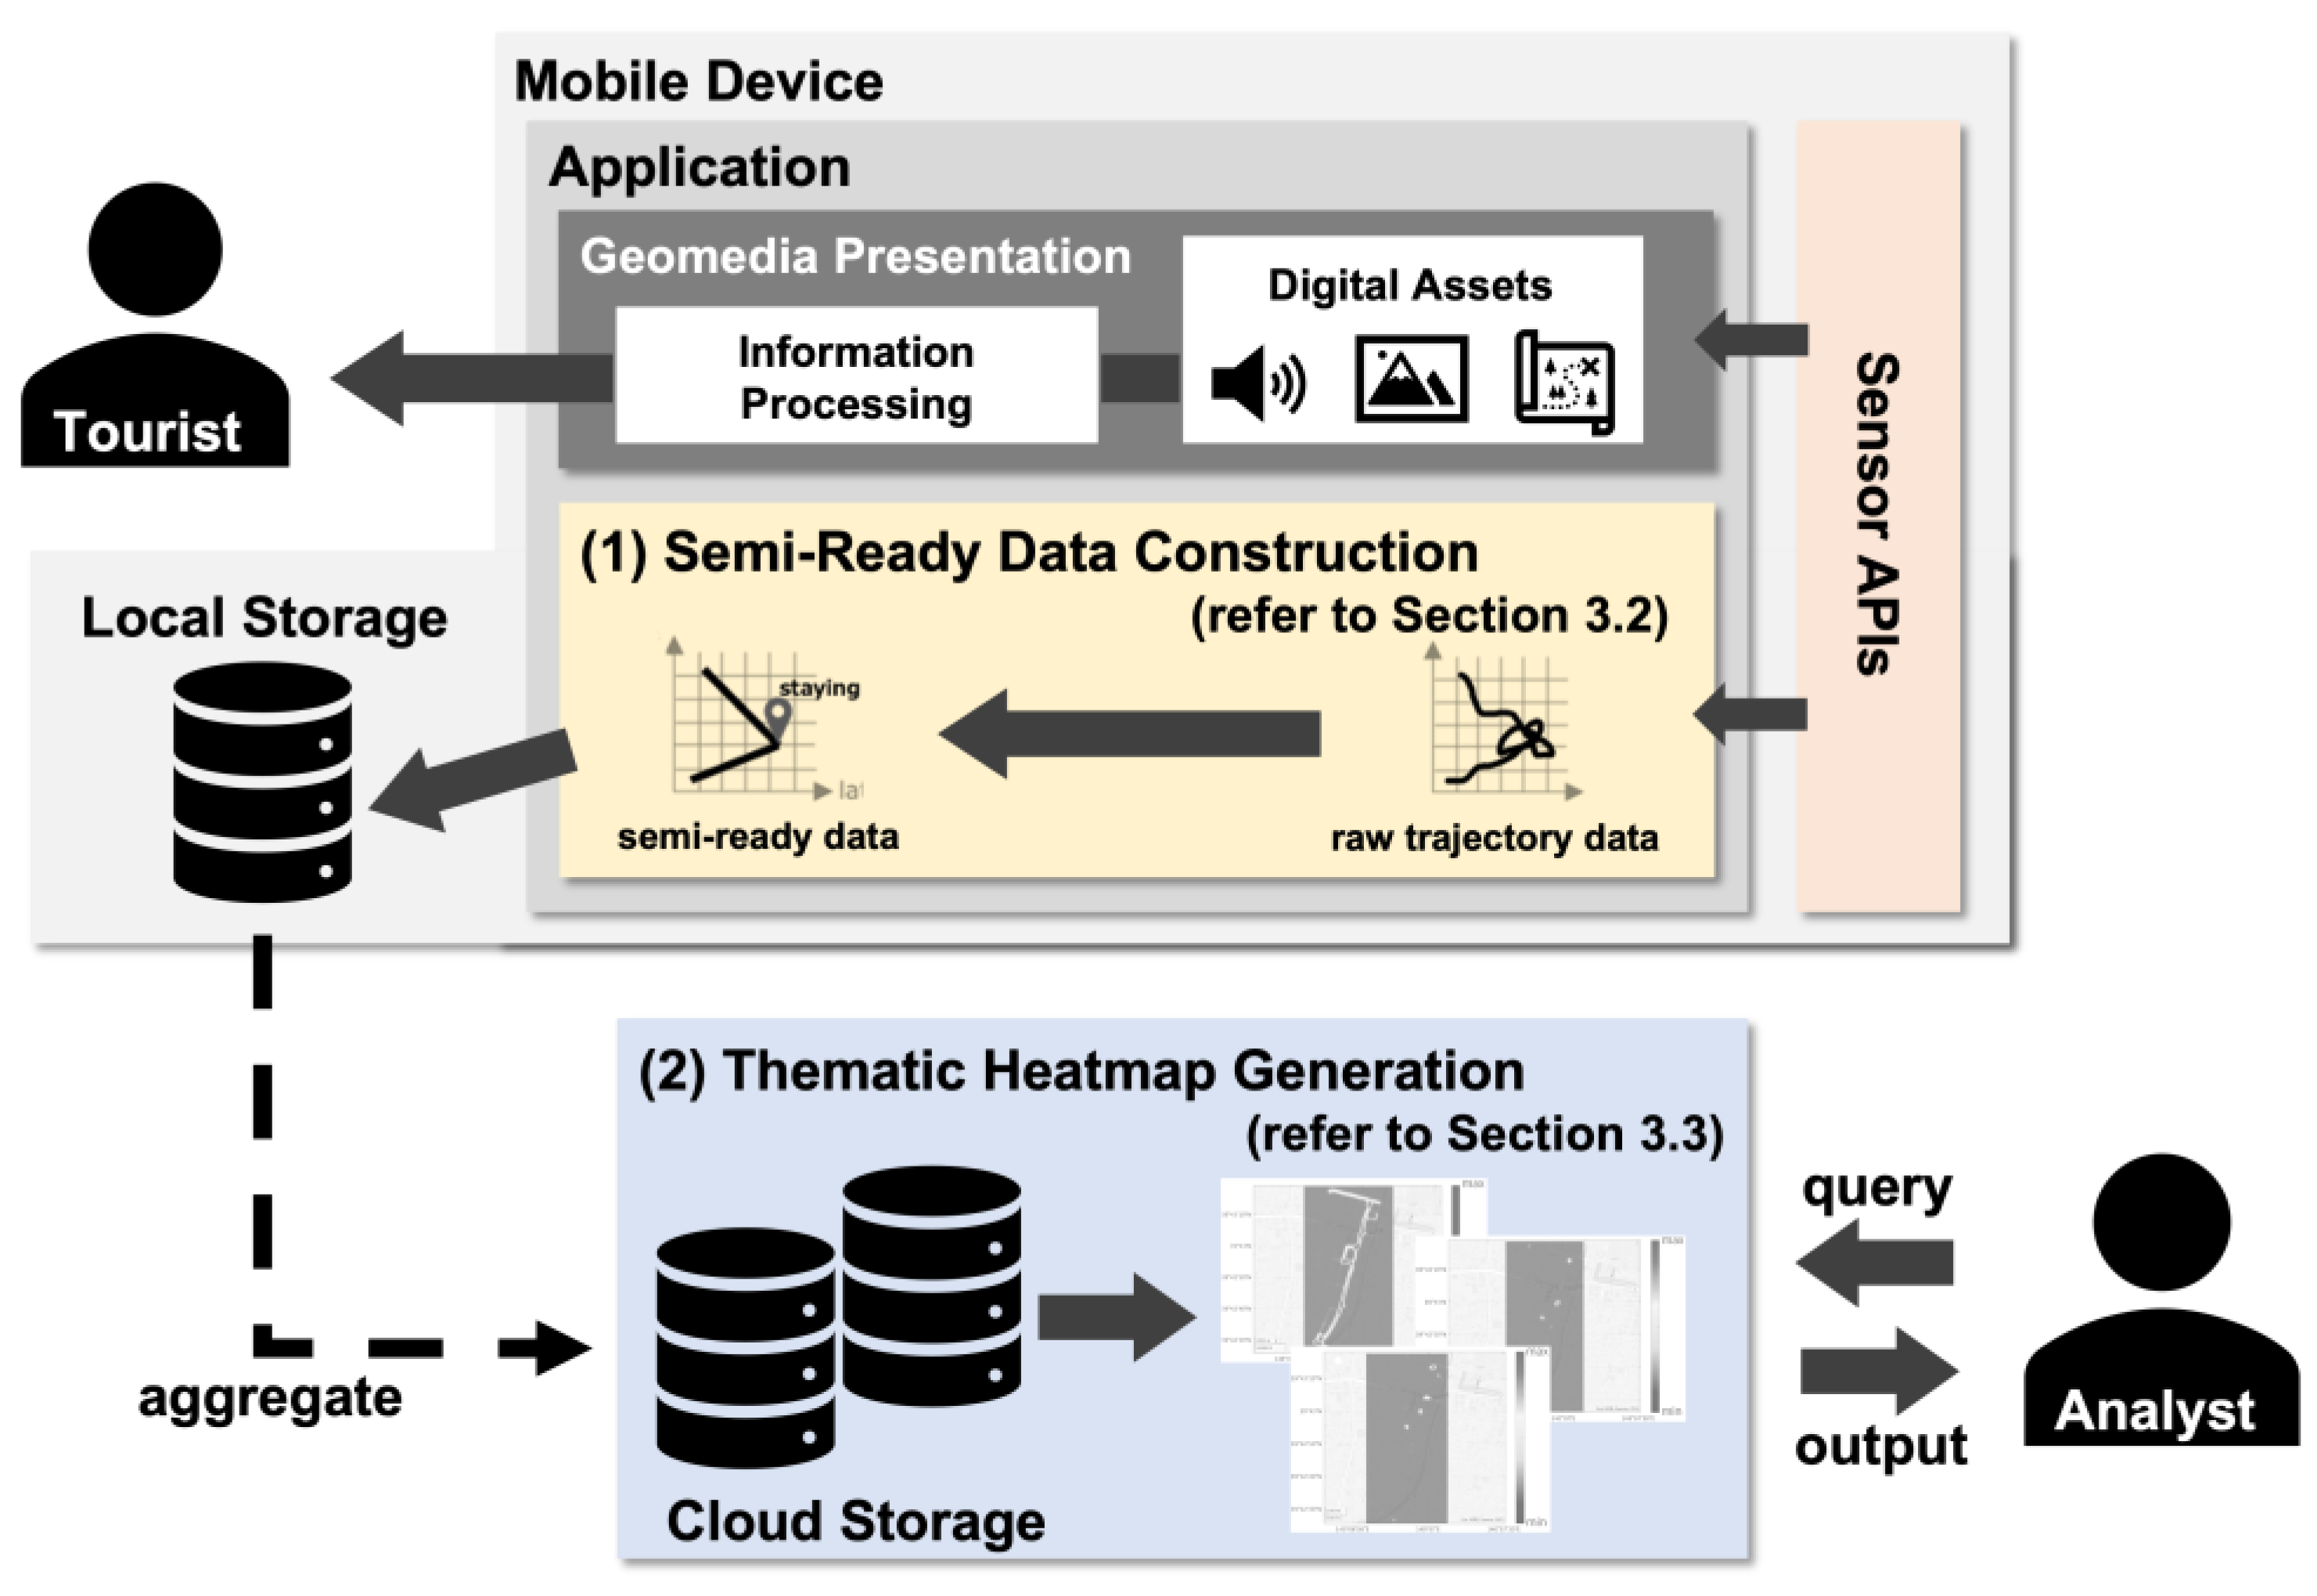
3.1. Structure of Proposed Framework

This section presents a visualization system for walking tourism by introducing a method to generate multiple heatmaps representing detailed tourist contexts. In particular, tourists’ choices and characteristics concerning travel routes, indoor stays, and UGC recordings can be extracted from the varied heatmaps. The system architecture’s generation of heatmaps follows a number of steps. First, we take advantage of the mobile environments in the walking tour to detect detailed and concise user behavior using smartphone sensors. Then, our algorithm integrates the results of the context extraction with a raw GPS trajectory through simplification and characterization of the geometry data, which generates semi-ready GPS trajectories for heatmapping on a user’s smartphone. Next, the visualization system gathers semi-ready GPS data from users’ smartphone applications into a heatmapping server and constructs a data warehouse. A sub-system of analysts calculates geodensity values, which measure the concentration of user location data in the area, using the dataset stored in the data warehouse and generates thematic heatmaps according to weight rules corresponding to the analytical requests. Integrating edge computing with mobile applications can allow for the implementation of a practical and ubiquitous data mining framework that encompasses data collection and visualization (Figure 3).

3.2. Semi-Ready Data Construction

We introduce a method for building semi-ready GPS trajectory data used to generate tourist analysis heatmaps through selective simplification and characterization based on the tourist context, which has the potential to save computational costs. Table 2 shows the target actions of a user, available data types obtained from mobile sensors to extract them, and ways to reflect them on a trajectory. To clearly visualize hot streets, the approach is to try to remove locally dense areas and over-scattering in each trajectory by rearranging the reference points of a trajectory so they are exactly enough to represent the areas where the users actually walked and stayed.

3.2.1. Extract the Location of UGC Recording

With the spread of smartphones, it has become natural for tourists to take photos and post comments on social networking services [37,38]. We assumed that recoding UGC would originate from tourist interest and decided to include the location data tagged as u g c in the trajectory data. This paper realized the extraction by monitoring the operations of a mobile application with built-in camera and note-taking functions. Additionally, recent mobile operating systems, such as iOS and Android, support APIs that allow easy access to media files on user devices. These APIs provide a feasible way to obtain the location information of UGC recordings via geotags.

3.2.2. Abstract the Locations of Staying

Many tourists enter indoor facilities, such as restaurants or aquariums, and stay there for a while during a tour. The number of users of each facility in the city is beneficial information for tourism analytics. We attempted not to visualize the total duration of tourists’ stays, which tends to be affected by the characteristics of buildings, but to tally the number of visitors. When a user is indoors, GPS accuracy data values decrease because of ceilings and walls [39,40]. Our framework detects a set of locations of staying using GPS horizontal accuracy data and T h i n d o o r and abstracts them by calculating a center point of the minimum bounding box. We set T h i n d o o r to 10.0 m on the basis of our previous experiments [41].

3.2.3. Discard Locations That Remain Stationary

Stopping outdoors for a while can also cause locally tangled trajectory lines due to random GPS noise. Additionally, it is doubtful that the behavior always comes from user interest, as discussed in Section 1. Therefore, our framework stops recording locations while the user remains stationary. Walking and stopping are judged by the variation of acceleration values and a threshold T h s t a t i o n a r y . T h s t a t i o n a r y was set to 0.1 G on the basis of our previous experiments [41].

3.2.4. Simplify the Rest Points of a Location

While walking on the street, people do not necessarily move in a straight line at a constant speed. Furthermore, random noise makes a GPS trajectory line redundant and messy. In addition to the above three processing steps, the framework applies one of the most popular line simplifications—the Douglas–Peucker algorithm [42]—to finalize the semi-ready data. The algorithm needs to set a tolerance parameter, ε . The first point p s and the last point p e are selected, and p m p s . t i m e s t a m p < p m . t i m e s t a m p < p e . t i m e s t a m p , which has the largest perpendicular Euclidean distance from the line p s p e , is detected. If the distance is larger than ε , p m will be kept as a point of a simplified trajectory, and the same processing is recursively executed with two sub-trajectories, T 1 p s : p m and T 2 p m : p e . In other words, a larger ε would give a more simplified output. Section 4 discusses an appropriate parameter ε for our framework.

3.3. Thematic Heatmap Generation

The framework proposes geo-density map generation using datasets of semi-ready data for a more detailed and concise analysis of walking tourists. The generation process refers to a tag in each data point of the trajectory and applies specific weight rules to satisfy the analyst’s demand for heatmapping. The paper introduces three fundamental heatmaps below.

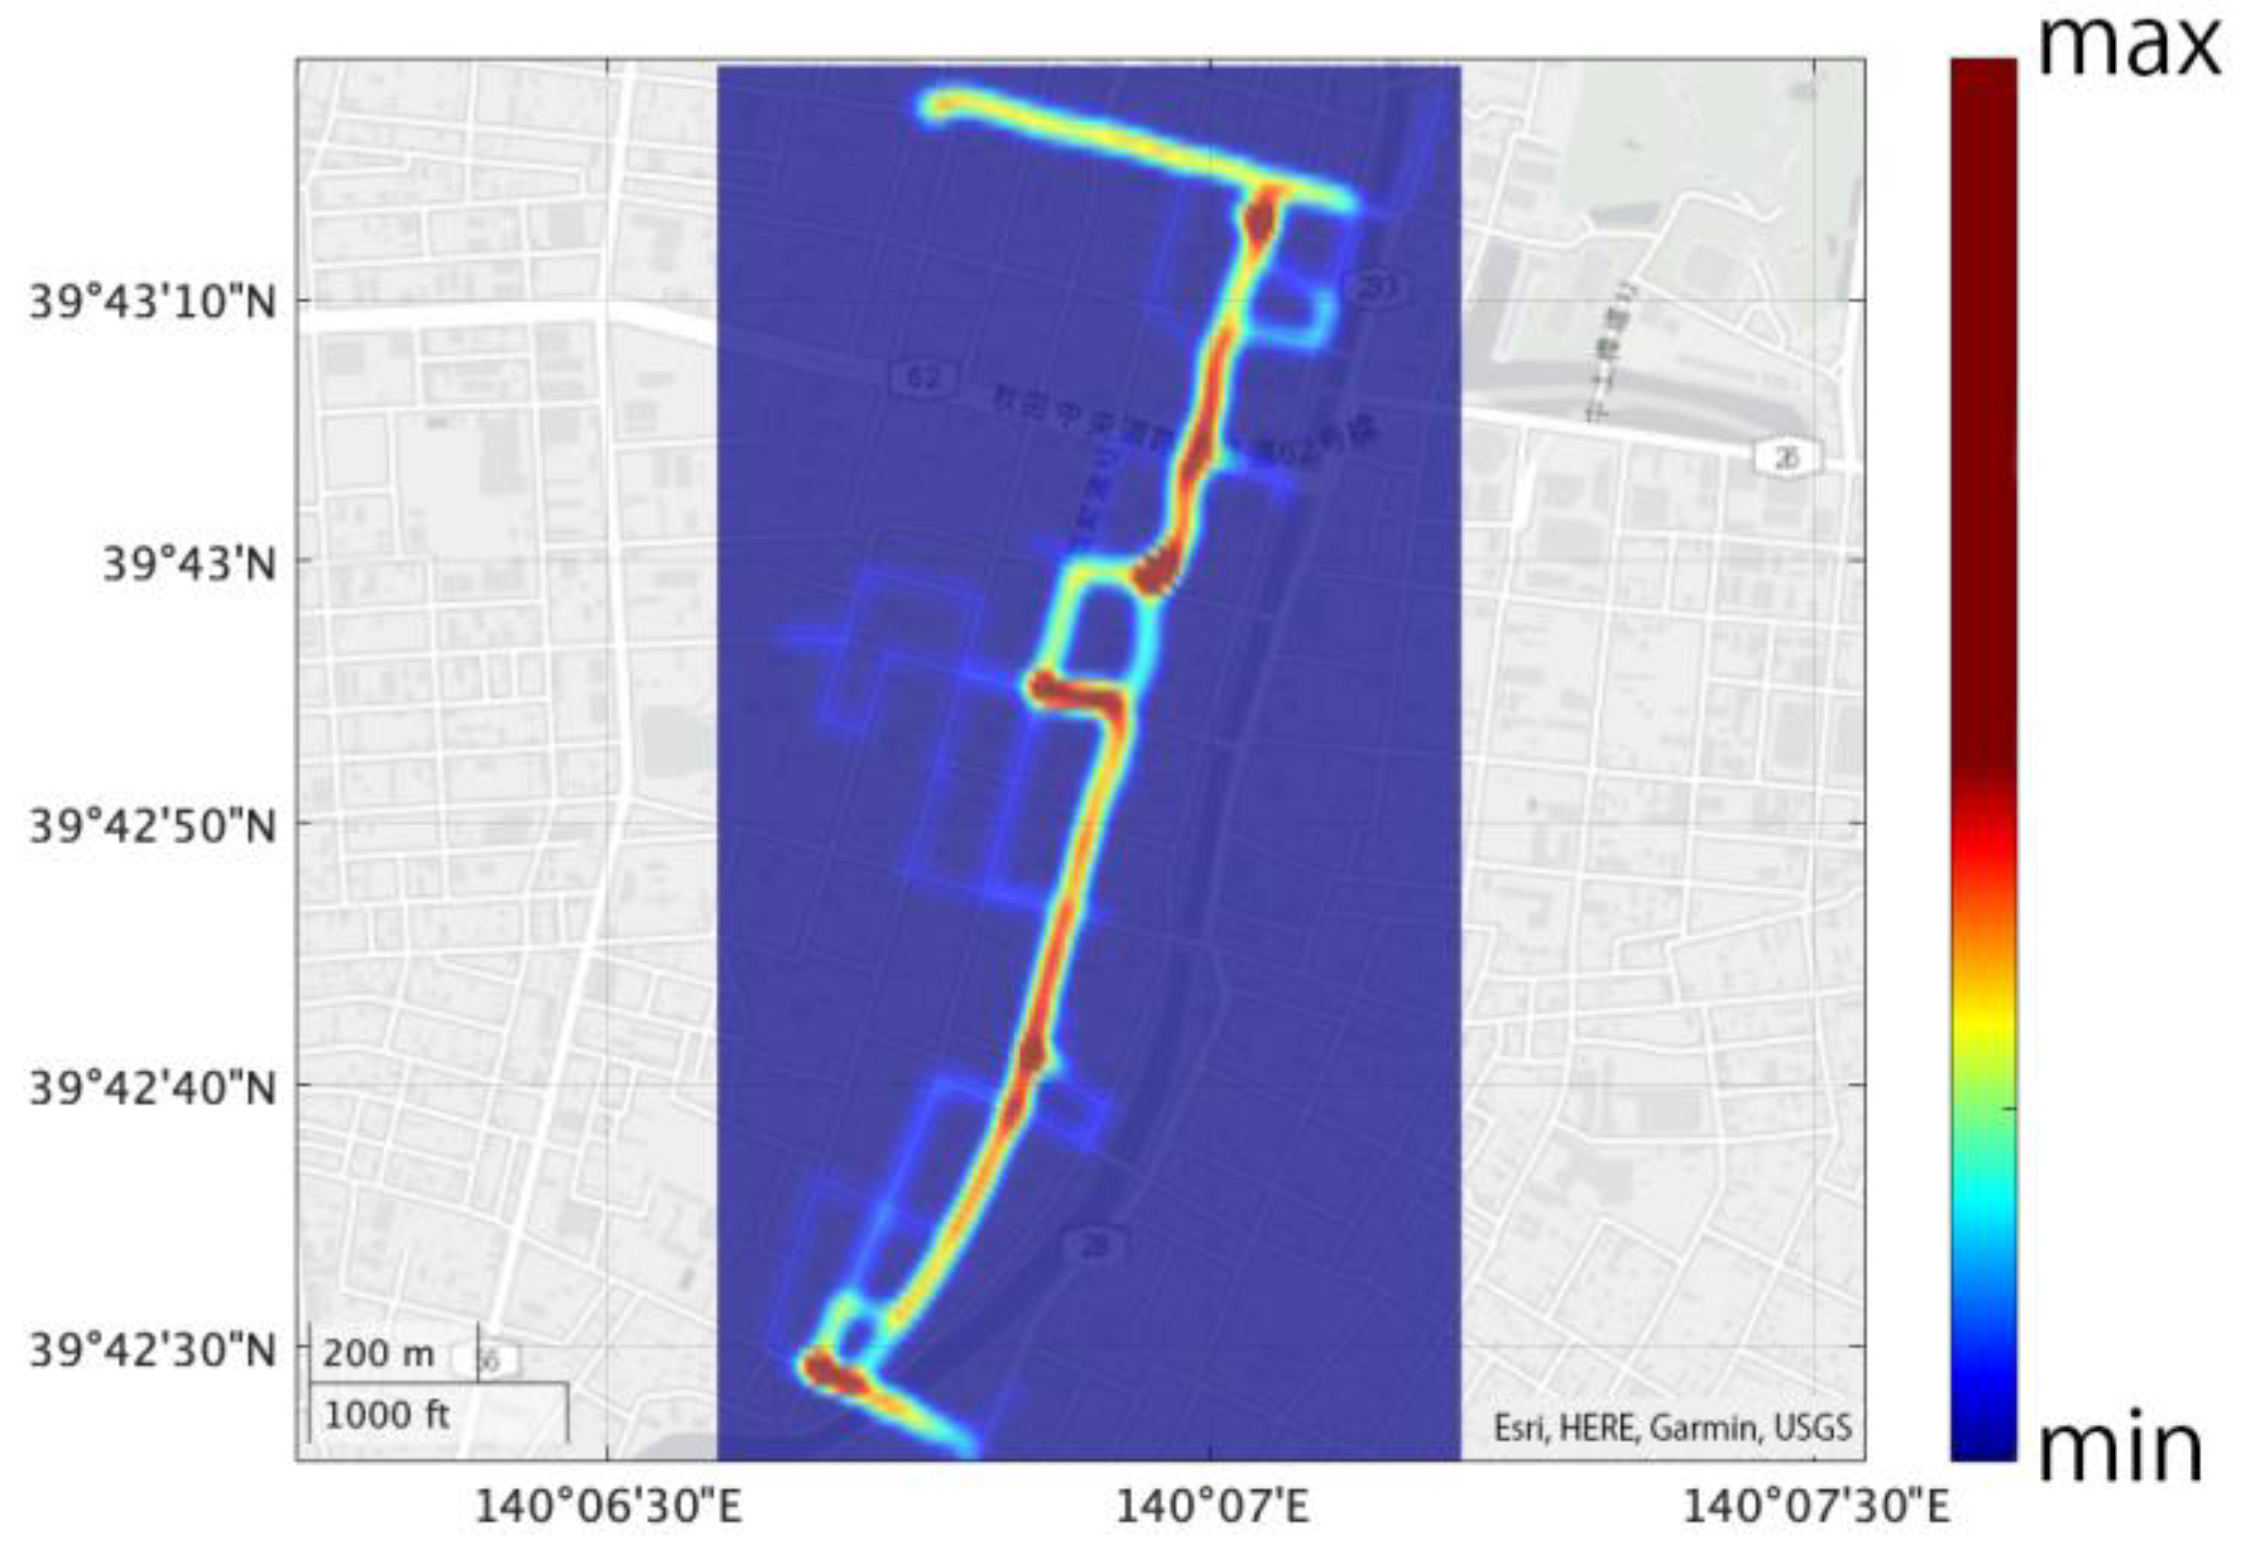
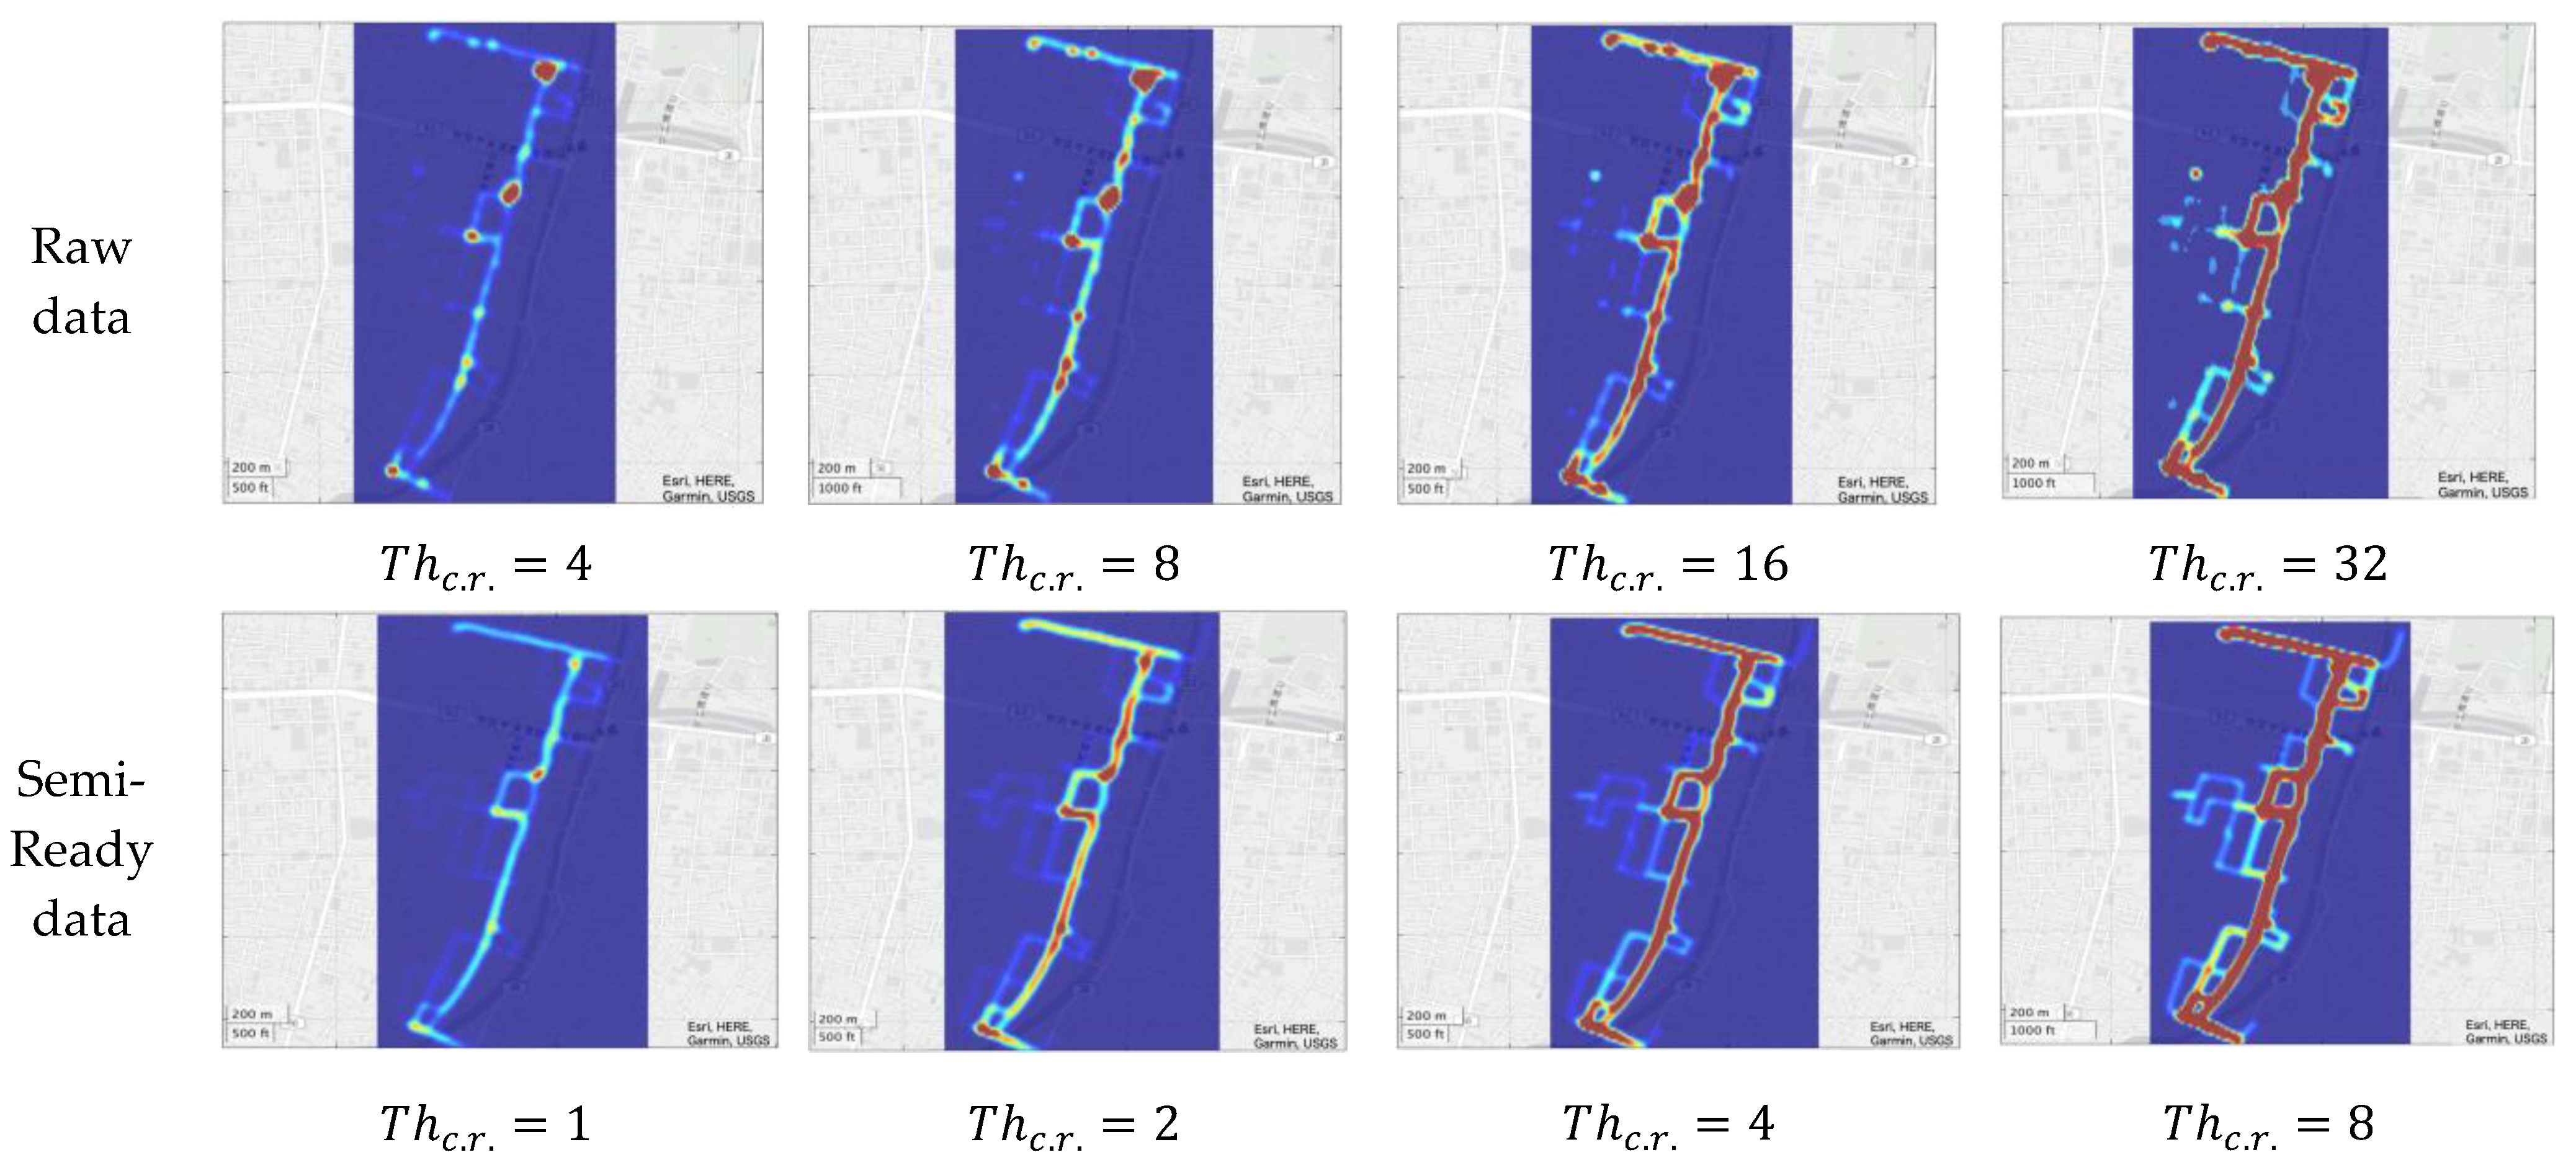
3.3.1. Hot Street Heatmap

Owing to the simplification process of the semi-ready data construction module, locally dense areas in each trajectory are removed. Then, polyline-shaped features are visualized by applying the same weight w k to each point p k in the trajectories (Equation (2)). For hot street heatmapping, we apply the line-based kernel density estimation, which first rasterizes line segments drawn by the points and then calculates the values of KDE [42].
w k = 1 k = 1 , , l

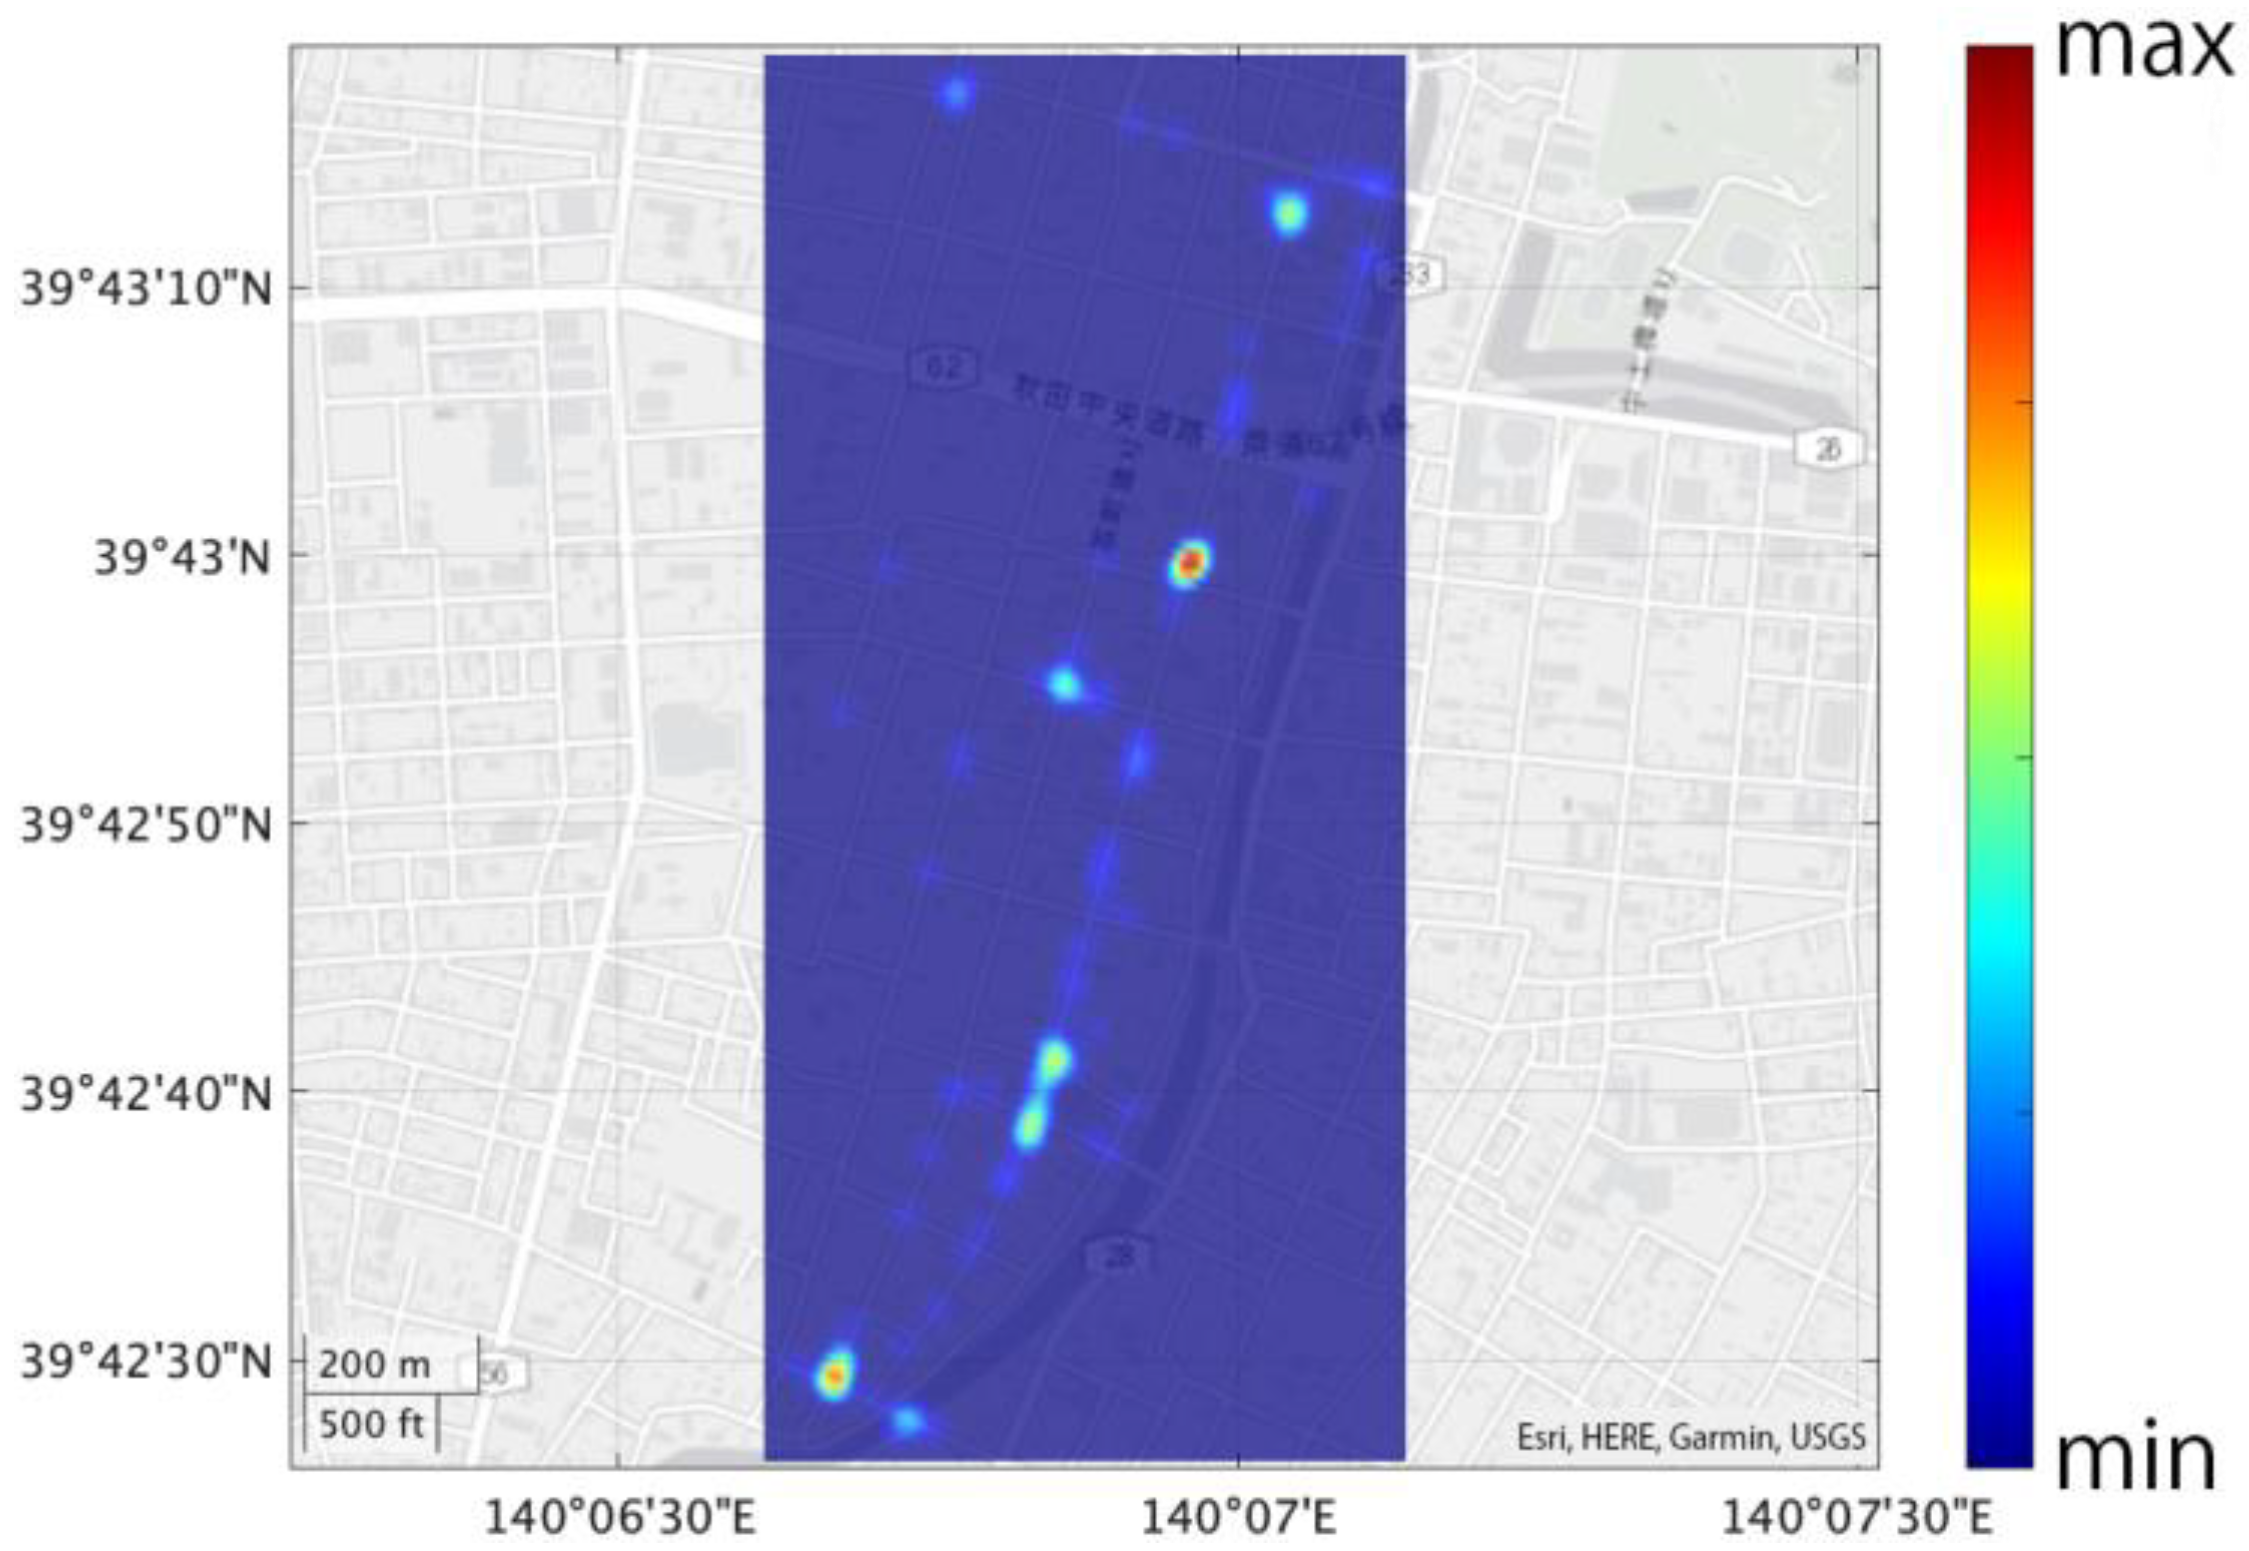
3.3.2. UGC-Oriented Hot Spot Heatmap

The process of semi-ready trajectory generation employs operation logs from the application or geotags of media files to detect the location of UGC recordings, such as taking photos and making notes, by users and record the location data with a ugc tag. Then, UGC-oriented hot spot heatmaps are created by assigning a different weight w k to each point p k based on the weight rule given in Equation (3). Dense areas on the maps present where attractive photo spots and places that are worth sharing exist in a city.
w k = 1 ,   w h e n   p k . t a g = u g c   w k = 0 ,   w h e n   p k . t a g i n d o o r ,   n o n e k = 1 , , l

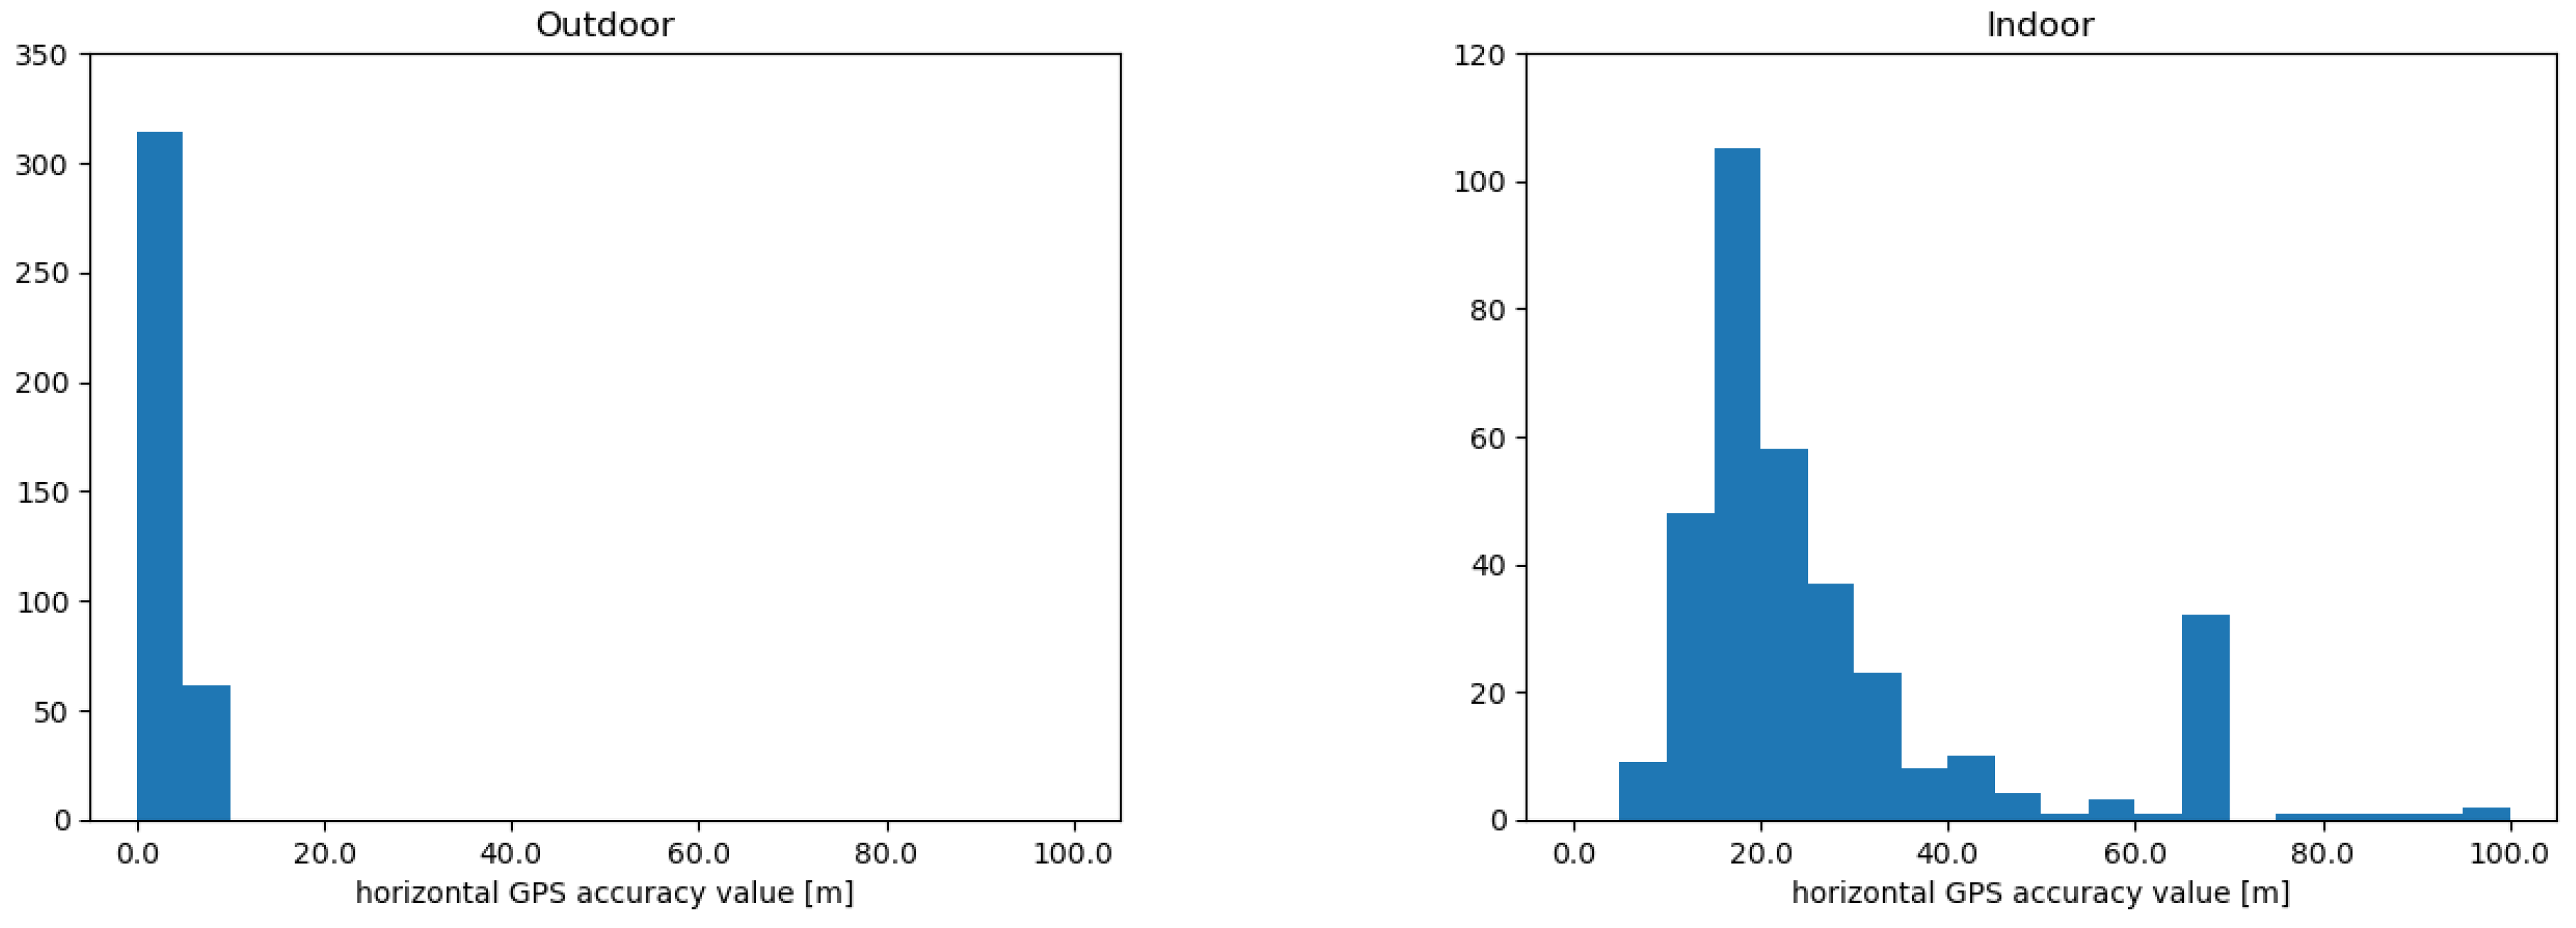
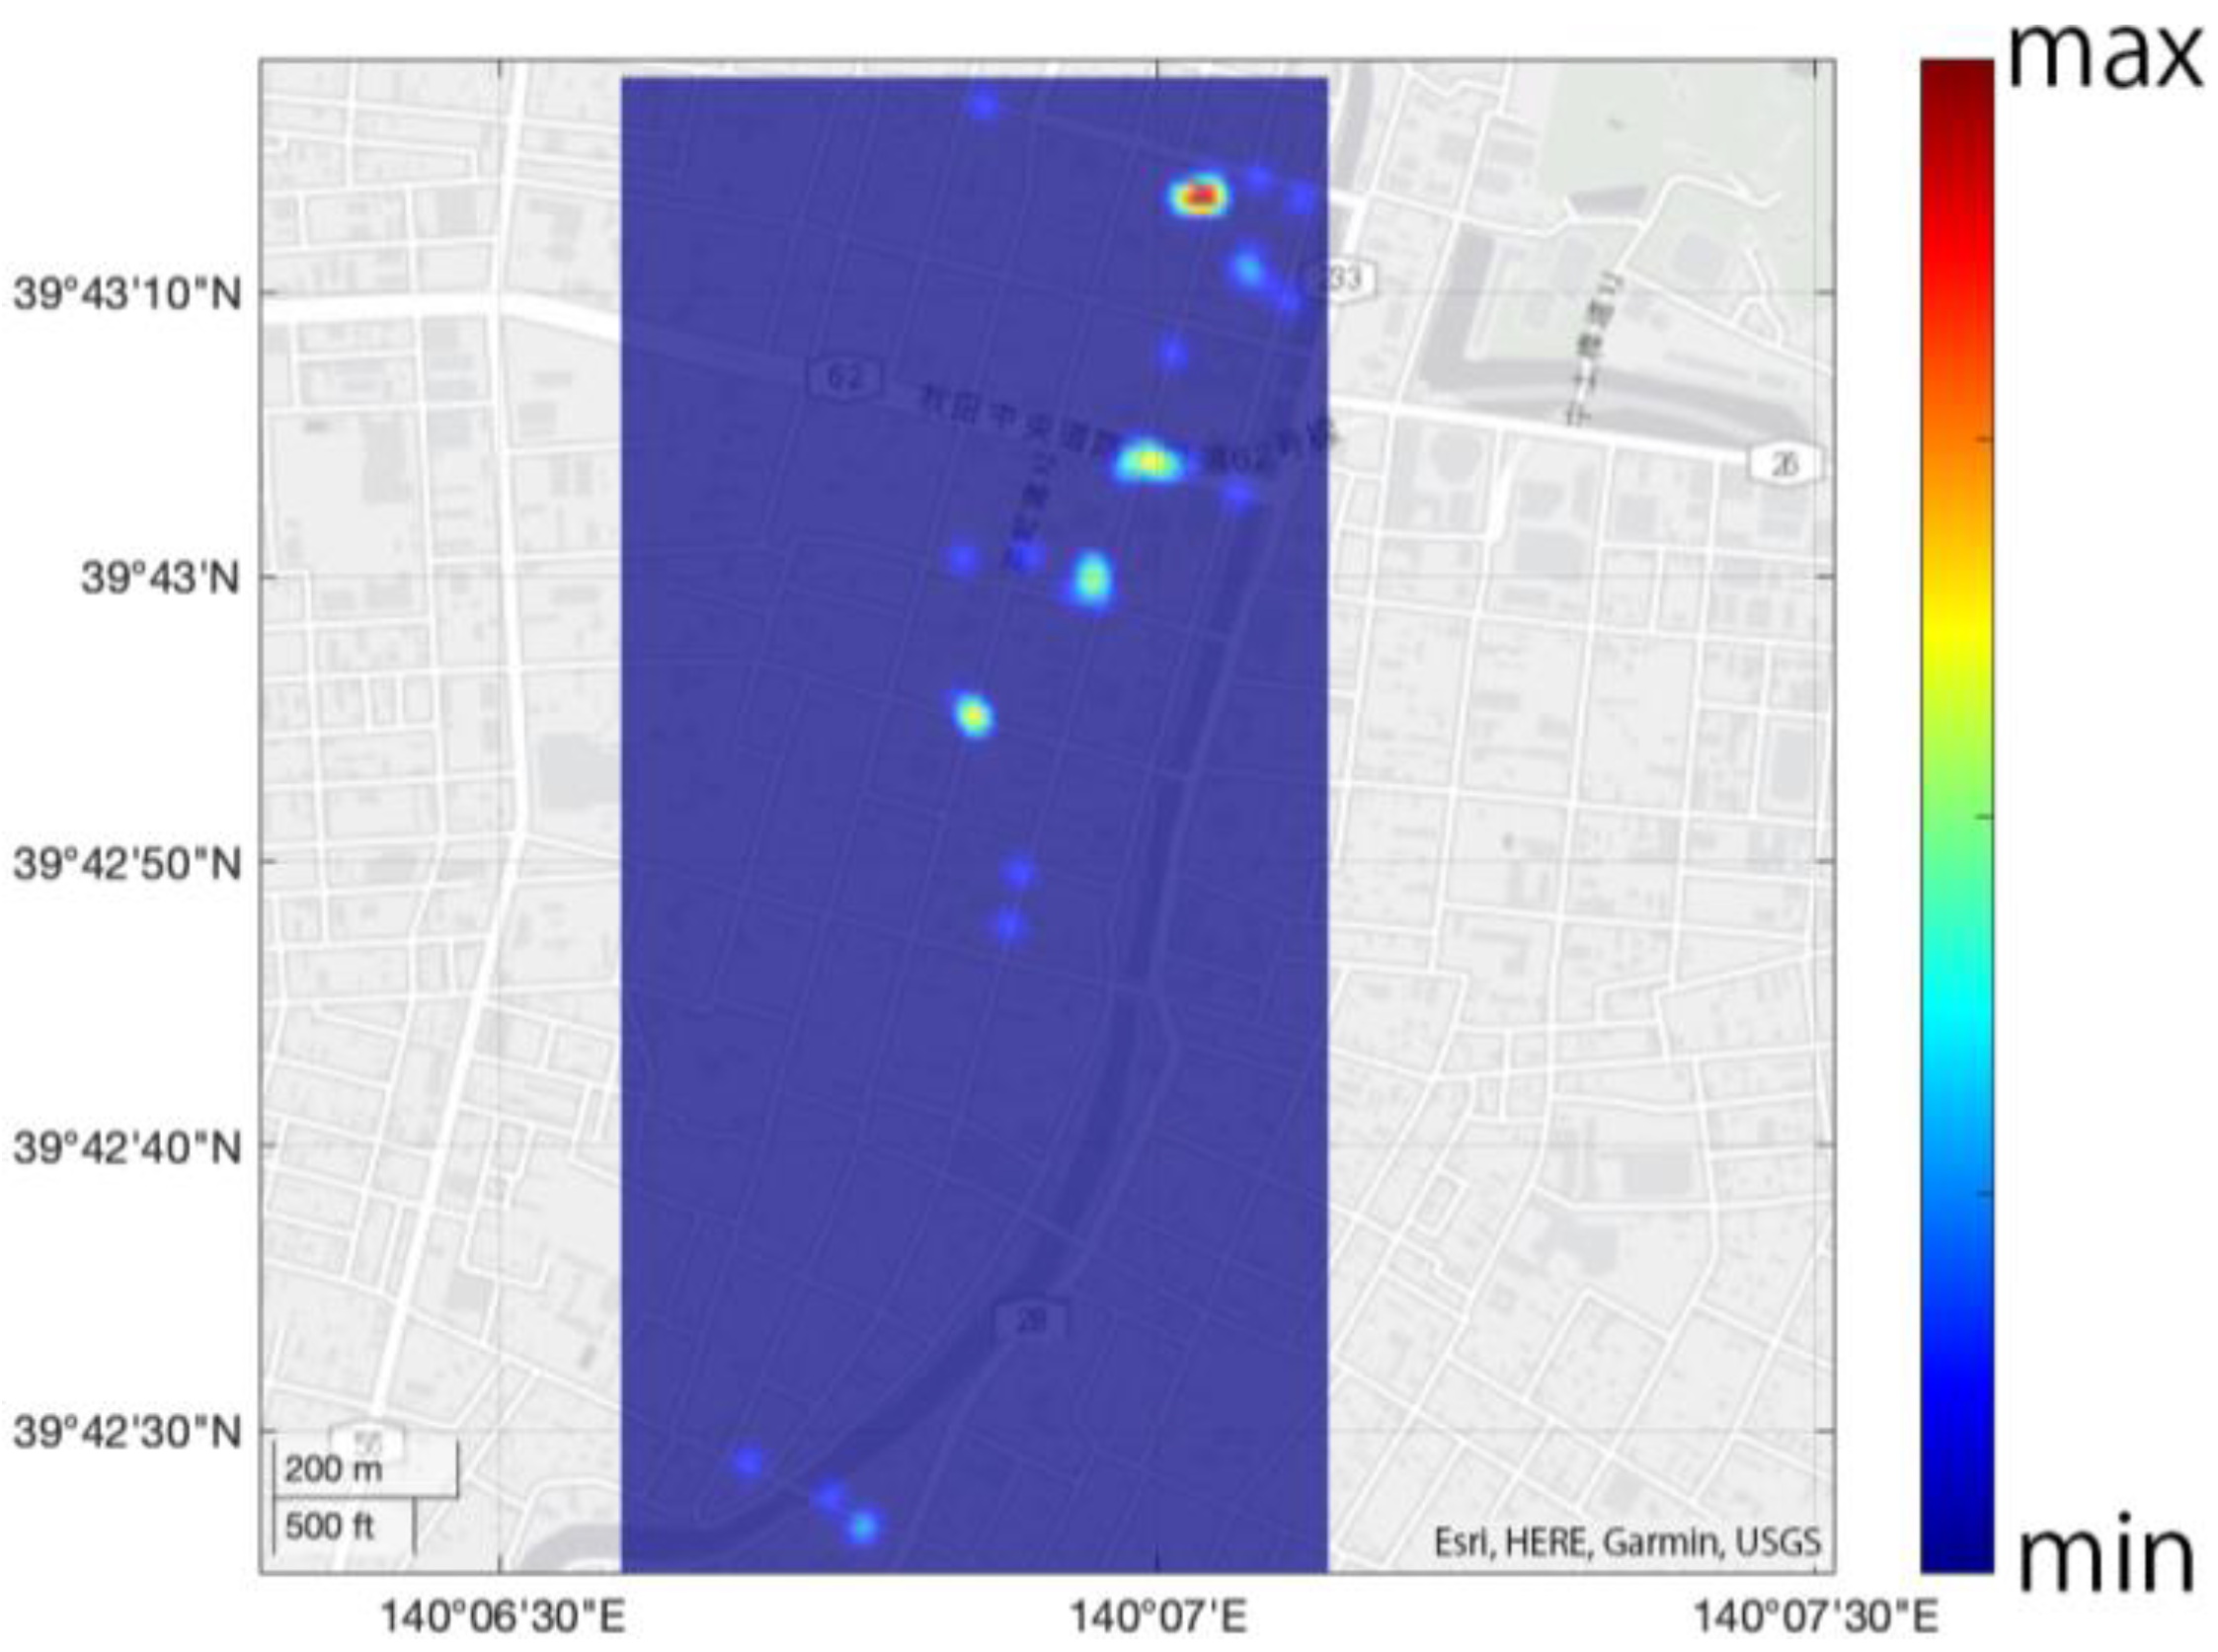
3.3.3. Indoor-Oriented Hot Spot Heatmap

In the proposed trajectory generation, a series of indoor location points are abstracted into a representative point with an i n d o o r tag by monitoring the variation in GPS horizontal accuracy values. Then, the weight rule, defined as Equation (4), assigns a different weight w k to each point p k and realizes indoor-oriented hot spot heatmaps. Analysts can compare the degrees of attractiveness among buildings that tourists visit by browsing through them.
w k = 1 ,   w h e n   p k . t a g = i n d o o r   w k = 0 ,   w h e n   p k . t a g u g c ,   n o n e k = 1 , , l

4. Distance Error Analysis of Semi-Ready Data
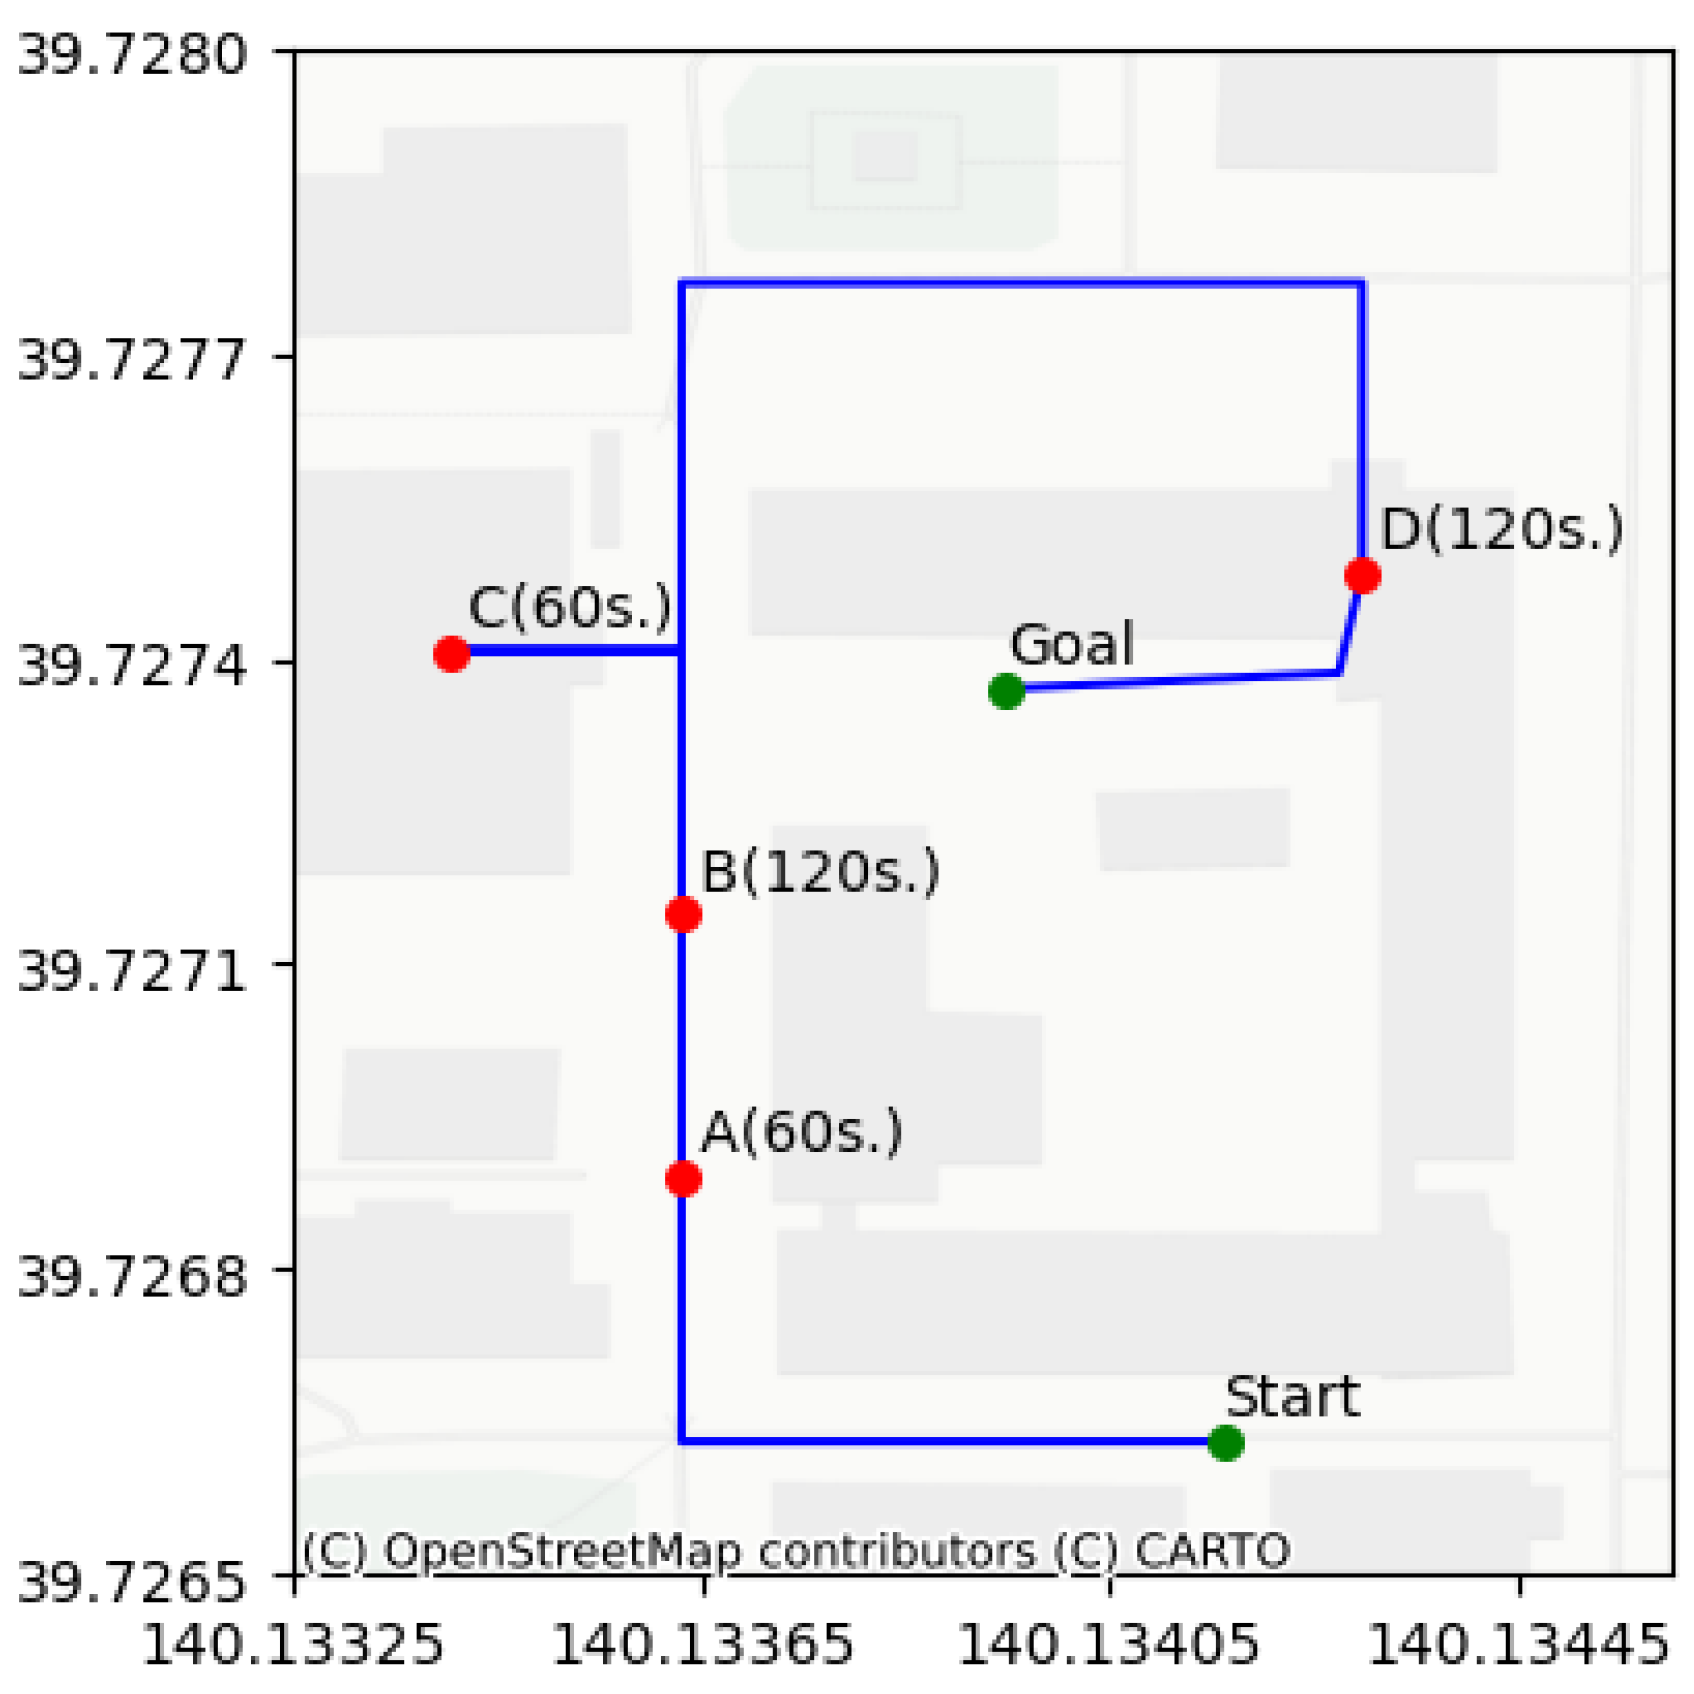
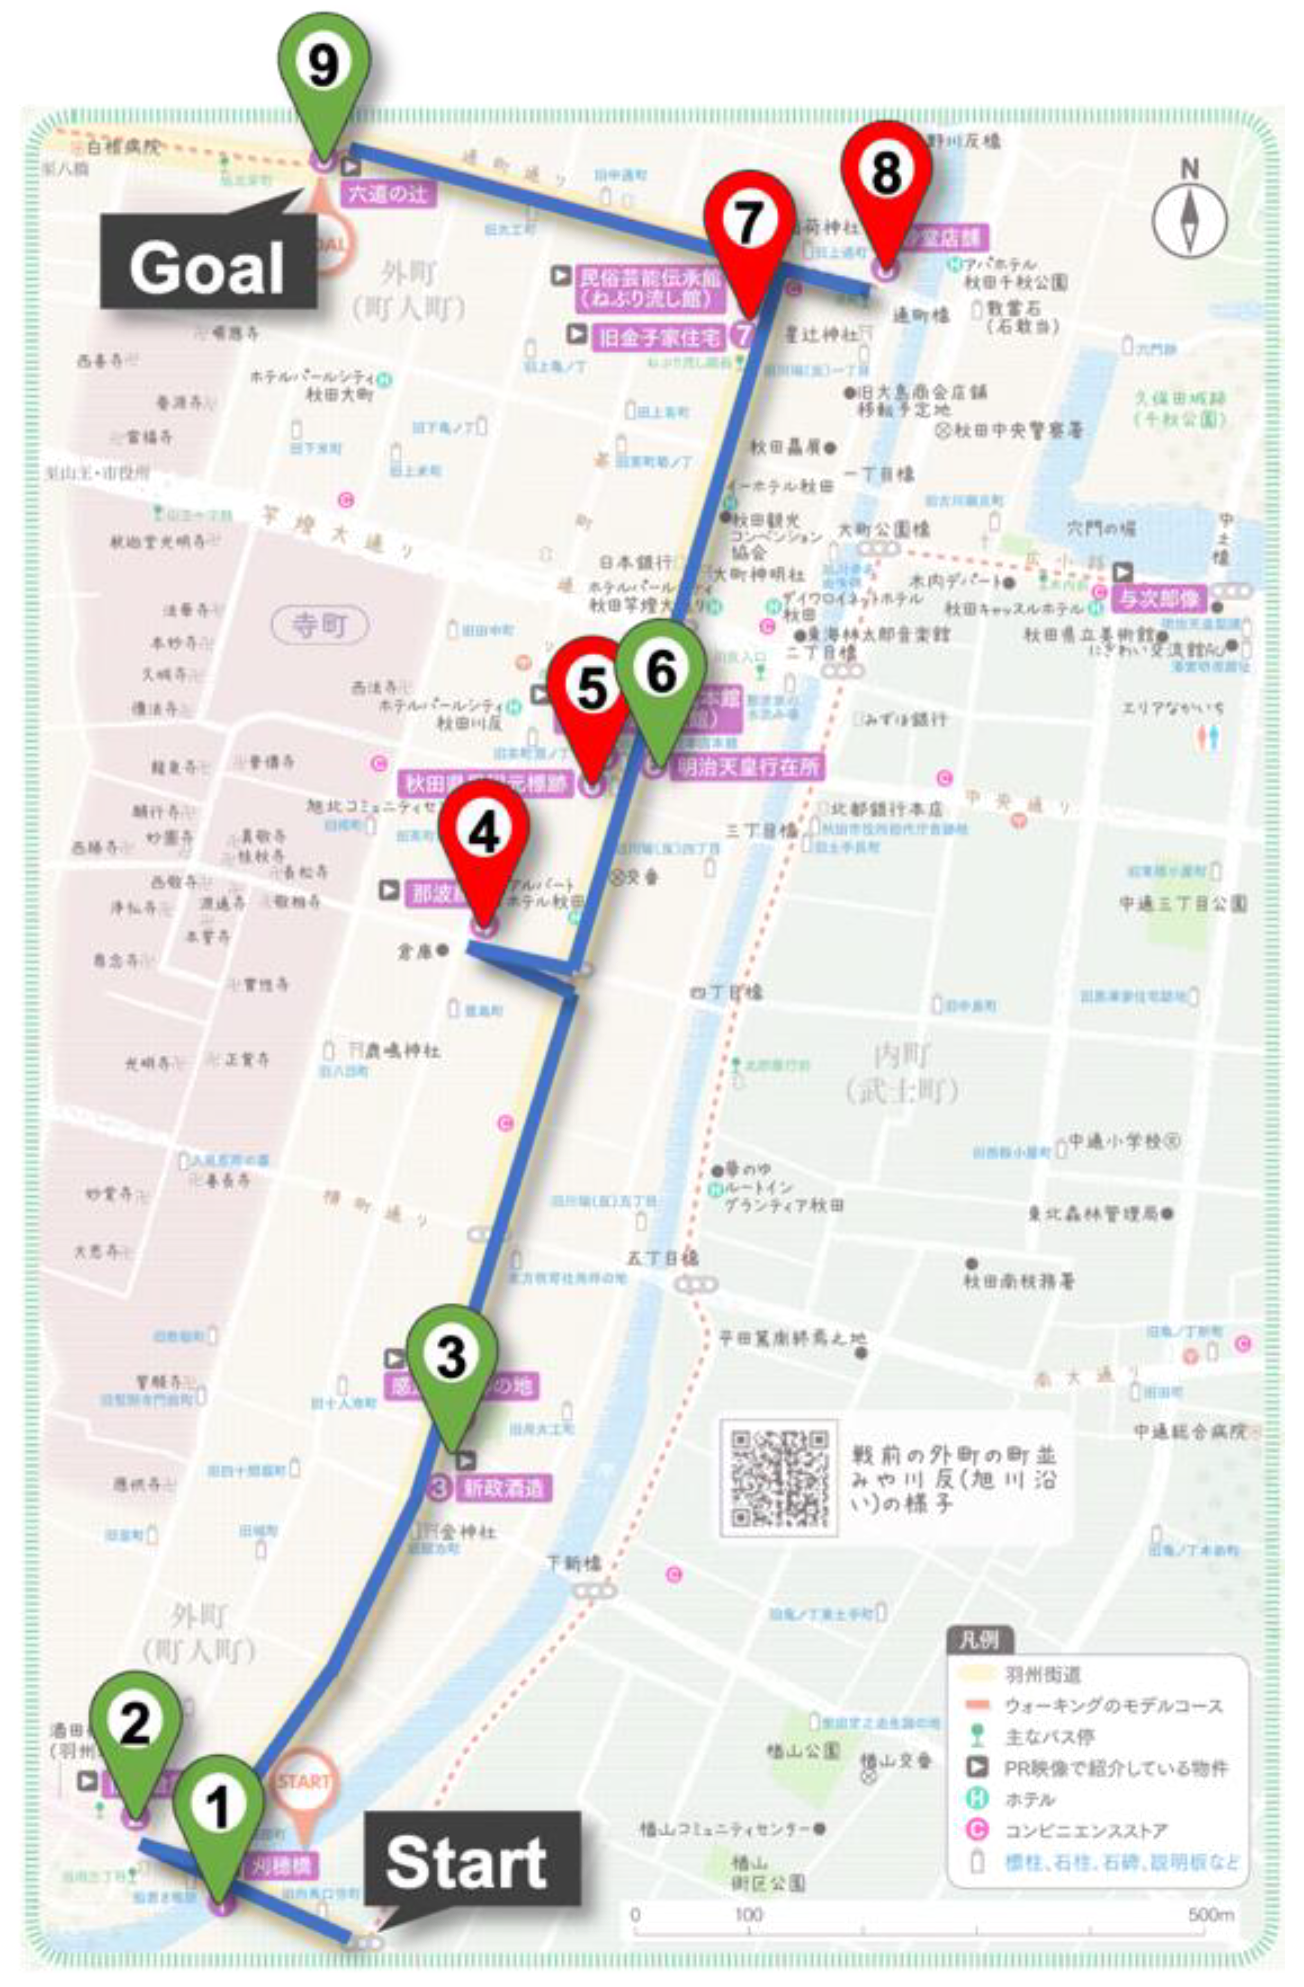
As raw GPS trajectories tend to have low reliability and high complexity due to disturbances such as random noise, heatmaps highlight the wrong areas and overestimate ranges of locally dense areas. Thus, this section measures distance errors between GPS trajectories and actual user walking trajectories—that is, it evaluates how much raw trajectory data, trajectory data only with a line simplification approach, and proposed trajectory data can truly depict the walking routes of tourists. Applying GPS trajectories with the minimum effects of random noise leads to feasible and robust visualizations, especially for hot streets. We used synchronous Euclidean distances (SEDs) as a metric of the error analysis.

4.1. Ground Truth

Generally, existing studies on line simplification algorithms have evaluated distance errors between raw GPS trajectories and simplified trajectories using their proposed algorithms [32,43]. However, we assume in our study that raw GPS trajectory data are originally inaccurate and present the difficulties in our research target. Then, our evaluation prepares ground truth data—that is, a model representing actual user walking. The preparation follows the steps below.
  • Set a walking route and points (Figure 4).
  • Trace at a constant walking speed as far as possible using a metronome and a timer.
  • Record timestamps at points right before/after stops and turns.
  • Link the route model with the timestamps and resample at one-second intervals.
At the same time, a mobile device records latitude, longitude, timestamp, acceleration values, and GPS horizontal accuracy values automatically. We prepared three kinds of target data: (1) raw trajectory data T r a w , (2) trajectory data simplified only using Douglas–Peucker algorithms T D P , and (3) the semi-ready trajectory data through the proposed framework T S R .

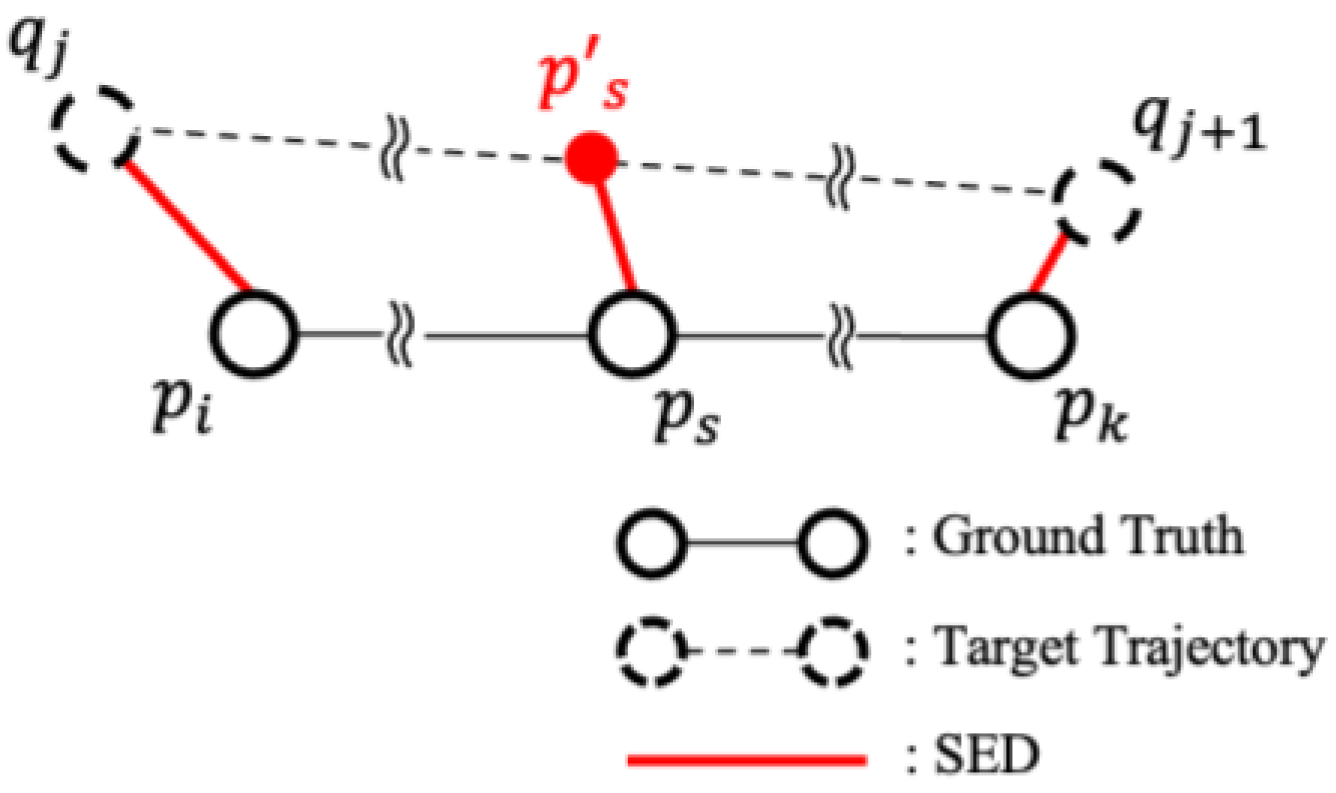
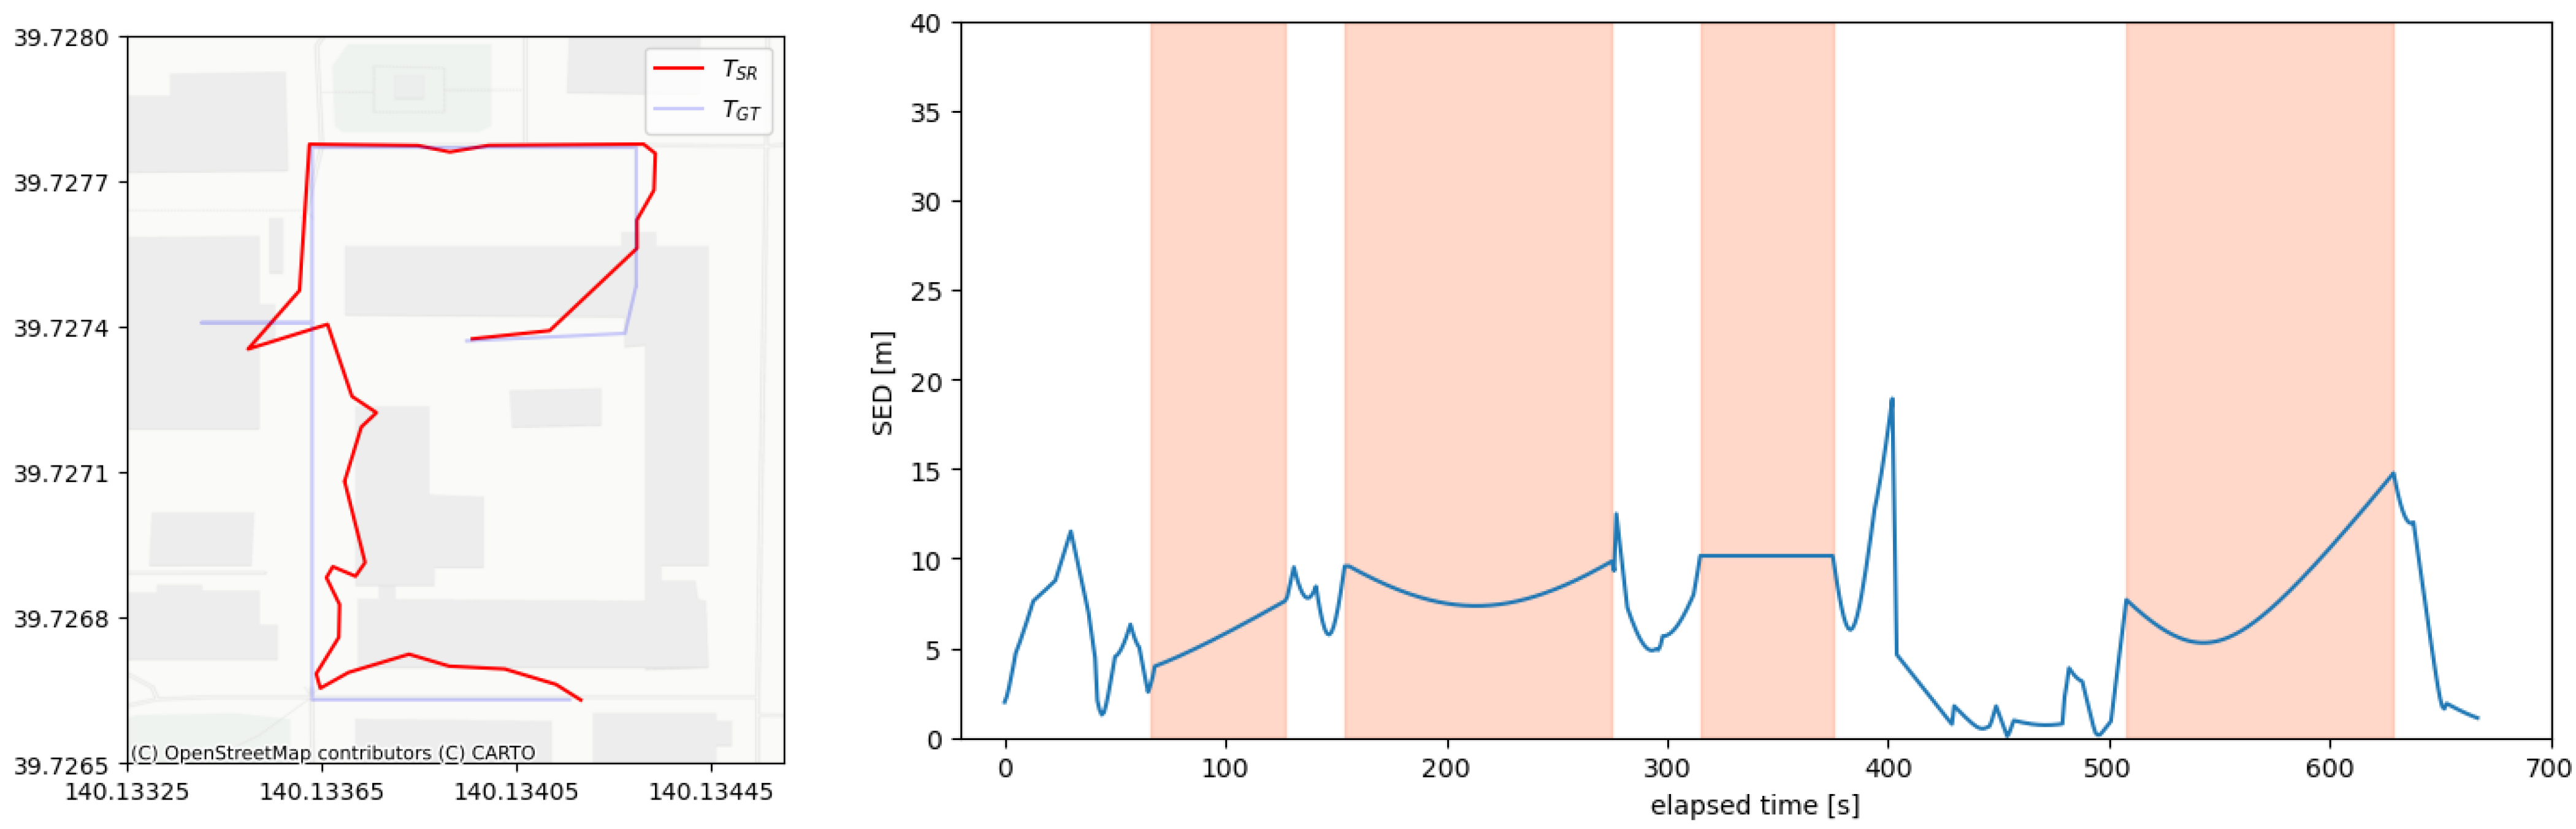
4.2. Evaluation Metrics

Synchronous Euclidean distance (SED) was employed to quantify the distance errors between T G T and each target trajectory ( T r a w , T D P , and T S R ). The calculation of SED involves two main steps—resampling and distance calculation. First, if the number of points in T 1 = ( p 1 ,   , p n ) exceeds that of T 2 = q 1 , , q m , where n > m , it becomes necessary to perform interpolated synchronization between T 1 and T 2 , and vice versa. Figure 5 illustrates how the trajectory segment S 2 = T 2 q j , q j + 1 1 j < m is synchronized with the timestamps of S 1 = T 1 p i , p k 1 i < k n . In cases where the timestamps of p i and q j as well as p k and q j + 1 are matched, and p k is not next to p i ( k i > 1 ), ( k i + 1 ) , synchronized points ( p s in Figure 5) are added to ensure that the time ratios of p i , , p k and q j , , q j + 1 are maintained. After the resampling process, the distances between points with matching timestamps are summed, yielding the total SED.

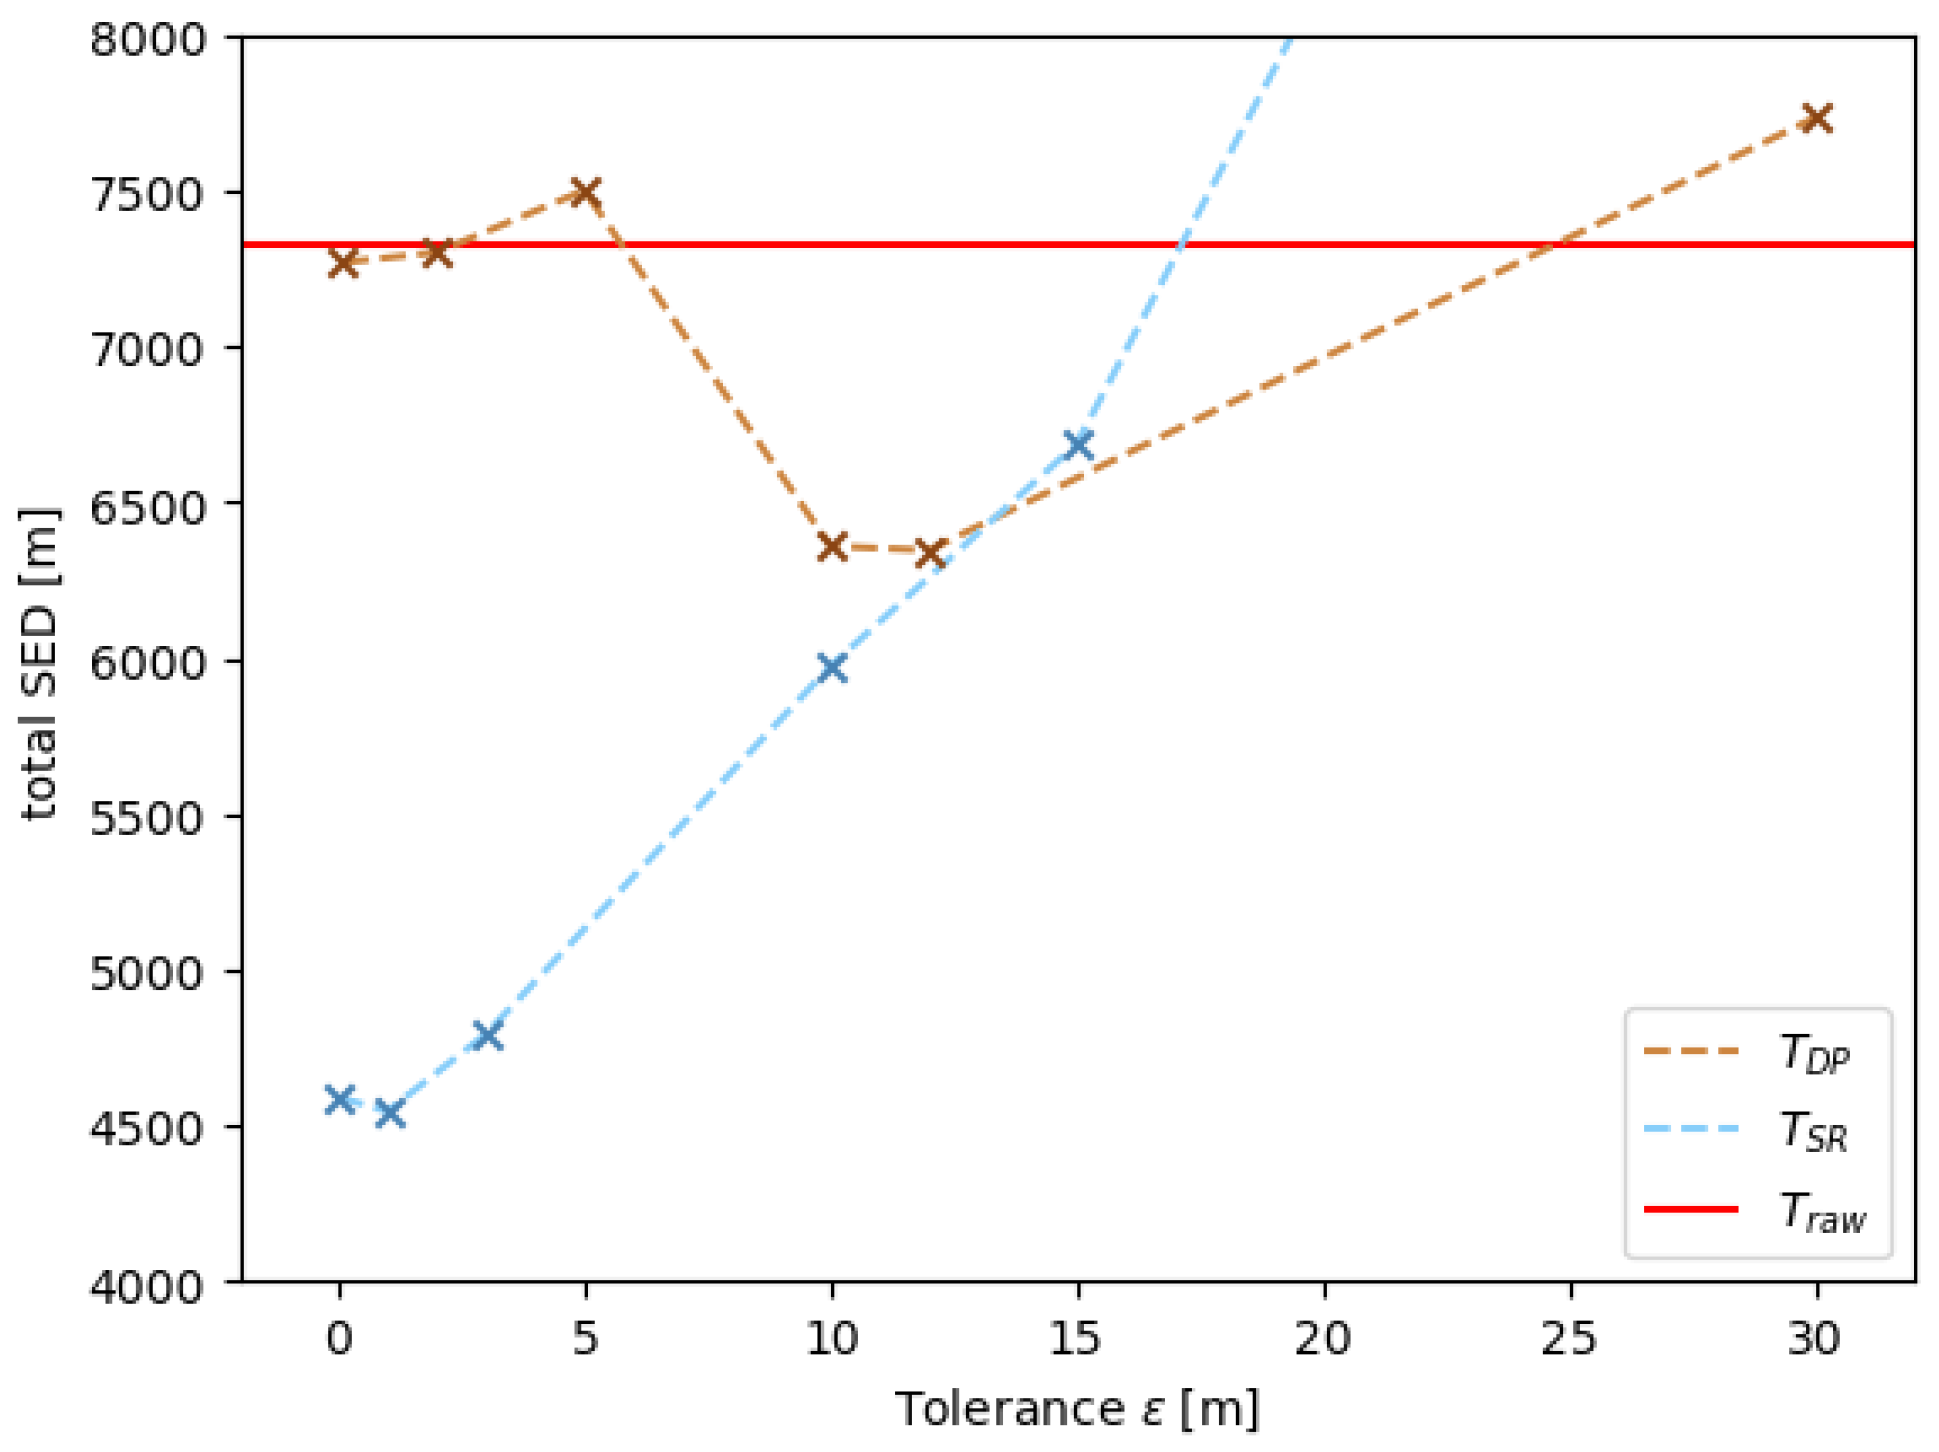
4.3. Results and Discussion

First, we walked along the preset route and recorded the timestamps of the ground truth and raw GPS trajectory data. Simplified trajectory data only with the Douglas–Peucker algorithm (ε = 0.1, 2.0, 5.0, 10.0, 12.0, 30.0 [m]) and the semi-ready trajectory data (ε = 0.0, 1.0, 3.0, 10.0, 15.0, 50.0 [m]) were generated from the raw data. In the two algorithms, ε is a parameter that represents the maximum tolerant distance between the original curve and the simplified one.
Figure 6 shows the total SED of each target trajectory dataset. Compared with the actual user walking route (ground truth data), raw GPS trajectories T r a w clearly contain complicated errors. As the total SED of T D P can be lower than T r a w , the line simplification algorithms have the potential to have their data size reduced by compression and also be denoised. Focusing on the smallest SED of each type of trajectory data (ε = 12.0 m for T D P and ε = 1.0 m for T S R ), it was concluded that T S R can describe the actual trajectory more accurately than T r a w and T D P . Moreover, the time series changes in SED and trajectory shape of T D P and T S R illustrate that staying indoors significantly increases SED (Figure 7 and Figure 8). That is because GPS accuracy decreases due to obstacles, such as walls and ceilings. Data processing that attempts to simplify trajectory shapes based on the extraction of specific contexts, such as user actions and surrounding environments, seems effective in mitigating such situation-dependent problems (Figure 9).
It should be noted that the larger tolerance parameter ε can generally oversimplify and lose the selected path information in the original skeleton (refer to Section 3.2.4). In the results of this experiment, the difficulty was not sufficiently visible from the measurements of T D P , partly because the walker did not take winding roads and curves frequently. The fact that the proposed method decreased the SED of the raw trajectory T r a w the most with a smaller ε implies that our framework has the ability to mitigate the unreliability of GPS data without losing trajectory shapes, even if the city has more complicated footpaths.

5. Demonstration—Example of Akita City’s Walking Tourism

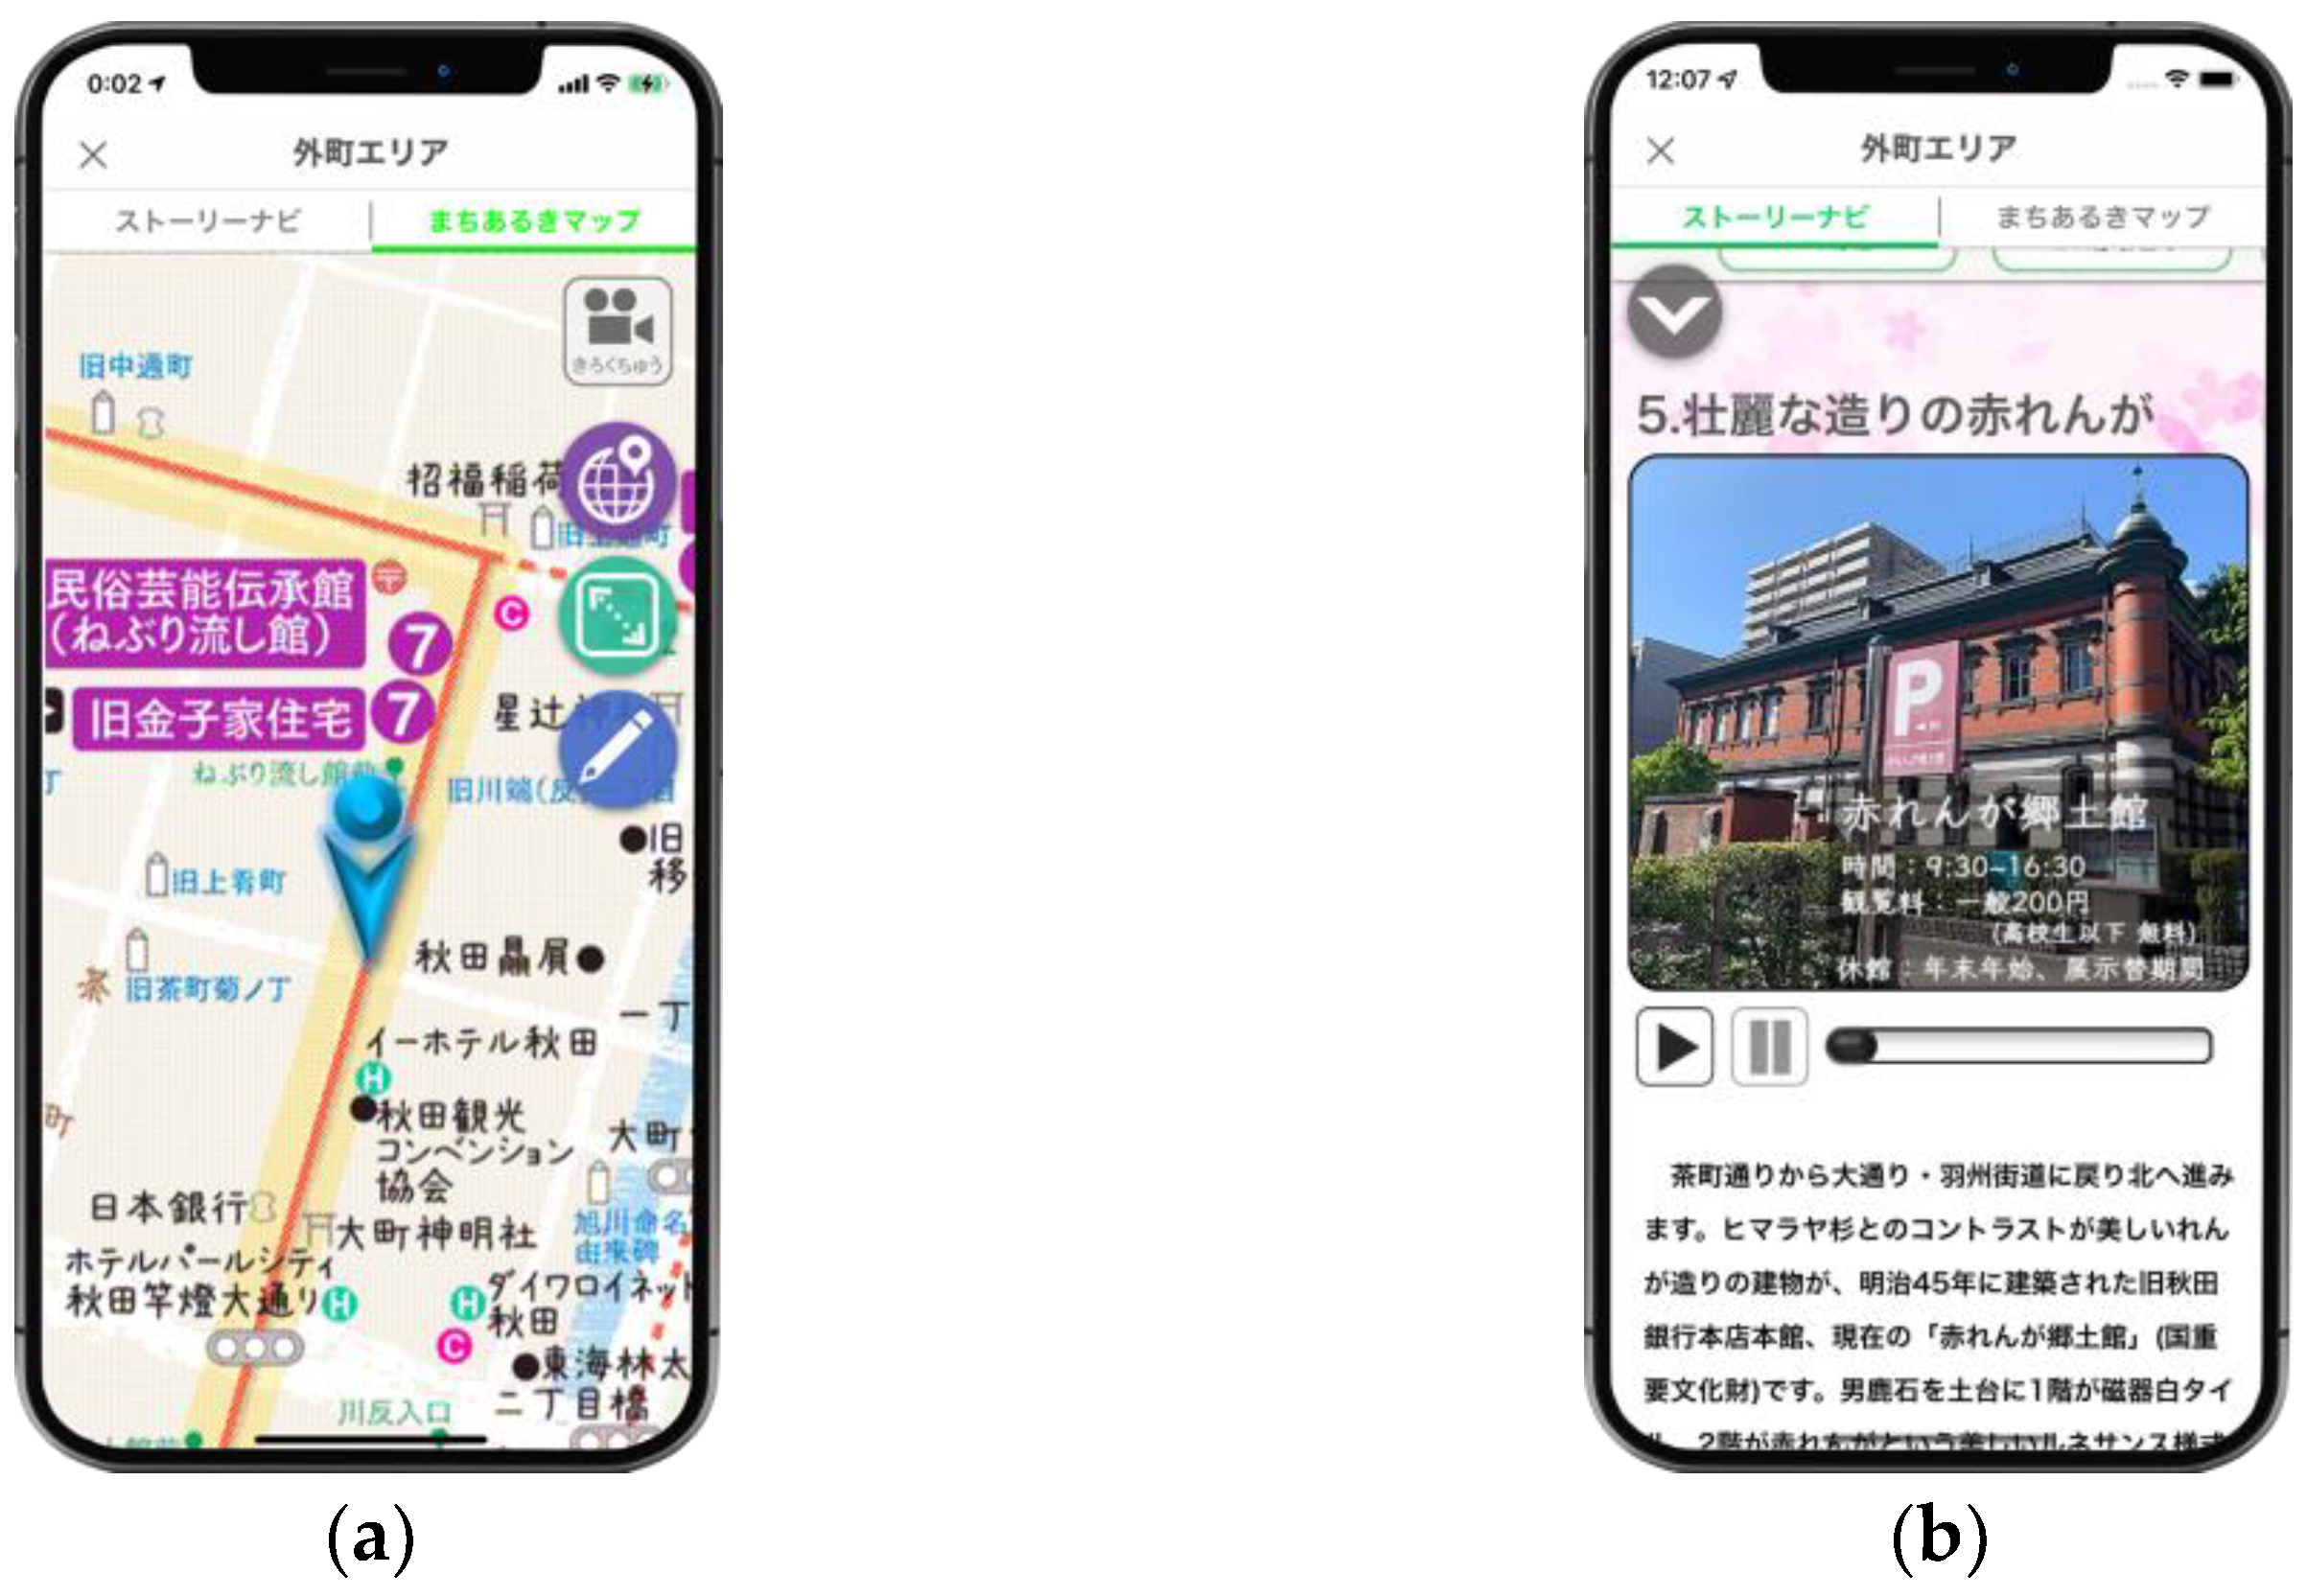
5.1. Application of the Framework for Local Tourism

In this section, we apply the heatmapping framework to actual tourism in Akita City, Japan, and construct a dataset of tourist tracking data to demonstrate the feasibility of the proposed feedback system. Geomedia, such as the illustrated maps and photos that we used for the LBS module (refer to Figure 3), were imported from an officially published guidebook of Akita City for Japanese tourists. As shown in Figure 10, it introduces walking routes which are based on Akita’s historically significant paths and points of cultural interest such as heritage sites and facilities along the routes. During the walking tour, users can access two main location-based services: positioning the current location on the illustrated maps (Figure 11a) and location-based push services that automatically display geomedia on the screen when the user gets close to the registered spots (Figure 11b).
The mobile application also has functions that generate semi-ready trajectory data from users’ walks, as described in Section 3. The sampling rate must be large enough to prevent a significant loss of correspondence between the trajectory and the base map. The LBS module and the semi-ready data construction module were developed into an application for Apple iOS devices.

5.2. Dataset Derived from Actual Tourist Experiences

We asked 21 subjects to explore Akita City while utilizing the application detailed in Section 5.1, and the demonstration in this paper was performed. The participants were granted the freedom to select their walking routes within the area illustrated in Figure 10. Throughout their excursions, mobile sensor data required to generate the semi-ready data (refer to Section 2) were collected at 15-second intervals. It is crucial to sample them frequently, ideally at intervals of less than a minute, to capture detailed movements. Furthermore, this study employed Apple Inc.’s iPhone 11, a prevalent smartphone model, which sufficiently supports the implementation of our proposal. We utilized the kCLLocationAccuracyBest setting, an iPhone sensor API configuration that dictates the precision level of GPS data. This setting allows us to obtain location reference points, predominantly with an error margin of approximately 4–7 m outdoors and approximately 10–40 m indoors (Figure 12). Finally, the study resulted in a total of 5577 accumulated location reference points, representing 21 unique trajectories.

5.3. Demonstration

Figure 13 shows a hot street map using the semi-ready trajectory data. It seems that the framework did not completely rearrange location points, causing locally dense areas not to disappear in each trajectory. However, this is not critical for a hot street visualization compared to that of the raw trajectory data; thus, the presence of polyline-level features was successfully visualized on the heatmap. Figure 14 and Figure 15 showcase the UGC-oriented hot spot heatmap and the indoor-oriented hot spot heatmap, respectively. Generally, a place at which a user stays for a longer period tends to be visualized as a hot spot with raw trajectory data. There are situations in which tourists may be forced to stay at a given place for a longer period, regardless of their interests, depending on the scale and character of each destination. This is why heatmapping prevents us from comparing hot spots quantitatively—for example, by the number of visitors. In the proposed method, indoor staying is treated as single location point data with an indoor tag, regardless of the period of stay, so that the target data can be analyzed in terms of the number of accesses.
Finally, examples of insights into the tourists’ behavior that can be obtained from the heatmaps in the experiments are described as follows (regarding the spot numbers, refer to Figure 10):
  • The next route selections appear to be dispersed at spots 2 and 4 in Figure 13. Thus, some tourists may avoid taking a street that they have already walked through once during their tour.
  • Few tourists stayed at spot 8 in Figure 15. Tourists may have felt tired of taking detours to get there and prioritized reaching the goal because spot 8 is in the latter half of the tour.
  • A few people walked through streets that deviated from the recommended walking routes on the middle left in Figure 13. They may have had interests in shrines and temples that the current guidebook does not cover.
  • Since the experiment was conducted in the summer, it is apparent in Figure 15 that people stopped at convenience stores to buy cold beverages. This can contribute to reports on the extent to which walking tourism has economic effects, not only for the recommended facilities but also for surrounding stores and restaurants.
  • As shown in Figure 14, there seem to be more places and knowledge to share with tourists than the tourism organizers expected in Akita City.

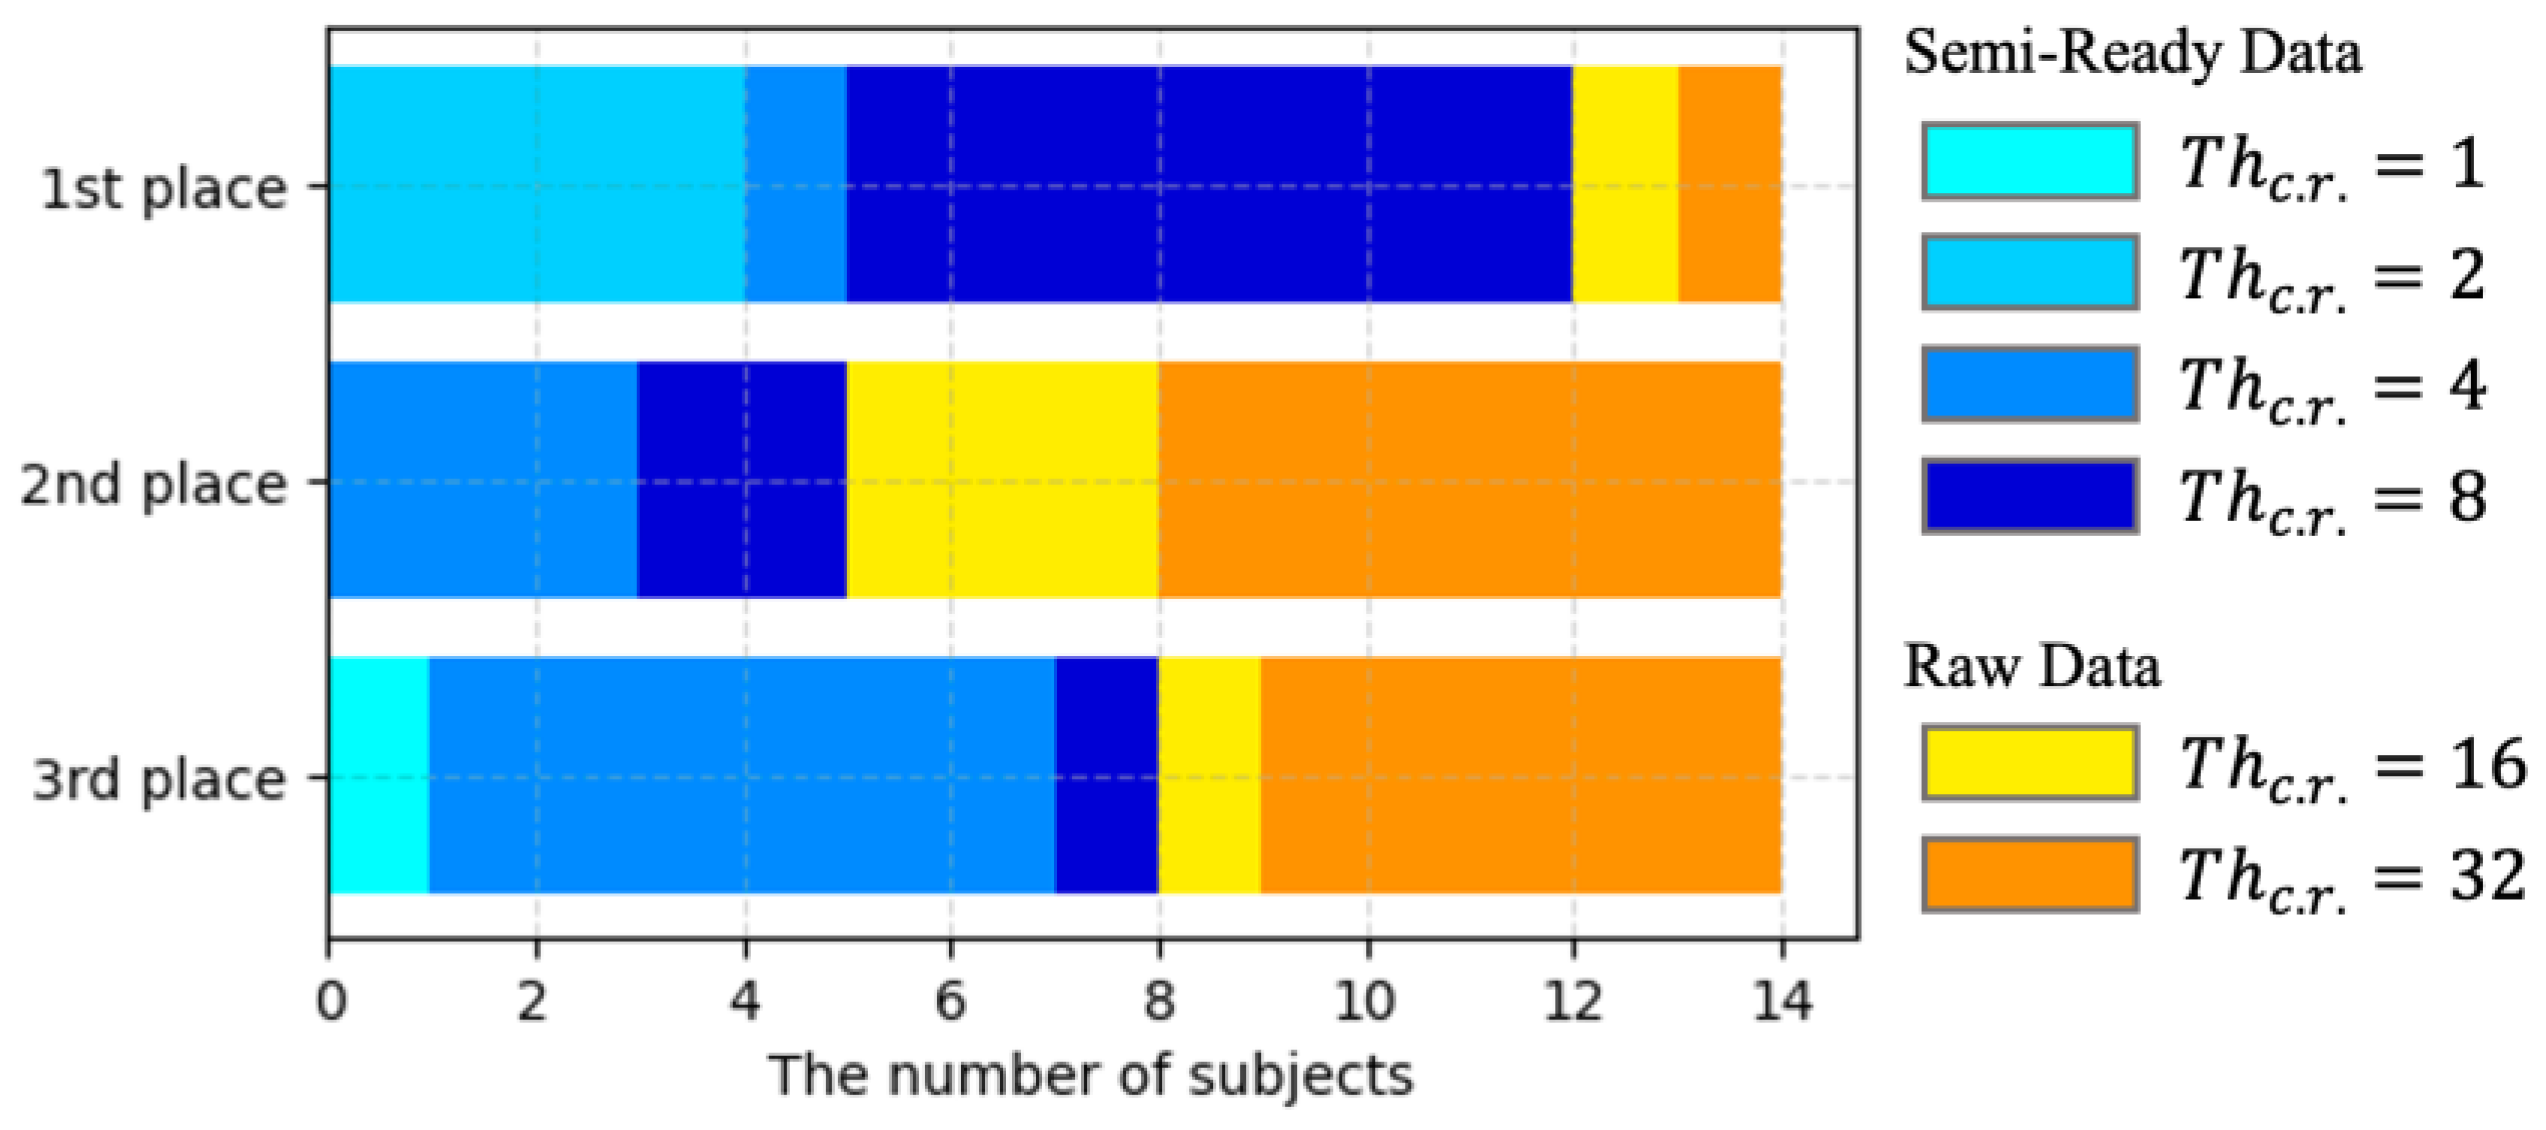
5.4. User Experiment for the Design of a Suitable Heatmap Generator

This section presents a user experiment conducted with the dataset to identify the most effective method, i.e., a data type and a T h c . r . parameter, for a model-less visualization that enables inference of hot streets. The experiment involved the generation of heatmaps from raw data and semi-ready data using different values for T h c . r . , a parameter constraining the maximum value of the heatmap’s gradation range. We generated eight heatmaps with T h c . r . = 4 ,   8 ,   16 ,   32 from raw data and T h c . r . = 1 ,   2 ,   4 ,   8 from semi-ready data, as shown in Figure 16. Situating the analysis of route selection of walking tourists, 14 subjects were asked to rank the heatmaps in order of suitability—that is, which is better to visually understand and compare the traffic volume on each road.
The stacked bar chart in Figure 17 illustrates the selection distribution of heatmaps ranked as the top three. The heatmaps generated with T h c . r . = 16 ,   32 from raw data, as well as T h c . r . = 2 ,   4 ,   8 from semi-ready data, were frequently chosen by subjects. Heatmaps based on the semi-ready data were predominantly favored for the top ranking. However, a subset of subjects selected heatmaps generated from raw data with a higher T h c . r . value. The experimental results highlight the conflicting requirements of traffic volume analysts: (1) the focus on differences in traffic volume on main routes, and (2) clearer visualization of sub-routes. T h c . r . plays an essential role in creating heatmaps at different levels. Specifically, setting a higher T h c . r . makes the gradient of sub-routes, areas with low estimated density values, clearly visible. However, this causes the estimated density values of the main route to easily exceed the maximum value, rendering the differences less visible. If the focus is on differences in traffic volume on the main route, a lower value should be set for T h c . r . . The degree of importance of these two demands varied from subject to subject, leading to differences in the chosen visualization method. A visualization system accommodating both demands would cater to a wider range of analysts and offer diverse insights into pedestrian patterns. However, a critical problem arises when creating heatmaps from raw data, particularly with a low T h c . r . value. As mentioned in Section 2.3, this process does not allow for the identification of clusters that preserve the shape of the road segment, making it unsuitable for model-less traffic volume analysis. In this experiment, heatmaps from raw data with T h c . r . less than 16 were never among the top three selections. According to the subjects, the visualization most clearly representing differences in traffic volume on the main route was generated with T h c . r . = 2 from semi-ready data, confirming the aforementioned problem. Therefore, the ideal solution for analysts would be a heatmap generator that employs the proposed method and can adjust T h c . r . values between 2 and 8 as required.

6. Conclusions

This paper has proposed a model-less visualization framework for the inference of hot spots and streets. Considering that locally dense areas in high-frequency GPS trajectories can appear due to various factors, regardless of the degrees of user interest, hot spots simply visualized by raw GPS data are too rough to clearly identify the amount of access to each spot in a city. Additionally, it is difficult to visualize and compare polyline-shaped clusters describing road segments on a density map for the same reason, which makes it impossible to infer tourists’ preferred streets. Thematic heatmaps, the output of our analytic system, concisely describe tourists’ behaviors, such as staying indoors and generating user-generated content (UGC), instead of simply using abstract expressions such as “hot spot”. According to our distance error analysis and demonstration, compared to raw trajectories and trajectories simplified on the basis of their geometry, our semi-ready data could draw actual tourists’ trajectories and yield useful insights for the improvement of tour route recommendations. In future work, investigations of the framework’s scalability using larger datasets are required to implement a promising feedback solution for long-term tourism businesses aiming at the sustainable development of local economies and cultures with mobile data.

Author Contributions

Conceptualization, Iori Sasaki, Masatoshi Arikawa, Min Lu, and Ryo Sato; data curation, Iori Sasaki; formal analysis, Iori Sasaki; funding acquisition, Iori Sasaki, Masatoshi Arikawa, and Min Lu; investigation, Iori Sasaki; methodology, Iori Sasaki and Masatoshi Arikawa; project administration, Iori Sasaki, Masatoshi Arikawa, and Ryo Sato; resources, Iori Sasaki; software, Iori Sasaki; supervision, Masatoshi Arikawa; validation, Iori Sasaki; visualization, Iori Sasaki; writing—original draft, Iori Sasaki; writing—review and editing, Iori Sasaki, Masatoshi Arikawa, Min Lu, and Ryo Sato. All authors have read and agreed to the published version of the manuscript.

Funding

This research was supported partly by JSPS KAKENHI Grant Numbers: JP22KJ0325, JP22H00764, JP19H04120, JP23K11362.

Data Availability Statement

The data analyzed in this study are available on request from the corresponding author. The data are not publicly available due to privacy restrictions and consent provided by participants only allowing for the release of analyzed results.

Acknowledgments

The authors would like to thank Akita City for providing the fascinating illustrated maps and contents of their walking tours. We are also grateful to the subjects who participated in the user experiments.

Conflicts of Interest

The authors declare no conflict of interest.

References

  1. World Tourism Organization. Walking Tourism—Promoting Regional Development; World Tourism Organization: Madrid, Spain, 2019. [Google Scholar]
  2. Benyon, D.; Quigley, A.; O’Keefe, B.; Riva, G. Presence and digital tourism. AI Soc. 2014, 29, 521–529. [Google Scholar] [CrossRef]
  3. Huang, H.; Gartner, G.; Krisp, J.M.; Raubal, M.; Weghe, N.V. Location based services: Ongoing evolution and research agenda. J. Locat. Based Serv. 2018, 12, 63–93. [Google Scholar] [CrossRef] [Green Version]
  4. Lu, M.; Arikawa, M. Map-based storytelling tool for real-world walking tour. In Progress in Location-Based Services; Spring: Berlin/Heidelberg, Germany, 2013; pp. 435–451. [Google Scholar]
  5. Li, J.; Xu, L.; Tang, L.; Wang, S.; Li, L. Big data in tourism research: A literature review. Tour. Manag. 2018, 68, 301–323. [Google Scholar] [CrossRef]
  6. Longo, A.; Zappatore, M.; Bochicchio, M.; Navathe, S.B. Crowd-sourced data collection for urban monitoring via mobile sensors. ACM Trans. Internet Technol. 2018, 18, 1–21. [Google Scholar] [CrossRef]
  7. Zheng, W.; Li, M.; Lin, Z.; Zhang, Y. Leveraging tourist trajectory data for effective destination planning and management: A new heuristic approach. Tour. Manag. 2022, 89, 104437. [Google Scholar] [CrossRef]
  8. Zheng, W.; Liao, Z.; Lin, Z. Navigating through the complex transport system: A heuristic approach for city tourism recommendation. Tour. Manag. 2020, 81, 104162. [Google Scholar] [CrossRef]
  9. Borras, J.; Moreno, A.; Valls, A. Intelligent tourism recommender systems: A survey. Expert Syst. Appl. 2014, 41, 7370–7389. [Google Scholar] [CrossRef]
  10. Lim, K.H.; Chan, J.; Karunasekera, S.; Leckie, C. Tour recommendation and trip planning using location-based social media: A survey. Knowl. Inf. Syst. 2019, 60, 1247–1275. [Google Scholar] [CrossRef]
  11. Cai, L.; Jiang, F.; Zhou, W.; Li, K. Design and application of an attractiveness index for urban hotspots based on GPS trajectory data. IEEE Access 2018, 6, 55976–55985. [Google Scholar] [CrossRef]
  12. Boumezoued, S.; Bada, Y.; Bougdah, H. Pedestrian itinerary choice: Between multi-sensory, affective and syntactic aspects of the street pattern in the historic quarter of Bejaia, Algeria. Int. Rev. Spat. Plan. Sustain. Dev. 2020, 8, 91–108. [Google Scholar] [CrossRef]
  13. Brilhante, I.; Macedo, J.A.; Nardini, F.M.; Perego, R.; Renso, C. Planning sightseeing tours using crowdsensed trajectories. SIGSPATIAL Spec. 2015, 7, 59–66. [Google Scholar] [CrossRef]
  14. Mukhina, K.D.; Visheratin, A.A.; Nasonov, D. Building city-scale walking itineraries using large geospatial datasets. In Proceedings of the 23rd Conference of Open Innovations Association FRUCT, Bologna, Italy, 13–16 November 2018; Volume 35, pp. 261–267. [Google Scholar]
  15. Hsueh, Y.L.; Huang, H.M. Personalized itinerary recommendation with time constraints using GPS datasets. Knowl. Inf. Syst. 2019, 60, 523–544. [Google Scholar] [CrossRef]
  16. Zheng, W.; Ji, H.; Lin, C.; Wang, W.; Yu, B. Using a heuristic approach to design personalized urban tourism itineraries with hotel selection. Tour. Manag. 2020, 76, 103956. [Google Scholar] [CrossRef]
  17. Jia, R.; Khadka, A.; Kim, I. Traffic crash analysis with point-of-interest spatial clustering. Accid. Anal. Prev. 2018, 121, 223–230. [Google Scholar] [CrossRef]
  18. Liu, B.; Shi, Y.; Li, D.J.; Wang, Y.D.; Fernandez, G. An economic development evaluation based on the OpenStreetMap road network density: The case study of 85 cities in China. ISPRS Int. J. Geo-Inf. 2020, 9, 517. [Google Scholar] [CrossRef]
  19. Alvares, L.O.; Bogorny, V.; Kuijpers, B.; Macedo, J.A.F.; Moelans, B.; Vaisman, A. A model for enriching trajectories with semantic geographical information. In Proceedings of the 15th Annual ACM International Symposium on Advances in Geographic Information Systems, Seattle, WA, USA, 7–9 November 2007; pp. 1–8. [Google Scholar]
  20. Bogorny, V.; Avancini, H.; Paula, B.C.; Kuplich, C.R.; Alvares, L.O. Weka-STPM: A software architecture and prototype for semantic trajectory data mining and visualization. Trans. GIS 2011, 15, 227–248. [Google Scholar] [CrossRef]
  21. Xia, Z.; Li, H.; Chen, Y.; Liao, W. Identify and delimitate urban hotspot areas using a network-based spatiotemporal field clustering method. ISPRS Int. J. Geo-Inf. 2019, 8, 344. [Google Scholar] [CrossRef] [Green Version]
  22. Quddus, M.A.; Ochieng, W.Y.; Noland, R.B. Current map-matching algorithms for transport applications: State-of-the art and future research directions. Transp. Res. C 2007, 15, 312–328. [Google Scholar] [CrossRef] [Green Version]
  23. Zheng, Y. Trajectory data mining: An overview. ACM Trans. Intell. Syst. Technol. 2015, 6, 29. [Google Scholar] [CrossRef]
  24. Chao, P.; Xu, Y.; Hua, W.; Zhou, X. A survey on map-matching algorithms. In Proceedings of the Databases Theory and Applications: 31st Australasian Database Conference, ADC 2020, Melbourne, VIC, Australia, 3–7 February 2020; Springer: Berlin/Heidelberg, Germanr; pp. 121–133. [Google Scholar]
  25. Li, J.; Lyu, L.; Shi, J.; Zhao, J.; Xu, J.; Gao, J.; He, R.; Sun, Z. Generating community road network from GPS trajectories via style transfer. In Proceedings of the 30th International Conference on Advances in Geographic Information Systems, Seattle, WA, USA, 1–4 November 2022; pp. 1–4. [Google Scholar]
  26. Alsahfi, T.; Almotairi, M.; Elmasri, R.; Alshemaimri, B. Road map generation and feature extraction from GPS trajectories data. In Proceedings of the 12th ACM SIGSPATIAL International Workshop on Computational Transportation Science, Chicago, IL, USA, 5–8 November 2019; pp. 1–10. [Google Scholar]
  27. Li, Q.; Zheng, Y.; Xie, X.; Chen, Y.; Liu, W.; Ma, W. Mining user similarity based on location history. In Proceedings of the 16th ACM SIGSPATIAL Conference on Advance in Geographical Information Systems, Irvine, CA, USA, 5–7 November 2008; pp. 1–10. [Google Scholar]
  28. Wang, X.; Zhang, Z.; Luo, Y. Clustering methods based on stay points and grid density for hotspot detection. ISPRS Int. J. Geo-Inf. 2022, 11, 190. [Google Scholar] [CrossRef]
  29. Ester, M.; Kriegel, H.; Sander, J.; Xu, X. A density-based algorithm for discovering clusters in large spatial databases with noise. In Proceedings of the Second International Conference on Knowledge Discovery and Data Mining, Portland, OR, USA, 2–4 August 1996; pp. 226–231. [Google Scholar]
  30. Hamid, R.A.; Croock, M.S. A developed GPS trajectories data management system for predicting tourists’ POI. TELKOMNIKA 2020, 18, 124–132. [Google Scholar] [CrossRef]
  31. Graaff, V.; By, R.A.; Keulen, M. Automated semantic trajectory annotation with indoor point-of-interest visits in urban areas. In Proceedings of the 31st Annual ACM Symposium on Applied Computing, Pisa, Italy, 4–8 April 2016; pp. 552–559. [Google Scholar]
  32. Parent, C.; Spaccapietra, S.; Renso, C.; Andrienko, G.; Andrienko, N.; Bogorny, V.; Damiani, M.L.; Divanis, A.G.; Macedo, J.; Pelekis, N.; et al. Semantic trajectories modeling and analysis. ACM Comput. Surv. 2013, 45, 1–32. [Google Scholar] [CrossRef] [Green Version]
  33. Sasaki, I.; Arikawa, M.; Lu, M.; Sato, R. Thematic geo-density heatmapping for walking tourism analytics using semi-ready GPS trajectories. In Proceedings of the 2022 IEEE International Conference on Big Data, Osaka, Japan, 17–20 December 2022; pp. 4944–4951. [Google Scholar]
  34. Zhang, S.; Zhang, W.; Wang, Y.; Zhao, X.; Song, P.; Tian, G.; Mayer, A.L. Comparing human activity density and green space supply using the Baidu Heat Map in Zhengzhou, China. Sustainability 2020, 12, 7075. [Google Scholar] [CrossRef]
  35. Yu, C.; He, Z.C. Analysing the spatial-temporal characteristics of bus travel demand using the heat map. J. Transp. Geogr. 2017, 58, 247–255. [Google Scholar] [CrossRef]
  36. Yuan, Y.; Qiang, Y.; Asad, K.B.; Chow, T.E. Point pattern analysis. In The Geographic Information Science & Technology Body of Knowledge (1st Quarter 2020 Edition); University Consortium for Geographic Information Science: Washington, DC, USA, 2020; Available online: https://gistbok.ucgis.org/bok-topics/point-patternanalysis (accessed on 28 April 2023).
  37. Bernabeu-Bautista, Á.; Serrano-Estrada, L.; Perez-Sanchez, V.R.; Martí, P. The geography of social media data in urban areas: Representativeness and complementarity. ISPRS Int. J. Geo-Inf. 2021, 10, 747. [Google Scholar] [CrossRef]
  38. Kim, J.; Kang, Y. Automatic classification of photos by tourist attractions using deep learning model and image feature vector clustering. ISPRS Int. J. Geo-Inf. 2022, 11, 245. [Google Scholar] [CrossRef]
  39. Claridades, A.R.C.; Lee, J. Defining a model for integrating indoor and outdoor network data to support seamless navigation applications. ISPRS Int. J. Geo-Inf. 2021, 10, 565. [Google Scholar] [CrossRef]
  40. Sasaki, I.; Arikawa, M.; Takahashi, A. Articulated trajectory mapping for reviewing walking tours. ISPRS Int. J. Geo-Inf. 2020, 9, 610. [Google Scholar] [CrossRef]
  41. Douglas, H.D.; Peucker, T.K. Algorithms for the reduction of the number of points required to represent a digitized line or its caricature. Cartogr. Int. J. Geogr. Inf. Geovisualization 1973, 10, 112–122. [Google Scholar]
  42. Zhang, D.; Ding, M.; Yang, D.; Liu, Y.; Fan, J.; Shen, H.T. Trajectory simplification: An experimental study and quality analysis. In Proceedings of the 44th International Conference on Very Large Data Bases, Rio de Janeiro, Brazil, 27–31 August 2018; Volume 11, pp. 934–946. [Google Scholar]
  43. Steiniger, S.; Hunter, A.J.S. A scaled line-based kernel density estimator for the retrieval of utilization distributions and home ranges from GPS movement tracks. Ecol. Inform. 2013, 13, 1–8. [Google Scholar] [CrossRef]
  44. Akita City. Guide book "alameda beyond the time of Ushu-Kaido road tired," 2019. Available online: https://city-akita.j-server.com/LUCAKITA/ns/tl.cgi/https://www.city.akita.lg.jp/kurashi/rekishi-bunka/1018932/1018939.html?SLANG=ja&TLANG=en&XMODE=0&XPARAM=q,&XCHARSET=UTF-8&XPORG=,&XJSID=0 (accessed on 28 May 2023).
Figure 1. Example of a heatmap with high-frequency GPS trajectories. There are too many factors that cause locally dense areas to properly judge their semantic importance. As the research subject area is Akita City in Japan, all background maps are in Japanese in this paper.
Ijgi 12 00283 g001
Figure 2. Density maps using raw trajectories based on three values of T h c . r . . These maps are not compatible with hot street visualizations, as the topology of streets is not visible even after adjusting the color range.
Ijgi 12 00283 g002
Figure 3. Structure realizing the feedback system on the basis of current mobile environments for walking tourism businesses. Our proposal for a novel heatmapping framework focuses on two sub-systems: (1) semi-ready data construction on the user side and (2) thematic heatmap generation to visualize hot spots and hot streets on the analyst side.
Ijgi 12 00283 g003
Figure 4. A walking route in the experiments. A walker traced the blue line at a constant speed and stopped at each red point A, B, C, and D for one or two minutes. Gray rectangles depict indoor areas.
Ijgi 12 00283 g004
Figure 5. Diagram of resampling process for calculating synchronous Euclidean distances between the ground truth and a target trajectory. A point p s is added to maintain time ratio.
Ijgi 12 00283 g005
Figure 6. Total SED of the target trajectory data (red line: T r a w ; brown dashed line: T D P ; blue dashed line T S R ). This implies that the proposed method can decrease total SED with a small tolerance parameter.
Ijgi 12 00283 g006
Figure 7. Trajectory shape (left) and time series changes in the SED (right) of T r a w . Orange areas in the graph of time series changes represent the periods when the user is stationary outdoor and indoor, as indicated by the red points in Figure 4 (A, B, C, and D, in order).
Ijgi 12 00283 g007
Figure 8. Trajectory shape (left) and time series changes in the SED (right) of T D P . The tolerance parameter ε is set to 12.0 m. Orange areas in the graph of time series changes represent the periods when the user is stationary outdoor and indoor, as indicated by the red points in Figure 4 (A, B, C, and D, in order).
Ijgi 12 00283 g008
Figure 9. Trajectory shape (left) and time series changes in the SED (right) of T S R . The tolerance parameter ε is set to 1.0 m. Orange areas in the graph of time series changes represent the periods when the user is stationary outdoor and indoor, as indicated by the red points in Figure 4 (A, B, C, and D, in order).
Ijgi 12 00283 g009
Figure 10. Recommended spots with IDs from one to nine and walking routes in the walking guidebook that is available on [44] for Japanese tourists. Red pins are facilities where tourists can stay, and green pins are monuments or viewpoints they can look at.
Ijgi 12 00283 g010
Figure 11. Location-based services: (a) positioning the current location on the illustrated maps which is provided in a Japanese tourist guidebook published by Akita City; (b) location-based push services that automatically display geomedia, such as Japanese guide scripts and pictures, on the screen when the user gets close to the registered spots.
Ijgi 12 00283 g011
Figure 12. Example of the distribution of horizontal GPS accuracy values, obtained by monitoring twelve subjects within the dataset The device used was iPhone 11, manufactured by Apple Inc., based in Cupertino, California, USA. The kCLLocationAccuracyBest setting was applied, which is specified when very high accuracy is required in Core Location framework. The left-side graph represents an outdoor condition, i.e., street between spots 7 and 9 in Figure 10, and the right-side graph represents an indoor condition, i.e., spot 7 in Figure 10.
Ijgi 12 00283 g012
Figure 13. An example of a hot street heatmap. Equalizing the density per area enables visualization of the presence of polyline-shaped features, such as walking routes and streets.
Ijgi 12 00283 g013
Figure 14. An example of a UGC-oriented hot spot heatmap that considers point data drawn only from ugc tags. Dense areas represent attractive photo spots and places that are worth sharing.
Ijgi 12 00283 g014
Figure 15. An example of an indoor-oriented hot spot heatmap that considers point data drawn only from indoor tags. Dense areas represent attractive buildings and facilities visited by many tourists.
Ijgi 12 00283 g015
Figure 16. Heatmaps that were used for a user experiment. The experiment involved the generation of heatmaps from raw data and semi-ready data using different values for T h c . r . .
Ijgi 12 00283 g016
Figure 17. Stacked bar chart of the selection distribution of heatmaps ranked as the top three.
Ijgi 12 00283 g017
Table 1. Related work on estimating pedestrians’ access to city spots and streets.
Hot SpotsHot Streets
Model-Driven
Approach
Regions of interest [19,20]
Road networks [21]
Map matching [22,23]
Model-Less
Approach
Proximity [27]
Clustering [28,29,30]
Others [31]
It does not seem that this area has been discussed enough
Table 2. Target actions of a user, data types used for detecting the action, and how to reflect the actions on a semi-ready trajectory.
TargetData TypeProcessing
Taking a photo and a noteOperation logsExtract the location of generating and add the u g c tag
Staying in an indoor
location
GPS horizontal
accuracy data
Abstract data into a point of staying and add the i n d o o r tag
Remaining stationaryAcceleration dataDiscard them
Rest of the pointsLocation dataSmoothing based on the geometry skeleton
Disclaimer/Publisher’s Note: The statements, opinions and data contained in all publications are solely those of the individual author(s) and contributor(s) and not of MDPI and/or the editor(s). MDPI and/or the editor(s) disclaim responsibility for any injury to people or property resulting from any ideas, methods, instructions or products referred to in the content.

