1. Introduction
Cartography is the art, science, and technology of making maps [
1]. In the second half of 20th century, the emerging widespread distribution of computers and geographic information system (GIS) has revolutionized cartography, making analog maps into digital maps [
2]. Entering the 21st century, we have witnessed several important trends in the map making industry. One trend is web mapping due to various user interaction features and convenience of map sharing. A well-known example is the web map-based dashboard to track worldwide COVID-19 data published by Johns Hopkins University [
3]. Another trend is mobile-based mapping. Representative examples include the map-based smartphone apps for location-based service (LBS), such as Uber for ride-hailing services and DoorDash for food-delivery services. The ubiquity of location-aware technology also encourages the third trend called crowd-mapping, which aggregates crowd-generated inputs such as volunteered geographic information (VGI) to create digital maps [
4]. The technology of making maps has also advanced and been democratized as there are numerous mapping tools for users to choose from. Some tools are favored by users without a background in cartography or programming skills, such as ArcGIS Online, BatchGeo, and Excel Power Map, while advanced options are available for professional users to deal with large geospatial data or to implement complex map customizations, e.g., ArcGIS Pro, kepler.gl, d3.js, and several programming packages in R and Python.
ChatGPT is an artificial intelligence (AI) chatbot built upon OpenAI’s large language models (LLMs), specifically GPT-3.5 and GPT-4. Since being released in November 2022, ChatGPT has been applied in a variety of fields, including creative writing, code generation, translation, course outline designing, engineering design, education, and information retrieval [
5,
6,
7]. Pioneering studies have been conducted to assess GPT’s ability to comprehend geographic contexts. For example, Roberts et al. [
8] evaluated GPT-4′s grasp of factual geographic knowledge (world geography) and its ability to use this knowledge for interpretative reasoning, such as geospatial analysis. Similarly, Mooney et al. [
9] examined the capacity of ChatGPT in the context of a GIS exam based on GIS textbooks and discovered that GPT’s understanding of spatial concepts still has room for improvement. Li and Ning [
6] developed a prototype system using the GPT-4 API to demonstrate what an autonomous GIS looks like and how it works without human intervention.
Several relevant features and capabilities of ChatGPT enable it as a potential powerhouse of producing maps. Being able to write programming codes, ChatGPT can leverage existing visualization packages, e.g., the Python library ‘Matplotlib’, for producing maps as images. Trained by a large database, ChatGPT can search for publicly available data sources for mapping. Being an AI chatbot, ChatGPT can comprehend users’ map requests through conversation-based interactions. Unlike the existing mapping tools mentioned above, mapping with ChatGPT can potentially offer unique advantages, given its spatial thinking capability and conversation-based user interactions.
In this study, we explore making maps with ChatGPT based on GPT-4. Strictly speaking, we do not solely rely on ChatGPT for the entire procedure of map making, given that ChatGPT can only read and write texts. However, ChatGPT can be the “brain” while executable programs can be the digital “hands” [
6]. Our approach is to only interact with ChatGPT and ask it to use external tools to read geospatial data and plot final maps. Two sets of experiments were conducted. We first tested making thematic maps by specifying the map style and data source in prompts to ChatGPT. We also tested creating mental maps (or cognitive maps) by describing the geographic space in prompts, without limiting the map style or providing data source. Through a series of experiments, we evaluated the difficulty of each step as well as the quality of the map products. Four major advantages and limitations of using ChatGPT for mapping are summarized and thoroughly discussed. We conclude with the impacts of ChatGPT on the mapping field and prospects for the future of mapping in the era of artificial intelligence (AI).
2. Thematic Map
2.1. The Mapping Process
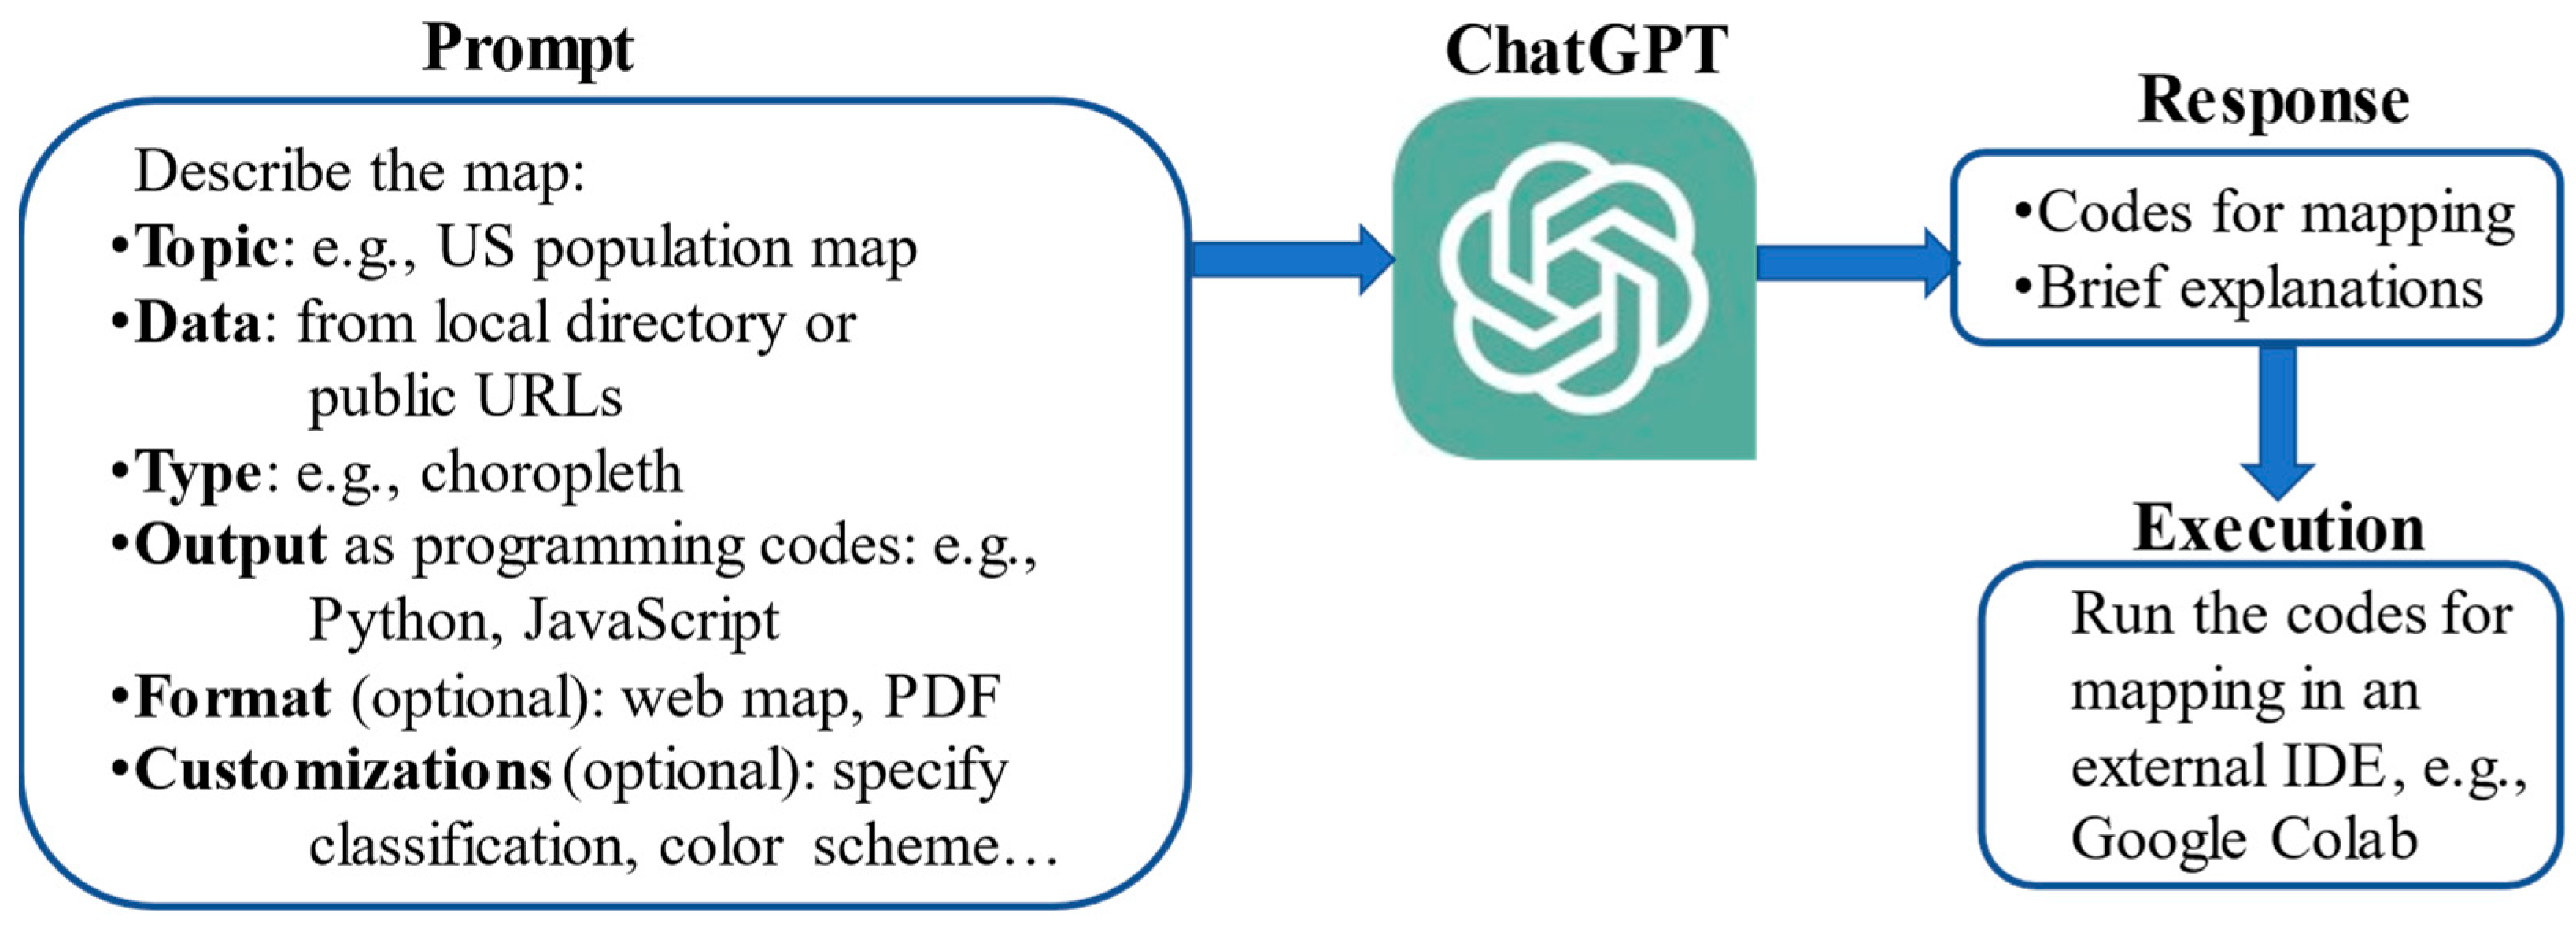
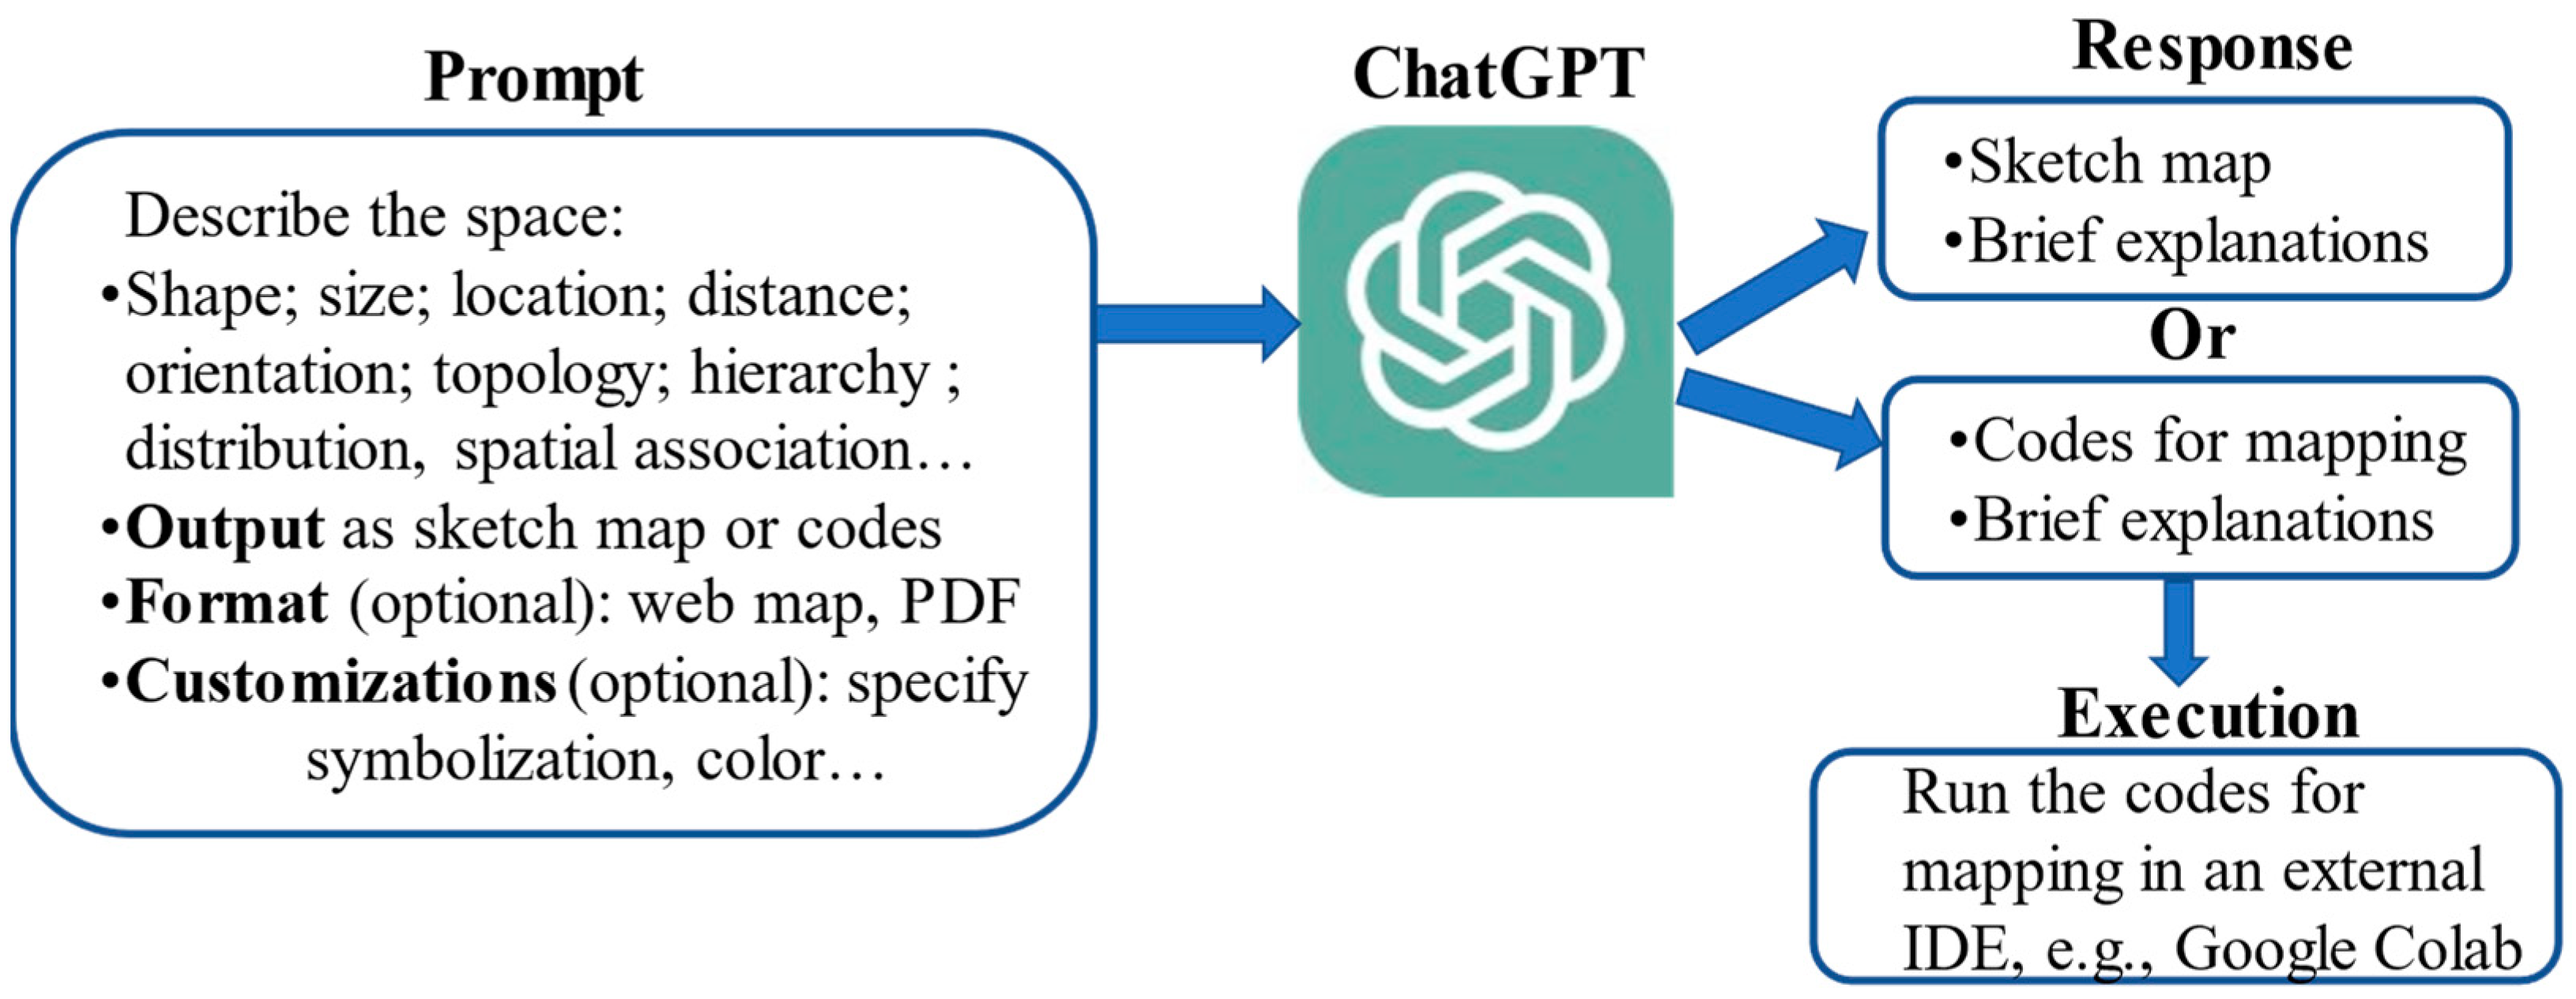
Figure 1 illustrates the process of creating thematic maps with ChatGPT. As an AI language model, ChatGPT can only input and output texts, which means it cannot directly produce thematic maps as images. However, it can leverage existing programming language libraries or packages for map design, e.g., the Python library ‘Matplotlib’; as long as ChatGPT understands a user’s mapping request, it can respond with executable programming codes to fulfill that. Although this approach requires users to run the codes in a third-party integrated development environment (IDE) to complete the final step, it still significantly eases the entire mapping process. The most important step is to set up the initial prompt, which is the input or instruction given by users to ChatGPT. The prompt should include clear descriptions of the map to be designed. Some descriptions are necessary, such as the map topic, map data, map type, and output format. While some other descriptions are optional, such as additional map customizations and map file format. Concrete examples are given as follows.
2.2. Choropleth Map
Prompt 1: “How to draw a choropleth map of the US population using programming codes?”
Prompt 1 is a prompt to draw a thematic map with ChatGPT. In this prompt, “the US population” sets the map theme. Since the US population data are publicly available, ChatGPT will look for the publicly available data sources for creating the map. Users will be directed to download the data, e.g., in shapefile format, or use the public data URL found by ChatGPT. Alternatively, users can use their non-public map data by specifying the local data file directory. In addition, “choropleth map” directs ChatGPT to design a map in this specific map type, in which areas are shaded or patterned in proportion to the state population being displayed on the map. In addition to a choropleth map, users may also specify other map styles, such as proportional symbol map, heat map, and dot distribution map, if they are available in the programming package that ChatGPT utilizes for producing maps. Another necessary piece of description in Prompt 1 is to explicitly ask ChatGPT to output programming codes. Otherwise, ChatGPT may respond with a general guide for map design. Adding “using programming codes” or “with codes” to the prompt is typically sufficient as ChatGPT is smart enough to look for the suitable programming language and libraries to use.
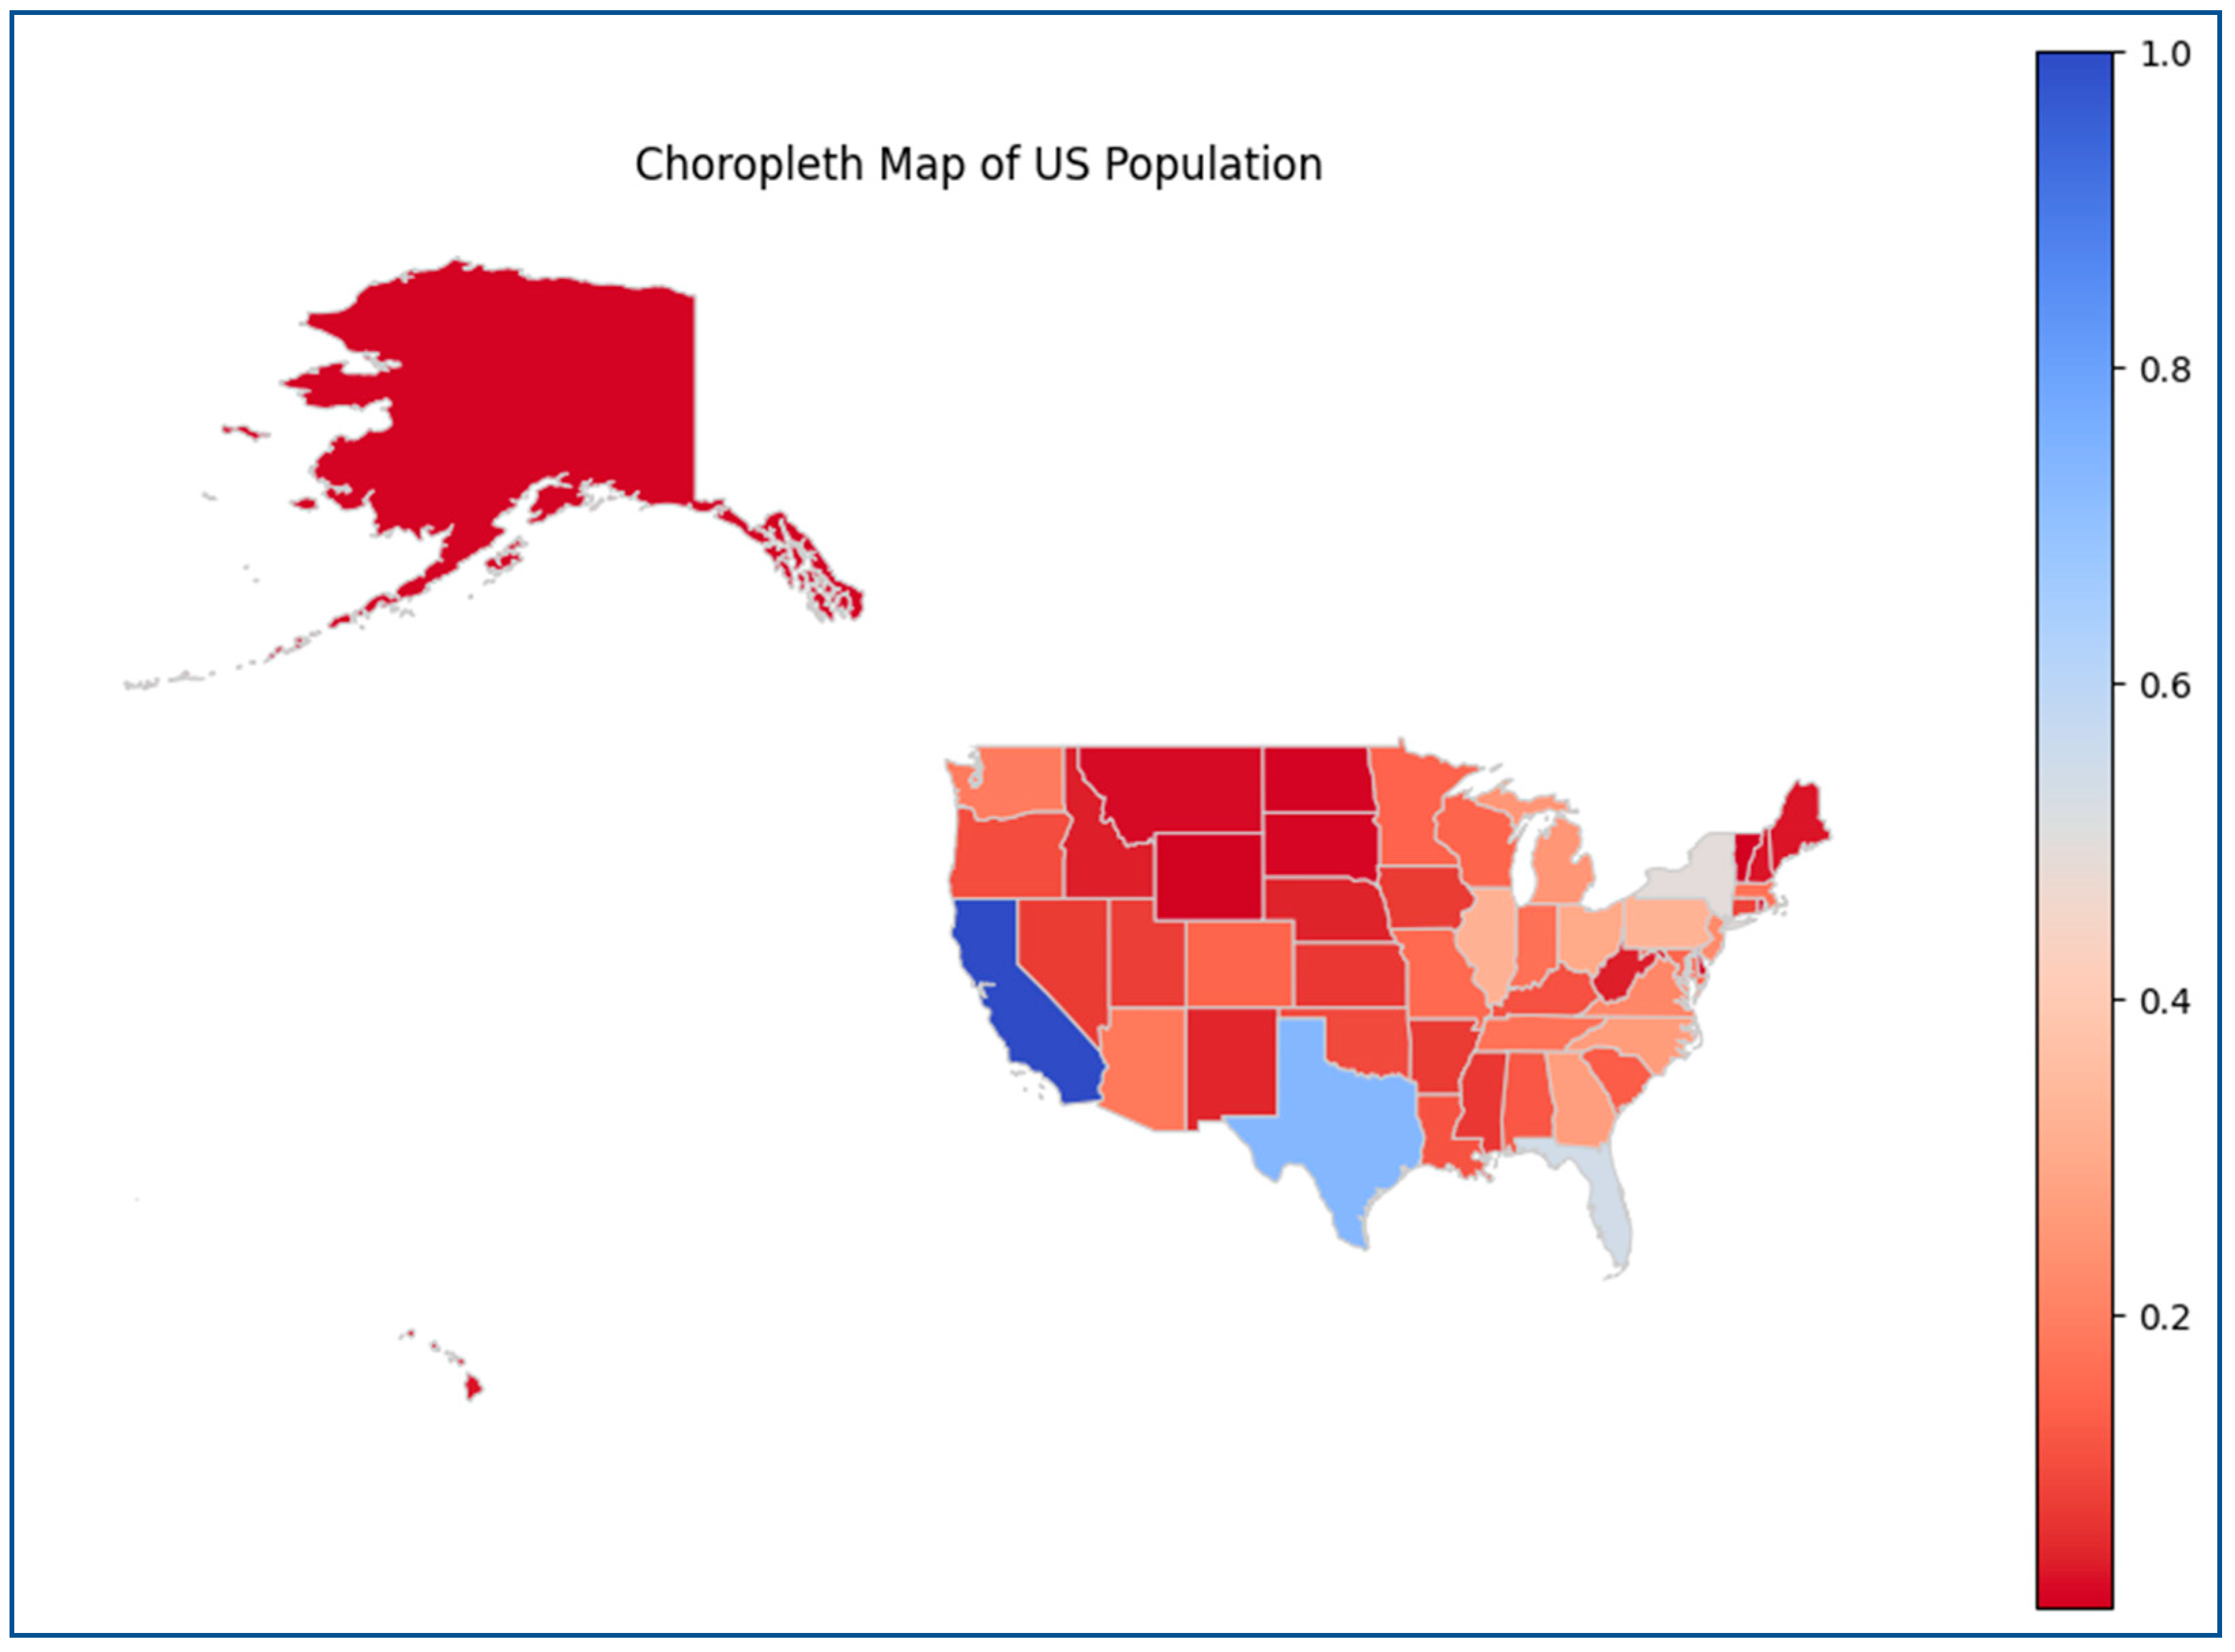
ChatGPT responded to
Prompt 1 within seconds. The response included two parts, one being the textual explanation on its understanding and solution to fulfill the request, e.g., which map tool it chose to use and why. The other part was the code section for producing the map. In this case, it selected the ‘matplotlib’ library in Python. The codes were embedded inside a coding block, and they were accompanied with concise comments of each step to increase the readability. Users need to manually copy and paste the codes to a third-parity IDE for execution. In our experiments, we adopted the free cloud-based IDE called Google Colab. Running the codes provided by ChatGPT, we plotted a choropleth map of US population as shown in
Figure 2. However, it is worth noting the randomness of ChatGPT’s responses. The second time it responded to
Prompt 1 would lead to a map that looked different than
Figure 2, e.g., with a different color scheme, especially given that
Prompt 1 did not contain many detailed requirements for map customization.
However, the initial map as shown in
Figure 2 was far from satisfactory. Several major issues need to be addressed, including the poor map layout by forcing Alaska and Hawaii to join the contiguous US at the same map scale, the undesirable map projection choice, the lack of spatial extent of the subject region, the unsuitable blue-to-red diverging color scheme for showing population size, and the data normalization without user’s request. In an analogy to chatting with online customer service, users can follow up with prompts to address issues and improve the map design. We attempted solving the above issues of the initial map through a series of follow-up prompts listed as below:
Prompt 1.1: “Can you focus on the mainland and add graticule which aligns with X and Y axis?”
Prompt 1.2: “Can you change the color scheme to a sequential color scheme?”
Prompt 1.3: “Can you use natural Jenks classification (5 classes) without normalizing the data and round up the population count in the legend, e.g., use million or thousand as the unit?”
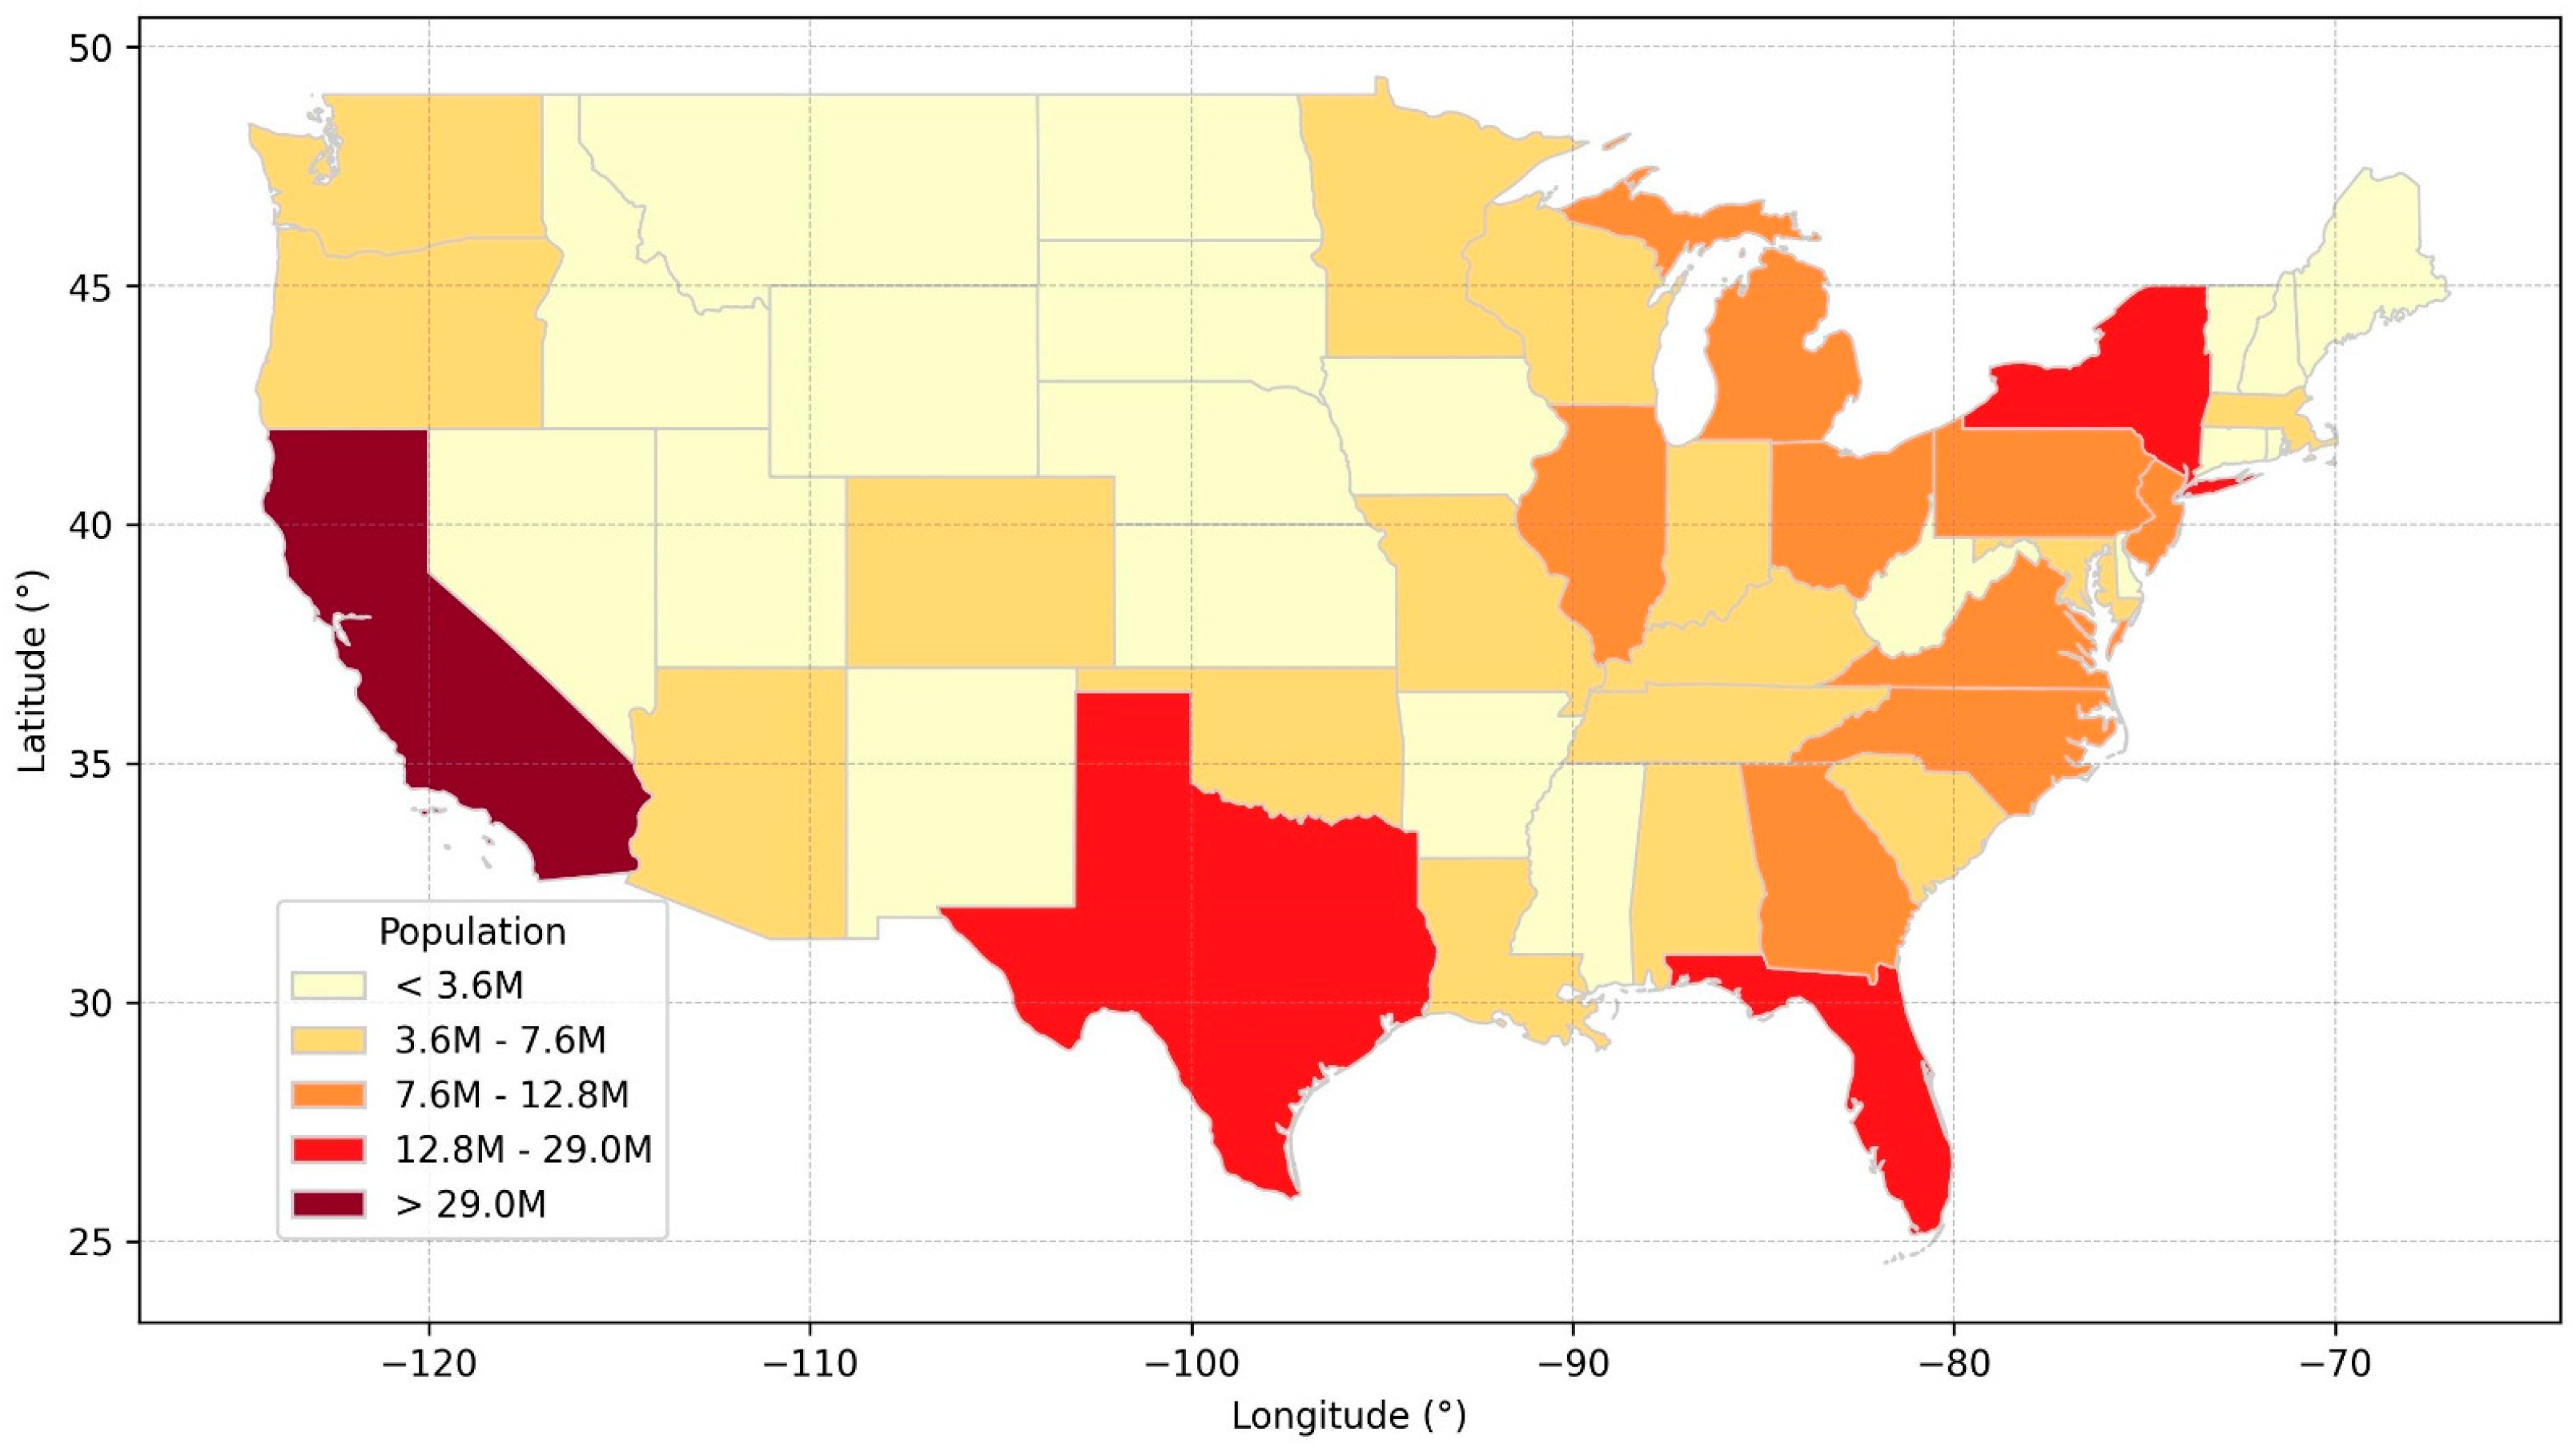
Similar to the original
Prompt 1, ChatGPT’s response to each follow-up prompt contained a code section and textual explanations. By running the codes in IDE, we ended up with a modified map as shown in
Figure 3. The map was much improved from its initial status in
Figure 2, complete with major map components and appropriate color scheme, classification, data frame, and round-up legend descriptions. However, there remained issues such as the distorted shape of states due to the use of geographic coordinate system and graticule. To further polish and customize the map, we attempted to use the projected coordinate system and add map elements, including north arrow and scale bar, in the map, but found that it became less effective using follow-up prompts with ChatGPT as functions of such map elements are not well developed in the Python package. Sometimes, ChatGPT addressed the existing issue but introduced new issues at the same time. Through many back-and-forth experiments, our conclusion is that sometimes it is more convenient to manually edit the codes to complete the “last mile”, namely addressing small issues of the map or moderately customizing the map, in comparison with asking ChatGPT to regenerate new codes for mapping. However, users that lack programming skills or map design experience may find it difficult to take this approach.
2.3. Batch Mapping
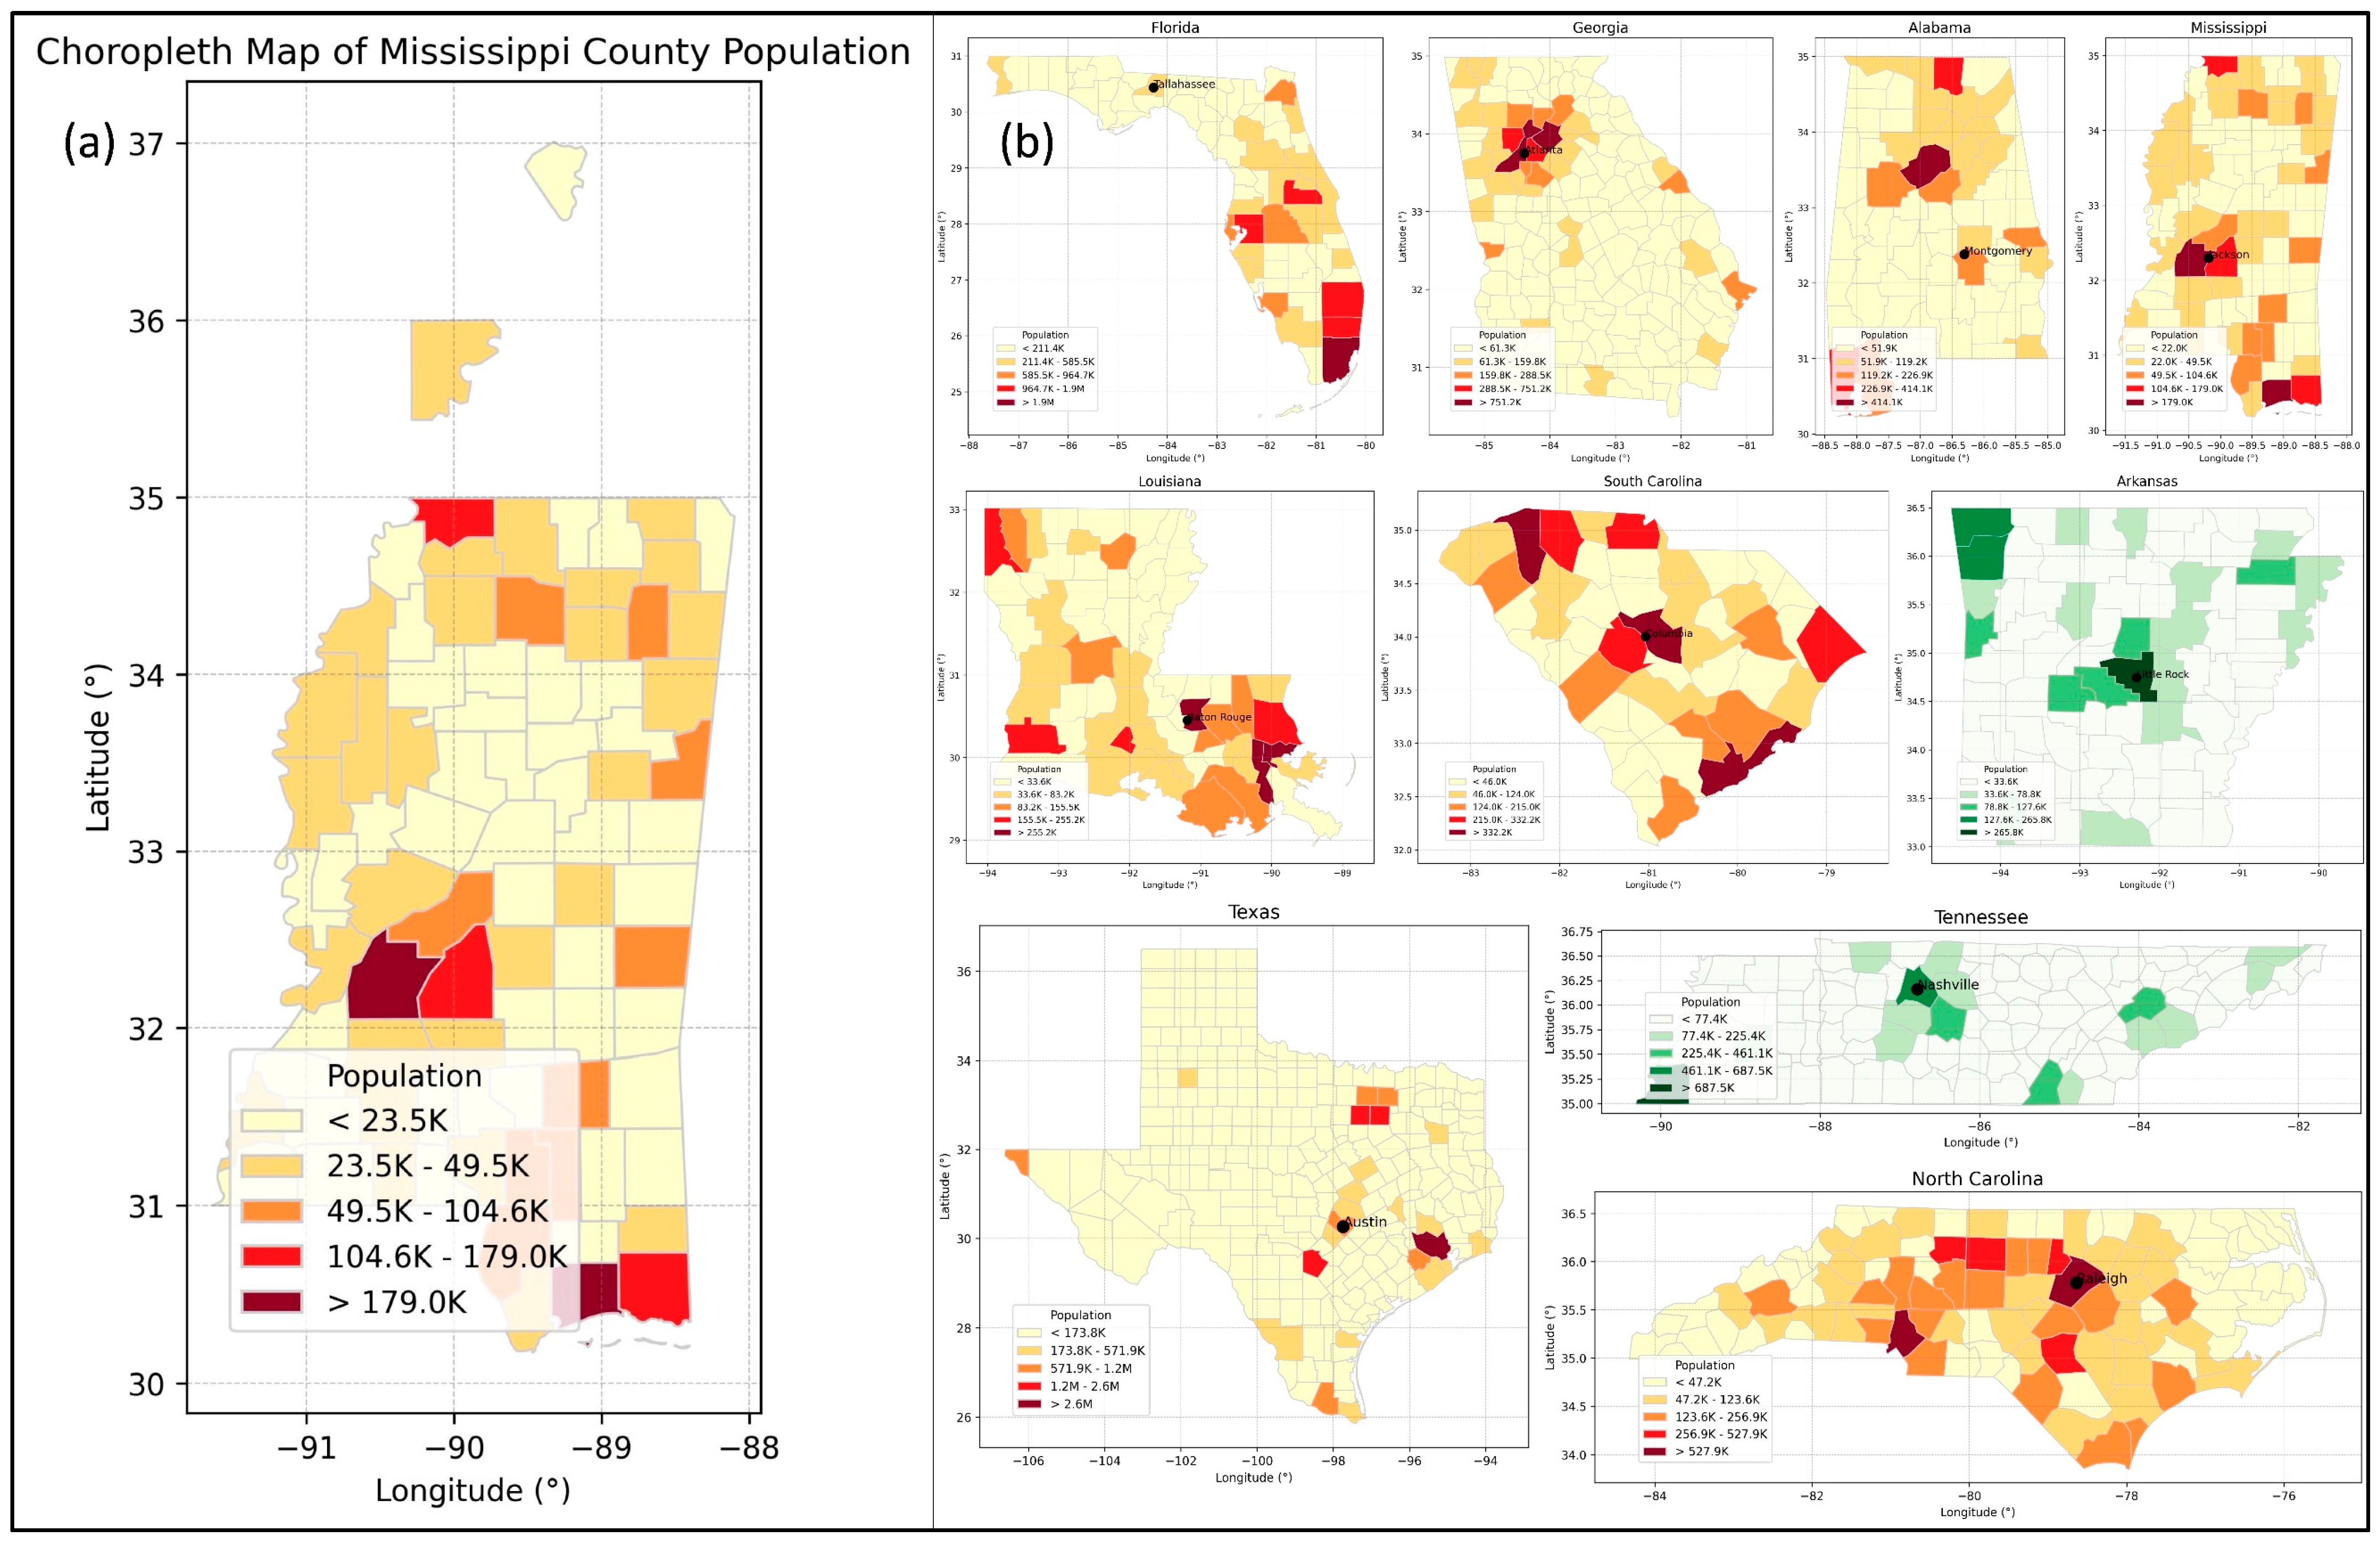
We also tested ChatGPT’s capability of batch mapping, which refers to the process of creating multiple maps at once using automation, rather than creating each map individually. Batch mapping is particularly useful when dealing with a large amount of data or creating multiple maps with similar specifications, but different underlying datasets. A “for” loop was employed for this experiment, as shown in Prompt 2:
Prompt 2: “Can you use for loop to plot the choropleth map of each US southern state at county level?”
Consistent with previous tests, ChatGPT returned a section of code with succinct explanations. However, the initial maps produced by the codes were problematic. For instance, two counties named “Mississippi” in the states of Missouri and Arkansas were wrongly placed in the Mississippi population map (
Figure 4a). This problem surfaced in a few states, indicating that ChatGPT used a text matching method rather than spatial joining to identify geographical regions for mapping. We successfully solved this problem by utilizing Federal Information Processing Standards (FIPS) codes to match counties with corresponding states, as shown in
Prompt 2.1:
Prompt 2.1: “Can you use state FIPS to select counties from each state instead of using text matching? The FIPS code column in ‘us_counties’ is ‘STATE’.”
Moreover, we tested batch editing of all the maps produced through the following prompts:
Prompt 2.2: “Can you differentiate the states with coastlines using a different color scheme?”
Prompt 2.3: “Can you use the Natural Jenks classification for each state?”
Prompt 2.4: “Can you add the capital city of each state in the map?”
As illustrated in
Figure 4b, ChatGPT successfully differentiated states with and without coastlines using two color schemes, adopted the requested classification method, and labeled the capital city of each state. In contrast with existing techniques of batch mapping, ChatGPT is less demanding on users’ programming skills as it returns a reusable programming framework for mapping. In addition, it understands users’ requests to edit a batch of maps at once, which is much faster than manually editing the codes.
2.4. Web Map
In addition to producing static digital maps, we also assessed ChatGPT’s capability of producing maps in other formats, e.g., web maps. Specifically, we tested converting the Florida population choropleth map to a web map using Prompt 3 as follows:
Prompt 3: “Can you convert the above Florida population map to a web map?”
Python library “Folium” was adopted by ChatGPT. ChatGPT suggested saving the map as an HTML file to facilitate publishing and sharing it on the Internet. The initial output, as displayed in
Figure 5a, had room for improvement. For instance, there were unnecessary markers in each Florida county and ChatGPT failed to employ the correct legend scale. In addition, the pop-up message upon clicking barely displayed any useful information, which means it did not take full advantage of user interaction features of web mapping. Additional prompts were tested to refine the initial web map:
Prompt 3.1: “Can you remove those markers on the web map?”
Prompt 3.2: “Can you make these polygons clickable and show the information from previous markers?”
Prompt 3.3: “Can you apply a similar legend from previous choropleth map in the web map?”
Prompt 3.4: “Can you add additional information in the pop-up window of each county, including the percentage of the elderly and Hispanics?”
As
Figure 5b shows, ChatGPT understood our requests and applied corresponding modifications to the map. The map had a cleaner look and could interactively show essential information of the county being clicked. Furthermore, we tested if ChatGPT can implement some advanced features, such as adding a scroll bar for opacity and using a 3D bar plot. Due to ChatGPT’s knowledge till September 2021 and limitations of the “Folium” library, ChatGPT was unable to provide a valid solution. ChatGPT suggested several other tools of geospatial visualization, including deck.gl and kepler.gl, but it failed to produce executable codes to implement the advanced features.
3. Mental Map
3.1. The Mapping Process
Mental maps, also referred to as cognitive maps, are a mix of objective knowledge and subjective perceptions about locations and places, rough estimates of size and location, and an overarching awareness of the relationships between different places [
10]. The concept of mental or cognitive maps was first presented by psychologist Tolman [
11], to explain the observation that rats, and presumably humans too, react not solely to discrete, sequential environmental stimuli, but rather to the entirety of their environmental context. Geographers tend to see mental maps as (1) graphical portrayals illustrating the variance in individuals’ assessments of places, and (2) hand-drawn maps that individuals can create—sketches embodying urban street layouts and geographical landmasses [
12,
13]. The practical utility of mental maps is evident across various disciplines such as cartography, GIScience, remote sensing, geography education, crime resolution, urban planning, search and rescue operations, advertising, and design of user interface (UI) [
14].
Creating mental maps requires ChatGPT to think spatially in order to comprehend the geographical space based on users’ descriptions.
Figure 6 conceptualizes the process, in which the prompt should clearly describe the space to be visualized. The description may include but not be limited to the following spatial properties and relationships of geographical features: shape, size, location, distance, orientation, topology, hierarchy, distribution, and spatial association. In terms of output, users can ask ChatGPT to respond with executable programming codes for mapping. Alternatively, for some simple scenarios, users can ask ChatGPT to directly reply with a sketch map using combinations of text characters, numbers, and punctuations marks.
3.2. Sketch Map
We first tested the sketch map option.
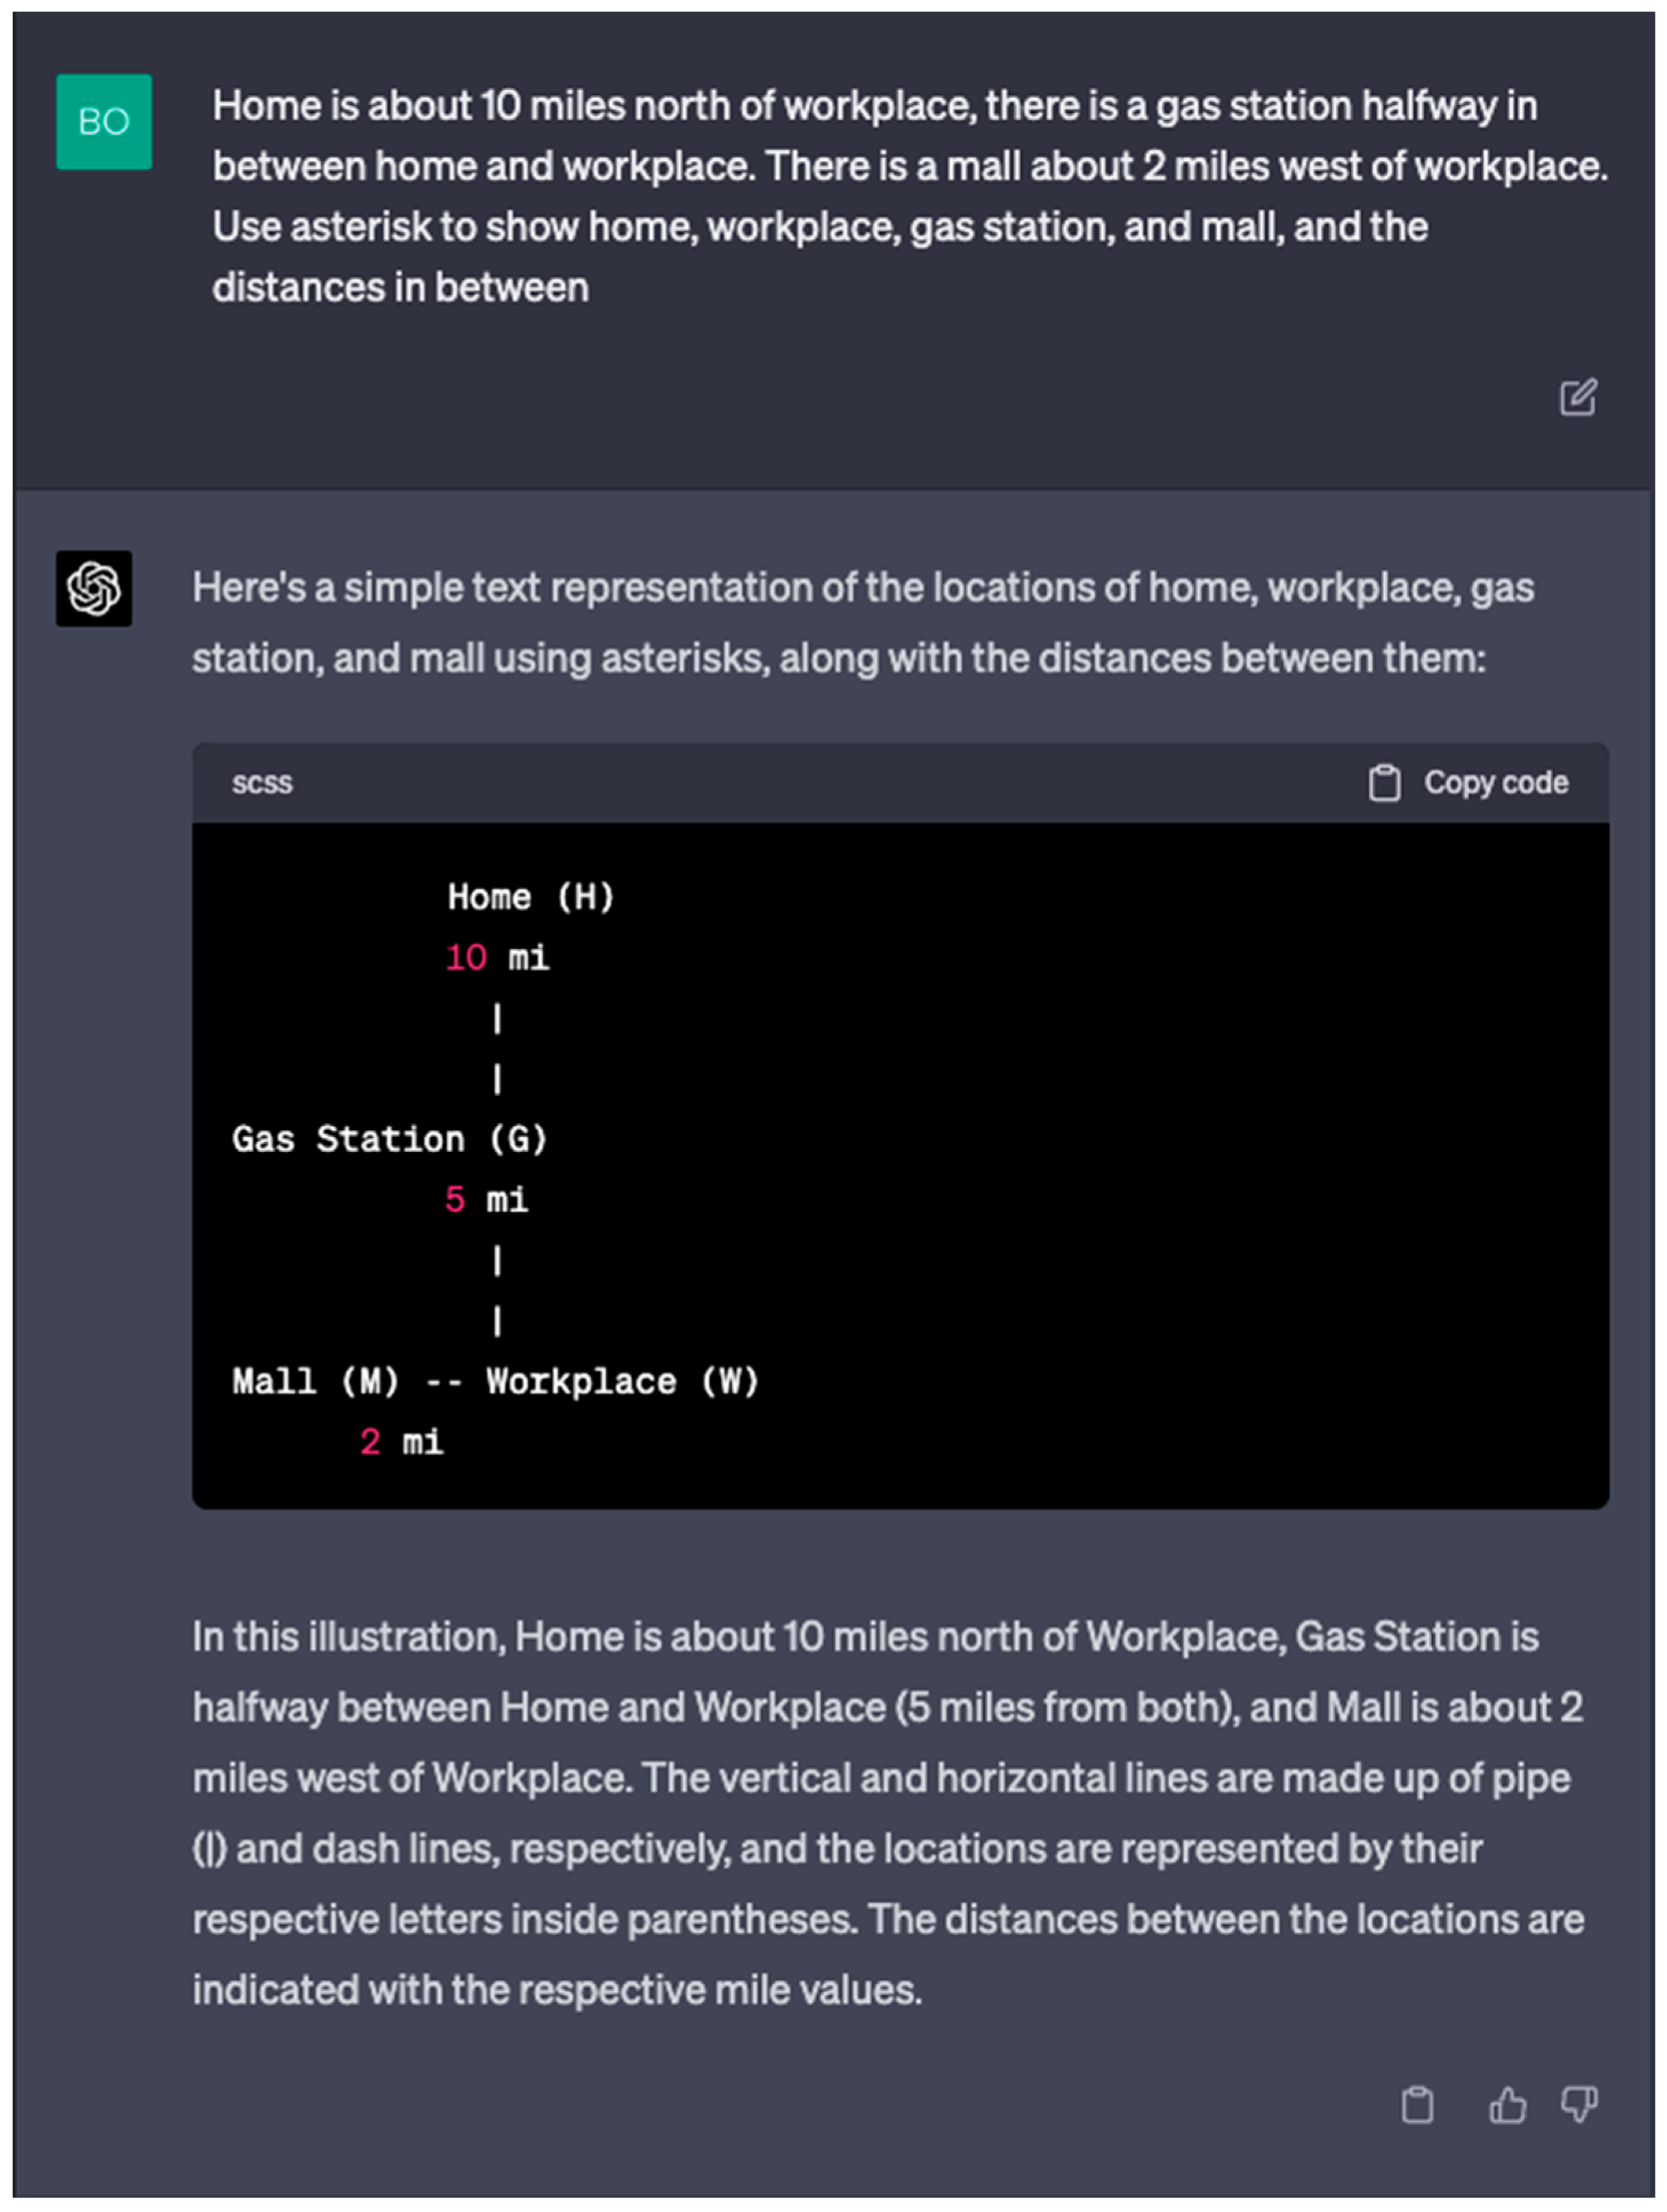
Figure 7 displays the screenshot of a conversation with ChatGPT.
Prompt 4 described a cognitive space of a commuting route, including home, workplace, a gas station, and a mall. We added distances and directions between these geographical features, e.g., “10 miles north of”. Requesting a sketch map in return, we asked ChatGPT to “use asterisk to show” the geographical features.
Prompt 4: “Home is about 10 miles north of workplace, there is a gas station halfway in between home and workplace. There is a mall about 2 miles west of workplace. Use asterisk to show home, workplace, gas station, and mall, and the distances in between?”
ChatGPT responded to Prompt 4 with a sketch map composed of text characters, numbers, and dash lines. It also explained how to interpret the map for understanding the geographical space. To some extent, the map was comparable to a hand-drawn map as it illustrated locations, distances, and directions in a generally correct form. However, the map was not free of problems. For instance, the “10 mi” label might be misinterpreted as the distance between “Home” and “Gas Station”, rather than between “Home” and “Workplace”. In our other tests similar to Prompt 4, we found that drawing sketch maps with ChatGPT can quickly reach its limitation as the complexity of situation increases. To understand whether the limitation was due to ChatGPT’s understanding of a complex space or its inferior drawing capability in text representation, we tested the other output option, namely drawing mental maps using programming codes.
3.3. Mental Map via Coding
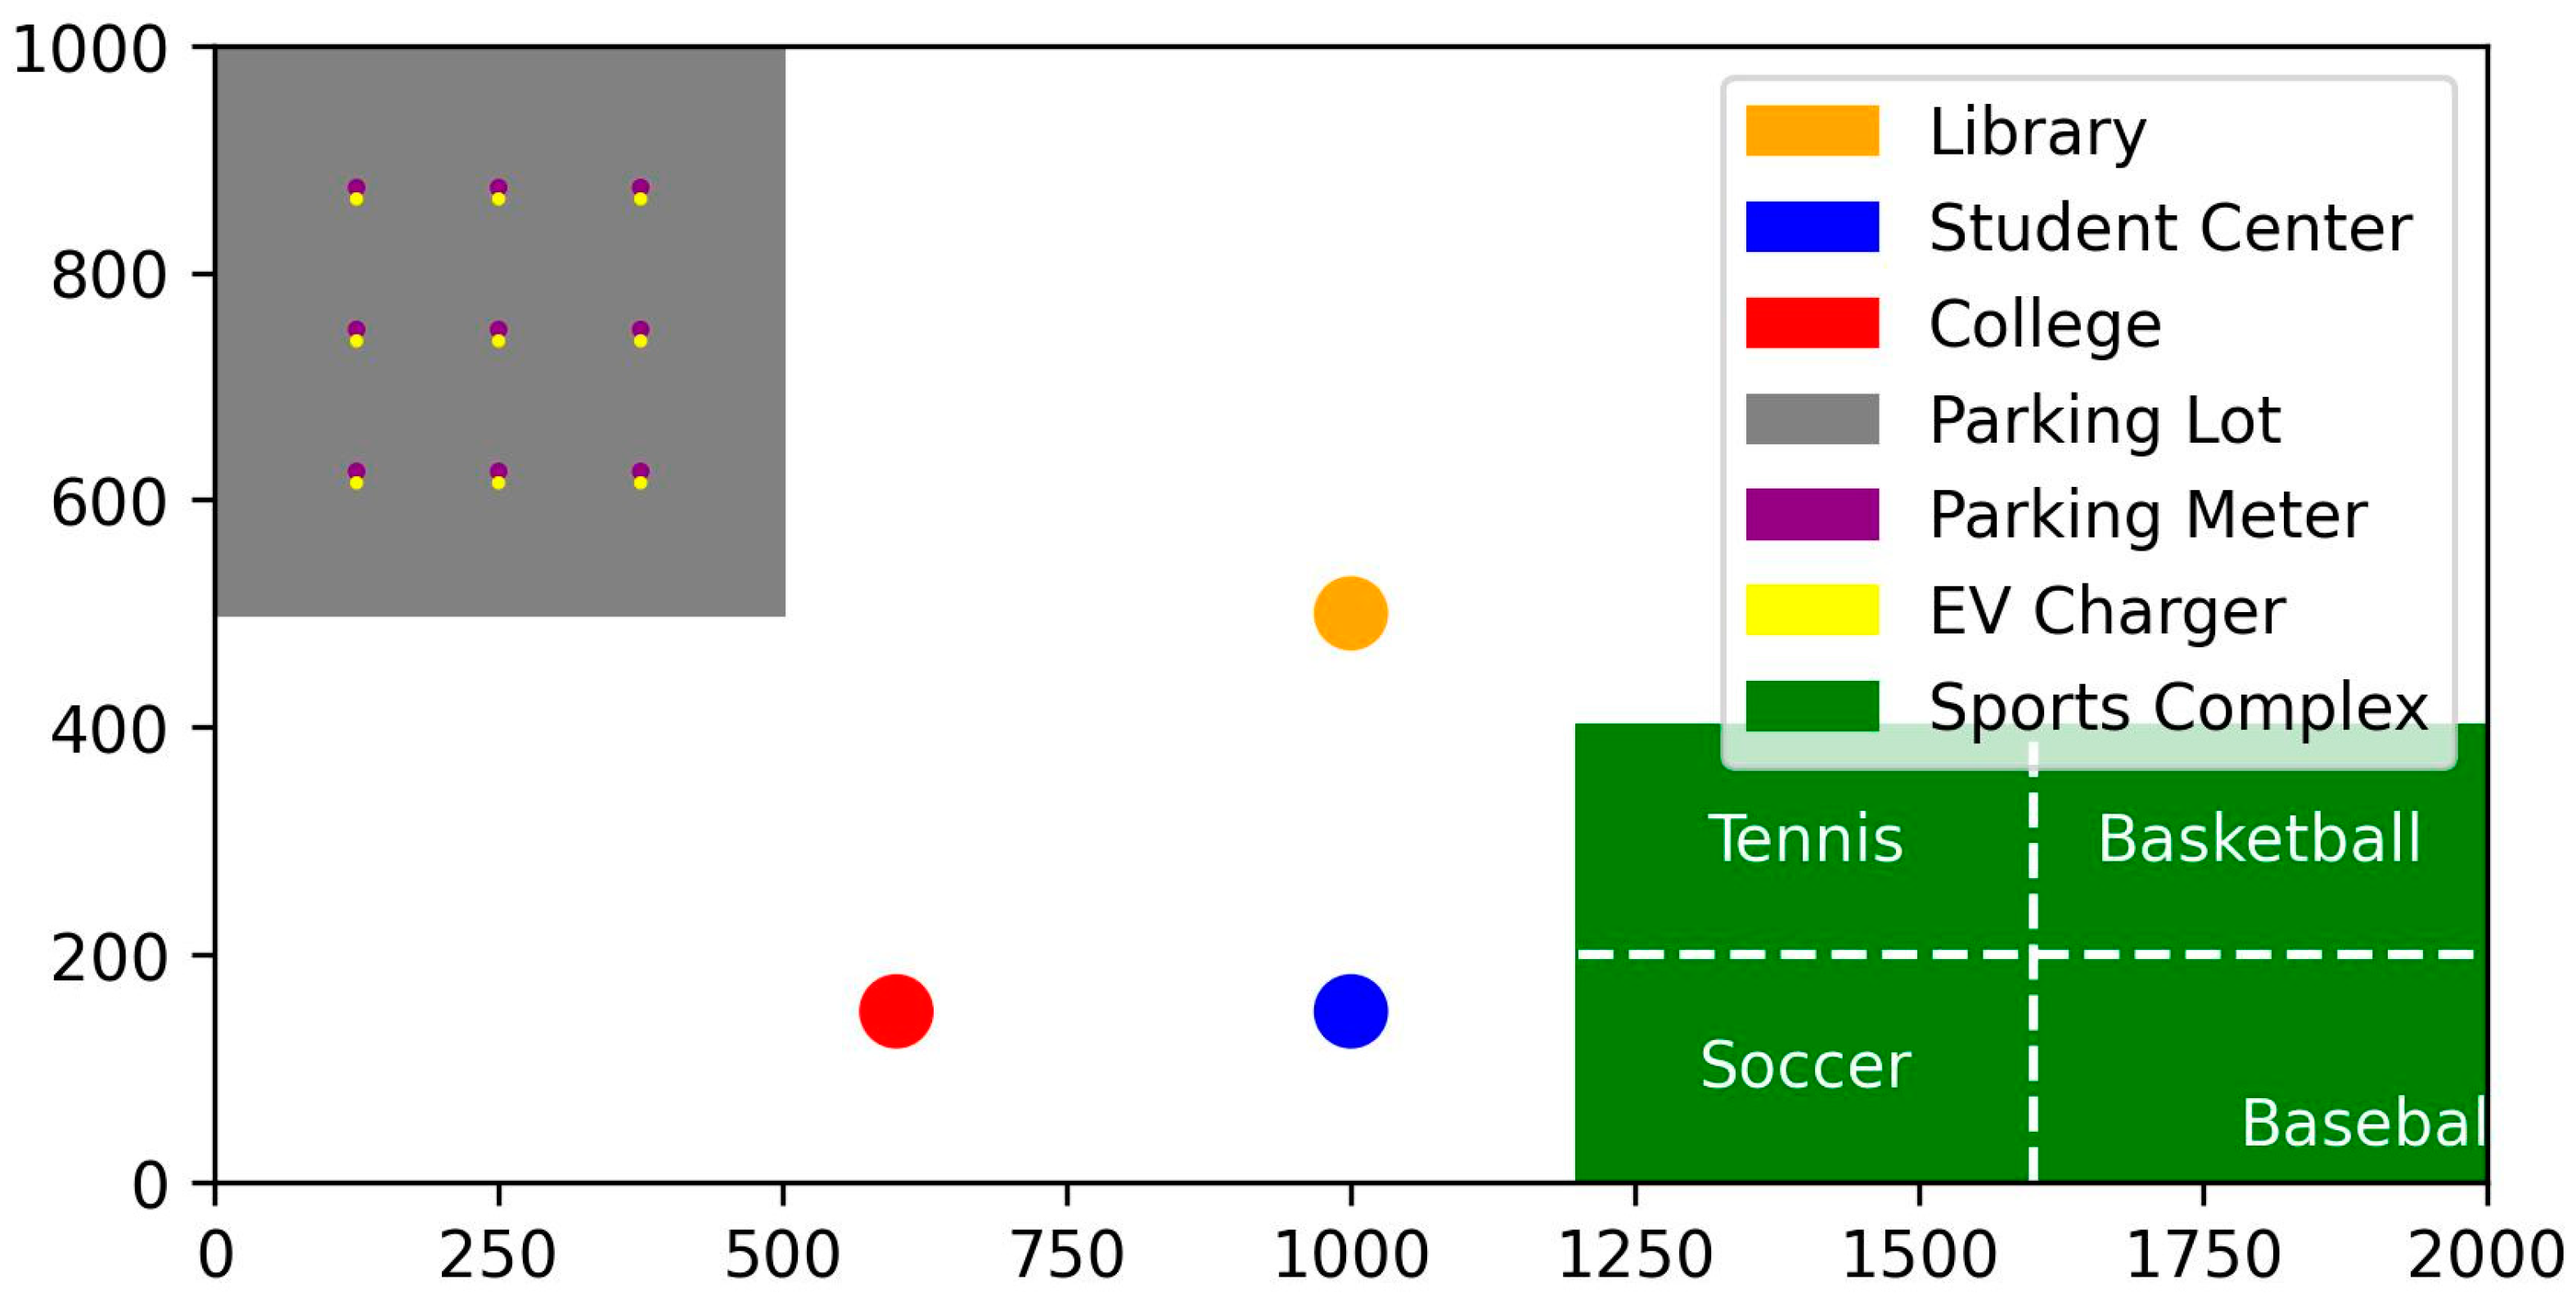
We designed Prompt 5 to test a more complex scenario. In this prompt, we specified a comprehensive list of spatial properties and relationships, including shape, e.g., “rectangular”; size, e.g., “2 km by 1 km”; location, e.g., “sits at the very center”; distance, e.g., “about 5-min walk”; orientation, e.g., “west to”; topology, e.g., “inside the campus”; hierarchy, e.g., “Sports Complex is divided into four fields”; distribution, e.g., “regularly distributed”; spatial association, e.g., “an EV charger right next to each meter”. It is worth noting that we designed several challenging tasks, such as using fuzzy language to describe distance: “about 5-min walk”; requiring calculation: “whose size (area) is about 1/8 of the campus”; specifying spatial distribution patterns of point features; emphasizing spatial dependence between two types of point features. All these challenges required the more advanced spatial thinking capability of ChatGPT to draw the mental map properly. As for the output option, we specifically asked ChatGPT to write codes for mapping.
Prompt 5: “The campus is in a rectangular shape and its size is 2 km by 1 km. Inside the campus, Library sits at the very center. Student Center is inside campus and sits near campus’s southern boundary. College is about a 5-min walk west to Student Center. A square-shape parking lot at the top-left corner of the campus, whose size (area) is about 1/8 of the campus. There are 9 parking meters regularly distributed inside the parking lot, e.g., 3 rows by 3 columns. There is an EV charger right next to each meter. The rectangular Sports Complex is at the bottom-right corner of the campus, whose size is 800 m by 400 m. Sports Complex is divided into four fields: tennis, basketball, soccer, baseball. How to write codes to draw the above features in a map?”
ChatGPT responded to
Prompt 5 with executable Python codes to call functions in the ‘matplotlib’ library. Running the codes in Google Colab, we obtained the mental map as shown in
Figure 8. The map correctly illustrated all the geographical features described in
Prompt 5. Impressively, ChatGPT added comments to explain how it interprets the distance described in fuzzy language, i.e., “5-min walk distance = ~400 m”, based on its “common sense” trained by the large database. The parking lot’s size was also correctly calculated. The distribution of the parking meters was illustrated in a three by three regular pattern per request. The EV chargers were closely located to each parking meter to exhibit their strong spatial dependence. Overall, ChatGPT delivered a satisfying mental map using executable programming codes. The result showcased ChatGPT’s understanding of a more complex geographical space. Nevertheless, the map had several minor issues. For example, point features should have appeared as points rather than polygons in the legend, the unit (meter) was missing, and the label of “Baseball” was incomplete.
4. Discussion
Through our experiments of mapping with ChatGPT, we have summarized four advantages and four limitations as follows.
Advantage 1: ChatGPT can significantly lower the barriers to producing maps. Based on our tests, this is the biggest advantage of mapping with ChatGPT as it understands users’ requests described in natural language. Users who have limited programming skills or background in cartography can conveniently design various types of maps. The way to interact with ChatGPT is intuitive as it is based on conversations. In all our tests, the prompts were no longer than a few sentences that were free of jargon. For example, when asked to illustrate a “5-min walk distance”, ChatGPT translated this fuzzy description to an approximate distance of 400 m. In addition to the convenience of interactions, ChatGPT always explains how its suggested solution works, instead of acting similar to a black box and feeding users with only the final products. For instance, it adds comments to the programming codes to help users learn the mapping procedure step by step.
Advantage 2: ChatGPT can significantly boost the efficiency of map production. This advantage is exhibited in four aspects. First, producing batches of maps in a similar style is easy and fast. Our test showed that ChatGPT successfully generated population maps for all the US southern states in a short amount of time. It also responded well to our follow-up requests to edit the maps in batches. Second, ChatGPT sets up a reusable programming framework for mapping. The framework is in a clear structure with explanatory comments, which makes further editing and extension convenient. Third, ChatGPT can also save time for data hunting. Trained by a huge database, it is a brilliant search engine. In our tests, ChatGPT can look for public data sources to satisfy users’ needs, e.g., the US population data. This saves time on the conventional data hunting process. In addition, ChatGPT can also search for the right mapping functions from associated Python packages to use, which means users do not need to gain a panoramic view of the Python packages to know what map features/styles are available. Fourth, ChatGPT can recall prior messages within that same session for context, which simplifies the process of map improvement or extra map production via follow-up prompts. With the chat history intact, users don’t need to spend time recounting previous interactions, even after considerable breaks. This ensures continuity and efficiency in communication.
Advantage 3: ChatGPT can design mental maps based on its spatial thinking capability. Through our tests, we found that ChatGPT can understand a comprehensive list of spatial properties and relationships, including shape, size, location, distance, orientation, topology, hierarchy, distribution, and spatial association. It can output either sketch maps or executable programming codes for mapping. Notably, ChatGPT comprehended the spatial distribution pattern and spatial association rule of the point features described in our prompt and correctly illustrated them in the map. The spatial thinking capability sets ChatGPT apart from existing automatic or semi-automatic mapping tools. Communicating with ChatGPT is similar to talking with an intelligent personal assistant, rather than giving directions to a robot for repetitive works.
Advantage 4: ChatGPT can inspire users for creative map design. Based on a large language model, ChatGPT can generate “creative” outputs based on complex computations and pattern matching. Although it does not have true human-like creativity, the outputs can still be inspiring if they are new to the user. For example, ChatGPT added a graticule to each state population map as shown in
Figure 4b without our request. We found it a useful and beautiful add-on to the batch of maps, so we decided to keep it. In some other tests, we found the map styles that ChatGPT suggested, such as symbols and colors, work well. This feature of ChatGPT is quite useful because users do not have to think of all the details of map design in advance. In fact, users can take the suggested map designs as feedback, and choose to keep them or make improvements. Moreover, the mapping process can also be inspiring if new data sources or new mapping tools are introduced to the user. For instance, the authors were not aware of the Python library “Folium” for web mapping before ChatGPT made this suggestion.
Limitation 1: ChatGPT can only input and output texts. For the purpose of mapping, the direct input are mappable geospatial data, such as vector data in shapefile format or raster data in GeoTIFF format. The output consists of maps in various graphical data formats, such as JPEG and TIFF. In this study, we managed to walk around this limitation by asking ChatGPT to use third-party mapping tools that can input and output non-textual files. For instance, our frequently used Python library ‘Matplotlib’ can read geospatial datafiles and plot maps. However, this is still not an end-to-end mapping procedure with ChatGPT, which leads to the second limitation.
Limitation 2: ChatGPT’s mapping capability is subject to external conditions. The most critical external condition is the computer program-based mapping tool that ChatGPT relies on for plotting maps. No matter how well ChatGPT understands users’ requests, it still cannot generate desirable maps if the external mapping tool has limited capability, or if ChatGPT does not know how to use the tool. In our failed attempt to implement some advanced features to our web maps, such as adding scroll bar for opacity and using a 3D bar plot, the Python library “Folium” that ChatGPT adopted does not even have the corresponding features. Despite ChatGPT suggesting other tools such as deck.gl and kepler.gl, it failed to generate executable codes to use them. In addition to the mapping tool, other essential external conditions include but are not limited to a reliable third-parity IDE to run the codes, a stable Internet connection with a non-restricted IP address (as ChatGPT is not accessible in certain countries or regions), and data sources that are available for making the requested map. Given these external conditions, there is a certain level of uncertainty and inconsistency when mapping with ChatGPT.
Limitation 3: ChatGPT’s initial response usually does not lead to a satisfying map product. In our experiments, it was rare that we were fully content with the first map returned by ChatGPT. The reason for this limitation is not entirely clear. One thing we can relate to is the overconfidence of ChatGPT, as it tends to reply to users regardless of information accuracy [
15]. We often found the map product not as good as what ChatGPT claimed to be. The bright side is that the issues are typically minor and fixable. It takes a few rounds of follow-up prompts to improve the map. Despite this, even follow-up prompts may not lead to a satisfactory map, and directly editing the codes is the last and ultimate solution for map improvement. However, not all users are skilled enough to take this solution, which means ChatGPT does not always guarantee satisfactory map products for beginner users.
Limitation 4: ChatGPT benefits different users unequally. Although ChatGPT enables users at the beginner’s level to produce maps, users with domain knowledge and programming skills will take more advantage of it. To set up the initial prompt, experienced users will have a better chance to accurately describe the target map or the geographical space. Taking our mental map of campus as an example, an experienced user can describe the spatial properties and relationships in clear logic, while an inexperienced user may find it difficult to describe all the geographical features in a concise way. Regarding map editing, experienced users are better at map critique so that they can easily spot issues with the initial map returned by ChatGPT. To address the issues, manually editing parts of the codes can be more convenient than using follow-up prompts with ChatGPT to regenerate the codes. However, this approach is impractical for users with little programming skills. There also exist some other inequality issues. For example, only paid subscribers can use the latest version of ChatGPT based on GPT-4 as of May 2023. English speakers will likely have an advantage given that ChatGPT works the best in English [
16].
It is important to note that the above advantages and limitations are summarized based on our experiments and observations. There are additional ones that we are aware of but have not validated in this study. For example, the outdated map information due to the cut-off of GPT-4′s training data in September 2021. The potential ethical issues of AI-generated maps such as irreproducibility [
17]. In the meanwhile, it is also critical to acknowledge the rapidly evolving pace of ChatGPT. With future updates, the advantages mentioned above can potentially be amplified while the limitations can potentially be overcome. For instance, new plugins of ChatGPT may be developed to enhance its mapping capability. On the other hand, future updates on policies may restrict some map functions that are currently available.
5. Conclusions
We conducted a pioneer study using ChatGPT to design and produce maps. Through our experiments of making thematic maps and mental maps, we summarize the typical mapping process with ChatGPT: feeding ChatGPT with users’ requests for mapping, and ChatGPT will respond with either sketch maps or executable programming codes to generate maps with external mapping tools, such as the Python library ‘Matplotlib’.
We summarized four major advantages of using ChatGPT for mapping: ChatGPT can significantly lower the barriers to producing maps, it can significantly boost the efficiency of map production, it can design mental maps based on its spatial thinking capability, and it can inspire users for creative map design. In the meanwhile, we summarized four unignorable limitations: ChatGPT can only input and output texts, its mapping capability is subject to external conditions, its initial response usually does not lead to a satisfying map product, and it benefits different users unequally.
Our main conclusion is that despite being at an early stage, ChatGPT has the potential to revolutionize the way we design and produce maps. Educators can be more focused on teaching map design principles and map critique, instead spending a huge amount of time on how to wield mapping tools. Researchers who do not have background in GIS will find ChatGPT convenient for visualizing their geospatial data or results as maps. However, it is crucial to acknowledge that mapping with ChatGPT is still an immature solution. While being a new alternative, it will not necessarily replace existing popular mapping solutions in the near future. Users should remain mindful while employing ChatGPT for mapping, particularly on the unvalidated data sources suggested by ChatGPT, and the likely non-straightforward map improving process.
In terms of future works, one promising direction is to integrate ChatGPT with other AI tools with drawing capability, e.g., DALL·E 2, as an intelligent and autonomous mapping agent. The agent should include a decision-making core to overcome the current limitations, such as dependence on external conditions and unsatisfactory initial maps (Li and Ning 2023). Another future direction is to comprehensively evaluate ChatGPT’s spatial thinking capability and exploit its usefulness in a broad range of GIScience research and applications.


