Abstract
Coastal flooding has been a significant hazard in Hong Kong. Influenced by climate change, extreme coastal flooding events have been frequently observed in the past decades. Nowadays, the real estate sector has increasingly recognized the significance of managing future coastal flooding risks. However, there are few relevant Geographic Information System (GIS)-based assessment tools and studies about future scenarios. Against this background, this study aims to understand the risk and readiness of properties in Hong Kong for future coastal flooding and to reduce the gap in the risk management decision-making process. This study included the return period, sea level rise, tide activity, and storm surge as the main factors for estimating the frequency and magnitude of coastal flooding events. The estimation and other geospatial data were calculated to describe the exposure, hazard, and readiness of every building in Hong Kong. Based on this risk data of buildings, clustering analysis was adopted to create clusters representing different building risk profiles. The results highlight that there will be 16.3% and 24.7% of buildings in Hong Kong exposed to coastal flooding under Shared Socioeconomic Pathway (SSP) 8.5 and SSP 4.5, respectively, and 2.5% of them will have an extremely high hazard level. This study then constructed an indicator-based assessment model for the real estate sector regarding future coastal flooding risks. Classifying the buildings based on characteristics of their risk profile obtained eight clusters, with clusters 1 and 2 having high risk and low readiness, and clusters 7 and 8 having low risk and low to medium readiness. In addition, distinct spatial patterns were found between the clusters that have low and high readiness of green infrastructure. Therefore, recommendations for the policymaker, planner and companies were provided based on their local situation. Specifically, the discussion suggests that although Yuen Long is an area that has a relatively larger number of high-risk buildings, clusters 3 and 4 in Yuen Long have more potential for adopting various loss mitigation measures. However, clusters 5 and 6 in the city center are more recommended to adopt financial tools and small-scale nonstructural improvements.
1. Introduction
Coastal flooding is the world’s foremost natural hazard threatening the life and properties in coastal regions [1]. It is associated with storm surge generated by the combined effects of strong winds and low pressure in a hurricane or tropical cyclone [2,3]. In the past decades, storm surge-induced flooding has been witnessed frequently around the world, including Hurricane Katrina (2005) in America, Typhoon Haiyan (2013) in the Philippines, and Super Typhoon Mangkhut in Hong Kong (2018) [4].
The Western North Pacific is the most active tropical cyclone (TC) basin on the Earth, which produces almost 30% of global TCs [5]. As a megacity city located on the Pearl River Delta (PRD) on the west coastline of the Pacific Ocean, Hong Kong has a large proportion of low-lying coastal area, which accommodates important regional socio-economic activities and the most valuable properties of the city. The coastal real estate projects in Hong Kong are therefore highly vulnerable to flooding risks.
Flooding risk can be imposed on a property through different mechanisms. It emerges from the confluence of various elements [6], and influences the physical structure, property value, and the wellbeing of communities. In historical typhoon events in Hong Kong, coastal floodings have caused severe damage by destroying infrastructures and flooding coastal dwellings, notably in Typhoon Wanda (1962) and Typhoon Hagupit (2008) [7]. According to projections from the Sixth Assessment Report (AR6) of the Intergovernmental Panel on Climate Change (IPCC) [8] and World Meteorological Organization (WMO) [9], the proportion of severe and super typhoons will increase further by next century with global warming. Compounded with the more frequent extreme weather, climate change-induced sea level rise (SLR) will increase the incidence and storm inundation of flooding in coastal regions [10]. In this context, coastal flooding risk assessment at real estate level is becoming increasingly important for the city and stakeholders.
The latest scenarios of Shared Socioeconomic Pathways (SSPs) and the coordinated efforts of the Coupled Model Intercomparison Projects (CMIP) provide the opportunity for understanding the future climate risks around the world [11]. Meanwhile, Geographic Information System (GIS) techniques facilitated the estimation and visualization of risks in a large area. To forecast the future coastal flooding risk and build the resilience of Hong Kong, the government has studied the representative concentration pathways (RCPs) and SSPs and implemented many municipal hazard mitigation measures. However, few studies assessed the risk and vulnerability from the real estate perspective using the modelling data in GIS.
Drawing on previous emerging risk assessment tools and climate modelling resources, this research has constructed an assessment framework and presented quantitative results containing several dimensions of the hazard and vulnerability information for each building. After that, the buildings were further categorized into more than six types through clustering analysis. Derived from discussion of risk assessment and the current coastal flooding management system in Hong Kong, recommendations have been offered for relevant stakeholders, such as policy makers, planners, and real estate companies.
1.1. Literature Review
Research Gap
The common method of reducing natural hazard has shifted from a relief approach applied in the post-disaster stage to a more comprehensive and prevention-oriented management approach [12]. In the current management system, each stage of reducing hazard can be planned better, and each subject influenced by the hazard can be more explicitly identified. Meanwhile, as the term ‘socio-natural hazard’ has been increasingly mentioned by international hazard management organizations to describe the hazards that are enhanced by anthropological factors beyond their natural probabilities, social vulnerability and climate change have become two nonnegligible factors in hazard management [13,14]. Coastal flooding is such a hazard that is closely related to the changing social factors and climate conditions.
The more refined management of coastal flooding disaster requires the researchers and stakeholders to obtain a more wide-ranging and detailed assessment of the natural and socio-economic situation of a city. Extensive research focusing on coastal flooding in Hong Kong has depicted the integrated risk configuration considering social resilience or vulnerability. The localized sustainable flood risk appraisal (SFRA) framework and framework for flood responses in cities of the PRD constructed process-oriented models of hazard management [15,16]. Later studies further explored the emerging flooding vulnerabilities brought by climate change [6,17]. However, climate change was mentioned mostly as a qualitative factor for consideration, and few attempts at quantifying the climate change-induced risk were incorporated into those studies.
Some other researchers have studied the risks from a community resilience and governance perspective [18,19], whereas relevant assessment study from a real estate perspective is rare, not to mention a comprehensive assessment model that takes climate change into account. The lack of associated tools for the real estate sector is not only a problem in Hong Kong. According to the Financial Stability Board’s (FSB) Task Force on Climate-related Financial Disclosures [20], the limited analytical ability for future physical real estate risks has become a barrier for stakeholders all over the world. In their survey, two-thirds of the stakeholders have not taken climate scenarios into assessment, while a third of them that have been using climate information are calling for tailored risk modelling tools and metrics [20,21].
Constructing an integrated model requires broad knowledge and intensive modelling effort. Current studies of Hong Kong have focused on modelling the death cases, influenced population or land-use change as their single indicator for quantifying coastal flooding risks under future climate scenarios [12,22,23]. These studies have provided valuable ideas for converting climate data into exposure assessment. Building on previous quantitative studies and climate models, this study has designed a practicable assessment model that incorporates proper indicators for assessing the risk from a real estate perspective. Meanwhile, it has provided a quantified estimation to the future hazard level, and thus, to assign site-specific data for each building in Hong Kong.
1.2. Conceptual Models for Assessing Real Estate Flooding Risks
1.2.1. Components of Risk
Coastal flooding risk is a function of hazard, exposure, and vulnerability [24]. Subsequent research has reached an acceptable level of consensus that hazard refers to the threat of disaster events, which can be represented by their occurrence and magnitude, and exposure is the presence of values in the influenced area [24,25,26]. However, vulnerability as a concept remains complicated and controversial due to its cross-disciplinary nature [27,28].
The lack of resistance to damage is a broad definition of vulnerability [24]. Some of the previous risk assessment studies see it as social and economic vulnerability related to intrinsic characteristics of the assets [26,29] while some refer to internal or external individual capacities for coping with risks [28]. To evaluate the external vulnerability of a building, this study has used the concept of readiness to describe current capability prior to future hazard occurring [30]. It can include proactive development or action that addresses the likelihood of the community being able to respond to hazard consequences [30].
1.2.2. Review of Assessment Method
According to Nasiri et al. [31], curve, loss data, computer modeling, and indicator-based methods are four types of more accepted risk assessment methods. Although relevant assessment of Hong Kong is rare, studies on other megacities have explored the methods of evaluating the components of hazard, exposure, and readiness.
Keenan [32] investigated the adaptability of New York’s real estate companies using a descriptive assessment framework that consists of organizational and infrastructural vulnerability of a firm. McNamara et al. [33] and Li et al. [34] used regional atmospheric and ocean models to assess the losses brought by the hazard event and modeled financial loss data tools for coastal housing price and management. Unlike Li et al.’s method, McAlpine and Porter [35] and Conyers, Grant and Roy [36] have estimated the inundation area based on global climate projection data and discussed the implications for property management with different indicators. The indicator-based assessment models compiled an inventory of adaption measures to formulate a vulnerability index for real estate [36]. This method has the advantages of being informative on understanding multidimensional sources of vulnerability, as well as the high data availability. This study has therefore constructed an indicator-based assessment model to study the readiness, or structural preparedness, influencing buildings.
1.3. Tools for Flooding Risk Quantification
1.3.1. Methods for Predicting Future Coastal Floods
The occurrence and magnitude of future coastal flooding events are determined by current Mean Sea Level (MSL), Sea Level Rise, storm surge and tide events [37]. Extensive research has tried to model future Extreme Sea Level (ESL) by incorporating those contributing factors into global models [8,38], and local models [39,40,41]. Among those studies, the AR6 from IPCC using CMIP6 is widely recognized for analysis. It has projected the annual mean sea level rise of Hong Kong from 2030 to 2150 under 5 SSP scenarios [42].
The combination of storm surge and abnormal tide events is produced by many complicated factors including the storm size, intensity, the angle of approaching a coastline, morphology of the coast, etc., but none of the factors have a determining correlation to the total water level of a storm surge event [43]. Regarding the complexity of storm surge prediction, return period estimation is a common method that has been adopted in many risk assessment studies. The method of return period was introduced by Fuller [44] for the first time to calculate the interval at which a flooding event with a specific magnitude can occur. So far, this flooding recurrence analysis has developed various types of methods. Generalized Extreme Value Distribution and Extreme Value Type methods are two large categories that have been accepted around the world [45]. For instance, Onen and Bagatur [46] adopted the Gumbel distribution to quantify the flood frequency factor. Yu et al. [23] have used the Pareto distribution to process the sea level data of Hong Kong and a global flooding event dataset to calculate the return period.
Among all those methods, plotting position is an unbiased method developed from the Gumbel distribution [45]. It has developed many empirical formulas (Appendix A), and the general expression of plotting position is
where m is the rank of magnitude and n is years of record, and b is a constant. The choice of formula needs to be careful because the result of formulas can vary significantly for extreme events [47]. Regarding the variance, Makkonen [48] has tested the reliability of formulas, and found the sources of errors from Blom’s, Jenkinson’s, Gringorten’s and Hazen’s formulas. Cook’s [49] research has further reviewed the formulas to rectify some criticisms about the formulas, and found that Harris’s and Gringorten’s methods have acceptable levels of error. Based on the research, this study can find a proper method for the obtained dataset.
P = (m − b)/(n + 1 − 2b)
1.3.2. GIS and ML as Tools for Risk Analysis
GIS is a common technique to conduct risk analysis. In recent years, GIS-based risk assessment has been more and more combined with clustering analysis to produce valuable information from massive geographic data [13,50]. The increasing availability of big data and clustering tools have been improving the process of decision-making profoundly. This hybrid method has also achieved wider adoption in the business industry, such as in sustainability consultancies, and many startups are developing risk tools and enquiry platforms to serve real estate companies [51,52].
Clustering analysis is an unsupervised classification algorithm in machine learning that has been used in flooding risk analysis [53,54] and some other hydrological analysis [55,56]. This method can study the natural pattern of a dataset and identify the clusters of items that have similar data features. In previous assessment risk studies, the K-means method is one of the most popular algorithms. It aims to give partitions efficient in minimizing within-class variance [57]. The use of K-means clustering overcomes the difficulty of determining risk classification as the classification for flooding risk does not have a clear standard in relevant studies [58]. When studying the risk for real estate, this advantage is even more helpful because the dataset can have many dimensions, and no criteria or standards have been set already. Therefore, this study chose K-means clustering and tried to optimize the method regarding the characteristics of the results.
1.4. Loss Mitigation and Stakeholders
Apart from the risk assessment, providing recommendations is also an objective of this study. In order to come up with insightful recommendations, the consequences of coastal flooding and the interests of targeted stakeholders are reviewed.
Flooding can impose risks to the real estate sector through various mechanisms and eventually lead to three types of losses [59]. The first type is direct losses, which are immediately visible and countable damages to the asset [60], such as wall damage and facility breakdown. The second type is indirect losses brought by business interruptions during the flooding. It includes the extra cost of operational fees and loss of revenue. The last one is consequential losses brought by the degradation of long-term market competitiveness [59]. Regarding the potential losses and the conceptual model of coastal flooding risk to buildings (Appendix B), recommendations can be provided in terms of engineering, planning, management, and financial measures [61].
In response to the losses, the developer, resident, government, and insurer are the main stakeholders that have distinct interests. Chandra-Putra and Andrews [62] have built integrated market behavioral models for all those stakeholders. Bunten et al. [63] have looked into the economic viability of potential recommendations for the developer. Moreover, they further evaluated homeowners’ willingness to pay for different values of the property, such as aesthetic value. Conyers, Grant and Roy’s study [36] on Miami also has a similar analytical discussion. Although detailed market behavior models are outside the direct scope of this study, they are helpful tools for providing recommendations based on the results of data analysis. Therefore, this study has included some ideas about stakeholders’ interests to provide advice for real estate management.
1.5. Research Aim and Objectives
This project aims to assess the risk experienced by areas in Hong Kong for future coastal flooding via analysis of risk data, climate data, and local geographic data. Relevant stakeholders will then be informed of the results of the different analyses and with recommendations to further minimize the expected risk. In order to achieve this aim, the research questions need to be answered: What will be the coastal flooding risks and potential adaptive management measures for the buildings in Hong Kong? Specifically,
- (a)
- What will be the exposure and hazard level of coastal flooding in Hong Kong at the end of the 21st century under different scenarios?
- (b)
- What are the characteristics of coastal flooding risks and preparedness of the buildings in Hong Kong?
- (c)
- How to reduce the potential loss through improving the current situation through real estate management measures regarding the future potential flooding risks?
Therefore, the main objectives of this project focused on:
- Understanding the spatial distribution of exposed area and hazard of coastal flooding in Hong Kong in 2080–2100 under SSP 4.5 and SSP 8.5.
- Assessing the flooding hazard, exposure, and readiness of buildings under the two SSPs and categorizing the buildings into several types by considering their risk profiles.
- Analyzing the representative risk profiles of building from the results, and hence, discussing implications for real estate management and adaption to 2100.
2. Materials and Methods
2.1. Assessment Framework Design
Exposure of buildings, hazard level of flooding, and readiness are three interested factors of risk in this study. The criteria of those factors are listed in Table 1. The exposure of a building means how many times a building will be a submerged area by coastal flooding. It is related to the estimated frequency of exceedance and submerged areas for different levels of ESL events that will happen from 2080 to 2100. As the indicator for hazard magnitude, water depth needs to be calculated for each building.

Table 1.
Framework for risk assessment.
For calculating the readiness of a building, external preparedness is the main criterion, and it was categorized into flooding control infrastructures and green infrastructures. Municipal flooding control infrastructures include stormwater pumping facilities and stormwater path. Green infrastructures are natural-based solutions, such as mangrove and woodland. The data for those indicators are highly accessible in open databases from the government, and this can narrow down the gap for quantitative tool building.
Stormwater paths and pump stations help to drain water from the land and mitigate the influence of flooding. Each of them was assigned a weighting of 1.5. Green infrastructure plays an important role in resisting sea water inundation. Due to their location and physical characteristics, woods, mangroves, and wetlands can not only reduce the wave heights, like seagrass beds and dunes, but they can also stabilize the shore and dissipate wave energy [64]. Therefore, higher weightings were assigned to those three infrastructures. According to the Hong Kong Green Building Council (HKGBC) [65], storm surge adaption design and ecological environment are two scoring criteria for their BEAM Plus scheme. Therefore, green building certification also was weighted by 1.5 as a criterion representing the preparedness of the property.
2.2. Data Collection and Preprocessing
Appendix C lists all the details about the datasets used for this study. They are primarily collected from open databases and converted into the viable format in ArcGIS. Appendix D shows part of the converted data. Before the datasets have been processed for analysis, some of them were cleaned to remove the missing values, merged due to the incomplete data, or processed to trim the redundant data.
2.3. Data Analysis
2.3.1. ESL and Return Period Estimation
The future ESL was calculated from
where SLR is the maximum projected value of CMIP6 data, while the storm surge was calculated from the historical data from the Hong Kong Observatory (HKO). As HKO [2] has recorded the combination of storm surge and abnormal tide events from 1954 to 2022, the combined value and return period of those two factors were calculated simultaneously in this study. Additionally, the overall tide level shows a significant increase since the 1950s (Appendix E). This trend of increase was proven using a Mann-Kendall test with τ = 0.382 and a two-sided p-value of 3.6955 ×10 −6. An increasing τ and a p-value of less than 0.05 then proves that the tide levels over time show an increasing trend.
ESL = MSL + SLR + Storm surge combined with tide event
According to Dominicis et al.’s study [66], a 0.5–2.1 m SLR can amplify the tide by 5–50 cm in PRD, so this amplification effect of future SLR to tides was obtained from and added for calculation. Historical ESL events in Hong Kong follow the characteristics of the Pareto Distribution (Appendix F). The plotting position formula for calculating the probability of happening and magnitude is Gringorten’s formula
where m is the rank of magnitude for an event and n is the year of observation. This formula was tested with the historical dataset, and it has good performance when calculating the data in the tail end. With the estimated probability, the frequency of exceedance of flooding in the 20-year interval was calculated.
(m − 0.44)/(n + 0.12)
2.3.2. Spatial Analysis: Magnitude and Readiness
With digital elevation model data for Hong Kong, the submerged area and buildings of inundation can be identified. Meanwhile, the water depth was calculated by subtracting the flooding water level by the altitude of each building. The water depth multiplied by flooding frequency of exceedance produces the hazard index for buildings to generate a raster hazard map. Those hazard maps were expected to be further multiplied by Hong Kong’s local variance of possibility. However, due to the low quality of site-based data to process spatial interpolation, the local variance has been presented only for visual interpretation.
In ArcGIS, near analysis was mainly used for quantifying readiness. It can help identify those buildings located in the buffer area or service area of infrastructure. Those municipal constructions can serve limited areas regarding their drainage capacity. For example, each pump station has a storage capacity of 10,000 to 60,000 m3, which is designed to serve the flood black spots of 1 to 6 hectares [67], so the service buffer was set to 200 m. As for the large-scale green infrastructures, namely marshes and mangroves, the size of their buffer area is positively correlated to their own size. Therefore, the green infrastructures are classified according to their size, and hence, to create buffer regions. The green infrastructures that can reduce storm surge level have larger buffer areas, up to 1 km, because most of the buildings near the shore will have a lower risk if the flooding event is milder.
It is worth mentioning that the outputs for near analysis have two types. The distance was calculated to an infrastructure that has a drainage effect because the flatness and the concrete surface of the inner city can reduce the drainage efficiency when the distance to infrastructure is longer. Therefore, the score is the reciprocal of distance. Another type represents the presence or absence of those flood-reducing infrastructures as they have nothing to do with drainage efficiency, and the score is either 0 or 1. The sum of those scores is the readiness index.
2.3.3. Clustering Analysis
This study adopted Two-Step Cluster Analysis (TSCA) regarding the characteristics of the processed dataset. TSCA is a method for classifying the dataset with categorical and continuous variables [68]. In order to reduce the overlapping of variables and improve the performance of classification, the three criteria of readiness were selected as variables. Among them, green building is a categorical variable. Moreover, the flooding events were divided into small and large events with a threshold of 5 m height. The frequency of exceedance for small and large events and hazard index under SSP 4.5 and SSP 8.5 are the other 6 continuous variables. For those continuous variables, min-max normalization was performed before clustering analysis. Around 7 clusters are optimal for flooding studies [69] In our case, 8 clusters yielded sound results and were thus retained. In urban flooding studies, 8 clusters are appropriate and illuminating [70]. Thus, 8 clusters were generated.
TSCA is executed by the built-in module of SPSS. After classes were assigned to the corresponding building ID, the data were displayed in ArcGIS for validation and further interpretation.
2.4. Research Approach
As listed in Table 2, this study primarily used a quantitative approach for analysis. Excel, ArcGIS, and SPSS were the tools used for data processing. Figure 1 further illustrates the flow of this research.
Table 2.
Research approach for this study.
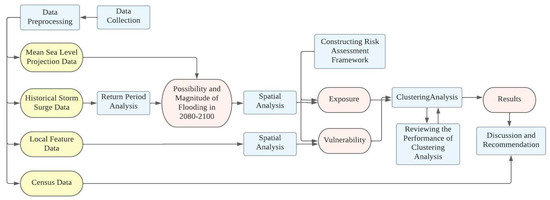
Figure 1.
Research flow chart.
Firstly, the statistical analysis based on historical data was performed to estimate the possibility and magnitude of coastal flooding events from 2080 to 2100 under SSP 4.5 and SSP 8.5. After that, an assessment framework was constructed, considering the research objectives and data availability of Hong Kong. The second part of data analysis is spatial analysis, which is a process to convert feature data and assign the scores of each building for different criteria. Lastly, a clustering analysis was executed in SPSS. The results of classification were projected into ArcGIS for reviewing and interpreting.
In the discussion part, this research identified the key factors forming the vulnerability of each property class. Meanwhile, referring to key stakeholders’ interests and experience of other cities around the world, recommendations were provided.
3. Results
3.1. Spatial Distribution of Flooding Risks
3.1.1. ESL Events
With the influences of future SLR and hazard events added to the current sea level, the ESL under SSP 4.5 ranges up to 6.5 m, while it ranges up to 7 m for SSP 8.5. As shown in Appendix G, the recurrence interval and frequency of exceedance for different levels of events have been calculated. Under SSP 4.5, there will be about 92 times when the sea level could exceed 3 m, and at least one time when the sea level could exceed the current highest level of 5 m. As for SSP 8.5, in 92 events the sea level could be higher than 3.5 m, and for more than three times the sea level could be higher than 5 m. Compared with the historical frequency, a large proportion of sea level events have shifted to the range of 3–4.75 m in the SSP 4.5 scenario, and to 3.5–5 m in the SSP 8.5 scenario.
As shown in Figure 2, if 5 m or higher is a threshold for severe flooding events regarding Hong Kong’s topology, the majority of events for both scenarios are below the threshold, and the frequencies of high values are very low.
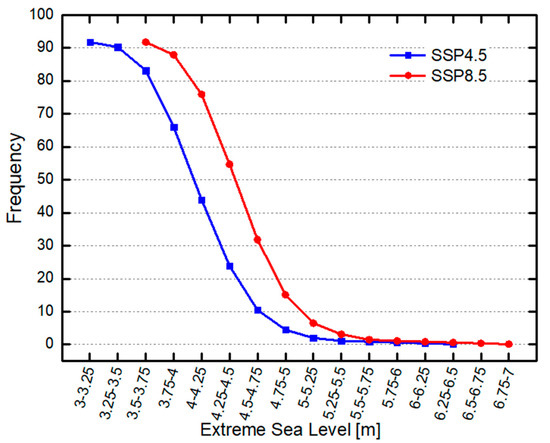
Figure 2.
Estimated frequency of exceedance in 2080–2100.
Although the distribution for high sea level events generally fits the Pareto distribution, errors exist on the low-level side. Since the raw data from HKO did not record the events lower than 1.75 m, there is a lack of data for estimating the lower events for future scenarios, especially for the SSP 8.5 scenario. As a result, this effect can underestimate the influence brought by small flooding events. However, in this study, 98.5% and 95.5% of the threatened buildings have an elevation higher than 3 m and 3.75 m, respectively, which means the influence for this study is relatively low.
3.1.2. Coastal Flooding Exposure
The flooding event data have been used in ArcGIS to generate the map of exposure, which displays the areas of inundation and frequencies of exceedance. The maps for SSP 4.5 (Figure 3) and SSP 8.5 (Figure 4) show that there will be a large proportion of urban area being threatened by coastal flooding. Yuen Long, the coastal area around the Kowloon Peninsula, and the north coast of Hong Kong Island will have high exposure under both scenarios. Specifically, the coastal area of Yuen Long and the northeast coastal area has the highest exposure to flooding. For the southwest of Yuen Long, the low-lying area in Sha Tin and Tai Po, Wong Tai Sin, the coast of Junk Bay, and the reclamation area in Chek Lap Kok, their exposure in SSP 8.5 is significantly higher than in the SSP 4.5 scenario.
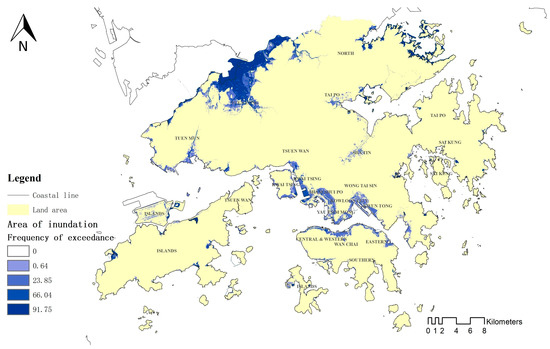
Figure 3.
Coastal flooding exposure map under SSP 4.5.
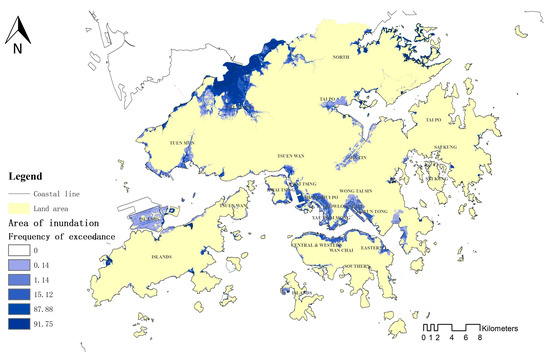
Figure 4.
Coastal flooding exposure map under SSP 8.5.
According to the local variance of sea level in extreme events (Figure 5), Yuen Long, Tai Po, and the southeast islands still have a higher possibility of suffering higher levels of flooding compared with other regions, whereas the possibilities for south Lantau Island and Sai Kung are significantly lower. Those variances are generally consistent with the predicted situation of exposure.
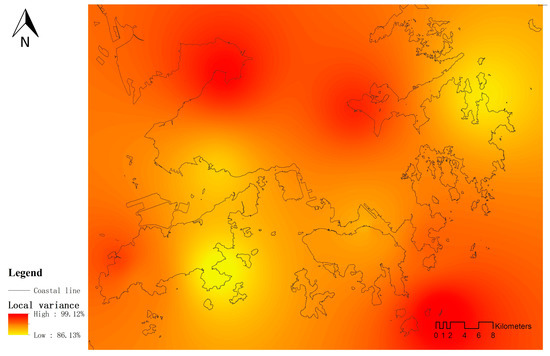
Figure 5.
Local variance of ESL.
3.1.3. Coastal Flooding Hazard Index
Based on the maps of exposure, Figure 6 demonstrates that there will be a considerable number of buildings submerged in the city center. Results from the spatial analysis show that they count 16.3% of the total buildings in Hong Kong under SSP 4.5, and 24.7% of them under SSP 8.5. The data of those buildings were extracted, and hazard maps for threatened buildings have visualized the index of hazard based on the elevation of buildings and the magnitude and exposure of flooding. For better visualization in ArcGIS, the buildings are displayed in simple points feature.
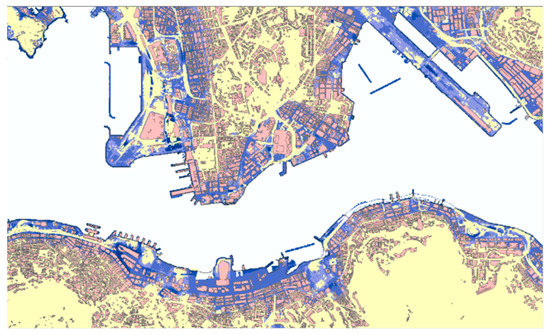
Figure 6.
Overlay of building layer and exposure map of SSP 8.5.
As Figure 7 and Figure 8 illustrated, under SSP 8.5, there will be more buildings suffering from coastal flooding events compared with under SSP 4.5. However, the hazard level for high-risk buildings under SSP 4.5 could be higher than under the SSP 8.5 scenario. Compared to the relatively high exposure in Kowloon Peninsula, the hazard level for buildings in this area is not that distinct, especially in SSP 8.5. The buildings having high hazard level are distributed uniformly. Only Yuen Long has relatively more high-hazard buildings under both scenarios.
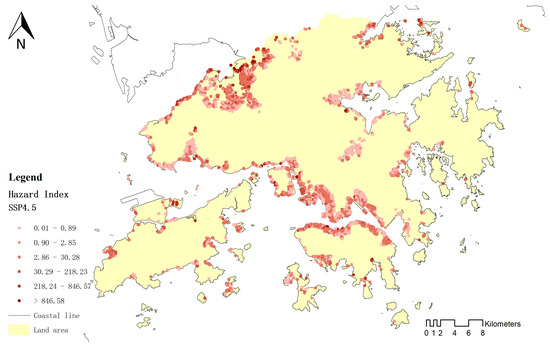
Figure 7.
Map of hazard index for buildings (SSP 4.5).
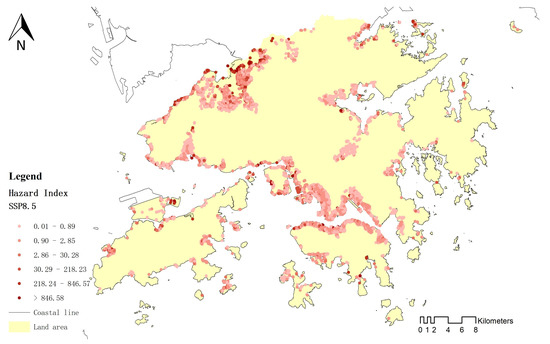
Figure 8.
Map of hazard index for buildings (SSP 8.5).
Additionally, the scatter diagram of hazard data can provide more information. In Figure 9, the distribution of hazard index values was plotted, and outliers were removed. From the data, it is found that there are more values in the middle range of the hazard index, which is between 108 to 460, under SSP 8.5, whereas the values under SSP 4.5 are more concentrated in extremely low or high values. The difference further implies that, compared to SSP 4.5, those buildings having a middle-level of risk will have significantly higher risks in SSP 8.5. Meanwhile, the buildings that have extreme high-risk level under SSP 4.5 will have a higher risk under the SSP 8.5 scenario.
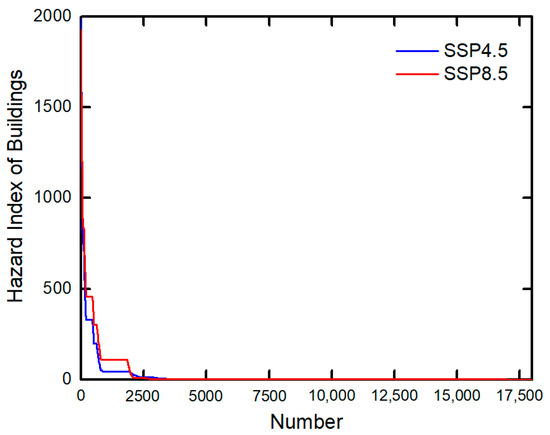
Figure 9.
Hazard data graphics for SSP 4.5 (blue) and SPP 8.5.
3.2. Analysis of Risk Characteristics
3.2.1. Result of Clustering
After performing the near analysis in ArcGIS, the scores of readiness were assigned to the buildings for clustering analysis. Two-Step Clustering classified the 28,001 buildings into eight groups regarding nine variances, which describe the characteristics of exposure, hazard and readiness of a building under two scenarios. Table 3 shows that the size of clusters ranges from 2.5% to 28.2% of the total. Clusters 1, 4, 2, and 6 are small clusters, while clusters 8, 7, 3, and 5 are large clusters, each of which includes more than 4000 threatened buildings.
Table 3.
Cluster distribution.
The visualization of clusters in ArcGIS (Figure 10) and the centroid value from the cluster profile (Appendix H) provide information for describing each cluster.
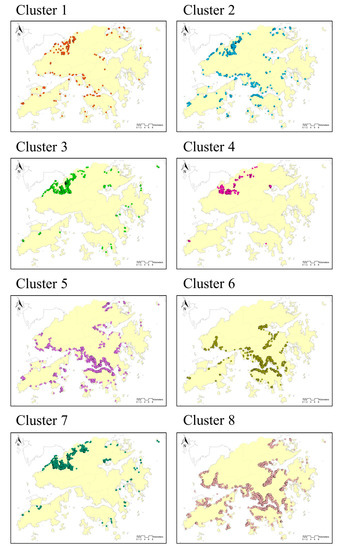
Figure 10.
Maps of buildings and their cluster affiliation.
Buildings in cluster 1 are sparsely distributed near the coastlines around Hong Kong, and partly concentrated in the northwestern area, which is Yuen Long. Those 2.5% of buildings belong to a type of high-risk building that has extremely high exposure and high hazard level under both scenarios. As those buildings are located in the blackspot of stormwater paths and pump stations, their readiness of constructed infrastructure is quite low. However, their readiness of green infrastructure is above the average among all the building types.
Cluster 2 has low scores on both readiness indexes. It has medium-high hazard level, high exposure to large sea level events higher than 5 m, and medium-high exposure to small sea level events. The buildings in this cluster make up 7.4% of the total buildings, and they are evenly distributed in the whole region.
Cluster 3 is a large group that comprises 15.5% of the total buildings. The buildings in this cluster are concentrated in Yuen Long, which is the northwest of Hong Kong. A few of them are also found in rural areas. These buildings are characterized by high readiness of green infrastructures, low readiness of constructed infrastructures, higher hazard level, and exposure to large coastal flooding events under SSP 4.5.
Cluster 4 is a small cluster that has a similar spatial pattern, hazard, exposure, and green readiness characteristics to cluster 3. The difference is that cluster 4 has higher readiness of constructed infrastructures and lower overall hazard and exposure level.
As for cluster 5, it is a large cluster making up 14.3% of the total buildings. The buildings in cluster 5 are evenly distributed in Hong Kong, except for the northwest region. Those buildings have low overall readiness, but meanwhile, the exposure and hazard for this cluster are also low. Large ESL events under SSP 4.5 are the main threat to buildings in this cluster. However, the small sea level events lower than 5 m will not impose risk on them.
Cluster 6 represents a typical building type in the city centers and sub-centers of Hong Kong. On the one hand, buildings of this type have high readiness regarding flooding control facilities, but face an absence of green readiness infrastructures. On the other hand, they are rarely exposed to small flooding events due to the high elevation of the shore. For this cluster type, the hazard level is higher in SSP 4.5 than in SSP 8.5 because of the higher hazard brought by large flooding events. Additionally, it is worth noticing that most of the green buildings were classified into cluster 6.
Cluster 8 has similar characteristics and spatial distribution to cluster 6, but its readiness of constructed infrastructures is significantly lower than that of cluster 8. Cluster 6 and 8 make up 9.6% and 28.2% of the total. In reality, the percentage for cluster 6 should be higher because of the municipal management measures for flooding. This difference is due to the underestimation of the service area of constructed infrastructures and the lack of high-resolution data.
Cluster 7 has low exposure and hazard level under both scenarios. Meanwhile, its readiness of constructed infrastructure is low, and that of green infrastructure is medium-high. Those 18.1% of the total buildings are found in Yuen Long and some other sub-urban areas on the east coast of Hong Kong.
Overall, the display of clustering types in ArcGIS shows that the buildings were efficiently classified into representative groups. The characteristics of each type are clear and different from each other. Nevertheless, the clustering results for type 6 and 8 can be improved in future studies.
3.2.2. Quality of Clustering
The quality of clustering can be evaluated in more detail by focusing on the characteristics of variants and the mean and standard deviation of centroids. The separation of variants is high in terms of the risk analysis dimensions, but relatively lower between the variants of two scenarios, for example, the hazard indexes under two scenarios. In the cluster profile (Appendix H), the centroids show that the clusters are well separated by the readiness of constructed infrastructure, readiness of green infrastructure, and the hazard indexes. Nevertheless, there is still overlapping between clusters 4 and 6 on fields of readiness. On the hazard index fields, the pairs of clusters 3 and 5, 4 and 6, and 7 and 8 also have overlapping between each other. As for the exposure to small and large flooding events, the clusters are separated quite well on those fields. They delineated the combination and characteristics of exposure clearly. On those fields, an overlapping exists between clusters 7 and 8.
The visual interpretation in ArcGIS, centroid analysis, and model summary produced by SPSS (Appendix H) show that the overall quality of clustering analysis is good. Although statistical quality data show that overlapping exists between some clusters, the map visualization shows that the clustering analysis has characterized typical clusters efficiently. Regarding the overlapping, further improvement can be conducted by considering the choices of variants and improving the separation between clusters 4 and 6.
4. Discussion
4.1. Characteristics and Sources of Coastal Flooding Risks
The results obtained so far have provided an overview of the exposure, hazard level, and readiness of buildings under two scenarios. Moreover, the clustering analysis has categorized buildings into mutually exclusive clusters, which reduced the dimensions of cross-comparison and significantly increased the capability of analyzing the large number of buildings.
From the results of clustering, there is an evident difference in spatial distribution between clusters 1 and 2, clusters 3, 4, and 7, and clusters 5, 6, and 8. Some causes of those distributional patterns have been mentioned in the results. This part of the discussion investigates the factors in detail, and hence, guides the recommendation.
The primary cause of the high exposure and hazard level for clusters 1 and 2 is the building’s short distance to the sea, while the determining factor is the very low altitude of the building. The relative position to the sea and the altitude are intrinsic attributes of a building, and they are related to the topography of the urban area. This is the reason why buildings in clusters 1 and 2 can be found sparsely distributed around the whole region, and they are usually surrounded by many other clusters. Therefore, the recommendations need to target a particular building to improve the capability of responding and the resilience of recovery. The attributes of this building type make the buildings more vulnerable to frequent small events, and contribute to a high hazard level of flooding. This implies that the recommendations for clusters 1 and 2 should consider not only the large flooding events, but also need to protect the building from the influences of more frequent small floods.
As for the clusters 3, 4, and 7 and clusters 5, 6, and 8, their distributional patterns are more related to the regional environmental factors. Buildings in clusters 3, 4 and 7 are mainly located in the northwest of Hong Kong, which is Yuen Long. As mentioned above, Yuen Long is a hotspot of coastal flooding risk. It not only has a large area of exposure, but also has many cases of extreme high hazard level. This is due to the topography and land use type in that district.
The coastal area in Yuen Long is gently sloping, and it has not experienced large-scale modification owing to the presence of agricultural lands and natural reserves [71]. Therefore, the buildings are distant from coastlines, which helps prevent them from being flooded by small flooding events. Meanwhile, the construction of stormwater paths has also been restricted near the conservation area. This may be the reason why pump stations are densely distributed around the periphery of those areas (Appendix D).
The local variance of ESL events (Figure 6) further revealed the status of risk in Yuen Long. The average ESL recorded in Yuen Long is significantly higher than in other areas. Moreover, in previous research studying future water level changes, the Deep Bay near Yuen Long has also been identified as the most susceptible sea area in Hong Kong [66]. This evidence suggests high risk level and high potential for improving the relevant infrastructure in this area. Future planning, policy initiatives, and management measures of real estate will need to consider the risks and advantages of ecology in Yuen Long, and the site-specific situation for other spatial outliers.
Although each pair of clusters 3 and 5, 4 and 6, and 7 and 8 have a similar risk profile, the causes are different. Buildings of clusters 5, 6, and 8 are identified on the coasts of Victoria Harbor, Tuen Mun, Tai Po, and Sha Tin, which have experienced large-scale reclamation or coast modification projects since the 1980s (Appendix I). The reclaimed areas usually have a seawall with a steep slope and high height above sea level, which is designed to dissipate the energy of waves and reduce erosion [72]. This may be a reason why the average sea level in those areas is relatively low in Hong Kong (Figure 5). Meanwhile, those areas are urban centers of different districts, which means there is very limited space in their coastal region or in the sea. Recommendations for those clusters cannot be simply drawn from improving the readiness of corresponding infrastructures, but need to consider other initiatives, such as the measures of promoting climate insurance and the improvement of building quality.
4.2. Recommendations for Stakeholders
In recent years, Hong Kong has adopted the Flooding Risk Management (FRM) framework to implement basin-wide drainage planning, increase community preparedness, and design technologies for sustainable flooding control [19]. Under this framework and based on the above results and discussions, recommendations will be provided for the government and real estate companies.
For a new real estate project that is near to the sea and whose elevation is under 5 m, the planner and developer can refer to the risk profile of clusters 1 and 2. They can design civil engineering constructions and extra drainage system that will reduce the vulnerability brought by very frequent small floods and severe large floods. Moreover, the developer can target homebuyers’ willingness to pay for the waterfront to improve the building quality and its brand image. This strategy can partly offset a high rate of insurance due to the high direct and indirect loss of property and reduce the consequential loss of market competitiveness.
Additionally, the clustering result of green buildings shows that the certified building have high readiness of constructed infrastructure and relatively low risks. Together with the standard of the BEAM scheme [65], this implies that promoting the recognition of green buildings is likely to incentivize the developers to optimize site selection and improve the quality of buildings.
For the buildings of clusters 3 and 4, the government can further their advantages of high green infrastructure readiness in Yuen Long and other areas. It can learn from the ABC water strategy of Singapore to incorporate green creativity into FRM [73]. This type of value investment strategy integrates the blue-green infrastructure into the environment to enrich the ecological and recreational functions of the stormwater path [74]. It can become a substitution for sustainable flooding control and change the current peripheral distribution of constructed infrastructure in the areas such as Yuen Long. To implement the construction, more investment should be allocated to cluster 3 as it is a large cluster that has a higher hazard level and lower readiness. Under SSP 4.5, the design of water paths should use a higher standard of flood drainage.
Differently, the coastal flooding control for those buildings in urban centers, such as clusters 5 and 6, are not suitable for the abovementioned strategies. In addition to the upgrades of building quality and drainage facilities for reducing the direct loss and indirect loss, introducing property insurance is a recommended alternative. However, due to the lack of supportive policy, the availability of flooding insurance in Hong Kong is currently low. This study recommends that the government can learn from the UK [61] and New York [19] to promote different premium packages regarding coastal flooding risk, especially under SSP 4.5, which can bring a higher risk than SSP 8.5. Real estate companies and homeowners are also recommended to choose suitable premium packages for their properties.
Clusters 7 and 8 are two types that have the lowest exposure and hazard level. The direct loss for those two building types is low, but there might be some operational expense on emergency management. Therefore, improving the emergency plan and building community awareness can be promoted. This is also an alternative that can be promoted for all types of buildings.
Taken together, different building types need various solutions for risk management regarding their risk profile and site-specific situation. It is worth mentioning that the stakeholders need follow-up monitoring of possible trend changes so that they can adjust to appropriate strategies under climate scenarios.
4.3. Limitations and Future Research
The findings and recommendations above are subject to some limitations. Firstly, the lack of open data is a major limitation of risk assessment. For example, the absence of sea level records under 1.75 m has led to an underestimation of small floods occurrence, which drove down the risk levels of clusters 1 and 2. The unavailability of some other datasets, such as the urban greenery data, has also reduced the accuracy of modelling the readiness, and that is the reason why the woodland dataset was used for substitution.
Secondly, the choices of parameters can also be improved to generate better clustering results. When deciding the service area of constructed infrastructure, the area was set to a small buffer, which has led to inaccuracy in estimating the readiness, and classified many buildings into cluster 5 instead of 6. A more important implication is that choosing the stormwater path and pump station to represent the constructed infrastructure lacks the representability to the complex real-world situation. This study has not done this analysis due to time constraints, while future studies can try to build a hierarchical weighting system for the drainage system in Hong Kong, and thus, produce more accurate results.
Except for the limitations originated in data analysis, the practicability of recommendations is derived from the data analysis. Although it provided potential risk management measures, project-based decision-making processes and monitoring are still important.
Future research can be undertaken to explore cluster type’s correlation with price, housing occupation, tenant migration or education level. Although the author had tried to look for correlations using the Tertiary Planning Units data, the maps did not present any obvious spatial correlation due to the low resolution of Tertiary Planning Units data. It is also unreasonable to fit those data at the property level. Therefore, finding out proper dataset or sampling strategy is a good start for future research. Moreover, for realistic implications, the government or consultancies can build a query platform for flooding risk management based on the clustering results. This can simplify the process of decision-making and preserve insightful information in the meantime.
5. Conclusions
To conclude, this study was undertaken to investigate the future coastal flooding risks for the real estate sector in Hong Kong and provide recommendations for managing the future risks. It is found that up to a quarter of buildings in Hong Kong will be threatened by coastal flooding in 2080–2100, and the majority of them are located in the city center and sub-center areas, such as the Victoria Harbor coast and Yuen Long. With the exposure, hazard level, and infrastructural readiness data assigned to each of the buildings, the buildings were classified into eight cluster types.
In the discussion part, the clusters of buildings were analyzed to find out the reasons resulting in a specific type of risk profile, which includes the land use history and urban morphology. Meanwhile, potentials for managing the risks were identified for the stakeholders based on the risk profile and local situation of clusters. For instance, providing incentives promoting insurance for buildings in clusters 5 and 6 are recommended to the government.
Overall, this research constructed an indicator-based assessment model for the real estate sector regarding future coastal flooding risks. It attempts to incorporate quantitative climate change data into the assessment process. Meanwhile, it filled the gap of needing more decision-making tools for real estate stakeholders in Hong Kong and significantly increased the effectiveness of understanding massive urban data.
Future research can construct a more refined assessment model using appropriate datasets or statistically modelled data. Furthermore, it can investigate the cluster type’s correlation with some socio-economic factors at the building level.
Author Contributions
Conceptualization, Minerva Singh and Xin Cai; Data curation, Xin Cai; Formal analysis, Xin Cai; Investigation, Xin Cai; Methodology, Minerva Singh and Xin Cai; Project administration, Minerva Singh; Resources, Minerva Singh; Supervision, Minerva Singh; Writing—original draft, Xin Cai; Writing—review and editing, Minerva Singh. All authors have read and agreed to the published version of the manuscript.
Funding
This research received no external funding.
Data Availability Statement
The data used can be obtained here: https://drive.google.com/drive/folders/1CuJouloaBY-cYx-dkcNVhIXRCkfrqbxb?usp=share_link (accessed on 23 December 2022).
Conflicts of Interest
The authors declare no conflict of interest.
Appendix A
Table A1.
Plotting position formula [61].
Table A1.
Plotting position formula [61].
| Method | Probability of Exceedence, P | Average Recurrence Interval, T |
|---|---|---|
| California | m/n | n/m |
| Hazen | (m − 0.5)/n | n/(m − 0.5) |
| Weibull | m/(n + 1) | (n + 1)/m |
| Chegodayev | (m − 0.3)/(n + 0.4) | (n + 0.4)/(m − 0.3) |
| Blom | (m − 3/8)/(n + 1/4) | (n + 1/4)/(m − 3/8) |
| Gringorten | (m − 0.44)/(n + 0.12) | (n + 0.12)/(m − 0.44) |
Appendix B

Figure A1.
Conceptual model of coastal flooding risk to buildings [19].
Figure A1.
Conceptual model of coastal flooding risk to buildings [19].

Appendix C
Table A2.
Table of raw data and data sources.
Table A2.
Table of raw data and data sources.
| Category | Data | Source | Type | |
|---|---|---|---|---|
| Flooding prediction | Future climate data under SSP4.5 and 8.5 | Sea level rise | (Fox-Kemper et al., 2021) | Numerical value |
| Historical climate data | Sea level record | (HKO, 2022b) | Numerical record | |
| Storm surge database | ||||
| Tide amplification | (Dominicis et al., 2020) | Numerical value | ||
| Risk assessment | Local data | 5 m digital elevation model | (Lands Department, 2021) | Shapefile |
| Location of tide observatory station | Manually recorded | - | ||
| Building | (Lands Department, 2021) | Shapefile | ||
| Dune restoration areas | Shapefile | |||
| Flooding control infrastructure | Shapefile | |||
| Mangrove | Shapefile | |||
| Sea grass bed | (AFCD, 2021) | Map | ||
| Green building | (HKGBC, 2021) | Building address | ||
| Landcover | (Lands Department, 2021) | Shapefile | ||
| Qualitative analysis | Qualitative data | Reports | - | - |
| Open websites | - | - | ||
| Policy documents | - | - | ||
Appendix D

Figure A2.
Distribution of constructed and green infrastructures.
Figure A2.
Distribution of constructed and green infrastructures.

Appendix E

Figure A3.
Historical level of tide (meters).
Figure A3.
Historical level of tide (meters).

Appendix F

Figure A4.
Historical ESL events.
Figure A4.
Historical ESL events.

Appendix G
Table A3.
Table of recurrence interval and frequency of exceedance for different levels of events.
Table A3.
Table of recurrence interval and frequency of exceedance for different levels of events.
| SSP4.5 | SSP8.5 | ||||
|---|---|---|---|---|---|
| Extreme Sea Level (m) | Frequency of Exceedance (time) | Average Recurrence Interval (years) | Frequency of Exceedance (time) | Average Recurrence Interval (years) | Historical Frequency |
| 3–3.25 | 91.75 | 0.22 | No data | No data | 15.37 |
| 3.25–3.5 | 90.25 | 0.22 | No data | No data | 6.13 |
| 3.5–3.75 | 83.14 | 0.24 | 91.75 | 0.22 | 3.14 |
| 3.75–4 | 66.04 | 0.31 | 87.88 | 0.23 | 1.51 |
| 4–4.25 | 43.95 | 0.46 | 75.90 | 0.26 | 1.14 |
| 4.25–4.5 | 23.85 | 0.88 | 54.68 | 0.37 | 0.89 |
| 4.5–4.75 | 10.50 | 2.02 | 31.84 | 0.65 | 0.64 |
| 4.75–5 | 4.51 | 4.68 | 15.12 | 1.42 | 0.39 |
| 5–5.25 | 2.01 | 10.42 | 6.51 | 3.18 | 0.14 |
| 5.25–5.5 | 1.14 | 17.57 | 3.14 | 6.84 | - |
| 5.5–5.75 | 0.89 | 22.51 | 1.51 | 13.31 | - |
| 5.75–6 | 0.64 | 31.30 | 1.14 | 17.57 | - |
| 6–6.25 | 0.39 | 51.36 | 0.89 | 22.51 | - |
| 6.25–6.5 | 0.14 | 143.07 | 0.64 | 31.30 | - |
| 6.5–6.75 | 0 | - | 0.39 | 51.36 | - |
| 6.75–7 | 0 | - | 0.14 | 143.07 | - |
Appendix H
Table A4.
Cluster Profile.
Table A4.
Cluster Profile.
| Centroids | |||||
| Green_Inf_Score | Constructed_Inf_Score | ||||
| Mean | Std. Deviation | Mean | Std. Deviation | ||
| Cluster | 1 | 0.4645176583 | 0.2512619733 | 0.0605948198 | 0.1339347757 |
| 2 | 0.4350815964 | 0.2505961258 | 0.0463057050 | 0.1214751176 | |
| 3 | 0.5632801059 | 0.0669191738 | 0.0042013062 | 0.0207303980 | |
| 4 | 0.5772796665 | 0.0853719109 | 0.3108347831 | 0.1164582531 | |
| 5 | 0.0589767462 | 0.0999676423 | 0.0079357425 | 0.0274109394 | |
| 6 | 0.0118858385 | 0.0508670896 | 0.3215528210 | 0.1112618549 | |
| 7 | 0.5473243087 | 0.0502970432 | 0.0050557840 | 0.0204797062 | |
| 8 | 0.0493772322 | 0.0939848181 | 0.0063556892 | 0.0244509358 | |
| Combined | 0.2797722611 | 0.2695964133 | 0.0544336122 | 0.1240818137 | |
| Centroids | |||||
| Small Event SSP 4.5 | Large Event SSP 4.5 | ||||
| Mean | Std. Deviation | Mean | Std. Deviation | ||
| Cluster | 1 | 0.9755303378 | 0.1235623460 | 1.0000000000 | 0.0000000000 |
| 2 | 0.3524950927 | 0.0000000000 | 1.0000000000 | 0.0000000000 | |
| 3 | 0.0000000000 | 0.0000000000 | 1.0000000000 | 0.0000000000 | |
| 4 | 0.0000000000 | 0.0000000000 | 0.3586836831 | 0.4419920241 | |
| 5 | 0.0000000000 | 0.0000000000 | 1.0000000000 | 0.0000000000 | |
| 6 | 0.0000000000 | 0.0000000000 | 0.4259523381 | 0.4688937406 | |
| 7 | 0.0000000000 | 0.0000000000 | 0.0478942517 | 0.0588723157 | |
| 8 | 0.0000000000 | 0.0000000000 | 0.0487362778 | 0.0590389025 | |
| Combined | 0.0499900800 | 0.1744467136 | 0.4757952963 | 0.4751547113 | |
| Centroids | |||||
| Small Event SSP 8.5 | Large Event SSP 8.5 | ||||
| Mean | Std. Deviation | Mean | Std. Deviation | ||
| Cluster | 1 | 0.9801540233 | 0.1002145194 | 1.0000000000 | 0.0000000000 |
| 2 | 0.3524950927 | 0.0000000000 | 1.0000000000 | 0.0000000000 | |
| 3 | 0.4748449245 | 0.0000000000 | 0.0230994891 | 0.0000000000 | |
| 4 | 0.0000000000 | 0.0000000000 | 0.0120117396 | 0.0095643814 | |
| 5 | 0.0000000000 | 0.0000000000 | 0.0230994891 | 0.0000000000 | |
| 6 | 0.0000000000 | 0.0000000000 | 0.0124863016 | 0.0101430520 | |
| 7 | 0.0000000000 | 0.0000000000 | 0.0056149324 | 0.0069019571 | |
| 8 | 0.0000000000 | 0.0000000000 | 0.0057136482 | 0.0069214871 | |
| Combined | 0.0591354033 | 0.1923543464 | 0.1096378780 | 0.2942846165 | |
| Centroids | |||||
| Hazard Index SSP 8.5 | Hazard Index SSP 8.5 | ||||
| Mean | Std. Deviation | Mean | Std. Deviation | ||
| Cluster | 1 | 443.4320640 | 383.0951058 | 353.5613576 | 385.8927786 |
| 2 | 97.43114152 | 97.34005910 | 48.92406200 | 67.12296271 | |
| 3 | 1.121440697 | 0.5442923250 | 4.651526525 | 5.816017925 | |
| 4 | 0.4776370161 | 0.5099163045 | 1.200902100 | 2.835063784 | |
| 5 | 1.050332457 | 0.7249202712 | 4.441316414 | 7.541842340 | |
| 6 | 0.4987326510 | 0.5118573014 | 1.312858942 | 2.516747499 | |
| 7 | 02100954671 | 0.3548501279 | 0.1665549074 | 0.5277449115 | |
| 8 | 0.2215145317 | 0.3907466925 | 0.1797211840 | 0.6213871392 | |
| Combined | 18.58141780 | 97.40475880 | 13.91542262 | 84.03370024 | |
| Green_Building | |||||
| 0 | 1 | ||||
| Frequency | Percent | Frequency | Percent | ||
| Cluster | 1 | 687 | 2.5% | 1 | 2.3% |
| 2 | 2066 | 7.4% | 1 | 2.3% | |
| 3 | 4342 | 15.5% | 0 | 0% | |
| 4 | 1288 | 4.6% | 0 | 0% | |
| 5 | 3997 | 14.3% | 0 | 0% | |
| 6 | 2635 | 9.4% | 42 | 95.5% | |
| 7 | 5059 | 18.1% | 0 | 0% | |
| 8 | 7883 | 28.2% | 0 | 0% | |
| Combined | 27,957 | 100.0% | 44 | 100% | |

Figure A5.
Model summary and Cluster quality.
Figure A5.
Model summary and Cluster quality.

Appendix I

Figure A6.
Reclamation land in Hong Kong [45].
Figure A6.
Reclamation land in Hong Kong [45].

References
- Shah, B.V. Is the environment becoming more hazardous? A global survey 1947 to 1980. Disasters 1983, 7, 202–209. [Google Scholar] [CrossRef]
- Hong Kong Observatory. Global Climate Projections: Tropical Cyclones. Available online: https://www.hko.gov.hk/en/climate_change/proj_global_tc.htm (accessed on 1 September 2022).
- National Oceanic and Atmospheric Administration. Introduction to Storm Surge. Available online: https://www.weather.gov/media/owlie/surge_intro.pdf (accessed on 24 July 2022).
- Drews, C.; Galarneau, T.J., Jr. Directional analysis of the storm surge from hurricane sandy 2012, with applications to Charleston, New Orleans, and the Philippines. PLoS ONE 2015, 10, e0122113. [Google Scholar] [CrossRef]
- Chen, J.; Wang, Z.; Tam, C.; Lau, N.; Lau, D.D.; Mok, H. Impacts of climate change on tropical cyclones and induced storm surges in the Pearl River Delta region using pseudo-global-warming method. Sci. Rep. 2020, 10, 1965. [Google Scholar] [CrossRef]
- Kan, W.S.; Lejano, R.P. How land use, climate change, and an ageing demographic intersect to create new vulnerabilities in Hong Kong. Land 2021, 10, 391. [Google Scholar] [CrossRef]
- Hong Kong Observatory. Storm Surge. Available online: https://www.hko.gov.hk/en/publica/gen_pub/files/storm_surge.pdf (accessed on 24 July 2022).
- Fox-Kemper, B.; Hewitt, H.T.; Xiao, C.; Aðalgeirsdóttir, G.; Drijfhout, S.S.; Edwards, T.L.; Golledge, N.R.; Hemer, M.; Kopp, R.E.; Krinner, G.; et al. Ocean, Cryosphere and Sea Level Change. In Climate Change 2021: The Physical Science Basis. Contribution of Working Group I to the Sixth Assessment Report of the Intergovernmental Panel on Climate Change; Masson-Delmotte, V., Zhai, P., Pirani, A., Connors, S.L., Péan, C., Berger, S., Caud, N., Chen, Y., Goldfarb, L., Gomis, M.I., et al., Eds.; Cambridge University Press: Cambridge, UK, 2021. [Google Scholar]
- Knutson, T.; Camargo, S.J.; Chan, J.C.; Emanuel, K.; Ho, C.H.; Kossin, J.; Mohapatra, M.; Satoh, M.; Sugi, M.; Walsh, K.; et al. Tropical cyclones and climate change assessment: Part II: Projected response to anthropogenic warming. Bull. Am. Meteorol. Soc. 2020, 101, E303–E322. [Google Scholar] [CrossRef]
- Kirezci, E.; Young, I.R.; Ranasinghe, R.; Muis, S.; Nicholls, R.J.; Lincke, D.; Hinkel, J. Projections of global-scale extreme sea levels and resulting episodic coastal flooding over the 21st Century. Sci. Rep. 2020, 10, 11629. [Google Scholar] [CrossRef] [PubMed]
- Hausfather, Z.; Drake, H.F.; Abbott, T.; Schmidt, G.A. Evaluating the performance of past climate model projections. Geophys. Res. Lett. 2020, 47, e2019GL085378. [Google Scholar] [CrossRef]
- Johnson, K.; Depietri, Y.; Breil, M. Multi-hazard risk assessment of two Hong Kong districts. IJDRR 2016, 19, 311–323. [Google Scholar] [CrossRef]
- IPCC. Climate Change 2014: Synthesis Report. Contribution of Working Groups I, II and III to the Fifth Assessment Report of the Intergovernmental Panel on Climate Change; IPCC: Geneva, Switzerland; pp. 117–130.
- The United Nations Office for Disaster Risk Reduction. Proposed Updated Terminology on Disaster Risk Reduction: A Technical Review. Available online: https://www.preventionweb.net/files/45462_backgoundpaperonterminologyaugust20.pdf (accessed on 4 August 2022).
- Chan, F.K.S.; Mitchell, G.; Cheng, X.; Adekola, O.; McDonald, A. Developing a sustainable flood risk appraisal (SFRA) framework for the Pearl River Delta. Environ. Urban. Asia 2013, 4, 301–323. [Google Scholar] [CrossRef]
- Yang, L.; Scheffran, J.; Qin, H.; You, Q. Climate-related flood risks and urban responses in the Pearl River Delta, China. Reg. Environ. Chang. 2015, 15, 379–391. [Google Scholar] [CrossRef]
- Sim, T.; Wang, D.; Han, Z. Assessing the disaster resilience of megacities: The case of Hong Kong. Sustainability 2018, 10, 1137. [Google Scholar] [CrossRef]
- Guo, C.; Sim, T.; Ho, H.C. Impact of information seeking, disaster preparedness and typhoon emergency response on perceived community resilience in Hong Kong. IJDRR 2020, 50, 101744. [Google Scholar] [CrossRef]
- Chan, F.K.S.; Chuah, C.J.; Ziegler, A.D.; Dąbrowski, M.; Varis, O. Towards resilient flood risk management for Asian coastal cities: Lessons learned from Hong Kong and Singapore. J. Clean. Prod. 2018, 187, 576–589. [Google Scholar] [CrossRef]
- Financial Stability Board. Task Force on Climate-Related Financial Disclosures: 2019 Status Report. Available online: https://apo.org.au/node/240501 (accessed on 4 September 2022).
- Surminski, Y.S.; Westcott, M.; Ward, J.; Sayers, P.; Bresch, D.; Clare, B. Be prepared–exploring future climate-related risk for residential and commercial real-estate portfolios. JAI 2020, 23, 24–34. [Google Scholar]
- Jongman, B.; Ward, P.J.; Aerts, J.C. Global exposure to river and coastal flooding: Long term trends and changes. Glob. Environ. Chang. 2012, 22, 823–835. [Google Scholar] [CrossRef]
- Yu, Q.; Lau, A.K.; Tsang, K.T.; Fung, J.C. Human damage assessments of coastal flooding for Hong Kong and the Pearl River Delta due to climate change-related sea level rise in the twenty-first century. Nat. Hazards 2018, 92, 1011–1038. [Google Scholar] [CrossRef]
- Kron, W. Flood risk = hazard × exposure × vulnerability. Water Int. 2005, 30, 58–68. [Google Scholar] [CrossRef]
- Un, G. Living with Risk: A Global Review of Disaster Reduction Initiatives. Available online: https://www.unisdr.org/files/657_lwr1.pdf (accessed on 4 September 2022).
- Bonadonna, C.; Frischknecht, C.; Menoni, S.; Romerio, F.; Gregg, C.E.; Rosi, M.; Biass, S.; Asgary, A.; Pistolesi, M.; Guobadia, D. Integrating hazard, exposure, vulnerability and resilience for risk and emergency management in a volcanic context: The ADVISE model. J. Appl. Volcanol. 2021, 10, 1–34. [Google Scholar] [CrossRef]
- Tiernan, A.; Drennan, L.; Nalau, J.; Onyango, E.; Morrissey, L.; Mackey, B. A review of themes in disaster resilience literature and international practice since 2012. PDP 2019, 2, 53–74. [Google Scholar] [CrossRef]
- Moret, W. Vulnerability Assessment Methodologies: A Review of the Literature; FHI: Washington, DC, USA, 2014. [Google Scholar]
- Fekete, A.; Damm, M.; Birkmann, J. Scales as a challenge for vulnerability assessment. Nat. Hazards 2010, 55, 729–747. [Google Scholar] [CrossRef]
- Paton, D.; Johnston, D. Disaster Resilience: An Integrated Approach; Charles C Thomas Publisher: Springfield, IL, USA, 2017. [Google Scholar]
- Nasiri, H.; Mohd, J.M.Y.; Thamer, A.M.A. An overview to flood vulnerability assessment methods. SWAM 2016, 2, 331–336. [Google Scholar] [CrossRef]
- Keenan, J.M. Adaptive capacity of commercial real estate firms in New York City to urban flooding. J. Water Clim. Chang. 2015, 6, 486–500. [Google Scholar] [CrossRef]
- McNamara, D.E.; Gopalakrishnan, S.; Smith, M.D.; Murray, A.B. Climate adaptation and policy-induced inflation of coastal property value. PloS ONE 2015, 10, e0121278. [Google Scholar] [CrossRef]
- Li, M.; Zhang, F.; Barnes, S.; Wang, X. Assessing storm surge impacts on coastal inundation due to climate change: Case studies of Baltimore and Dorchester County in Maryland. Nat. Hazards 2020, 103, 2561–2588. [Google Scholar] [CrossRef]
- McAlpine, S.A.; Porter, J.R. Estimating recent local impacts of sea-level rise on current real-estate losses: A housing market case study in Miami-Dade, Florida. PRPR 2018, 37, 871–895. [Google Scholar] [CrossRef]
- Conyers, Z.A.; Grant, R.; Roy, S.S. Sea Level Rise in Miami Beach: Vulnerability and Real Estate Exposure. Prof. Geogr. 2019, 71, 278–291. [Google Scholar] [CrossRef]
- Paulik, R.; Stephens, S.; Wild, A.; Wadhwa, S.; Bell, R.G. Cumulative building exposure to extreme sea level flooding in coastal urban areas. IJDRR 2021, 66, 102612. [Google Scholar] [CrossRef]
- Kopp, R.E.; Horton, R.M.; Little, C.M.; Mitrovica, J.X.; Oppenheimer, M.; Rasmussen, D.J.; Strauss, B.H.; Tebaldi, C. Probabilistic 21st and 22nd century sea-level projections at a global network of tide-gauge sites. Earth’s Future 2014, 2, 383–406. [Google Scholar] [CrossRef]
- Katsman, C.A.; Sterl, A.; Beersma, J.J.; Van den Brink, H.W.; Church, J.A.; Hazeleger, W.; Kopp, R.E.; Kroon, D.; Kwadijk, J.; Lammersen, R.; et al. Exploring high-end scenarios for local sea level rise to develop flood protection strategies for a low-lying delta: The Netherlands as an example. Clim. Chang. 2011, 109, 617–645. [Google Scholar] [CrossRef]
- Wang, J.; Gao, W.; Xu, S.; Yu, L. Evaluation of the combined risk of sea level rise, land subsidence, and storm surges on the coastal areas of Shanghai, China. Clim. Chang. 2012, 115, 537–558. [Google Scholar] [CrossRef]
- Tebaldi, C.; Strauss, B.H.; Zervas, C.E. Modelling sea level rise impacts on storm surges along US coasts. Environ. Res. Lett. 2012, 7, 014032. [Google Scholar] [CrossRef]
- Hong Kong Observatory. Mean Sea Level Projection Data for Hong Kong. Available online: https://www.hko.gov.hk/en/climate_change/proj_hk_msl_med_conf_info.htm (accessed on 1 September 2022).
- NOAA National Centers for Environmental Information, Monthly Global Climate Report for December 2021. Available online: https://journals.ametsoc.org/view/journals/bams/103/8/BAMS-D-22-0078.1.xml (accessed on 4 September 2022). [CrossRef]
- Fuller, W.E. Flood flows. Trans. Am. Soc. Civil Eng. 1914, 77, 564–617. [Google Scholar] [CrossRef]
- Selaman, O.S.; Said, S.; Putuhena, F.J. Flood frequency analysis for Sarawak using Weibull, Gringorten and L-moments formula. J. Inst. Eng. 2007, 68, 43–52. [Google Scholar]
- Onen, F.; Bagatur, T. Prediction of flood frequency factor for Gumbel distribution using regression and GEP model. AJSE 2017, 42, 3895–3906. [Google Scholar] [CrossRef]
- Gordon, N.D.; McMahon, T.A.; Finlayson, B.L.; Gippel, C.J.; Nathan, R.J. Stream Hydrology: An Introduction for Ecologists; John Wiley and Sons: New York, NY, USA, 2004. [Google Scholar]
- Makkonen, L. Plotting positions in extreme value analysis. JAMC 2006, 45, 334–340. [Google Scholar] [CrossRef]
- Cook, N. Comments on “Plotting positions in extreme value analysis”. JAMC 2011, 50, 255–266. [Google Scholar] [CrossRef]
- Zennaro, F.; Furlan, E.; Simeoni, C.; Torresan, S.; Aslan, S.; Critto, A.; Marcomini, A. Exploring machine learning potential for climate change risk assessment. Earth Sci. Rev. 2021, 220, 103752. [Google Scholar] [CrossRef]
- Fatho. A New Benchmark in Global Flood Mapping. Available online: https://www.fathom.global/ (accessed on 1 September 2022).
- Climate, X. Global Climate Risk Data Analytics Platform, Developed by Climate Scientists. Available online: https://www.climate-x.com/ (accessed on 1 September 2022).
- Matheswaran, K.; Alahacoon, N.; Pandey, R.; Amarnath, G. Flood risk assessment in South Asia to prioritize flood index insurance applications in Bihar, India. Geomat. Nat. Hazards Risk 2018, 10, 26–48. [Google Scholar] [CrossRef]
- Inyang, U.G.; Akpan, E.E.; Akinyokun, O.C. A hybrid machine learning approach for flood risk assessment and classification. Int. J. Comput. Intell. 2020, 19, 2050012. [Google Scholar] [CrossRef]
- Li, C.; Sun, L.; Jia, J.; Cai, Y.; Wang, X. Risk assessment of water pollution sources based on an integrated k-means clustering and set pair analysis method in the region of Shiyan, China. Sci. Total Environ. 2016, 557, 307–316. [Google Scholar] [CrossRef]
- Khorshidi, N.; Parsa, M.; Lentz, D.R.; Sobhanverdi, J. Identification of heavy metal pollution sources and its associated risk assessment in an industrial town using the K-means clustering technique. Appl. Geochemistry 2021, 135, 105113. [Google Scholar] [CrossRef]
- MacQueen, J. Classification and analysis of multivariate observations. In Proceedings of the 5th Berkeley Symposium on Mathematical Statistics and Probability, Los Angeles, CA, USA, 21 June–18 July 1965 and 27 December 1965–7 January 1966. [Google Scholar]
- Xu, H.; Ma, C.; Lian, J.; Xu, K.; Chaima, E. Urban flooding risk assessment based on an integrated k-means cluster algorithm and improved entropy weight method in the region of Haikou, China. J. Hydrol. 2018, 563, 975–986. [Google Scholar] [CrossRef]
- Warren-Myers, G.; Hurlimann, A. Climate change and risk to real estate. In A Research Agenda for Real Estate; Edward Elgar Publishing: Cheltenham, UK, 2022. [Google Scholar]
- Kron, W.; Steuer, M.; Löw, P.; Wirtz, A. How to deal properly with a natural catastrophe database–analysis of flood losses. NHESS 2012, 12, 535–550. [Google Scholar] [CrossRef]
- Van Der Plank, S.; Brown, S.; Nicholls, R.J. Managing coastal flood risk to residential properties in England: Integrating spatial planning, engineering and insurance. IJDRR 2021, 52, 101961. [Google Scholar] [CrossRef]
- Chandra-Putra, H.; Andrews, C.J. An integrated model of real estate market responses to coastal flooding. J. Ind. Ecol. 2020, 24, 424–435. [Google Scholar] [CrossRef]
- Bunten, D.M.; Kahn, M.E. Optimal real estate capital durability and localized climate change disaster risk. J. Hous. Econ. 2017, 36, 1–7. [Google Scholar] [CrossRef]
- Ruckelshaus, M.H.; Guannel, G.; Arkema, K.; Verutes, G.; Griffin, R.; Guerry, A.; Silver, J.; Faries, J.; Brenner, J.; Rosenthal, A. Evaluating the benefits of green infrastructure for coastal areas: Location, location, location. Coastal Manag. 2016, 44, 504–516. [Google Scholar] [CrossRef]
- Hong Kong Green Building Council. Beam Plus New Building. Available online: https://www.beamsociety.org.hk/files/download/BP_NBv2.0(2021%20Edition)_sc_20220215.pdf (accessed on 18 August 2022).
- Dominicis, M.D.; Wolf, J.; Jevrejeva, S.; Zheng, P.; Hu, Z. Future Interactions Between Sea Level Rise, Tides, and Storm Surges in the World’s Largest Urban Area. Geophys. Res. Lett. 2020, 47, e2020GL087002. [Google Scholar] [CrossRef]
- Drainage Services Department. Stormwater Drainage Manual. Available online: https://www.dsd.gov.hk/EN/Files/Technical_Manual/technical_manuals/Stormwater_Drainage_Manual_Eurocodes.pdf (accessed on 24 August 2022).
- IBM. Choosing a Procedure for Clustering. Available online: https://www.ibm.com/docs/en/spss-statistics/25.0.0?topic=features-choosing-procedure-clustering (accessed on 18 August 2022).
- Sikorska-Senoner, A.E. Clustering model responses in the frequency space for improved simulation-based flood risk studies: The role of a cluster number. J. Flood Risk Manag. 2022, 15, e12772. [Google Scholar] [CrossRef]
- Mwingnè, L.C.D.; Hugues, H.; Marion, A.; Aude, N.; Elodie, R.; Emmanuel, B. Revealing social vulnerability profiles for urban flood management: The case of Ouagadougou (Burkina Faso). Cybergeo 2022. [Google Scholar] [CrossRef]
- World Wildlife Fund. Mai Po Nature Reserve. Available online: https://www.wwf.org.hk/en/wetlands/mai-po/ (accessed on 4 September 2022).
- Zhu, S.; Chwang, A.T. Investigations on the reflection behaviour of a slotted seawall. Coast. Eng. 2001, 43, 93–104. [Google Scholar] [CrossRef]
- Liao, K.H. The socio-ecological practice of building blue-green infrastructure in high-density cities: What does the ABC Waters Program in Singapore tell us? SEPR 2019, 1, 67–81. [Google Scholar] [CrossRef]
- Public Utilities Board. Active Beautiful Clean Waters: Design Guidelines; PUB: Singapore, 2014.


Disclaimer/Publisher’s Note: The statements, opinions and data contained in all publications are solely those of the individual author(s) and contributor(s) and not of MDPI and/or the editor(s). MDPI and/or the editor(s) disclaim responsibility for any injury to people or property resulting from any ideas, methods, instructions or products referred to in the content. |
© 2023 by the authors. Licensee MDPI, Basel, Switzerland. This article is an open access article distributed under the terms and conditions of the Creative Commons Attribution (CC BY) license (https://creativecommons.org/licenses/by/4.0/).