
Identifying Suitable Watersheds across Nigeria Using Biophysical Parameters and Machine Learning Algorithms for Agri–Planning

 ,
,  ,
,  ,
,
Abstract
:1. Introduction
2. Materials and Methods
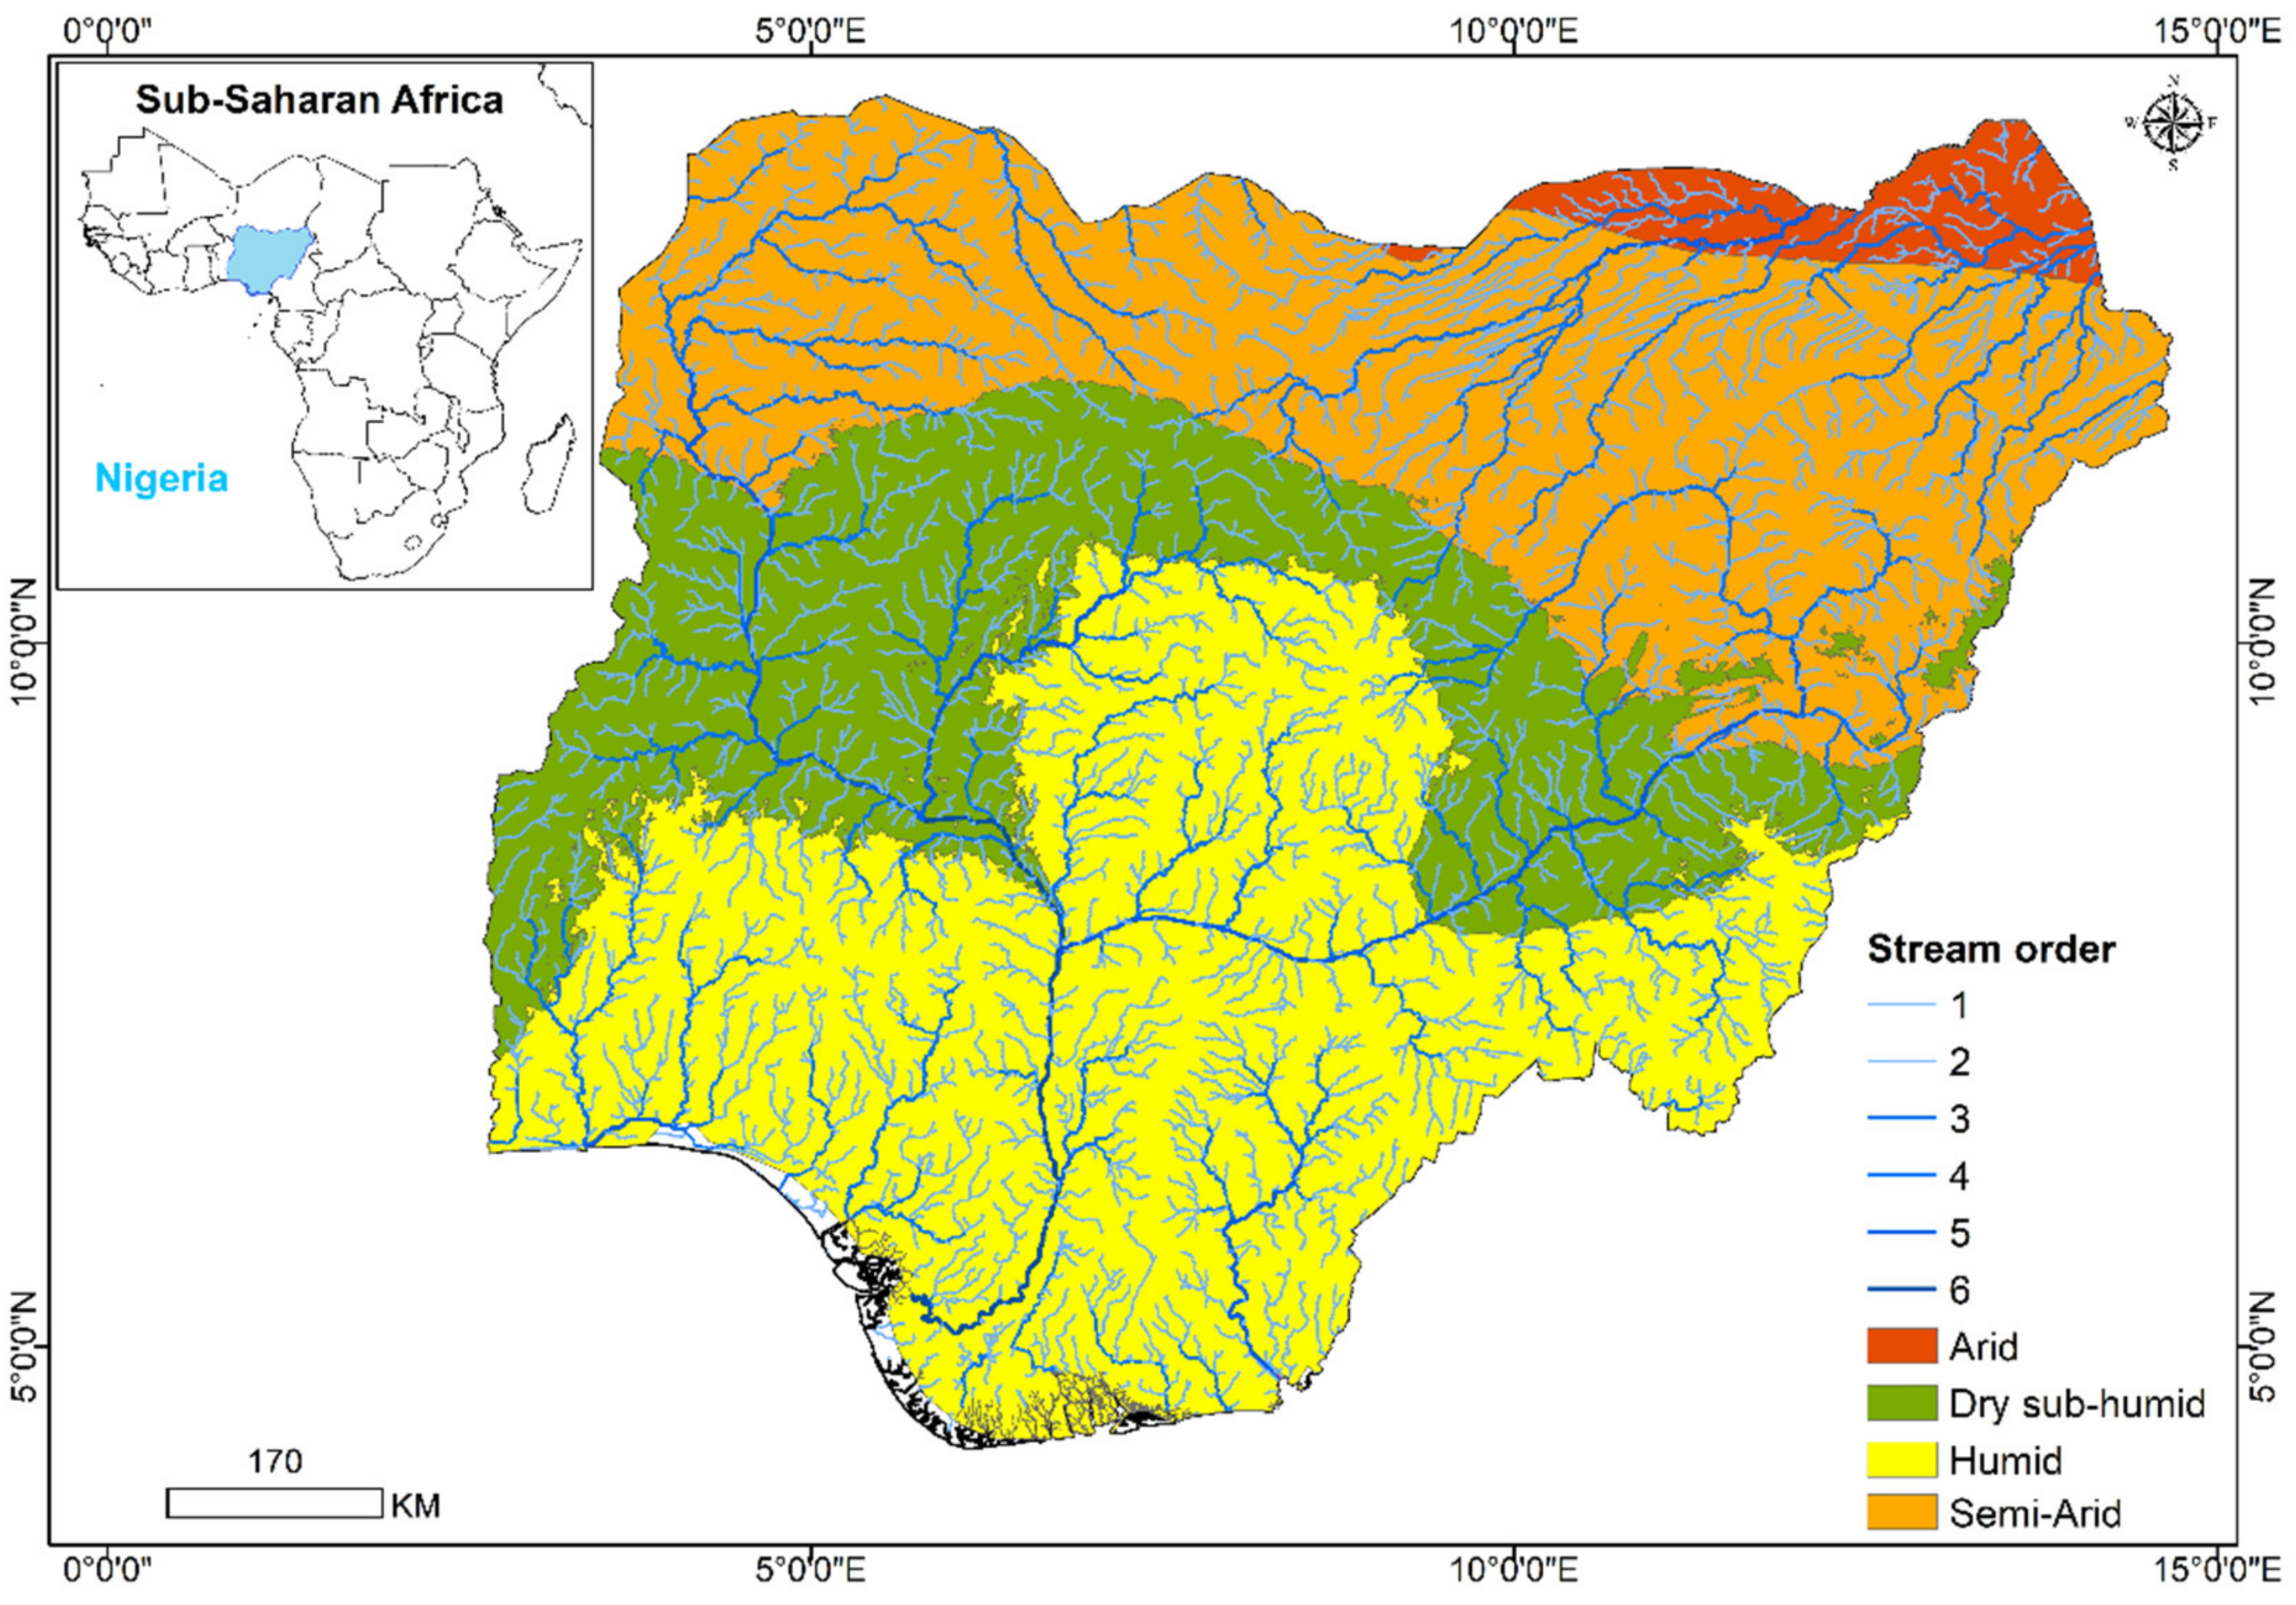
2.1. Study Area
2.2. Methodology
2.3. Criteria and Determining Factors
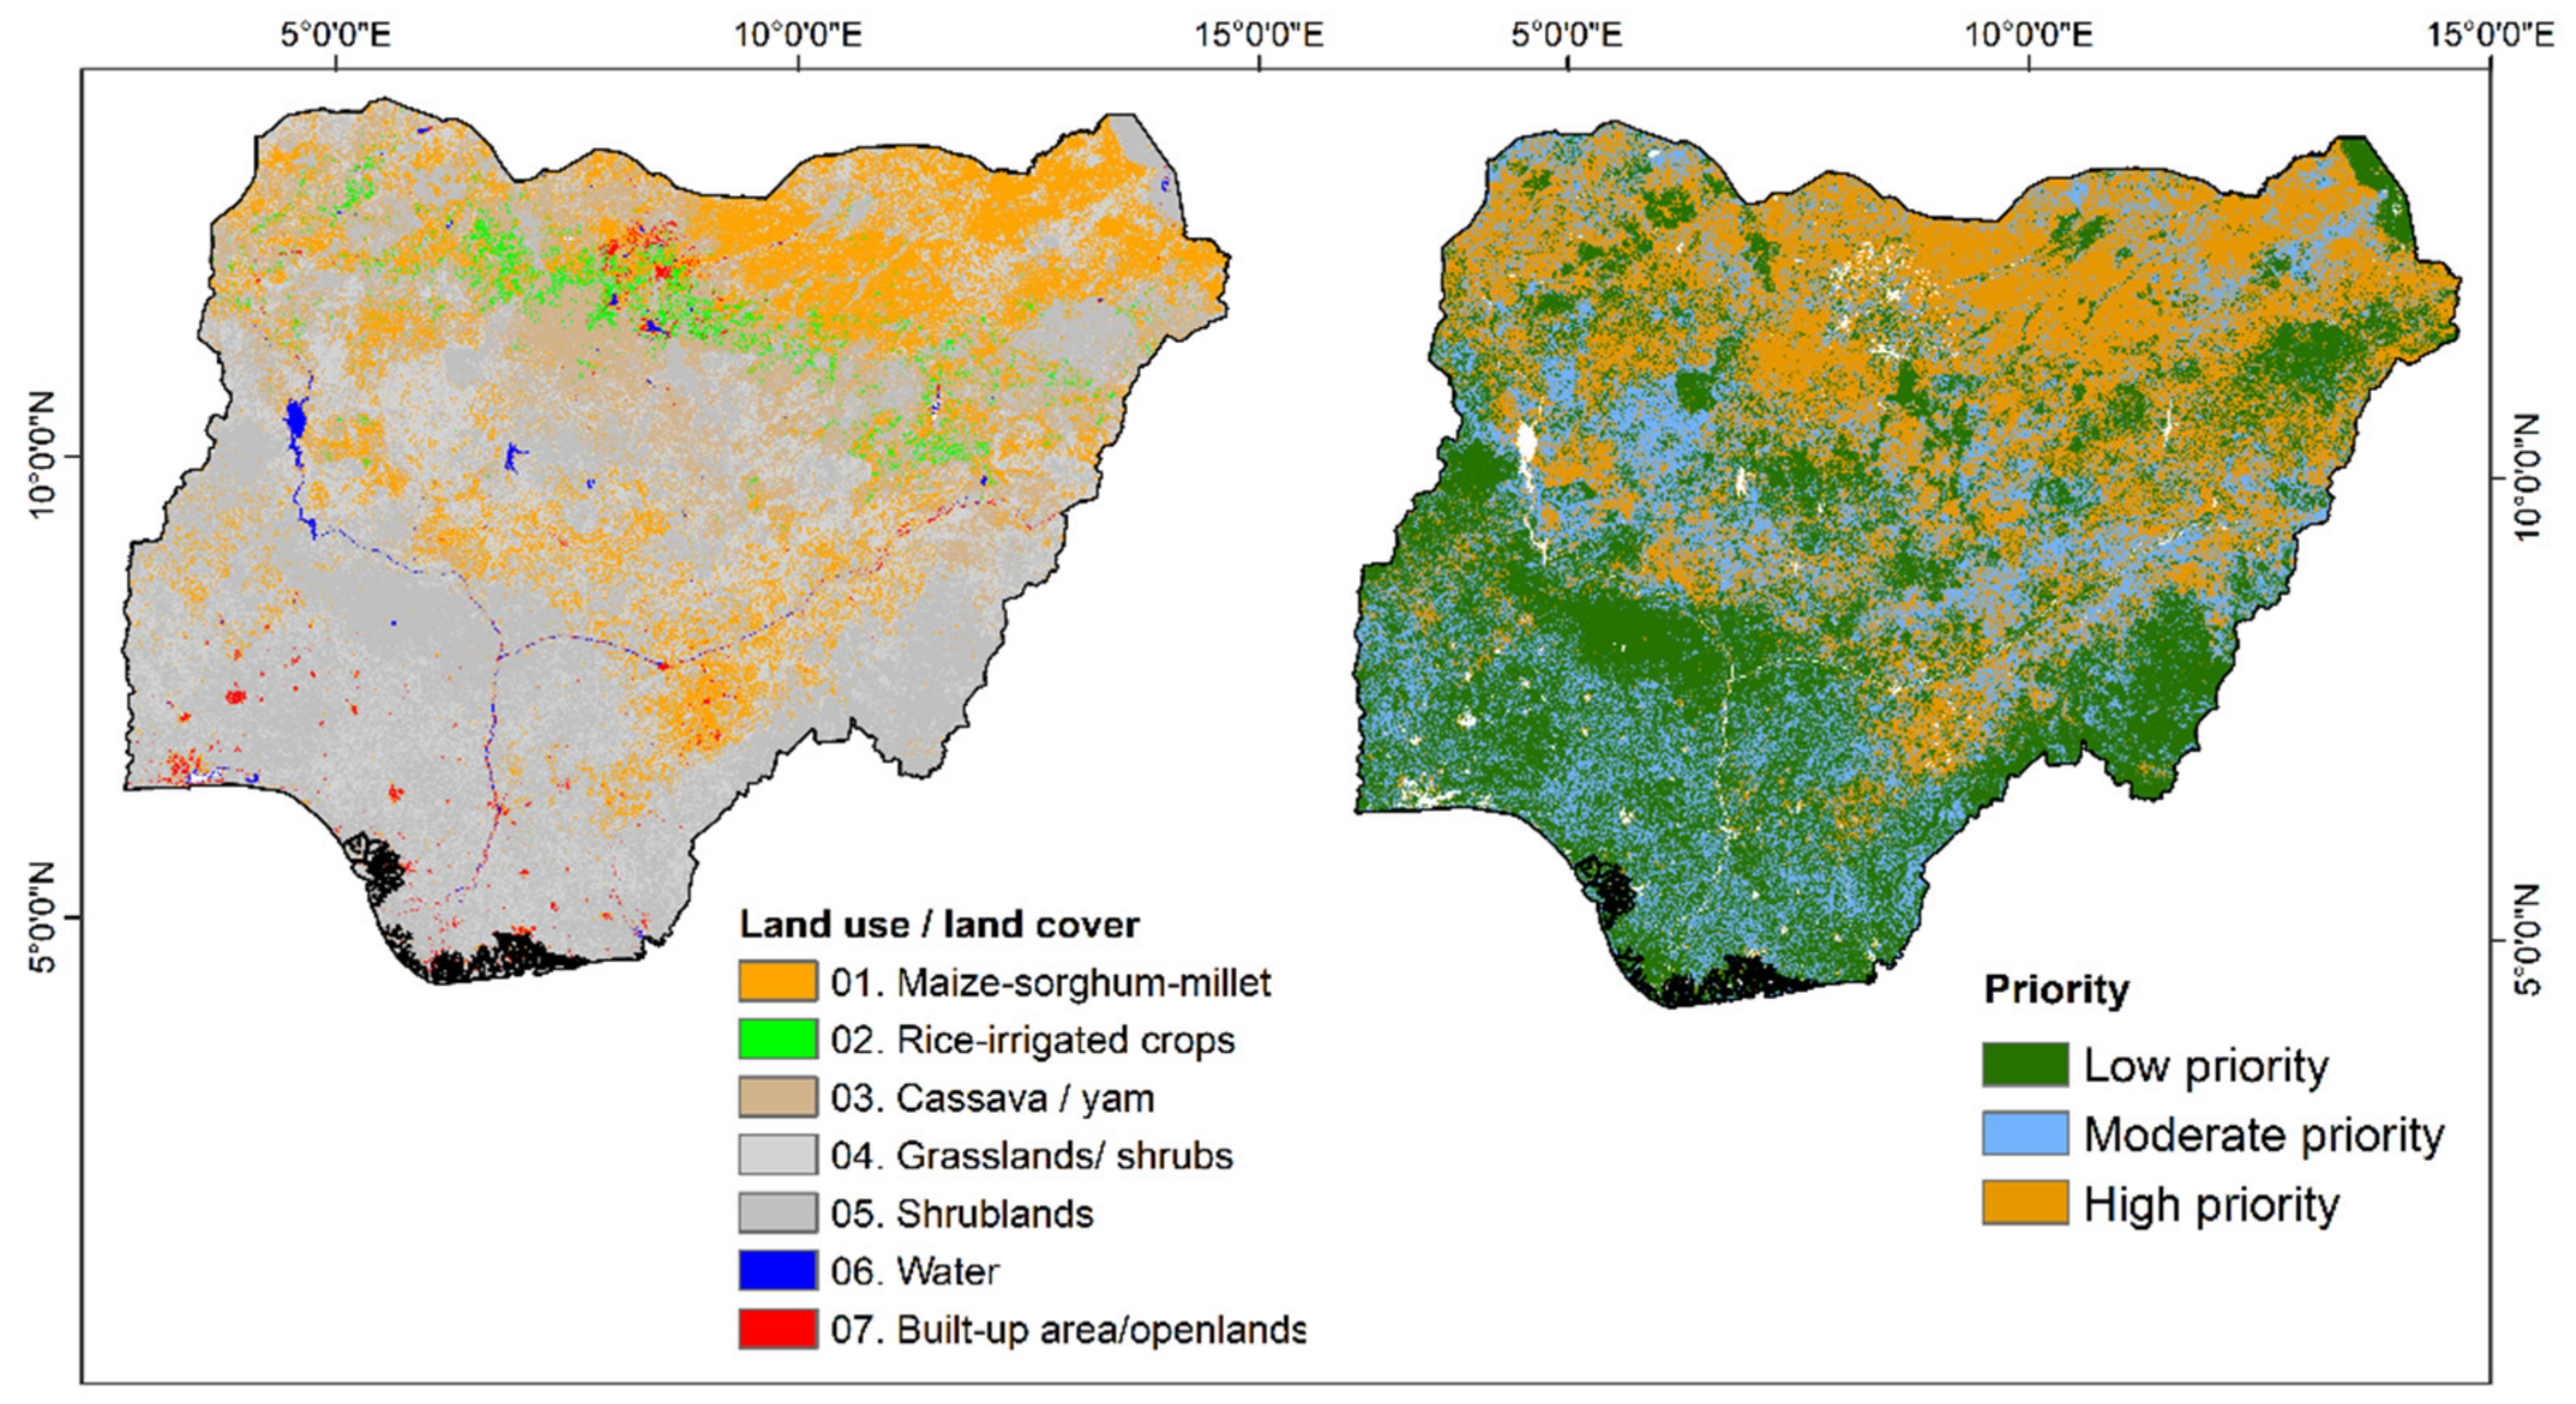
2.3.1. Land-Use/Land-Cover
2.3.2. Slope
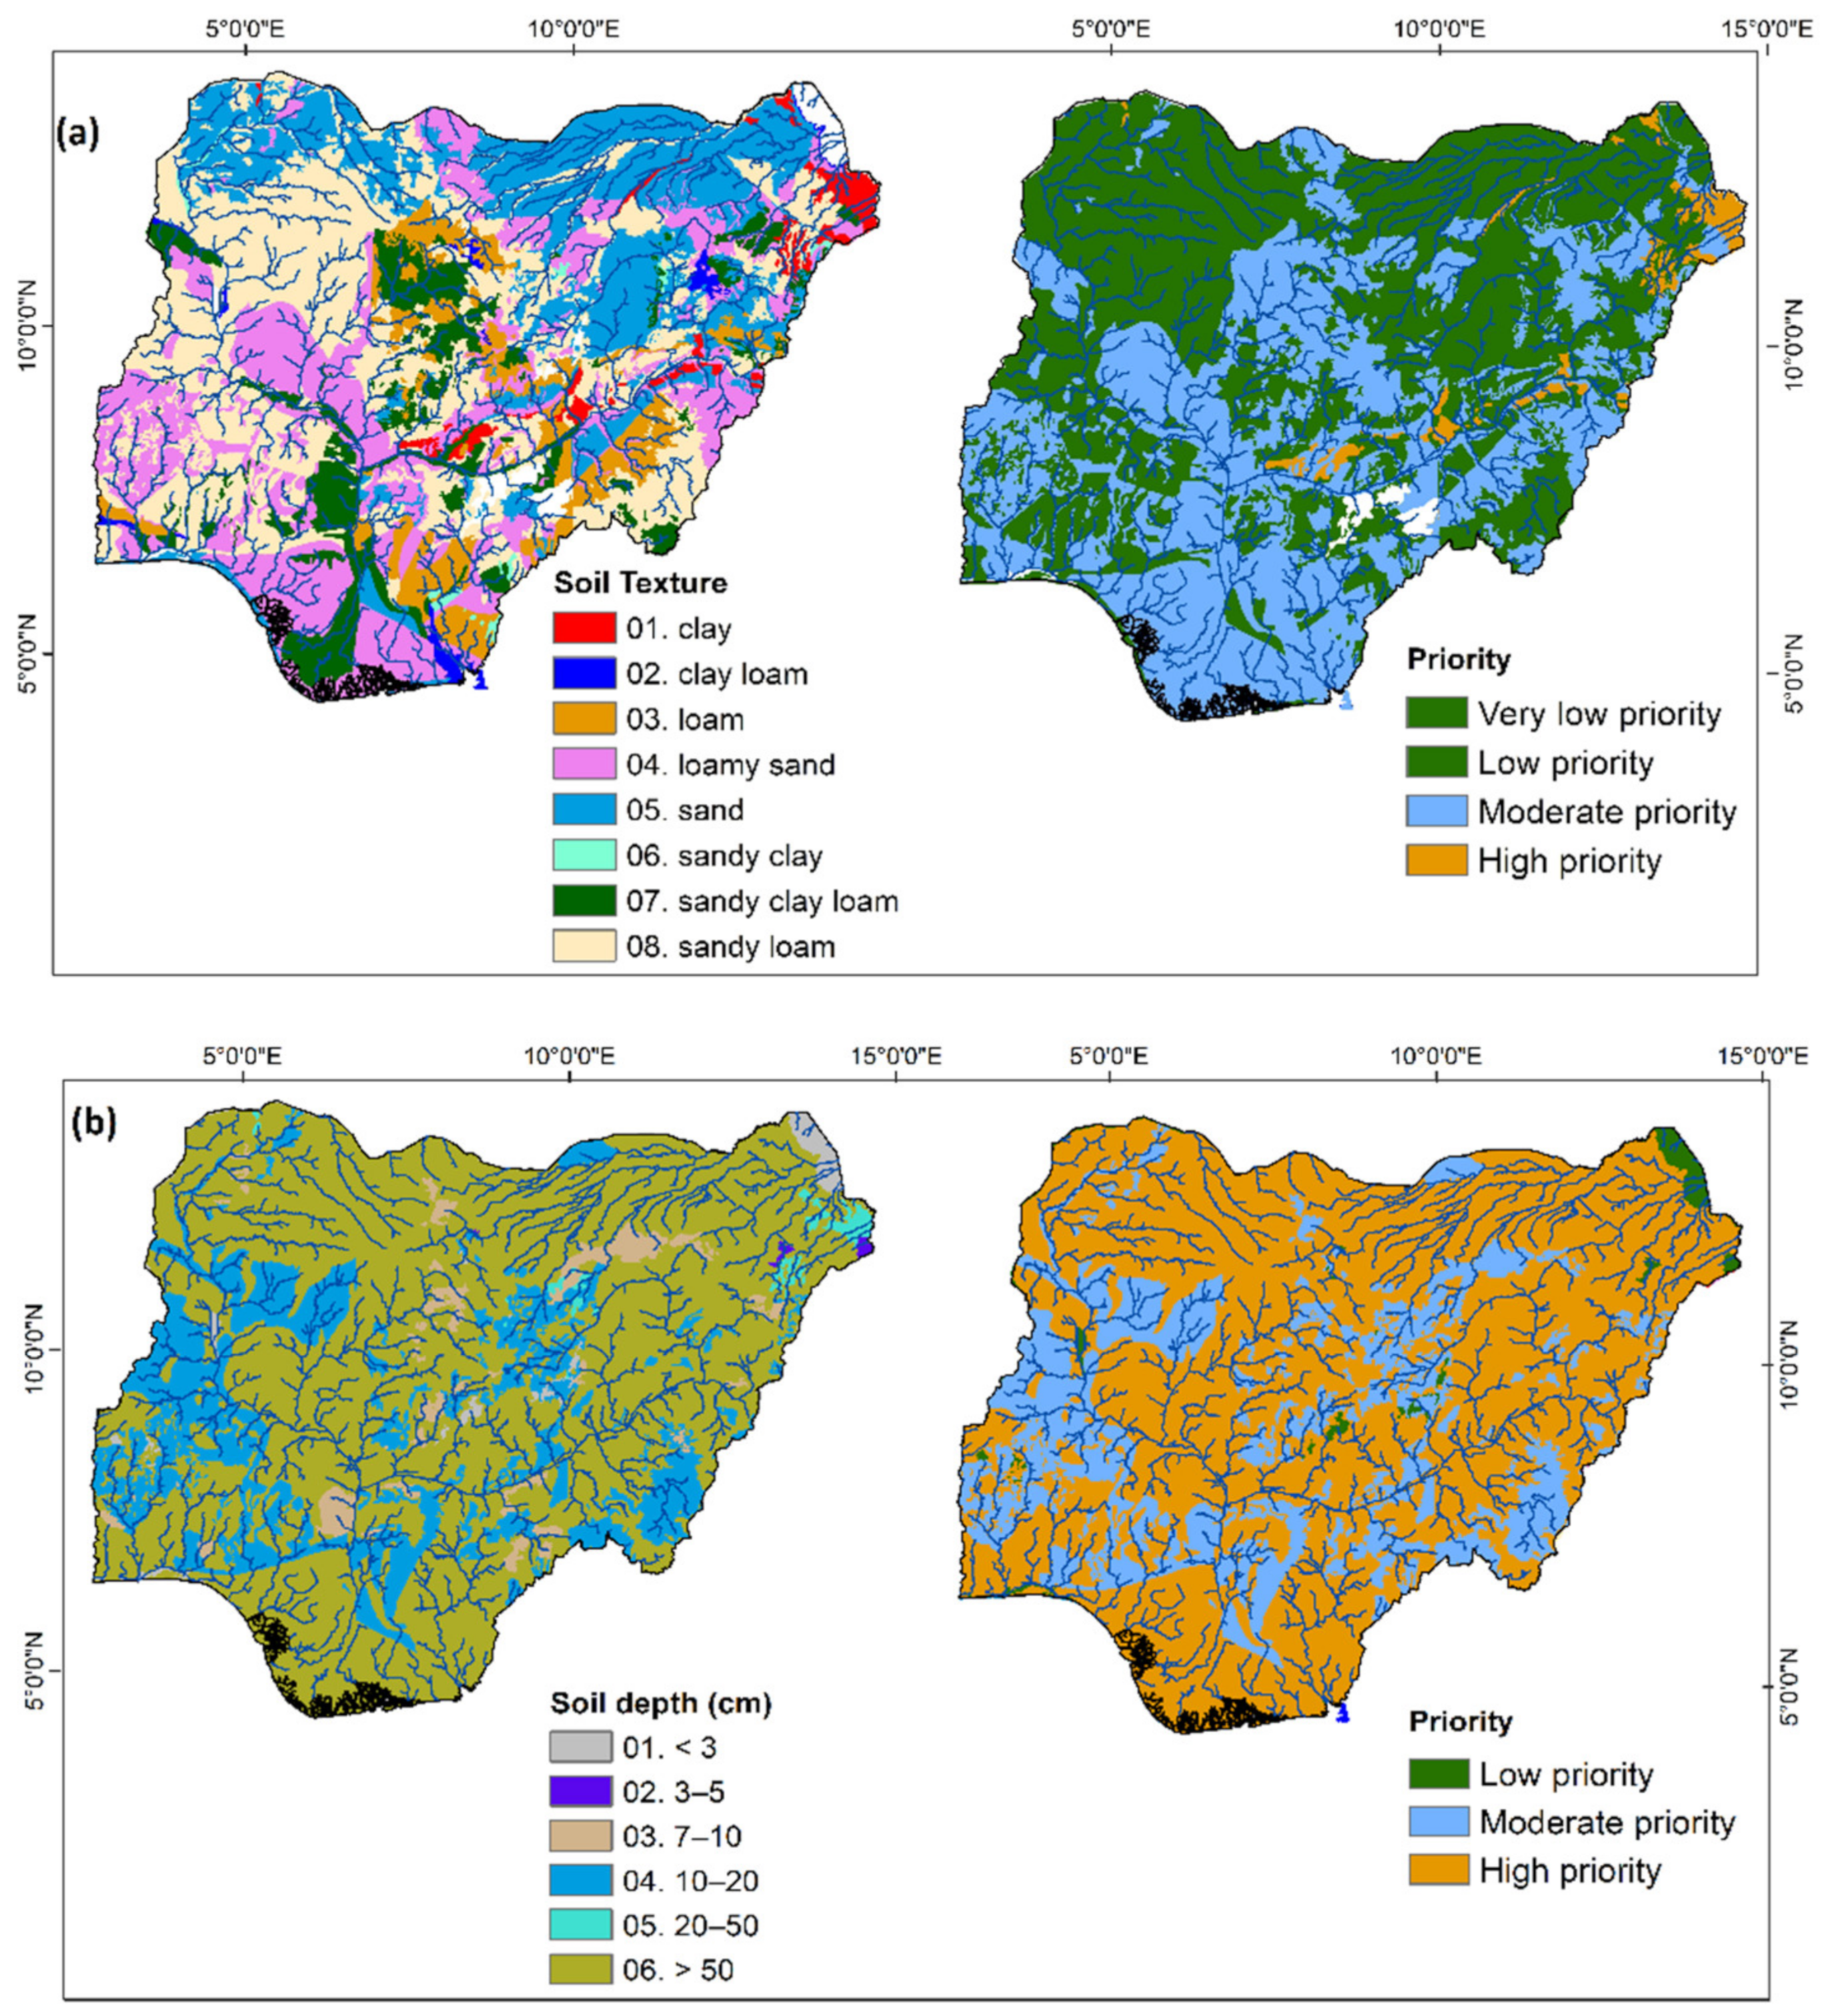
2.3.3. Soils
2.3.4. Rainfall
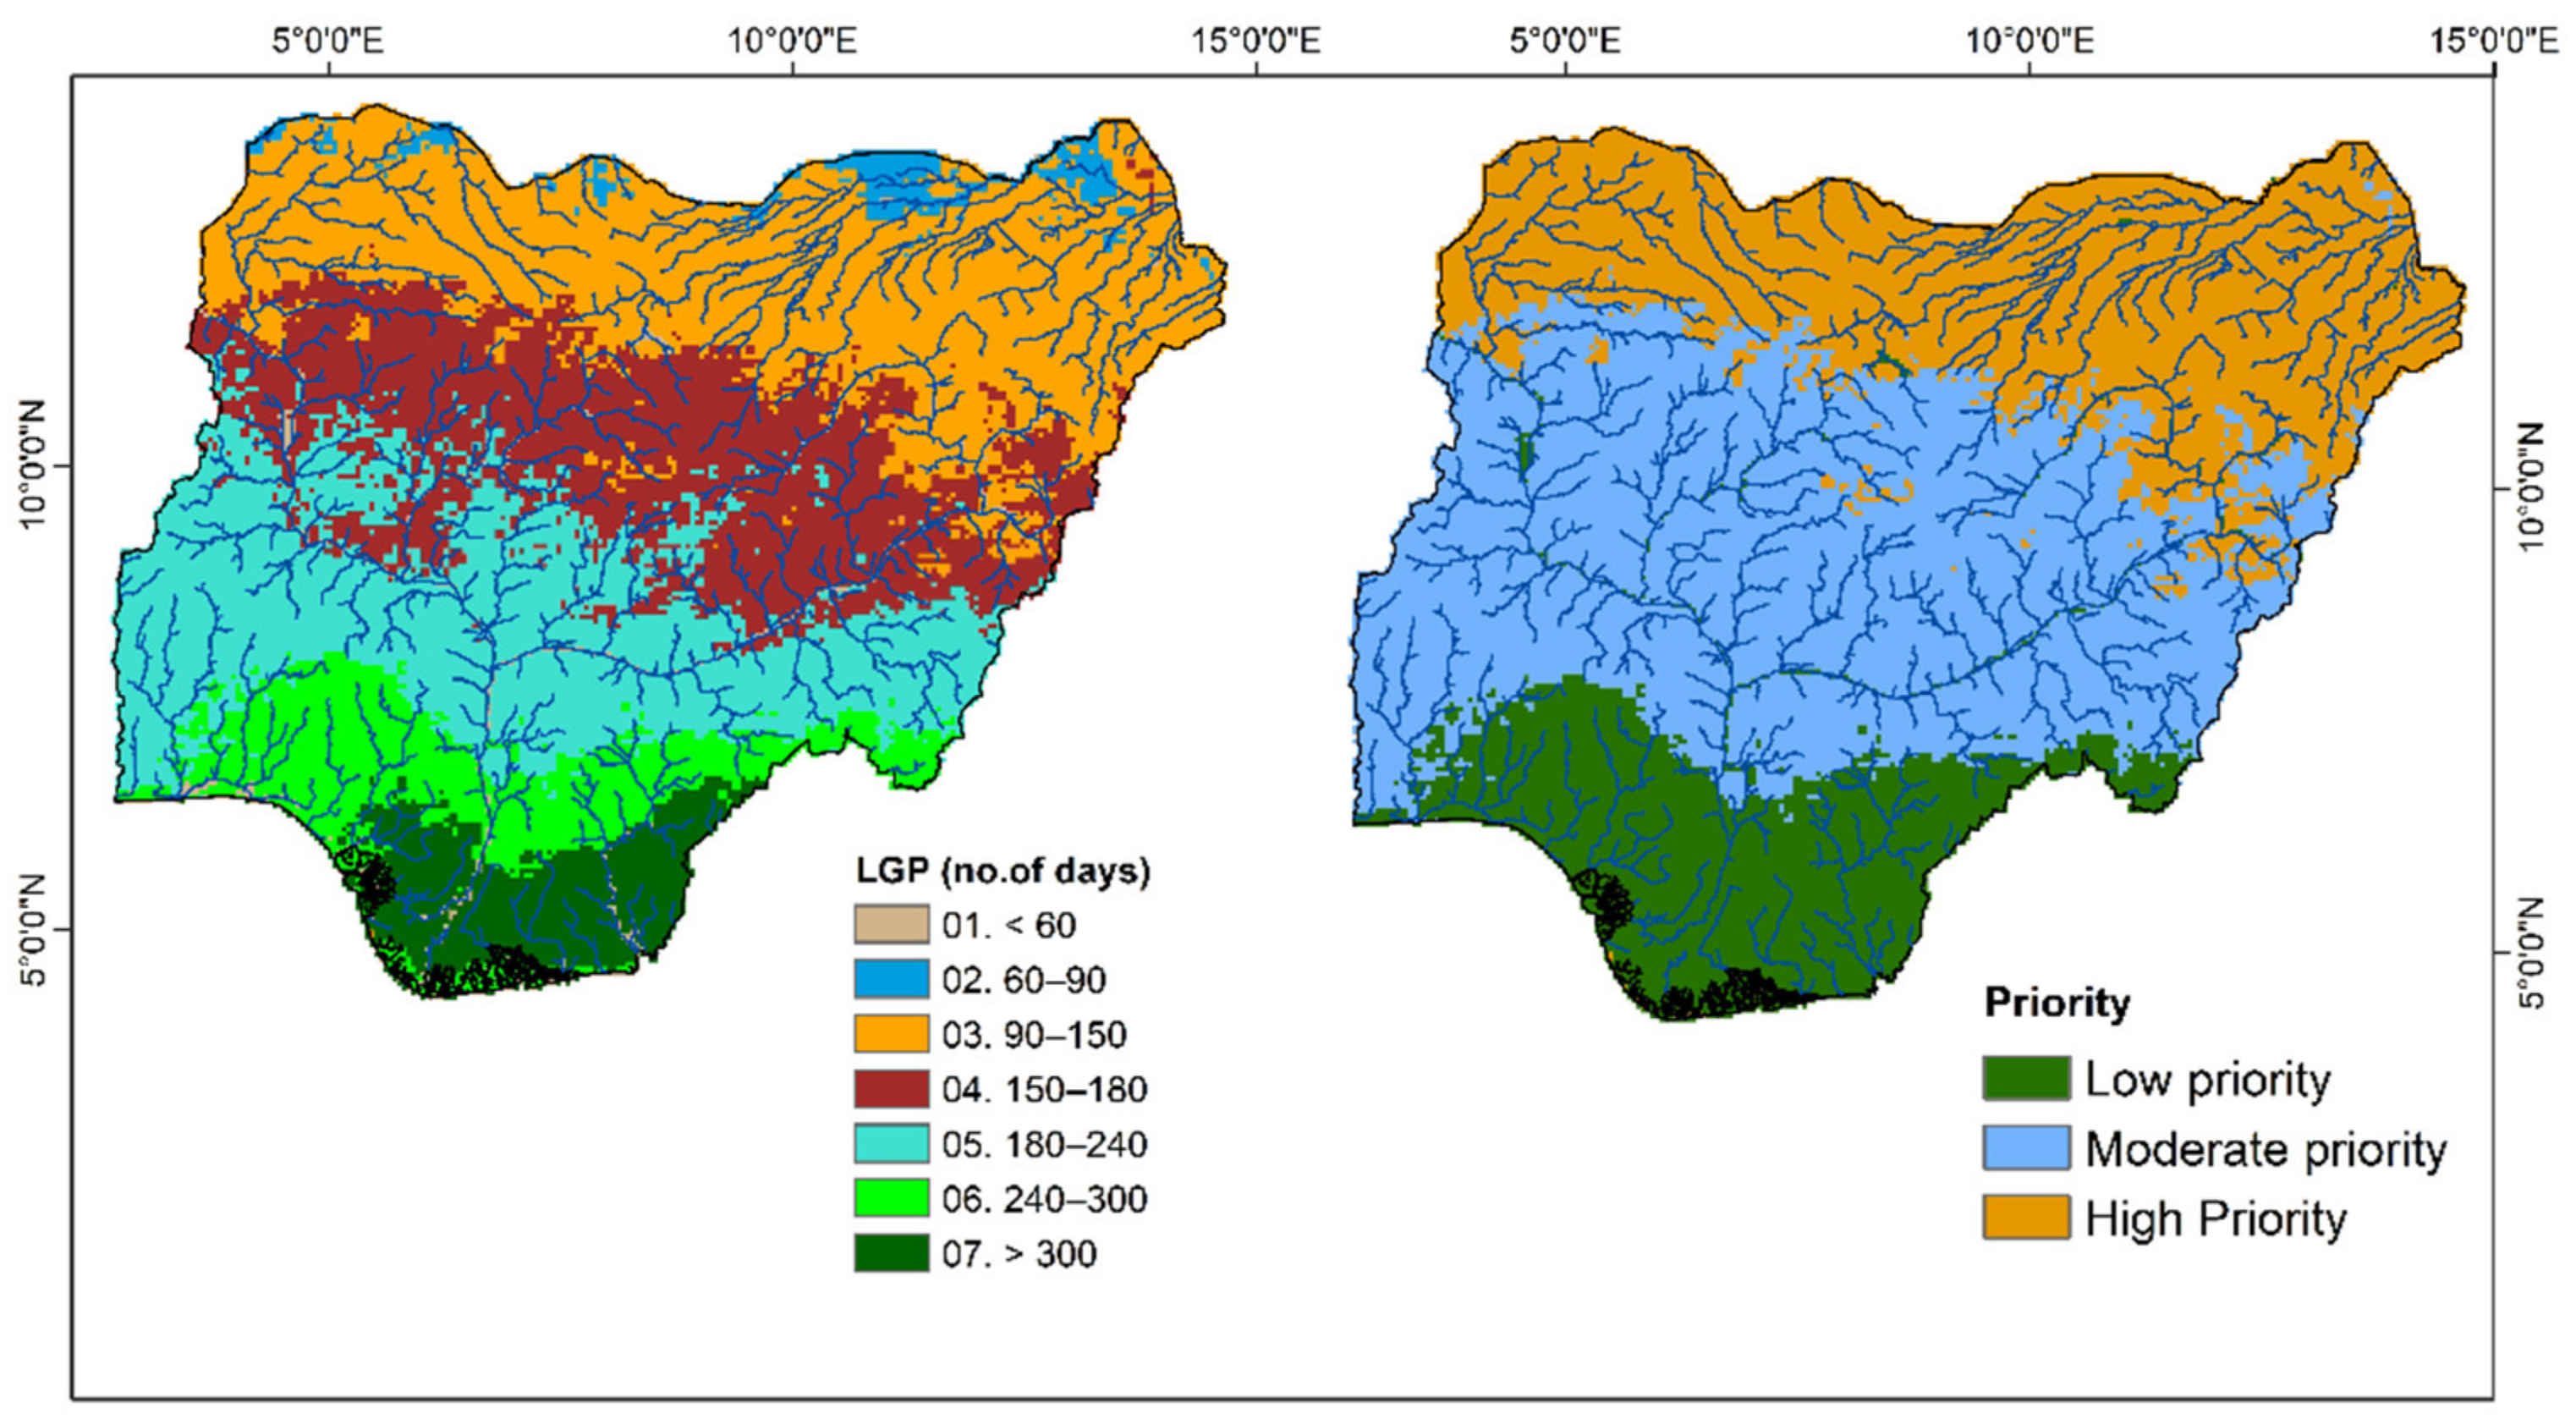
2.3.5. Length of Growing Period (LGP)
2.3.6. Temperature
2.4. Determining Thematic Layer Weights
2.5. Integration of Thematic Layers Using Spatial Models
- Tsw = Thematic layer with weighted score
- Tr = Reclassified thematic layer
- W = Weights
- Pm = Priority map
2.6. Spatial Modeling Using Machine Learning Algorithms on Google Earth Engine Platform
- Example for rainfall reclassification:
- “
- var DTstring_prep =
- [‘1) root 9999 9999 9999’, ‘2) prec<=250 9999 9999 1 *’,//Allocated value 1
- ‘3) prec>250 9999 9999 9999’, ‘6) prec<=1000 9999 9999 2 *’,//Allocated value 2
- ‘7) prec>1000 9999 9999 3 *’].join(“\n”); Allocated value 3
- var classifier_prep = ee.Classifier.decisionTree(DTstring_prep);
- var reclassifiedImage_prep = prep.select(‘prec’).classify(classifier_prep);
- ”
- For example:
- “var weighted=
- reclassifiedImage_minTem.add(reclassifiedImage_maxTem).add(reclassifiedImage_slop).add(reclassifiedImage_prep)
- ”
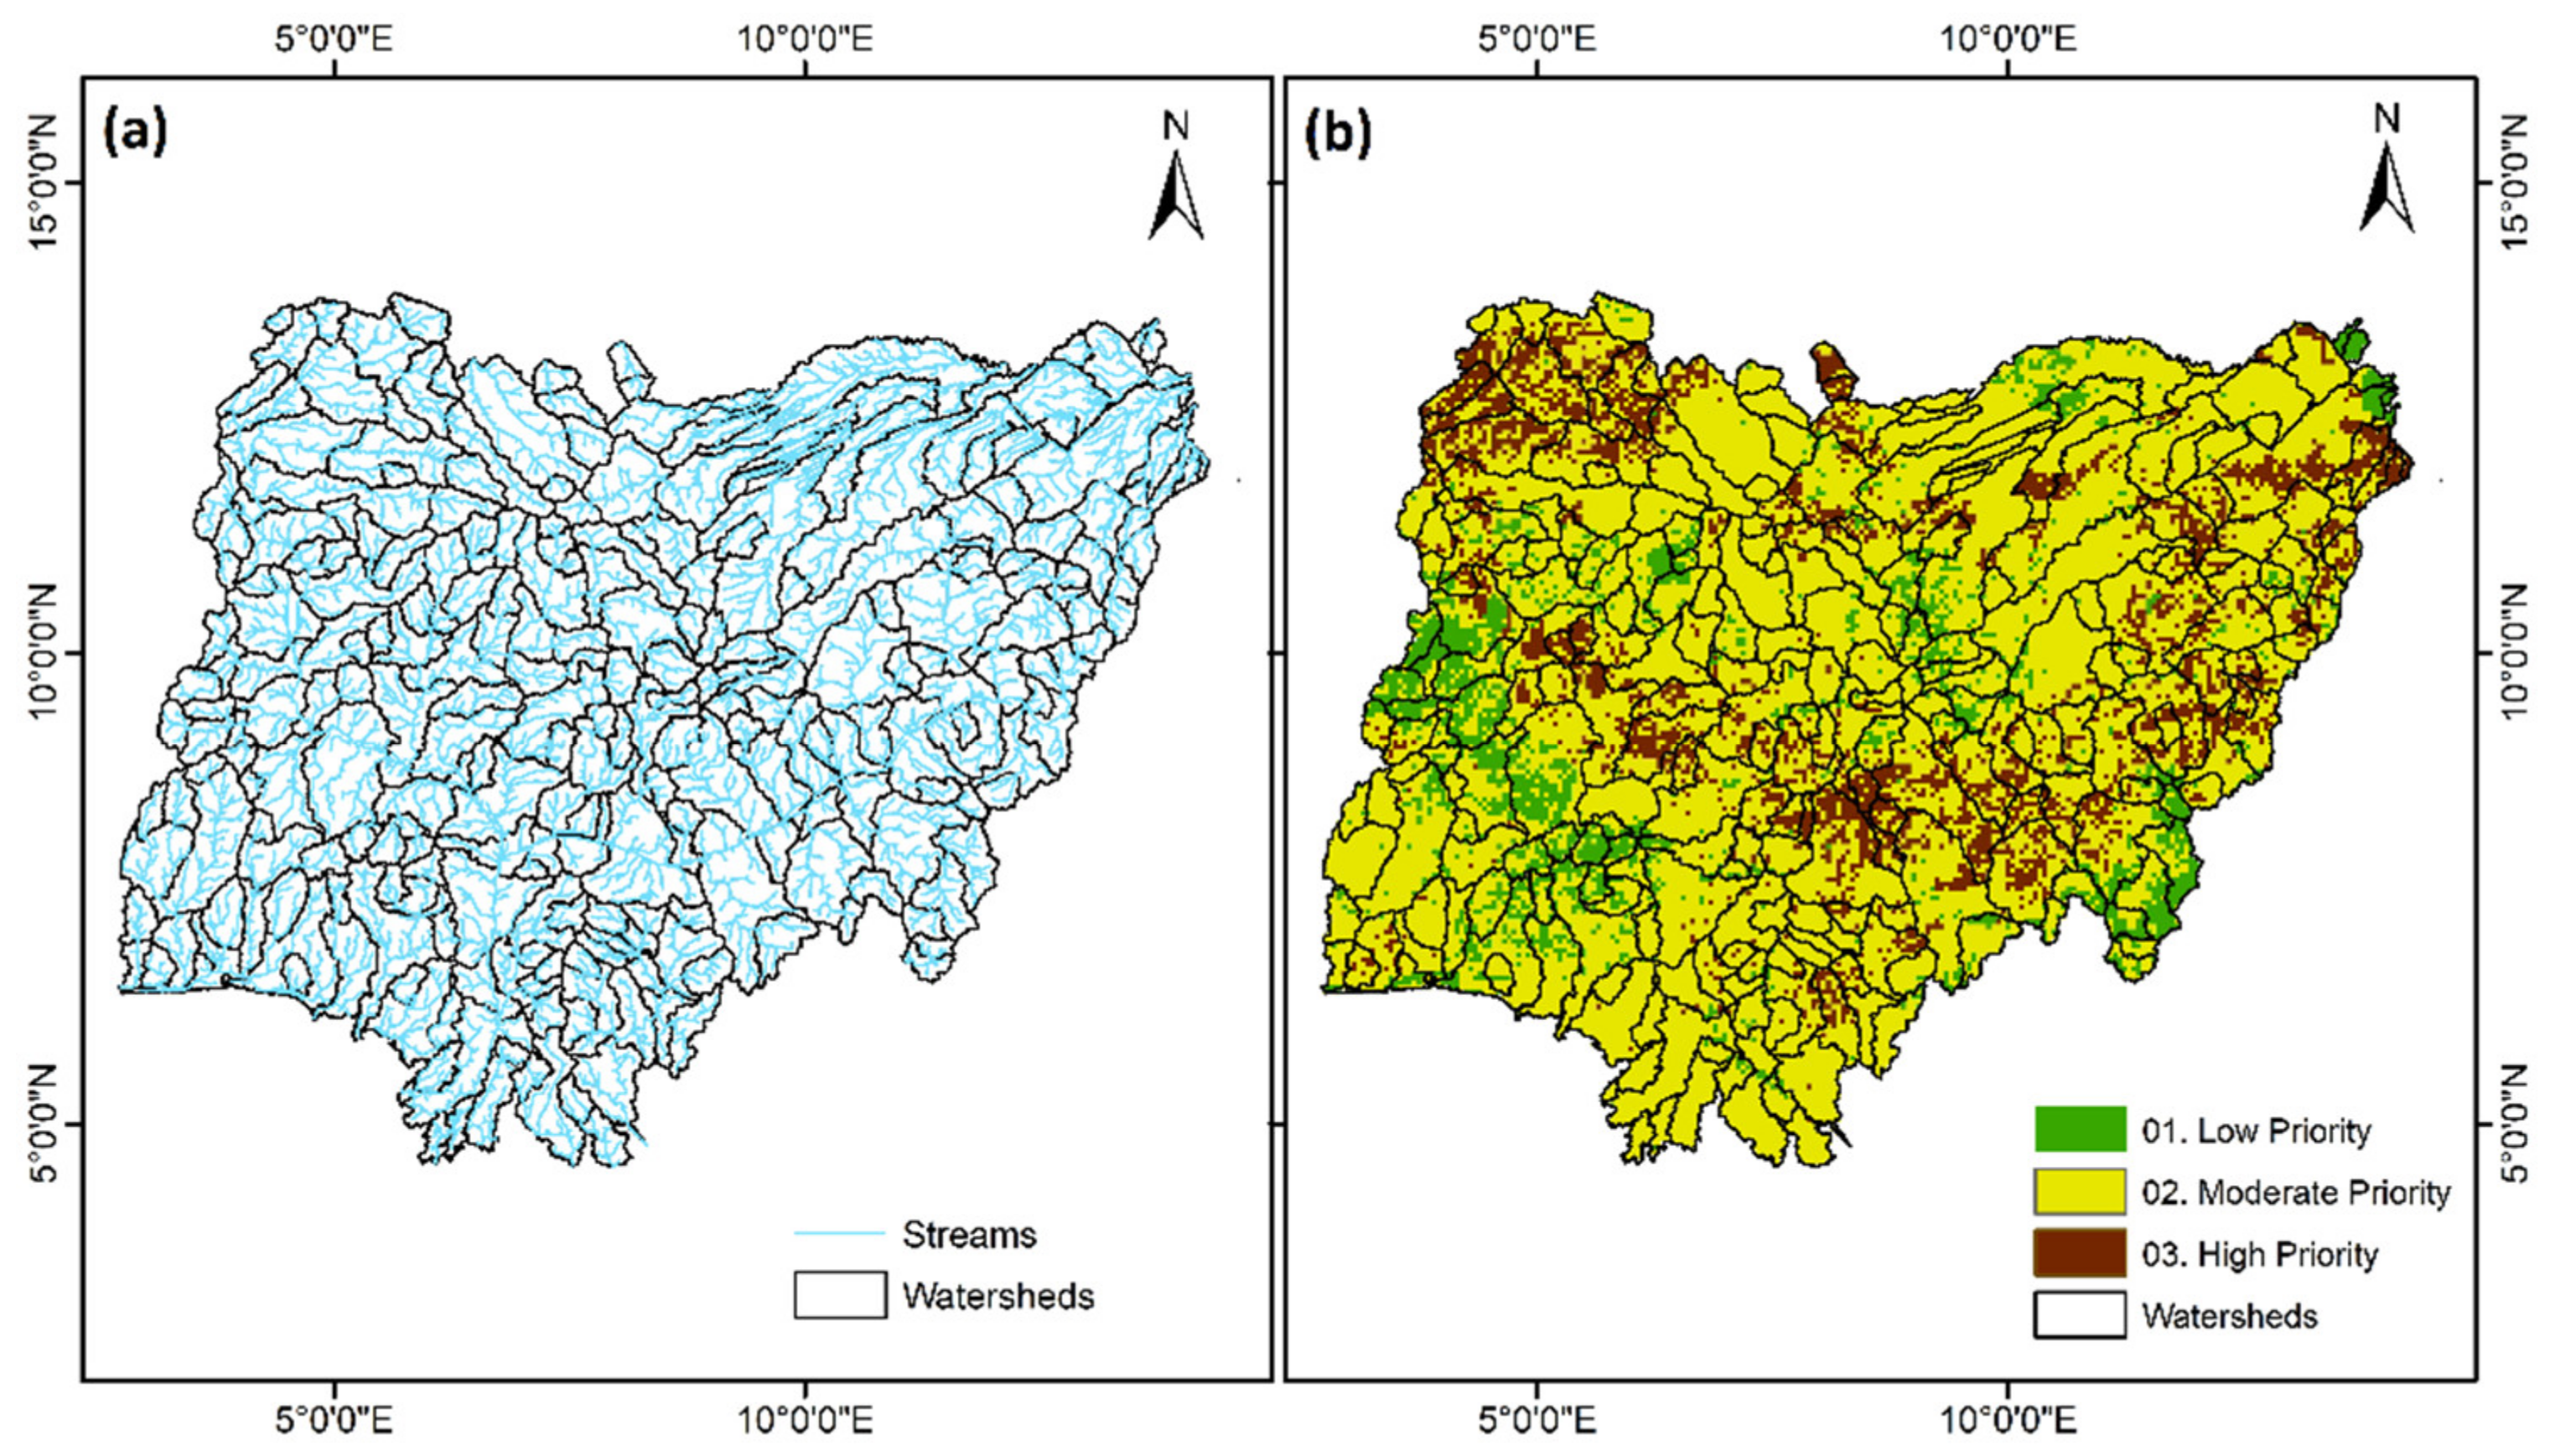
2.7. Watershed Delineation
3. Results and Discussion
3.1. Watershed Analysis and Prioritization of Watersheds
3.2. Integration of Watershed Map with Thematic Layers
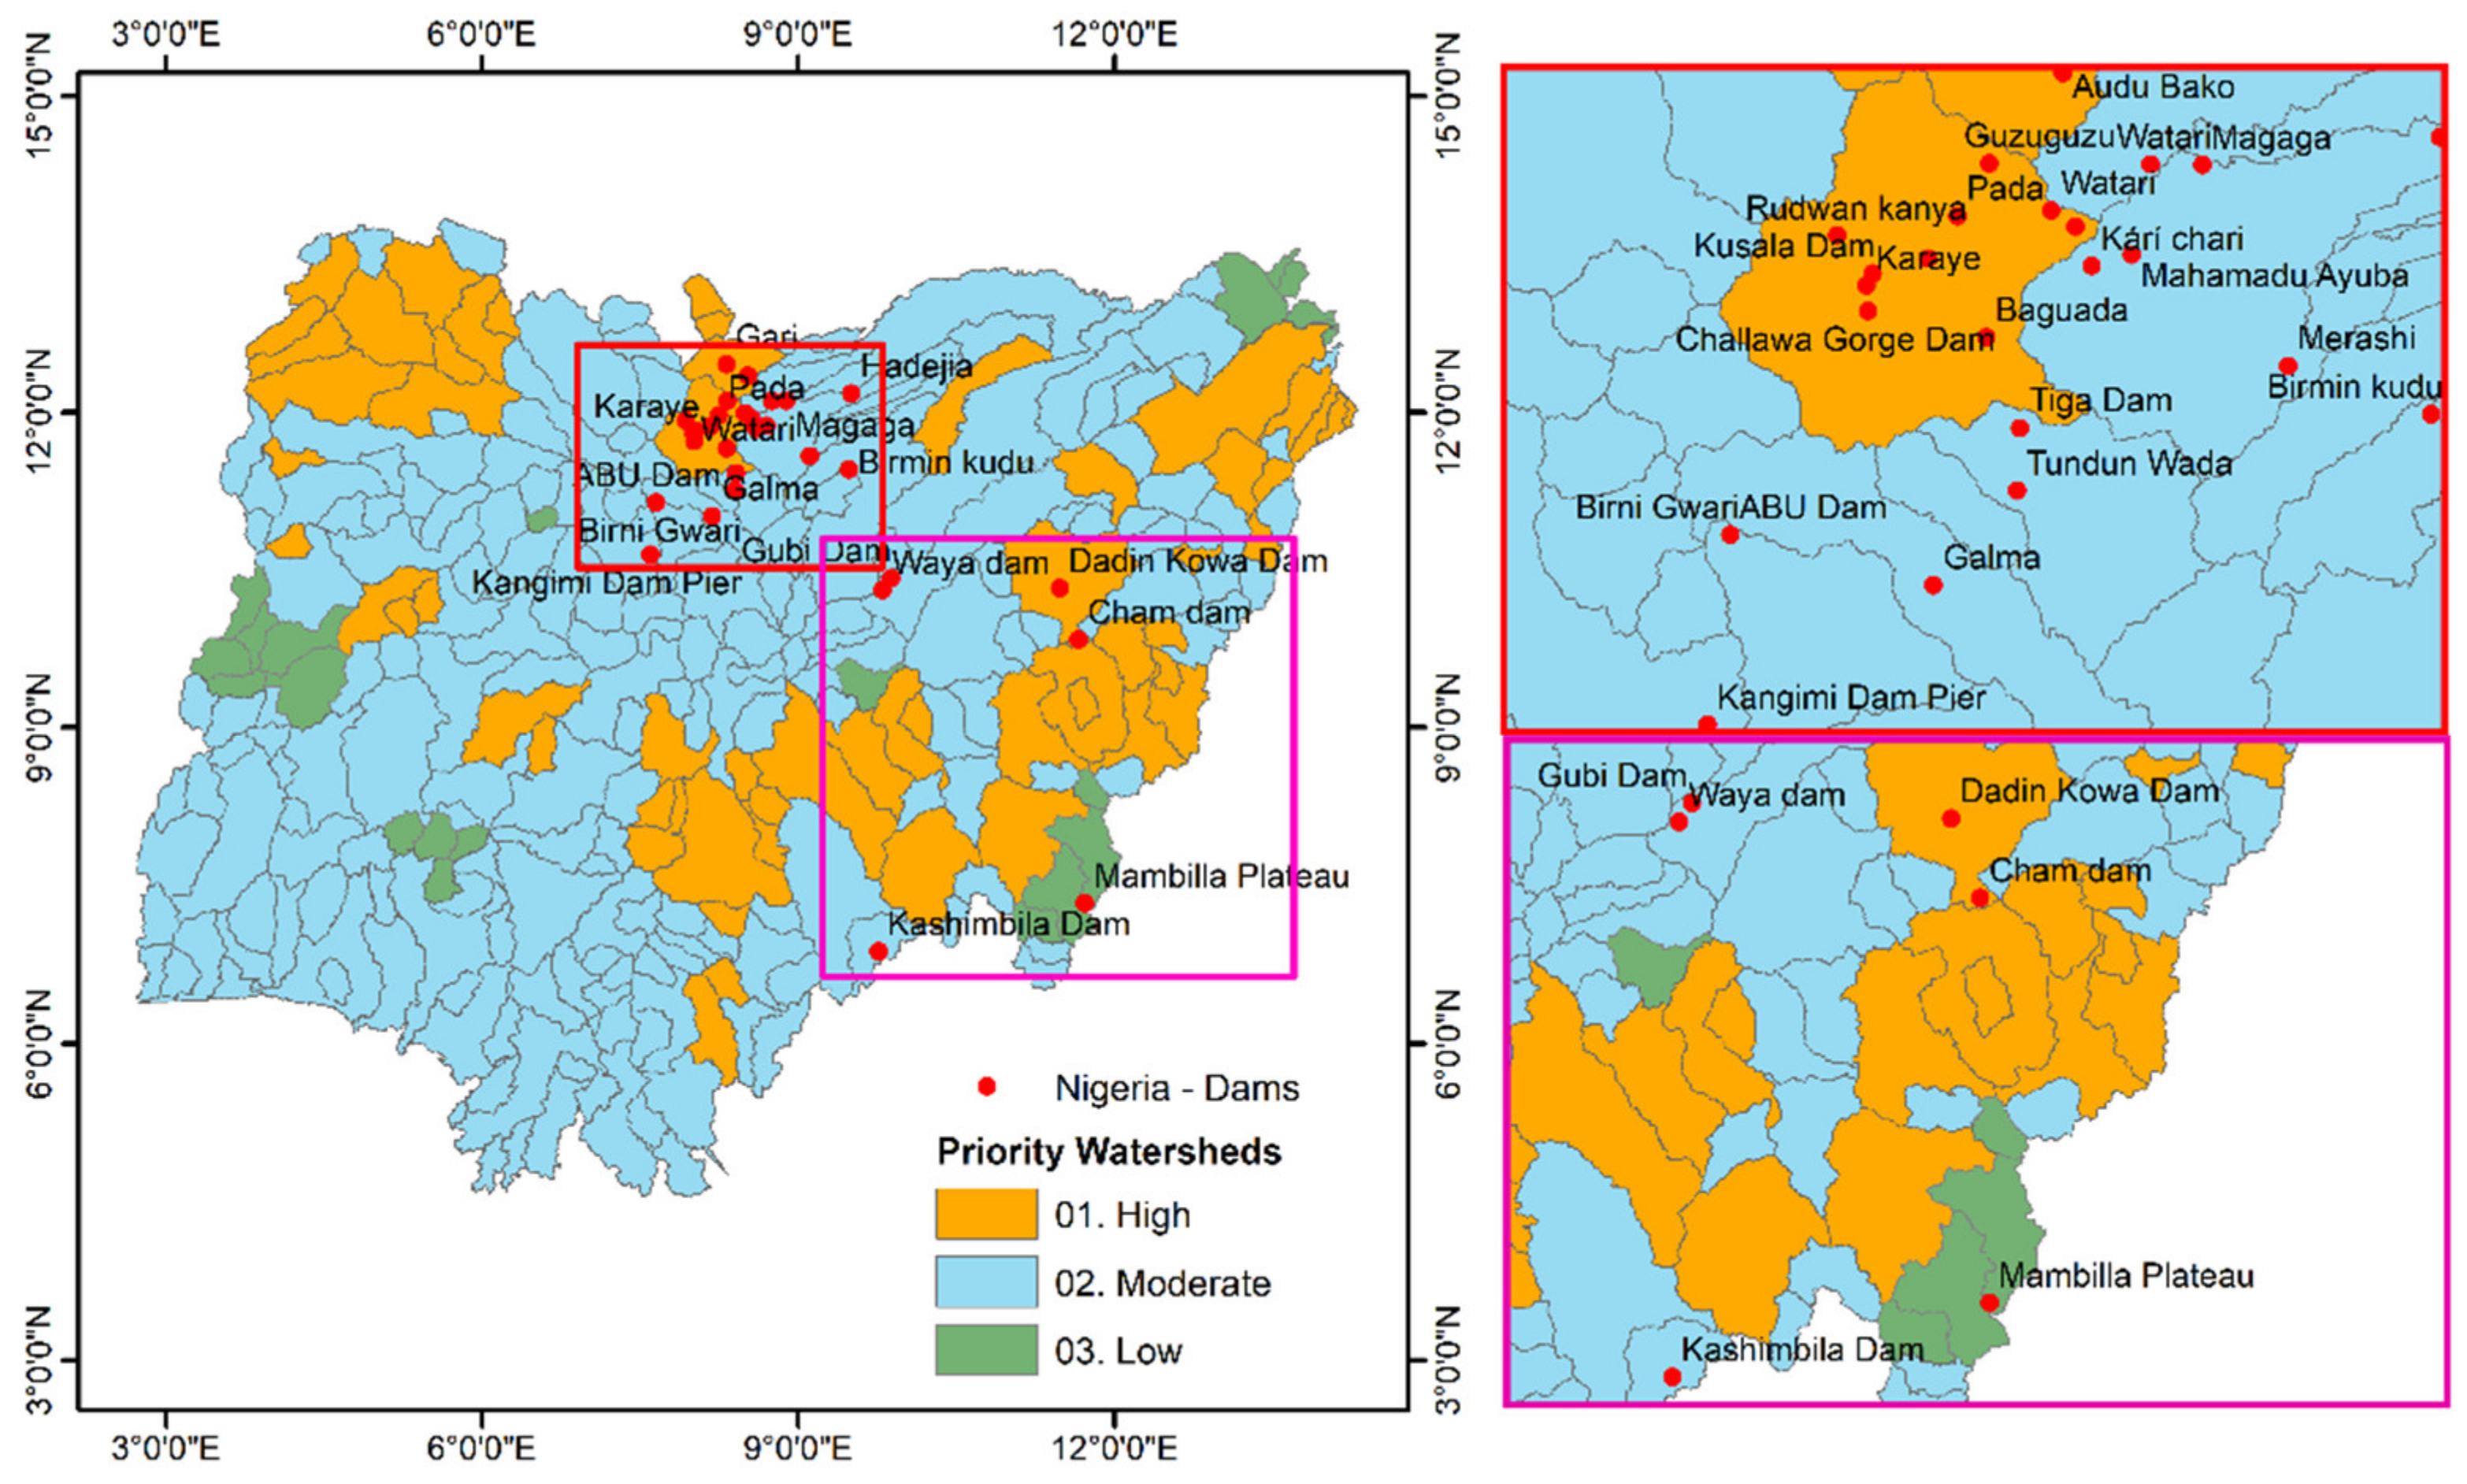
3.3. Validation of Priority Watersheds
4. Discussion
5. Conclusions
Author Contributions
Funding
Institutional Review Board Statement
Informed Consent Statement
Data Availability Statement
Acknowledgments
Conflicts of Interest
Appendix A

| Variable | Year | Type | Resolution | Source |
|---|---|---|---|---|
| Maximum Temperature | 2010–2018 | Raster | ~4 km | TerraClimate |
| Minimum Temperature | 2010–2018 | Raster | ~4 km | TerraClimate |
| Precipitation | 2010–2018 | Raster | ~4 km | TerraClimate |
| Slope | 2014 | Raster | 90 m | SRTM |
| Soil | 1994 | Vector | 1:5,000,000 | FAO [33] |
| LULC | 2014 | Raster | 250 m | LULC [31] |
| LGP | 2011 | Raster | 8 km | LGP [35] |
References
- Groninger, J.W. Building watershed management capacity in Nigeria: Expanding the role of agriculture colleges. J. Contemp. Water Res. Educ. 2016, 158, 78–84. [Google Scholar]
- Adesina, A. Investing in Nigeria’s Agricultural Value Chain. Presented at the Bank of Industry’s Nigerian Investment Forum, London, UK, 30 July 2012; Available online: http://www.newworldnigeria.com/pdf/AdesinaLondonBOIForumfinal.pdf (accessed on 4 May 2020).
- Khan, M.A.; Gupta, V.P.; Moharana, P.C. Watershed prioritization using remote sensing and geographical information system: A case study from Guhiya, India. J. Arid. Environ. 2001, 49, 465–475. [Google Scholar] [CrossRef]
- Jewitt, G. Can integrated water resources management sustain the provision of ecosystem goods and services? Phys. Chem. Earth Parts A/B/C 2002, 27, 887–895. [Google Scholar] [CrossRef]
- Gumma, M.K.; Birhanu, B.Z.; Mohammed, I.A.; Tabo, R.; Whitbread, A.M. Prioritization of watersheds across Mali using remote sensing data and GIS techniques for agricultural development planning. Water 2016, 8, 260. [Google Scholar] [CrossRef] [Green Version]
- Gumma, M.; Thenkabail, P.S.; Fujii, H.; Namara, R. Spatial models for selecting the most suitable areas of rice cultivation in the Inland Valley Wetlands of Ghana using remote sensing and geographic information systems. J. Appl. Remote Sens. 2009, 3, 033537. [Google Scholar]
- Bazzi, H.; Baghdadi, N.; Ienco, D.; El Hajj, M.; Zribi, M.; Belhouchette, H.; Escorihuela, M.J.; Demarez, V. Mapping irrigated areas using Sentinel-1 Time series in Catalonia, Spain. Remote Sens. 2019, 11, 1836. [Google Scholar] [CrossRef] [Green Version]
- Moore, I.D.; Grayson, R.; Ladson, A. Digital terrain modelling: A review of hydrological, geomorphological, and biological applications. Hydrol. Process. 1991, 5, 3–30. [Google Scholar] [CrossRef]
- Panhalkar, S.; Pawar, C. Watershed Development Prioritization by applying WERM model and GIS techniques in Vedganga Basin (INDIA). ARPN J. Agric. Biol. Sci. 2011, 6, 38–44. [Google Scholar]
- Vittala, S.S.; Govindaiah, S.; Gowda, H.H. Prioritization of sub-watersheds for sustainable development and management of natural resources: An integrated approach using remote sensing, GIS and socio-economic data. Curr. Sci. 2008, 95, 345–354. [Google Scholar]
- Iqbal, M.; Sajjad, H. Prioritization based on Morphometric Analysis of Dudhganga Catchment, Kashmir Valley, India using Remote Sensing and Geographical Information System. Afr. J. Geo-Sci. Res. 2014, 2, 1–6. [Google Scholar]
- Kamaraju, M.V.V.; Bhattacharya, A.; Sreenivasa, R.; Chandrasekhar, R.; Murthy, G.S.; Rao, T.C.H.M. Ground-water potential evaluation of West Godavari district, Andhra Pradesh State, India-a GIS Approach. Ground Water 1996, 34, 318–325. [Google Scholar] [CrossRef]
- Mattikalli, H.M.; Devereux, B.J.; Richards, K.S. Integration of remote sensedsatellite images with a Geographical Information System. Comput. Geosci. 1995, 21, 947–956. [Google Scholar] [CrossRef]
- Murthy, K.S.R. Groundwater potential in a semi-arid region of Andhra Pradesh—A geographical information system approach. Int. J. Remote Sens. 2000, 21, 1867–1884. [Google Scholar] [CrossRef]
- Sidhu, R.S.; Mehta, R.S. Delineation of groundwater potential zones in Kushawati river watershed a tributary of Zauri river in Goa, using remotely sensed data. In Proceedings of the National Symposium on Engineering Applications of Remote Sensing and Recent Advantages, Indore, India, 21–23 December 1989; pp. 41–46. [Google Scholar]
- Gumma, M.K.; Pavelic, P. Mapping of groundwater potential zones across Ghana using remote sensing, geographic information systems, and spatial modeling. Environ. Monit. Assess. 2013, 185, 3561–3579. [Google Scholar] [CrossRef]
- Hellden, U.; Olsson, L.; Stern, M. Approaches to desertification monitoring in Sudan. In Satellite Remote Sensing in Developing Counties; Lery, L.G., Ed.; European Space Agency: Paris, France, 1982; pp. 131–144. [Google Scholar]
- Kushwaha, S.P.S. Application of Remote Sensing in Shifting Cultivation Areas; Technical Report; Abteilung Luftbildmessung and Fernerkundung, Universitat Freiburg: Freiburg, Germany, 1993; pp. 23–28. [Google Scholar]
- Smith, A.Y.; Blackwell, R.J. Development of an information data base for watershed monitoring. Photogramm. Eng. Remote Sens. 1980, 46, 1027–1038. [Google Scholar]
- Trotter, C.M. Remotely sensed data as information source for geographical information system in natural resources management: A review. Int. J. Remote Sens. 1991, 5, 225–239. [Google Scholar] [CrossRef]
- Said, S.; Siddique, R.; Shakeel, M. Morphometric analysis and sub-watersheds prioritization of Nagmati River watershed, Kutch District, Gujarat using GIS based approach. J. Water Land Dev. 2018, 39, 131–139. [Google Scholar] [CrossRef] [Green Version]
- Zheng, J.; Fu, H.; Li, W.; Wu, W.; Zhao, Y.; Dong, R.; Yu, L. Cross-regional oil palm tree counting and detection via a multi-level attention domain adaptation network. ISPRS J. Photogramm. Remote Sens. 2020, 167, 154–177. [Google Scholar] [CrossRef]
- Singh, L.; Saravanan, S.; Jennifer, J.J.; Abijith, D. Application of multi-influence factor (MIF) technique for the identification of suitable sites for urban settlement in Tiruchirappalli City, Tamil Nadu, India. Asia-Pac. J. Reg. Sci. 2021, 5, 797–823. [Google Scholar] [CrossRef]
- Roy, S.; Hazra, S.; Chanda, A.; Das, S. Assessment of groundwater potential zones using multi-criteria decision-making technique: A micro-level case study from red and lateritic zone (RLZ) of West Bengal, India. Sustain. Water Resour. Manag. 2020, 6, 4. [Google Scholar] [CrossRef]
- Serele, C.; Pérez-Hoyos, A.; Kayitakire, F. Mapping of groundwater potential zones in the drought-prone areas of south Madagascar using geospatial techniques. Geosci. Front. 2020, 11, 1403–1413. [Google Scholar] [CrossRef]
- Abd Manap, M.; Nampak, H.; Pradhan, B.; Lee, S.; Sulaiman, W.N.A.; Ramli, M.F. Application of probabilistic-based frequency ratio model in groundwater potential mapping using remote sensing data and GIS. Arab. J. Geosci. 2014, 7, 711–724. [Google Scholar] [CrossRef]
- Rahmati, O.; Samadi, M.; Shahabi, H.; Azareh, A.; Rafiei-Sardooi, E.; Alilou, H.; Melesse, A.M.; Pradhan, B.; Chapi, K.; Shirzadi, A. SWPT: An automated GIS-based tool for prioritization of sub-watersheds based on morphometric and topo-hydrological factors. Geosci. Front. 2019, 10, 2167–2175. [Google Scholar] [CrossRef]
- Kumar, K.C.A.; Reddy, G.P.O.; Masilamani, P.; Sandeep, P. Spatial modelling for identification of groundwater potential zones in semi-arid ecosystem of southern India using Sentinel-2 data, GIS and bivariate statistical models. Arab. J. Geosci. 2021, 14, 1362. [Google Scholar] [CrossRef]
- Pandey, M.; Sharma, P.K. Remote sensing and GIS based watershed prioritization. In Proceedings of the 2017 IEEE International Geoscience and Remote Sensing Symposium (IGARSS), Fort Worth, TX, USA, 23–28 July 2017; pp. 6182–6185. [Google Scholar]
- Aher, P.; Adinarayana, J.; Gorantiwar, S. Quantification of morphometric characterization and prioritization for management planning in semi-arid tropics of India: A remote sensing and GIS approach. J. Hydrol. 2014, 511, 850–860. [Google Scholar] [CrossRef]
- Xiong, J.; Thenkabail, P.S.; Gumma, M.K.; Teluguntla, P.; Poehnelt, J.; Congalton, R.G.; Yadav, K.; Thau, D. Automated cropland mapping of continental Africa using Google Earth Engine cloud computing. ISPRS J. Photogramm. Remote Sens. 2017, 126, 225–244. [Google Scholar] [CrossRef] [Green Version]
- Gumma, M.K.; Thenkabail, P.S.; Hideto, F.; Nelson, A.; Dheeravath, V.; Busia, D.; Rala, A. Mapping irrigated areas of Ghana using fusion of 30 m and 250 m resolution remote-sensing data. Remote Sens. 2011, 3, 816–835. [Google Scholar] [CrossRef] [Green Version]
- FAO. AQUASTAT—FAO Water Report 29. 2005. Available online: http://www.fao.org/nr/water/aquastat/countries/ghana/index.stm (accessed on 11 February 2022).
- Abatzoglou, J.T.; Dobrowski, S.Z.; Parks, S.A.; Hegewisch, K.C. TerraClimate, a high-resolution global dataset of monthly climate and climatic water balance from 1958–2015. Sci. Data 2018, 5, 170191. [Google Scholar] [CrossRef] [Green Version]
- Vrieling, A.; De Leeuw, J.; Said, M.Y. Length of growing period over Africa: Variability and trends from 30 years of NDVI time series. Remote Sens. 2013, 5, 982–1000. [Google Scholar] [CrossRef] [Green Version]
- Murthy, K.S.R.; Mamo, A.G. Multi-criteria decision evaluation in groundwater zones identification in Moyale-Teltele subbasin, South Ethiopia. Int. J. Remote Sens. 2009, 30, 2729–2740. [Google Scholar] [CrossRef]
- Moran, M.S.; Peters-Lidard, C.D.; Watts, J.M.; McElroy, S. Estimating soil moisture at the watershed scale with satellite-based radar and land surface models. Can. J. Remote Sens. 2004, 30, 805–826. [Google Scholar] [CrossRef] [Green Version]
- Belgiu, M.; Csillik, O. Sentinel-2 cropland mapping using pixel-based and object-based time-weighted dynamic time warping analysis. Remote Sens. Environ. 2018, 204, 509–523. [Google Scholar] [CrossRef]
- Baja, S.; Chapman, D.M.; Dragovich, D. A conceptual model for defining and assessing land management units using a fuzzy modeling approach in GIS environment. Environ. Manag. 2002, 29, 647–661. [Google Scholar] [CrossRef]
- Chowdary, V.; Chakraborthy, D.; Jeyaram, A.; Murthy, Y.K.; Sharma, J.; Dadhwal, V. Multi-criteria decision making approach for watershed prioritization using analytic hierarchy process technique and GIS. Water Resour. Manag. 2013, 27, 3555–3571. [Google Scholar] [CrossRef]
- Jaiswal, R.; Thomas, T.; Galkate, R.; Ghosh, N.; Singh, S. Watershed prioritization using Saaty’s AHP based decision support for soil conservation measures. Water Resour. Manag. 2014, 28, 475–494. [Google Scholar] [CrossRef]
- Gopinath, G.; Nair, A.G.; Ambili, G.; Swetha, T. Watershed prioritization based on morphometric analysis coupled with multi criteria decision making. Arab. J. Geosci. 2016, 9, 129. [Google Scholar] [CrossRef]
- Fashae, O.A.; Tijani, M.N.; Talabi, A.O.; Adedeji, O.I. Delineation of groundwater potential zones in the crystalline basement terrain of SW-Nigeria: An integrated GIS and remote sensing approach. Appl. Water Sci. 2014, 4, 19–38. [Google Scholar] [CrossRef] [Green Version]
- Welde, K. Identification and prioritization of subwatersheds for land and water management in Tekeze dam watershed, Northern Ethiopia. Int. Soil Water Conserv. Res. 2016, 4, 30–38. [Google Scholar] [CrossRef] [Green Version]
- Biswas, S.; Sudhakar, S.; Desai, V.R. Prioritisation of subwatersheds based on morphometric analysis of drainage basin: A remote sensing and gis approach. J. Indian Soc. Remote Sens. 1999, 27, 155. [Google Scholar] [CrossRef]
- Farhan, Y.; Anbar, A.; Al-Shaikh, N.; Mousa, R. Prioritization of semi-arid agricultural watershed using morphometric and principal component analysis, remote sensing, and GIS techniques, the Zerqa River Watershed, Northern Jordan. Agric. Sci. 2016, 8, 113–148. [Google Scholar] [CrossRef] [Green Version]
- Farhan, Y.; Nawaiseh, S. Spatial assessment of soil erosion risk using RUSLE and GIS techniques. Environ. Earth Sci. 2015, 74, 4649–4669. [Google Scholar]
- Gajbhiye, S.; Mishra, S.; Pandey, A. Prioritizing erosion-prone area through morphometric analysis: An RS and GIS perspective. Appl. Water Sci. 2014, 4, 51–61. [Google Scholar] [CrossRef] [Green Version]
- Kalin, L.; Hantush, M.M. An auxiliary method to reduce potential adverse impacts of projected land developments: Subwatershed prioritization. Environ. Manag. 2009, 43, 311. [Google Scholar] [CrossRef] [PubMed]
- Besalatpour, A.; Hajabbasi, M.A.; Ayoubi, S.; Jalalian, A. Identification and prioritization of critical sub-basins in a highly mountainous watershed using SWAT model. Eurasian J. Soil Sci. 2012, 1, 58–64. [Google Scholar]
- Aouragh, M.H.; Essahlaoui, A. A TOPSIS approach-based morphometric analysis for sub-watersheds prioritization of high Oum Er-Rbia basin, Morocco. Spat. Inf. Res. 2018, 26, 187–202. [Google Scholar] [CrossRef]
- Rawat, K.S.; Tripathi, V.K.; Mishra, A.K. Sediment yield index mapping and prioritization of Madia subwatershed, Sagar District of Madhya Pradesh (India). Arab. J. Geosci. 2014, 7, 3131–3145. [Google Scholar] [CrossRef]
- Kundu, S.; Khare, D.; Mondal, A. Landuse change impact on sub-watersheds prioritization by analytical hierarchy process (AHP). Ecol. Inform. 2017, 42, 100–113. [Google Scholar] [CrossRef]
- Prasad, R.N.; Pani, P. Geo-hydrological analysis and sub watershed prioritization for flash flood risk using weighted sum model and Snyder’s synthetic unit hydrograph. Model. Earth Syst. Environ. 2017, 3, 1491–1502. [Google Scholar] [CrossRef]
- Ekness, P.; Randhir, T.O. Effect of climate and land cover changes on watershed runoff: A multivariate assessment for storm water management. J. Geophys. Res. Biogeosci. 2015, 120, 1785–1796. [Google Scholar] [CrossRef]


| Suitability Criteria | Priority Level | ||
|---|---|---|---|
| Low (1) | Moderate (2) | High (3) | |
| Average min. temp (°C) | 0–15 | 15–20 | 20–25 |
| Average max. temp (°C) | Up to 20 and >40 | 20–30 | 30–40 |
| Average precipitation (mm) | Up to 250 | 250–1000 | >1000 |
| Slope (% rise) | >20 | 5–20 | <5 |
| Soil texture (class values) | 5, 6, 8 | 2, 3, 4, 7 | 1 |
| Soil depth (mm) | <5 | 5–20 | >20 |
| LGP (No. of Days) | >240 | 150–240 | 60–150 |
| Area (Mha) | No. of Watersheds |
|---|---|
| <0.2 | 144 |
| 0.2 to 0.4 | 71 |
| 0.4 to 0.6 | 26 |
| 0.6 to 0.8 | 15 |
| 0.8 to 1.0 | 8 |
| 1.0 to 1.2 | 6 |
| 1.2 to 1.4 | 3 |
| 1.4 to 1.6 | 2 |
| >1.6 | 2 |
| Thematic Layers | Number of Watersheds | ||
|---|---|---|---|
| Low Priority | Moderate Priority | High Priority | |
| Maximum temperature | 0 | 47 | 230 |
| Minimum temperature | 0 | 98 | 179 |
| Precipitation | 20 | 159 | 98 |
| Slope | 2 | 6 | 269 |
| Soil depth | 6 | 59 | 212 |
| Soil texture | 5 | 153 | 119 |
| LGP | 51 | 148 | 78 |
| Final map | 21 | 199 | 57 |
| FID | Long. | Lat. | Name | Objective | State | Priority |
|---|---|---|---|---|---|---|
| 0 | 8.52168 | 12.340262 | Audu Bako | Irr/ws | Kano | High |
| 1 | 8.319344 | 12.449709 | Gari | Irr/ws | Kano | High |
| 2 | 8.750295 | 12.101573 | Watari | Irr/ws | Kano | Moderate |
| 3 | 8.026064 | 11.816966 | Kusala Dam | Irr/ws | Kano | High |
| 4 | 8.013794 | 11.719821 | Challawa Gorge Dam | Irr/ws | Kano | High |
| 5 | 8.55439 | 11.939492 | Adu Bayero | Irr/ws | Kano | High |
| 6 | 8.32209 | 11.650109 | Baguada | Irr/ws | Kano | High |
| 7 | 8.010376 | 11.785614 | Karaye | Irr/ws | Kano | High |
| 8 | 8.491756 | 11.982099 | Watari | Irr/ws | Kano | High |
| 9 | 8.170203 | 11.856063 | Tomas dam | Irr/ws | Kano | High |
| 10 | 7.933704 | 11.915973 | Rudwan kanya | Irr/ws | Kano | High |
| 11 | 8.2476 | 11.967202 | Pada | Irr/ws | Kano | High |
| 12 | 8.329988 | 12.10452 | Guzuguzu | Irr/ws | Kano | High |
| 13 | 9.50311 | 12.173312 | Hadejia | Irr | Jigawa | Moderate |
| 14 | 8.701458 | 11.866207 | Mahamadu Ayuba | Irr/ws | Kano | Moderate |
| 15 | 9.108804 | 11.575692 | Merashi | Irr/ws | Kano | Moderate |
| 16 | 8.885244 | 12.100326 | Magaga | Irr/ws | Kano | Moderate |
| 17 | 9.481497 | 11.450196 | Birmin kudu | Irr/ws | Jigawa | Moderate |
| 18 | 8.409686 | 11.413934 | Tiga Dam | Irr/ws | Kano | Moderate |
| 19 | 8.402408 | 11.25013 | Tundun Wada | Irr/ws | Kano | Moderate |
| 20 | 8.184803 | 11.004238 | Galma | Irr/ws/HP | Kaduna | Moderate |
| 21 | 7.6548271 | 11.135078 | Birni Gwari | Irr/ws | Kaduna | Moderate |
| 22 | 7.6548271 | 11.135078 | ABU Dam | Irr/ws | Kaduna | Moderate |
| 23 | 7.596162 | 10.639892 | Kangimi Dam Pier | Irr/ws | Kaduna | Moderate |
| 24 | 9.881125 | 10.418291 | Gubi Dam | Irr/ws | Bauchi | Moderate |
| 25 | 9.80136 | 10.30249 | Waya dam | Irr/ws/HP | Bauchi | Moderate |
| 26 | 11.481694 | 10.322154 | Dadin Kowa Dam | Irr/ws/HP | Gombe | High |
| 27 | 11.6613 | 9.8329 | Cham dam | Irr/ws | Gombe | High |
| 28 | 11.72 | 7.33 | Mambilla Plateau | HP | Taraba | Low |
| 29 | 9.761765 | 6.873387 | Kashimbila Dam | Irr/ws | Taraba | Moderate |
Publisher’s Note: MDPI stays neutral with regard to jurisdictional claims in published maps and institutional affiliations. |
© 2022 by the authors. Licensee MDPI, Basel, Switzerland. This article is an open access article distributed under the terms and conditions of the Creative Commons Attribution (CC BY) license (https://creativecommons.org/licenses/by/4.0/).
Share and Cite
Panjala, P.; Gumma, M.K.; Ajeigbe, H.A.; Badamasi, M.M.; Deevi, K.C.; Tabo, R. Identifying Suitable Watersheds across Nigeria Using Biophysical Parameters and Machine Learning Algorithms for Agri–Planning. ISPRS Int. J. Geo-Inf. 2022, 11, 416. https://doi.org/10.3390/ijgi11080416
Panjala P, Gumma MK, Ajeigbe HA, Badamasi MM, Deevi KC, Tabo R. Identifying Suitable Watersheds across Nigeria Using Biophysical Parameters and Machine Learning Algorithms for Agri–Planning. ISPRS International Journal of Geo-Information. 2022; 11(8):416. https://doi.org/10.3390/ijgi11080416
Chicago/Turabian StylePanjala, Pranay, Murali Krishna Gumma, Hakeem Ayinde Ajeigbe, Murtala Muhammad Badamasi, Kumara Charyulu Deevi, and Ramadjita Tabo. 2022. "Identifying Suitable Watersheds across Nigeria Using Biophysical Parameters and Machine Learning Algorithms for Agri–Planning" ISPRS International Journal of Geo-Information 11, no. 8: 416. https://doi.org/10.3390/ijgi11080416
APA StylePanjala, P., Gumma, M. K., Ajeigbe, H. A., Badamasi, M. M., Deevi, K. C., & Tabo, R. (2022). Identifying Suitable Watersheds across Nigeria Using Biophysical Parameters and Machine Learning Algorithms for Agri–Planning. ISPRS International Journal of Geo-Information, 11(8), 416. https://doi.org/10.3390/ijgi11080416