
Evaluating Impacts of Bus Route Map Design and Dynamic Real-Time Information Presentation on Bus Route Map Search Efficiency and Cognitive Load


Abstract
:1. Introduction
2. Related Works
2.1. Visual Search
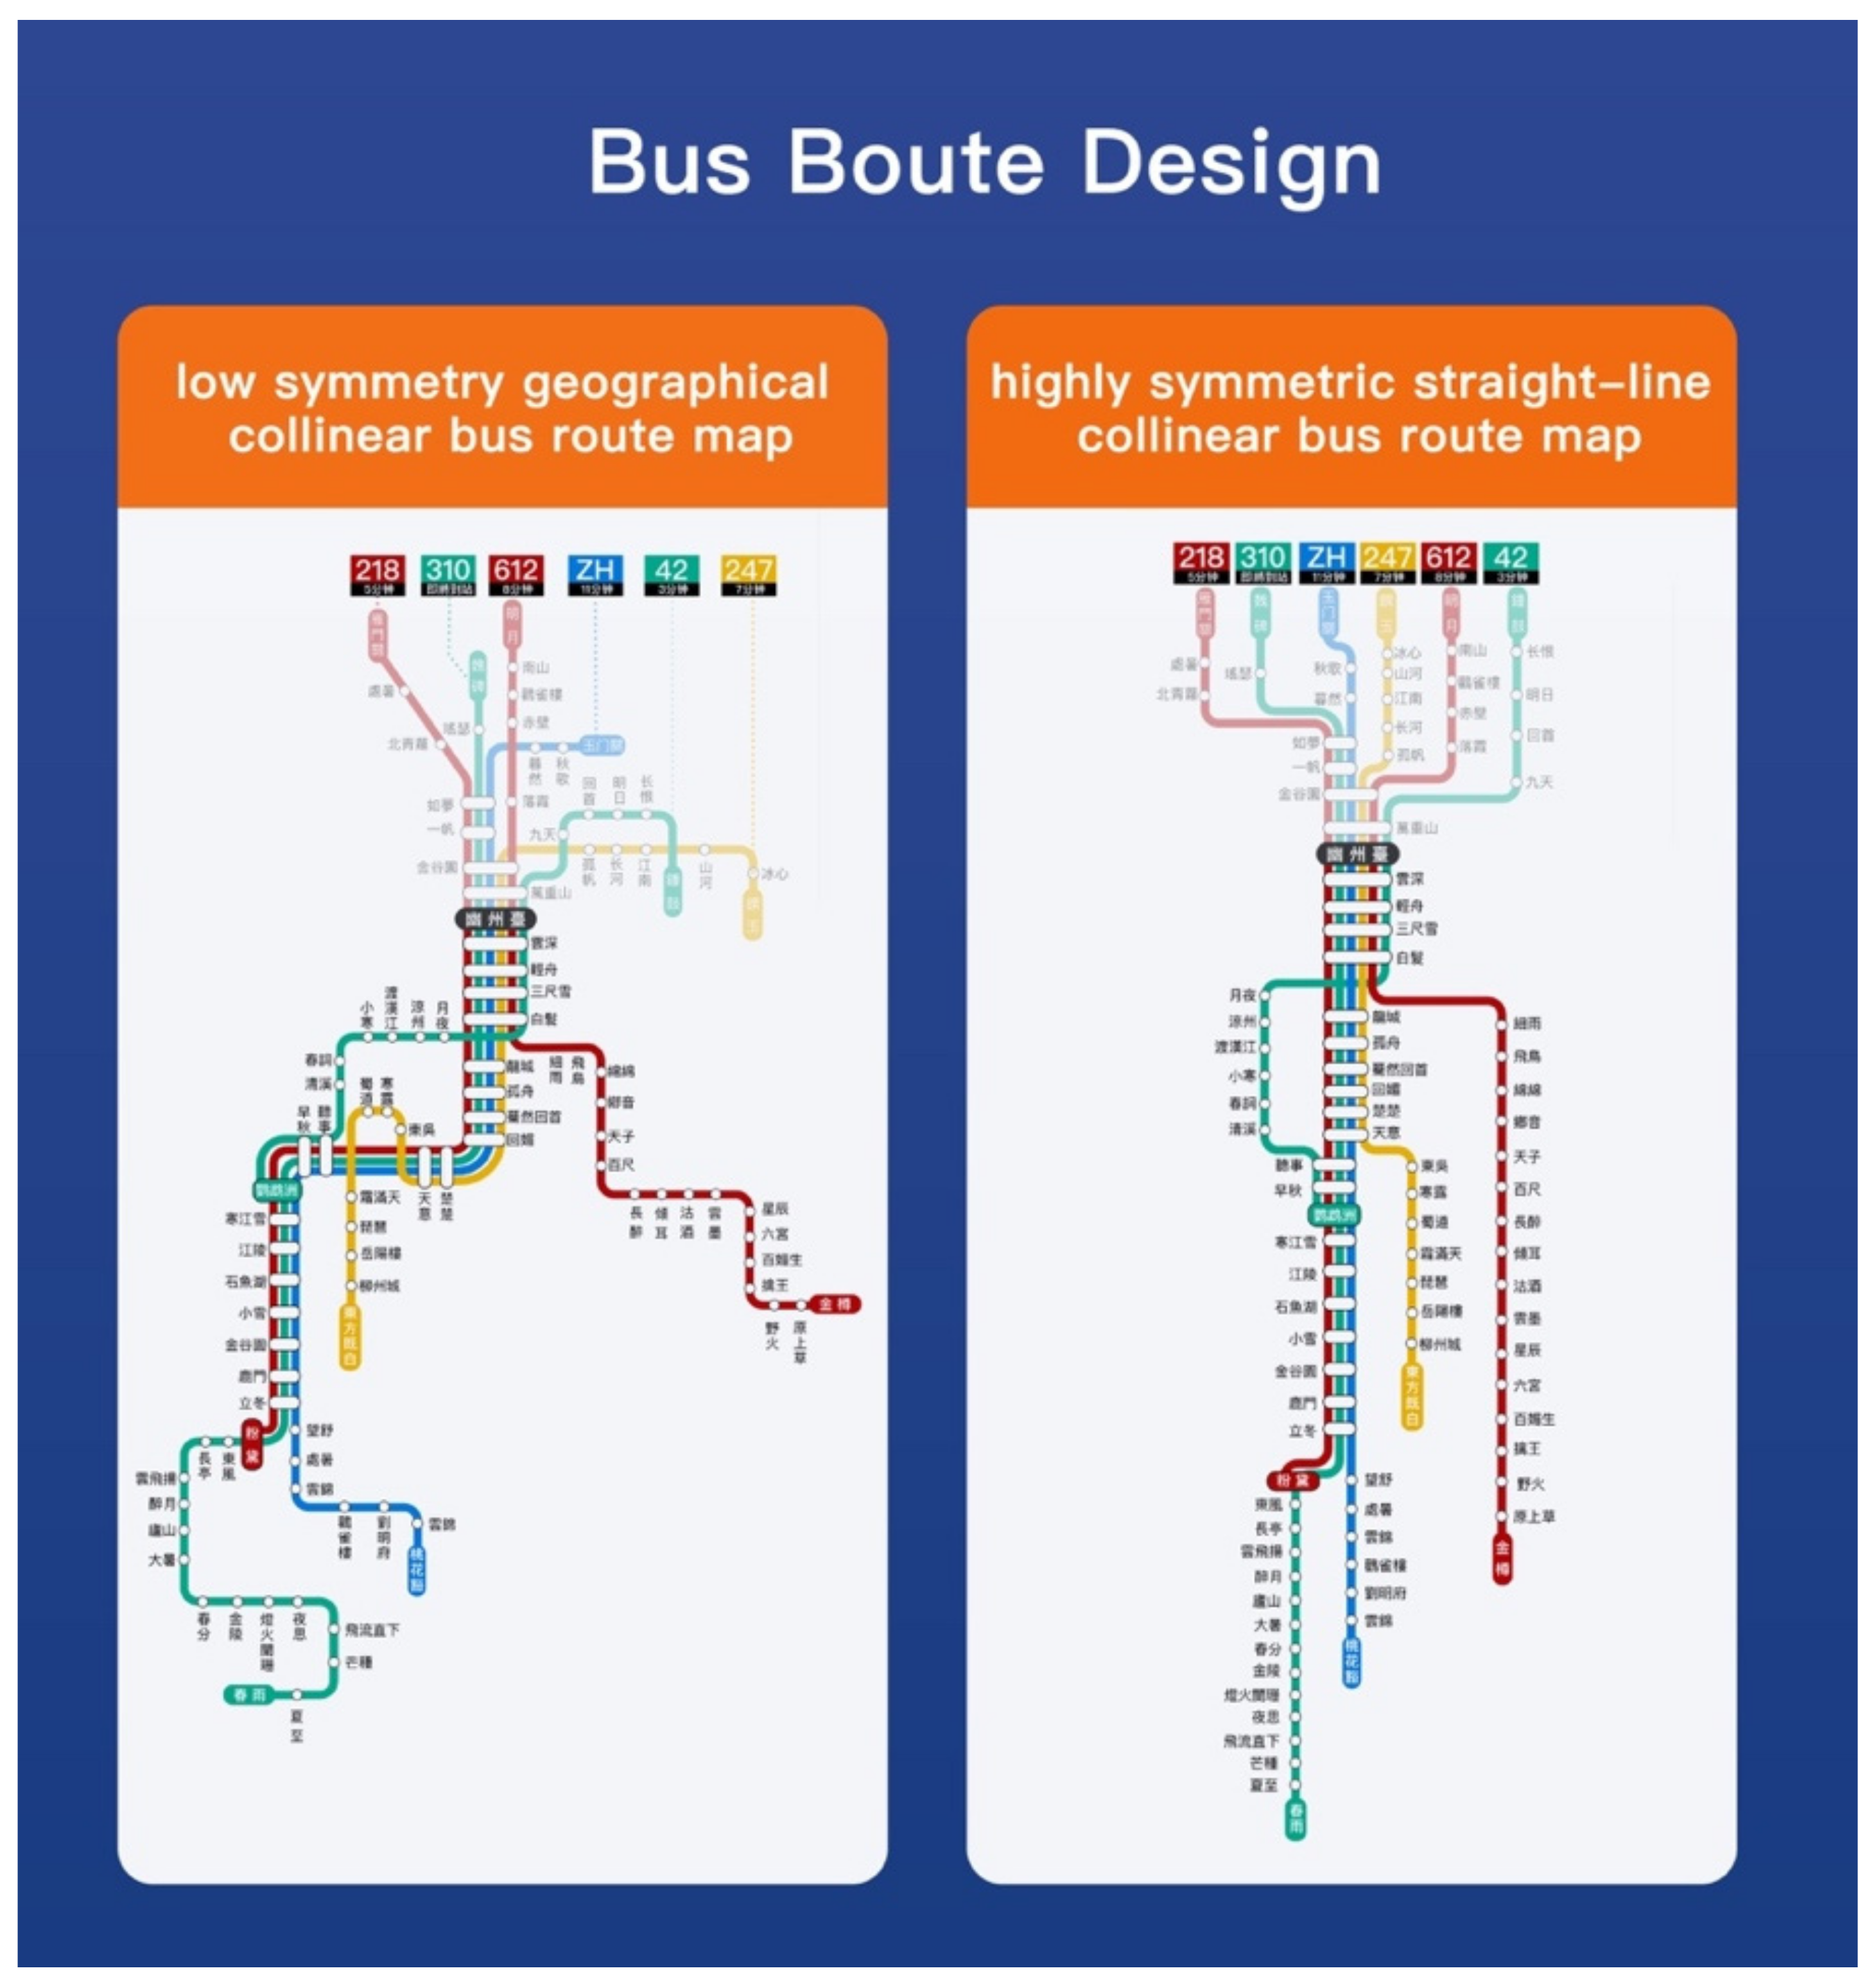
2.2. Bus Stop Route Map Design
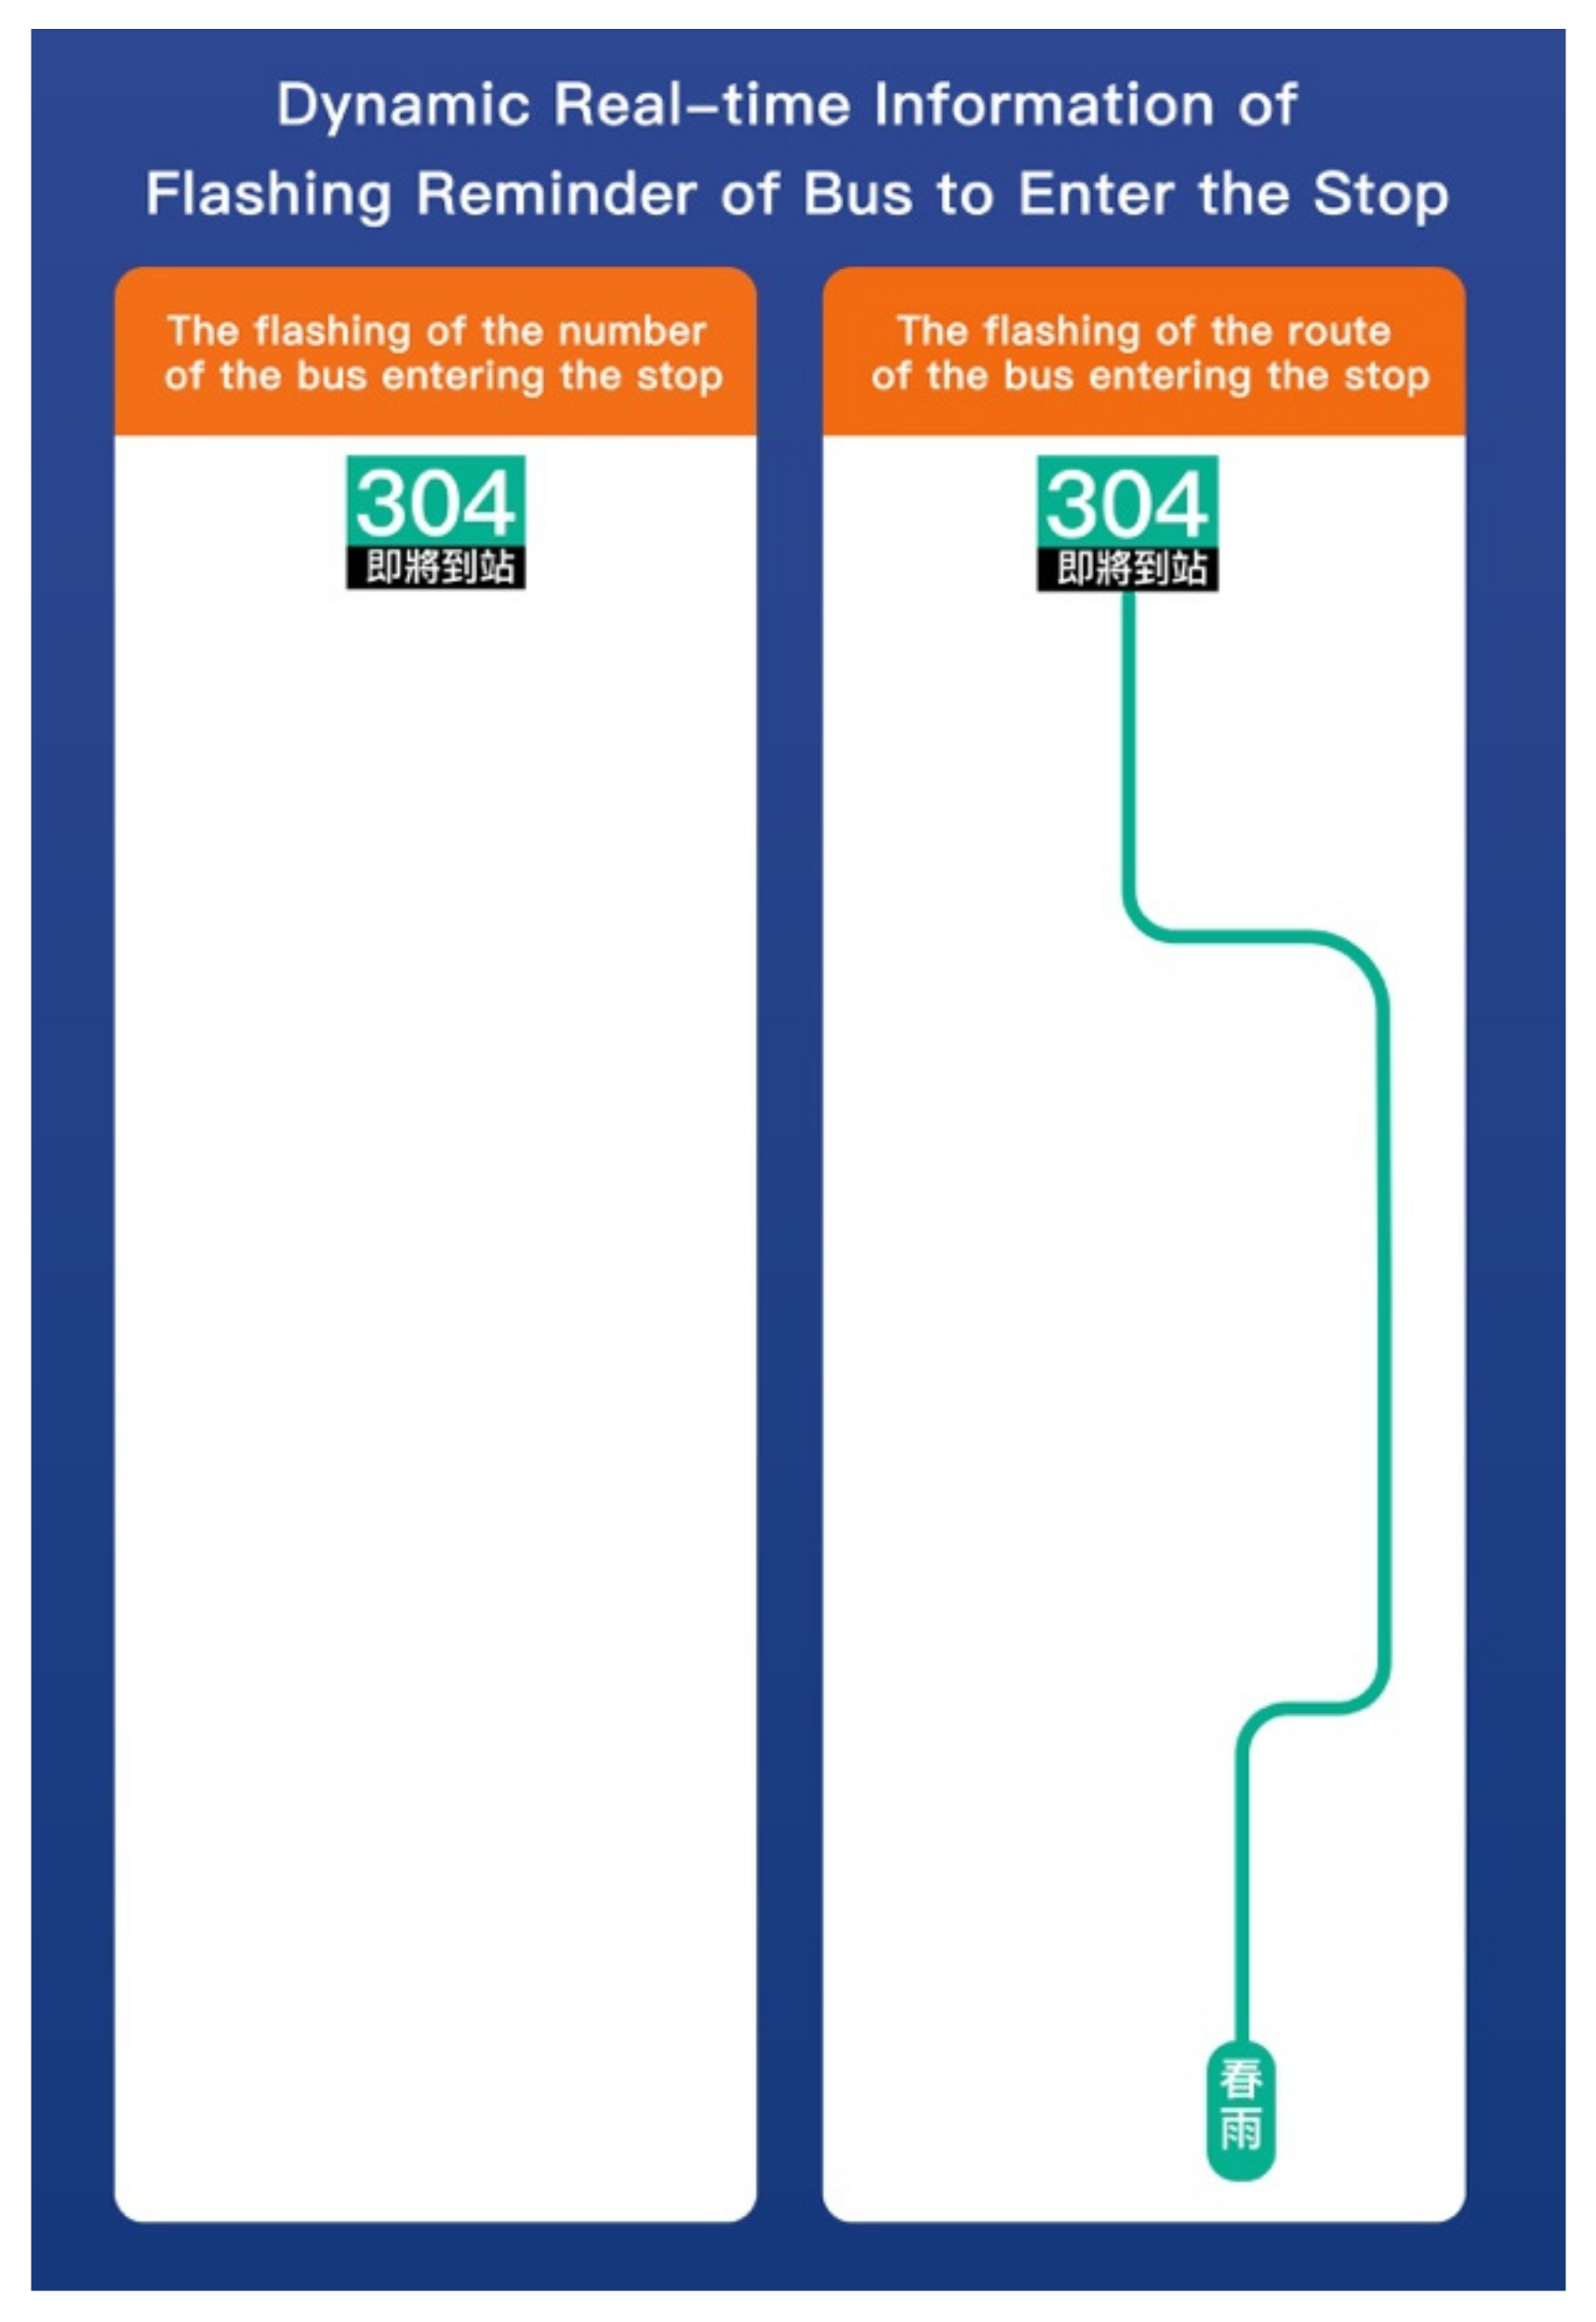
2.3. Dynamic Real-Time Information Design
2.4. Cognitive Load
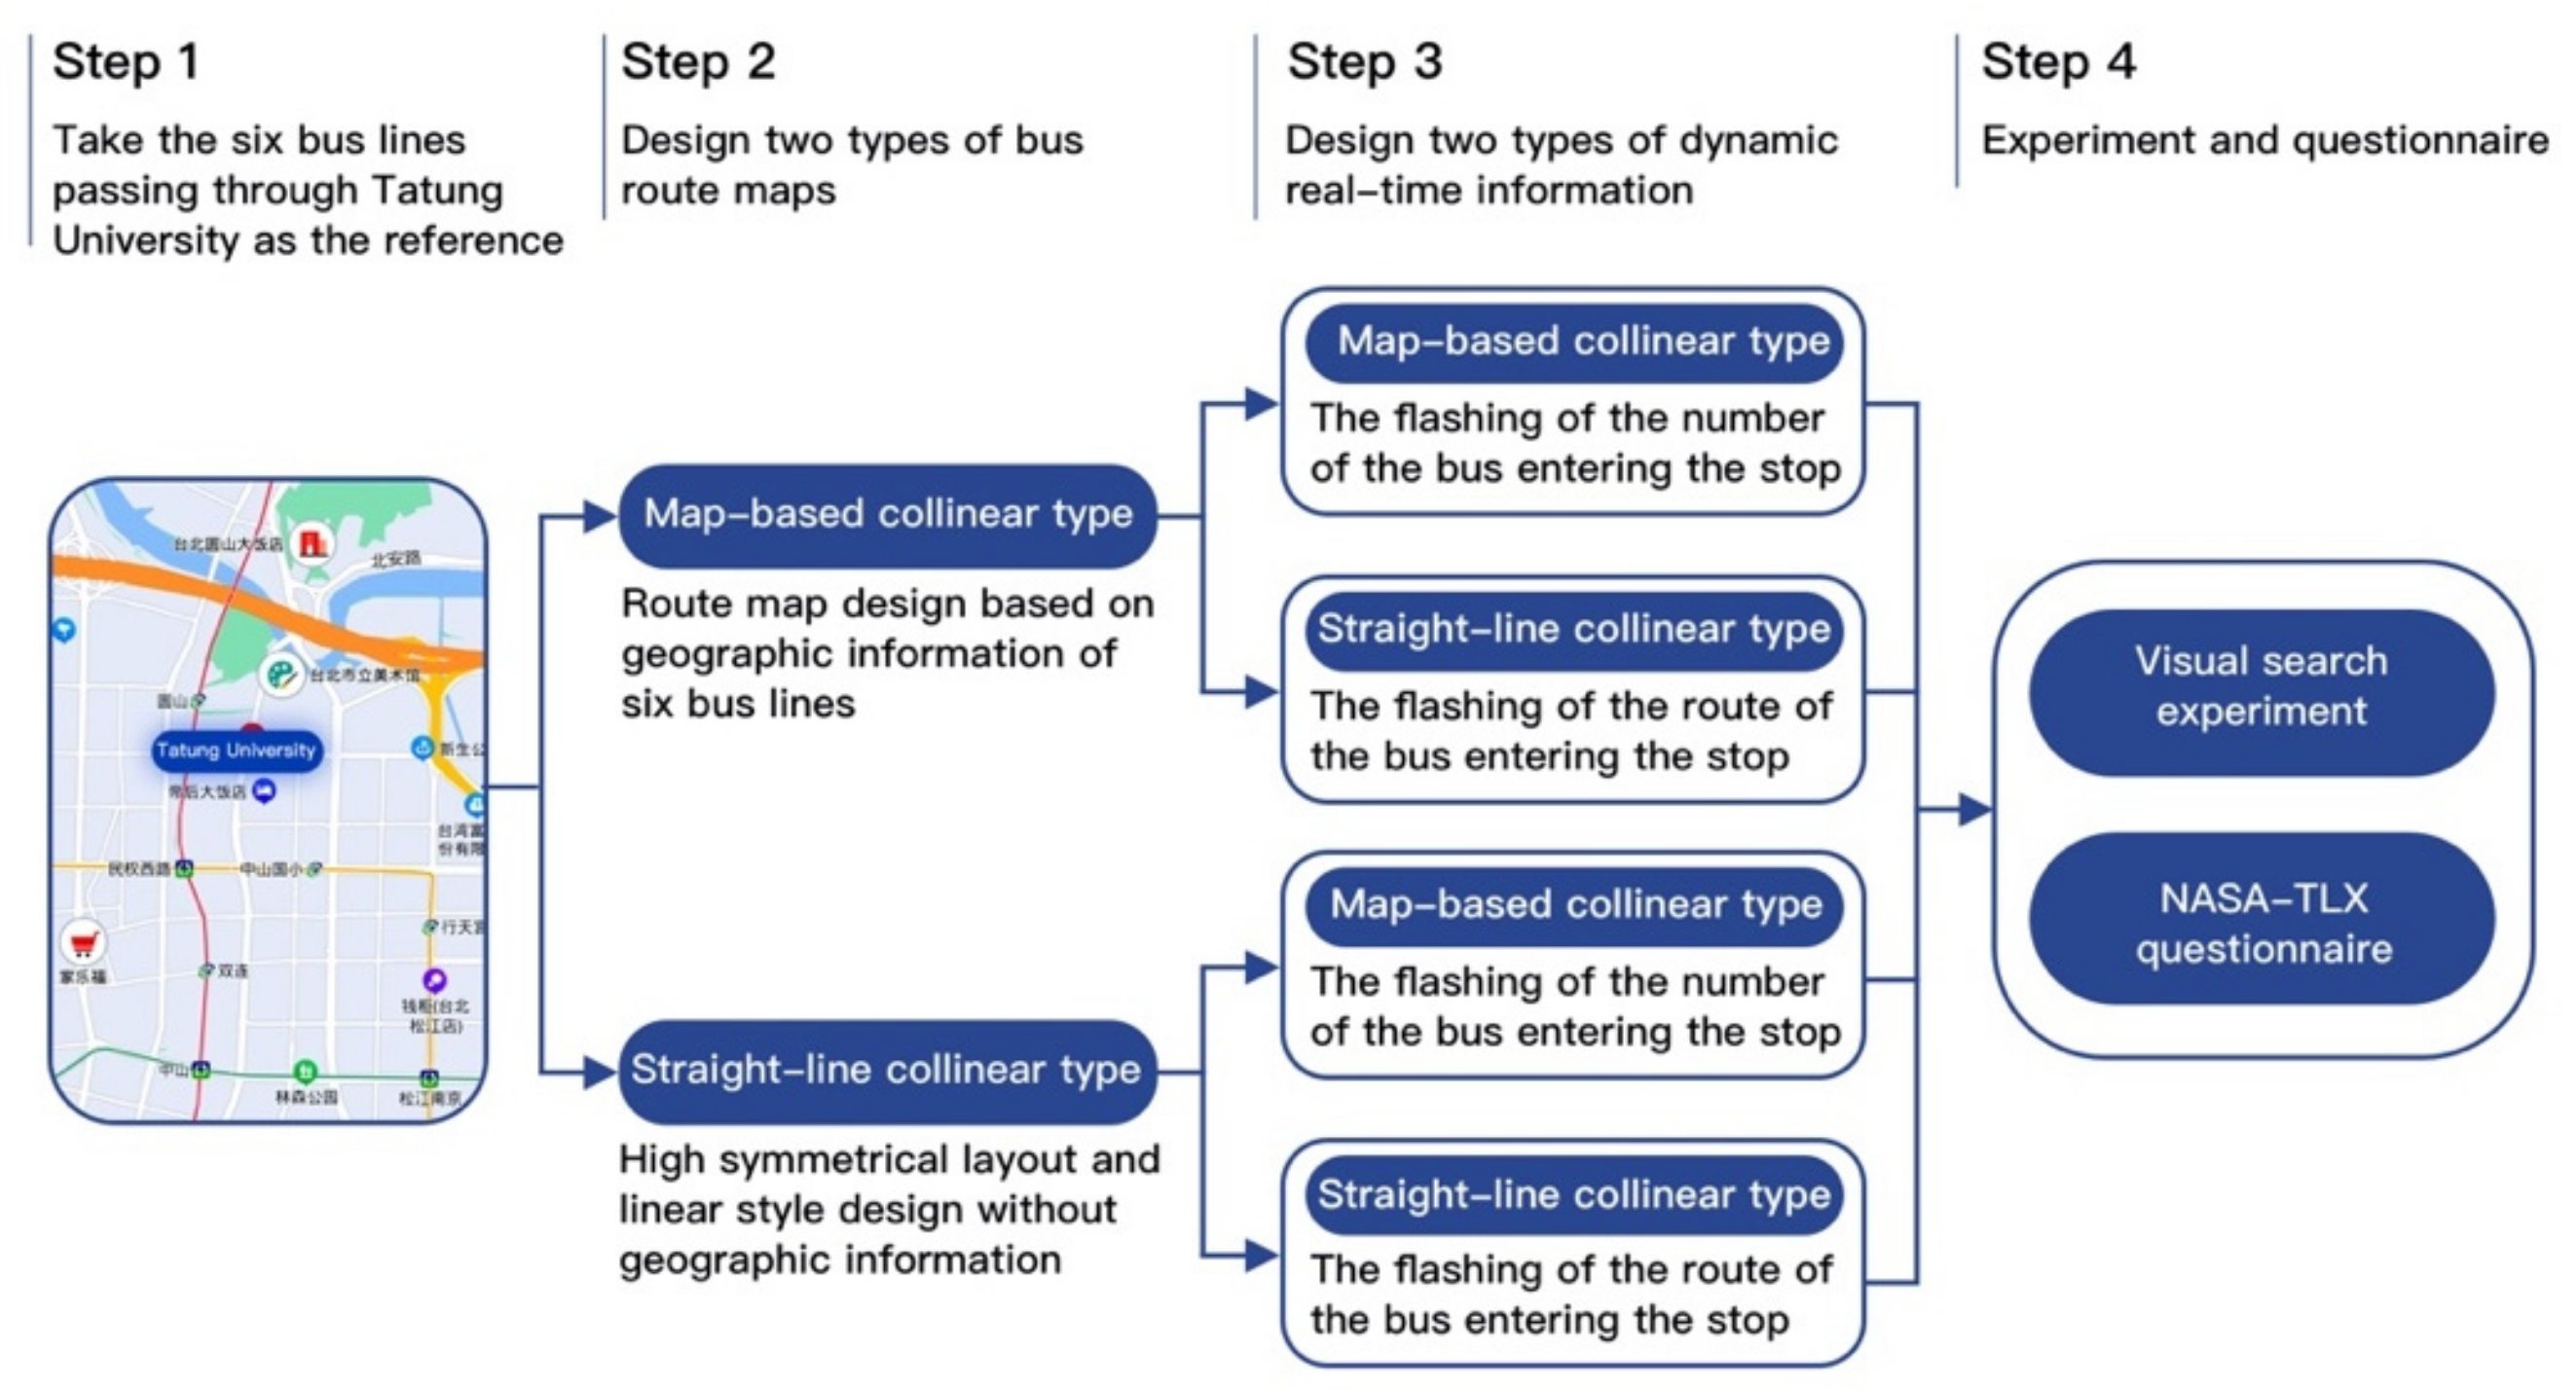
3. Methods
3.1. Participants
3.2. Experimental Variables
3.3. Experimental Design
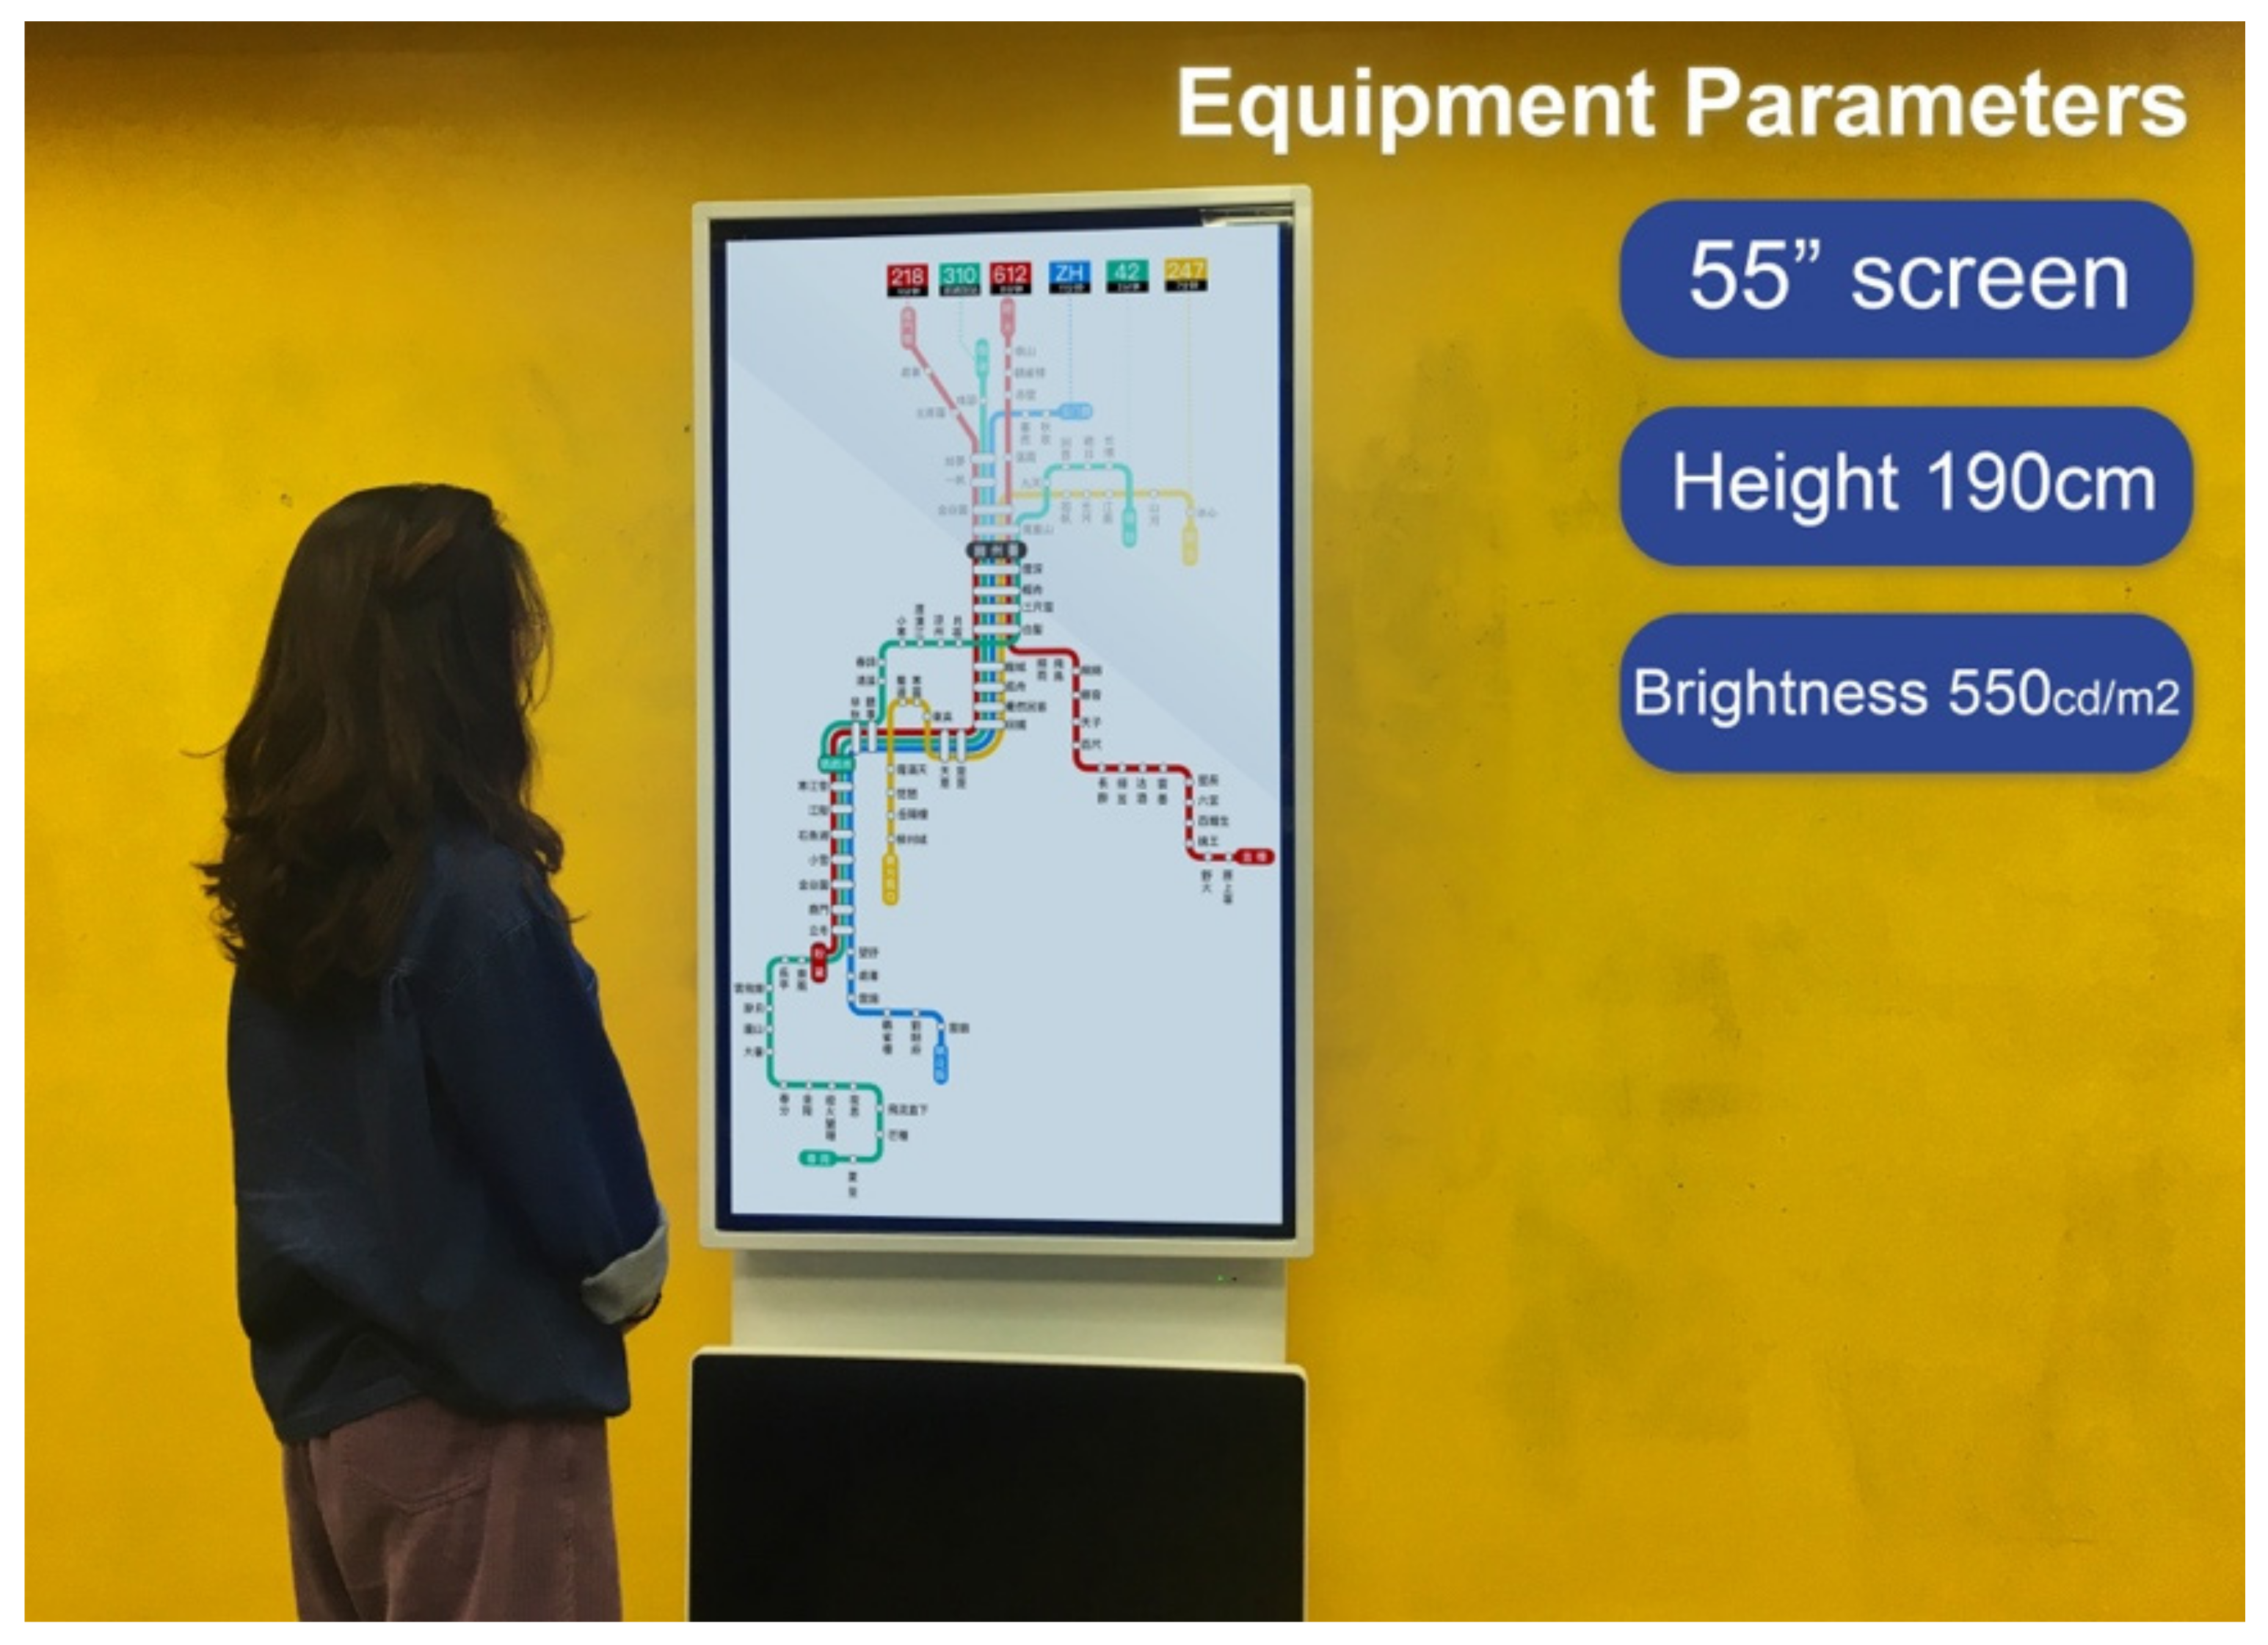
3.4. Experimental Equipment
4. Result
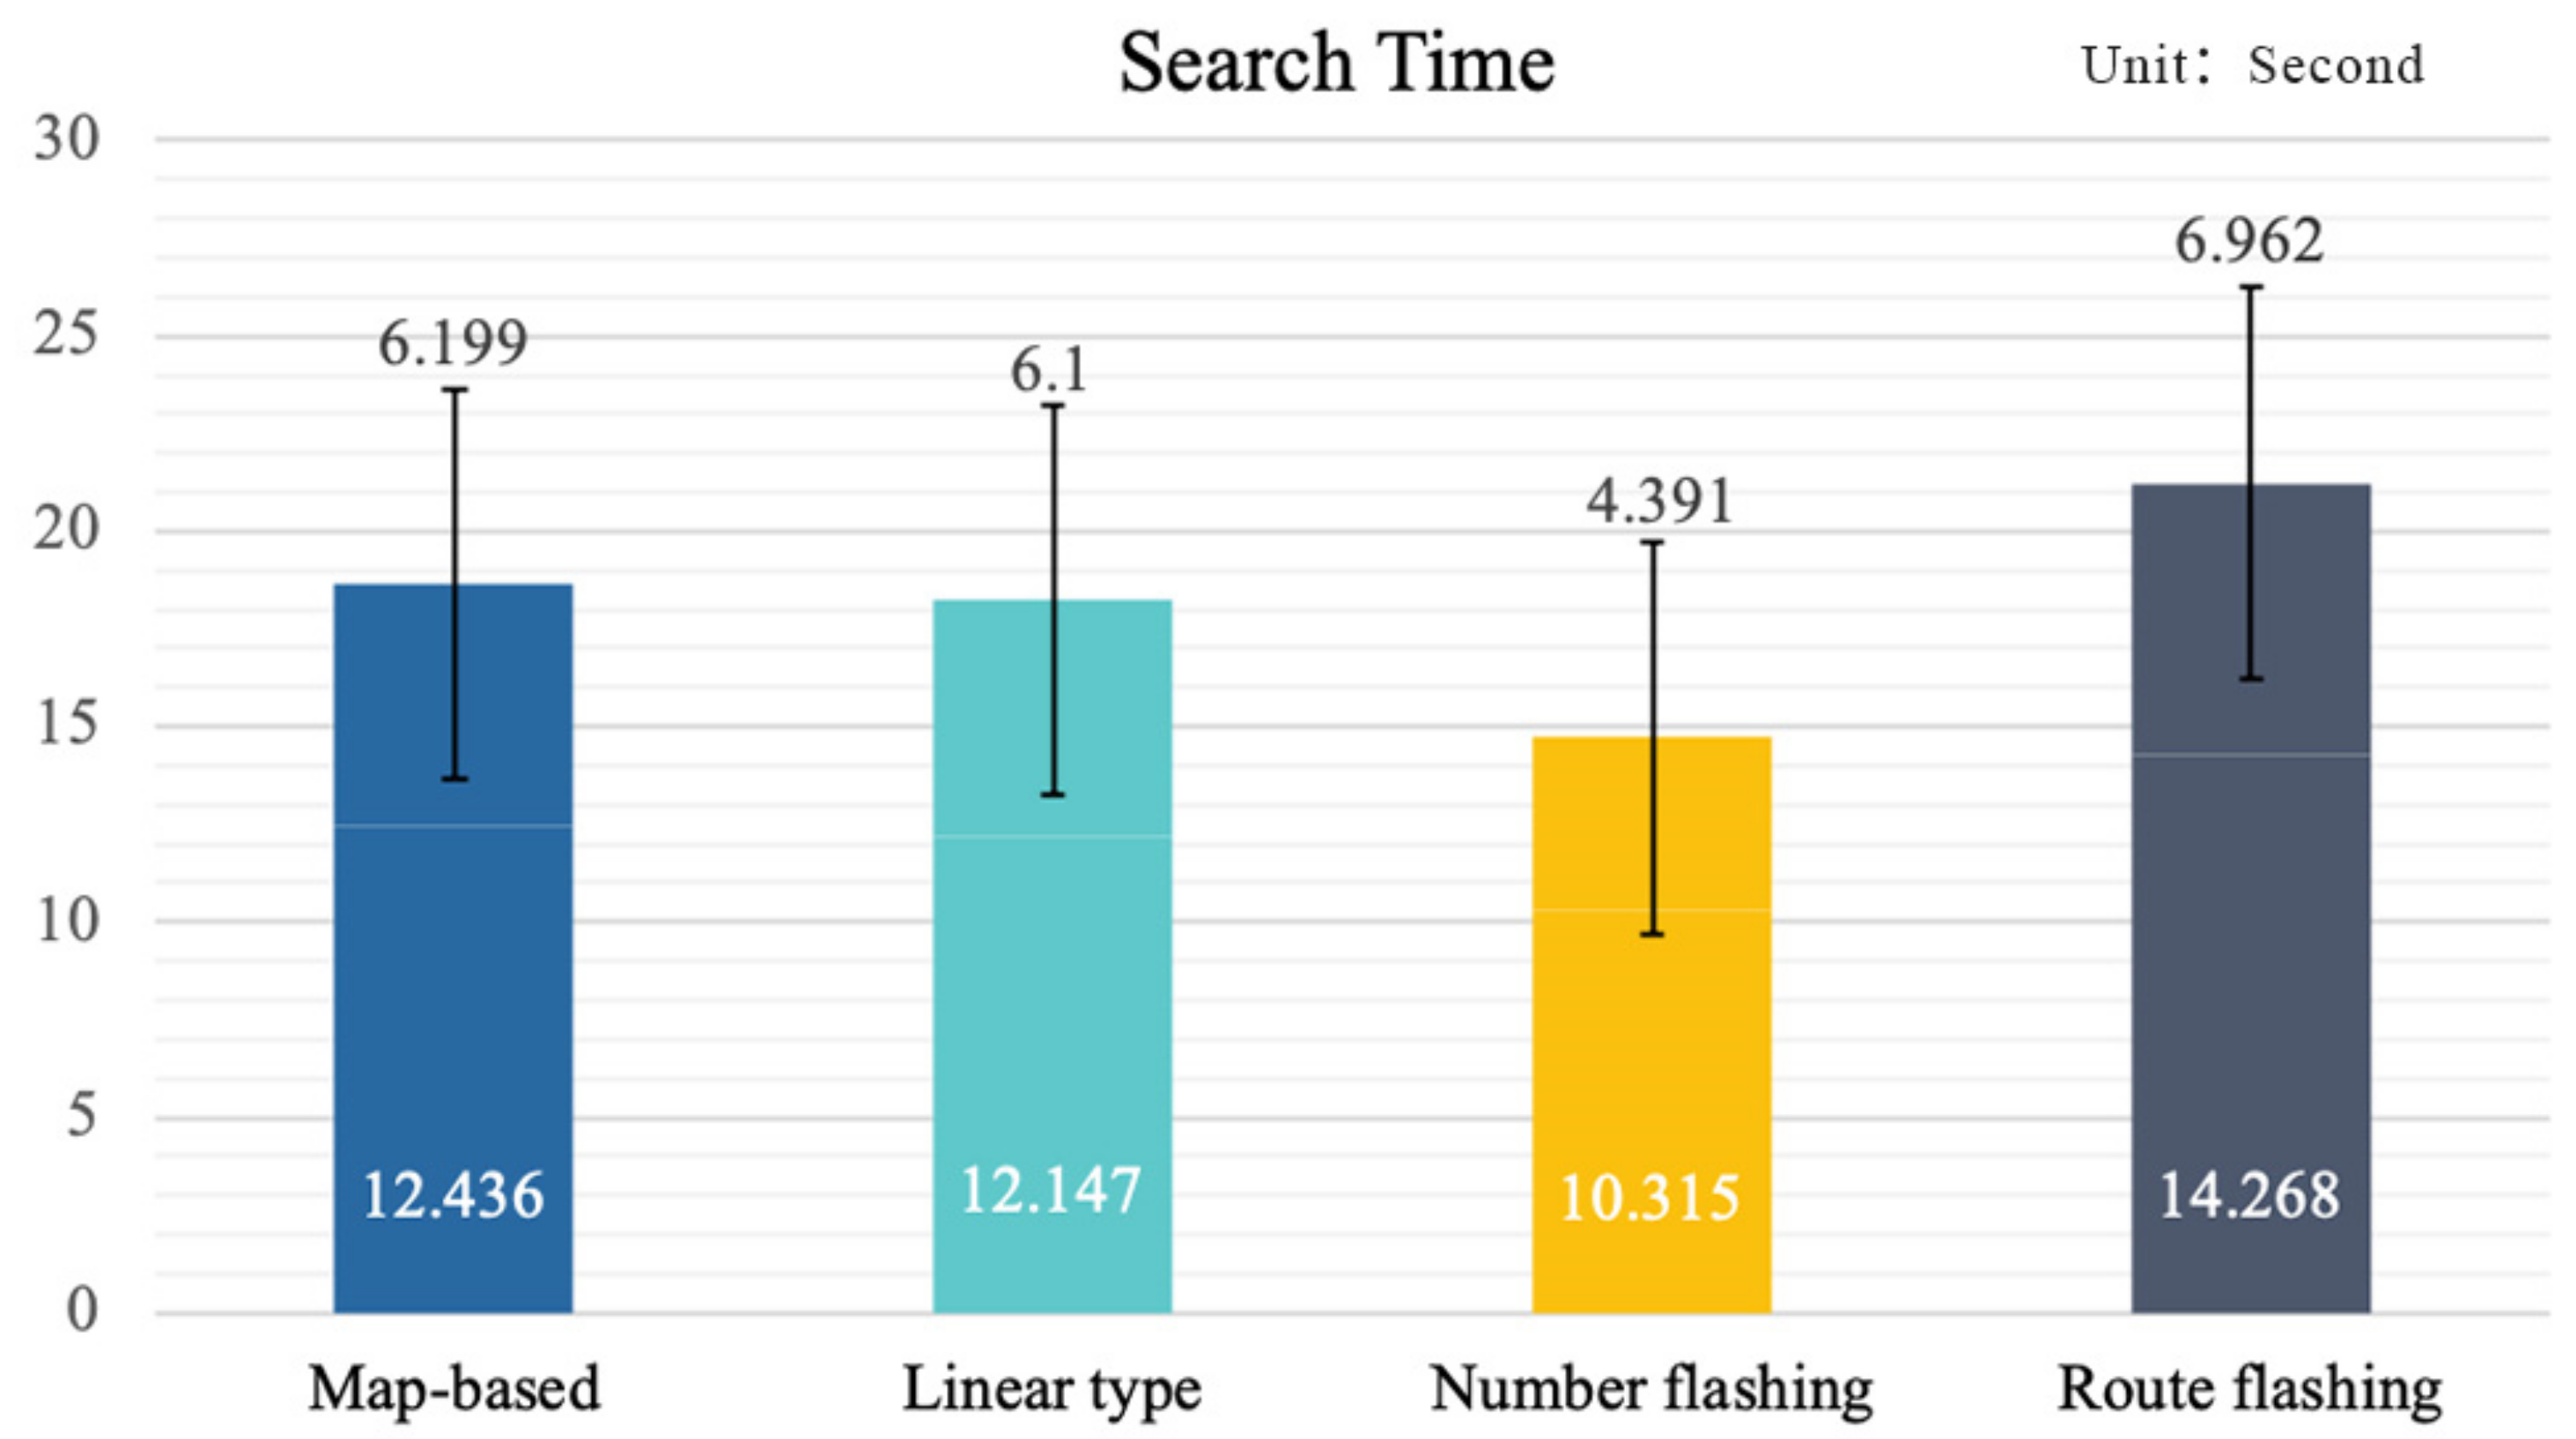
4.1. Search Performance
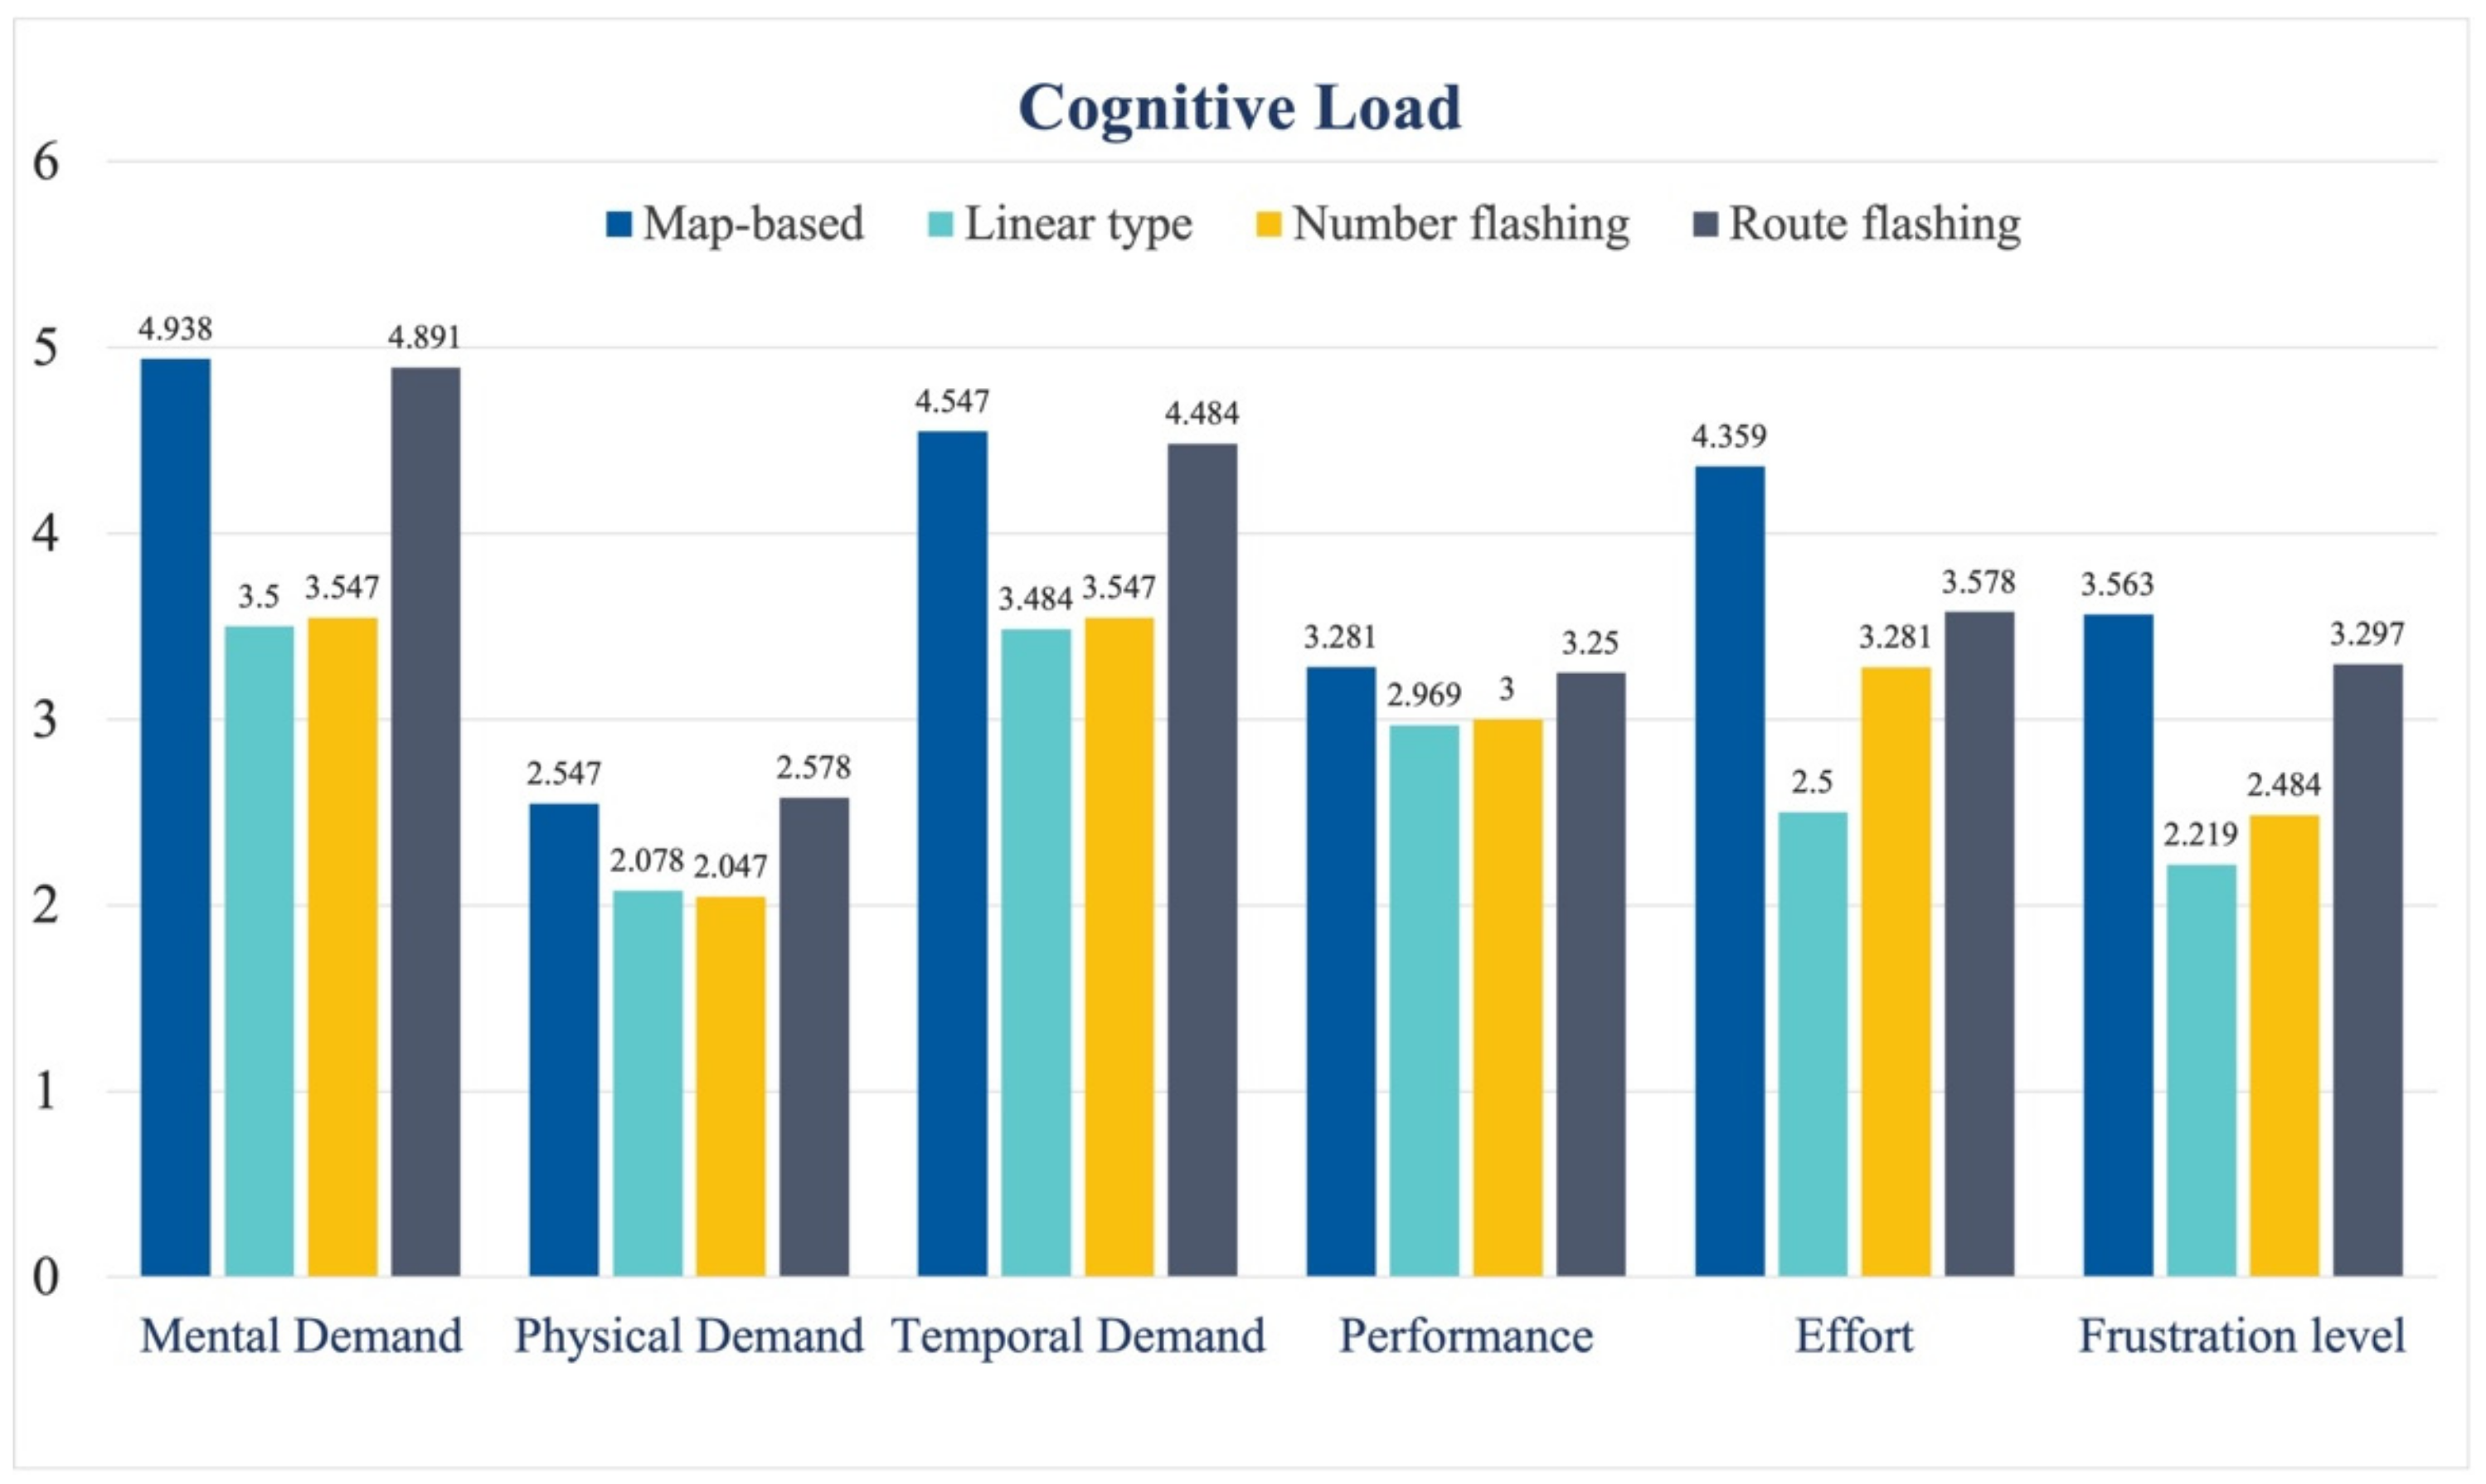
4.2. Cognitive Load Assessment
4.3. Discussion
5. Conclusions
- (1)
- The cognitive load of users who used the map-type bus route map was higher than that of the linear route map, However, the search efficiency of users using the map-type bus route map was not significantly different from that of the linear route map. When designing a route-map, the details of geographic location information could be appropriately increased.
- (2)
- The search efficiency of the bus route map with real-time information of the flashing of the route of the approaching bus was significantly lower than that of the flashing of the number. The cognitive load of the flashing of the bus number was lower than the flashing of the bus route. Route map design and dynamic real-time information did not interact in terms of search efficiency or cognitive load. The design of dynamic real-time information should control the range of highlight reminding to avoid reducing visual search efficiency.
- (3)
- In terms of route map design and dynamic real-time information, there was no significant difference in cognitive load between men and women, but in terms of search performance, when faced with the map-based route map design, men’s search efficiency was significantly higher than that of women.
Author Contributions
Funding
Institutional Review Board Statement
Informed Consent Statement
Data Availability Statement
Conflicts of Interest
References
- Yeung, T. Editorial to “Using IT tools to improve service.”. Public Transp. Int. 2004, 53, 2–3. [Google Scholar]
- Infopolis 2 Consortium. Review of Current Passenger Information Systems; Technical Report for Commission of the European Communities, DG XIII; European Commission: Brussels, Belgium, 1998. [Google Scholar]
- Infopolis 2 Consortium. Needs of Travellers: An Analysis Based on the Study of Their Tasks and Activities; Technical Report for Commission of the European Communities, DG XIII; European Commission: Brussels, Belgium, 1999. [Google Scholar]
- Gallotti, R.; Porter, M.A.; Barthelemy, M. Lost in transportation: Information measures and cognitive limits in multilayer navigation. Sci. Adv. 2016, 2, e1500445. [Google Scholar] [CrossRef] [Green Version]
- Kronborg, P.; Lindkvist, A.; Schelin, E. Fungerar transport informatik i praktiken? TFK–Inst. För Transp. Rapp. 2002, 18, 160–169. [Google Scholar]
- Prandi, C.; Roccetti, M.; Salomoni, P.; Nisi, V.; Nunes, N.J. Fighting exclusion: A multimedia mobile app with zombies and maps as a medium for civic engagement and design. Multimed. Tools Appl. 2017, 76, 4951–4979. [Google Scholar] [CrossRef]
- Ovenden, M. Transit Maps of the World: Expanded and Updated Edition of the World’s First Collection of Every Urban Train Map on Earth; Penguin: New York, NY, USA, 2015. [Google Scholar]
- Battelle Memorial Institute. Evaluation of the Freightliner Intelligent Vehicle Initiative Field Operational Test; Final Report; US Department of Transportation: Washington, DC, USA, 2003. [Google Scholar]
- Ferris, B.; Watkins, K.; Borning, A. Location-aware tools for improving public transit usability. IEEE Pervasive Comput. 2010, 9, 13. [Google Scholar] [CrossRef]
- Hodges, T.; Potter, J. Transportation’s Role in Reducing US Greenhouse Gas Emissions: Volume 1: Synthesis Report and Volume 2: Technical Report; The National Academies of Sciences, Engineering, and Medicine: Washington, DC, USA, 2010. [Google Scholar]
- Timpf, S.; Heye, C. Complexity of Routes in Multi-Modal Wayfinding; ETH: Zurich, Switzerland, 2002. [Google Scholar]
- Stott, J.; Rodgers, P.; Martinez-Ovando, J.C.; Walker, S.G. Automatic metro map layout using multicriteria optimization. IEEE Trans. Vis. Comput. Graph. 2010, 17, 101–114. [Google Scholar] [CrossRef] [PubMed] [Green Version]
- Ovenden, M. Metro Maps of the World; Capital Transport: Berkshire, UK, 2005; pp. 85–86. [Google Scholar]
- Nöllenburg, M. A survey on automated metro map layout methods. In Proceedings of the Schematic Mapping Workshop 2014, Wivenhoe, UK, 2–3 April 2014; Volume 2014. [Google Scholar]
- Peng, Z.R.; Yu, D.; Beimborn, E. Transit user perceptions of the benefits of automatic vehicle location. Transp. Res. Rec. 2002, 1791, 127–133. [Google Scholar] [CrossRef]
- Caulfield, B.; O’Mahony, M. An examination of the public transport information requirements of users. IEEE Trans. Intell. Transp. Syst. 2007, 8, 21–30. [Google Scholar] [CrossRef]
- Tang, L.; Thakuriah, P.V. Ridership effects of real-time bus information system: A case study in the City of Chicago. Transp. Res. Part C Emerg. Technol. 2012, 22, 146–161. [Google Scholar] [CrossRef]
- Horowitz, T.S.; Wolfe, J.M. Visual search has no memory. Nature 1998, 394, 575–577. [Google Scholar] [CrossRef]
- Chan, A.H.; Yu, R. Validating the random search model for two targets of different difficulty. Percept. Mot. Ski. 2010, 110, 167–180. [Google Scholar] [CrossRef]
- Lehto, M.R. Designing warning signs and warning labels: Part I—Guidelines for the practitioner. Int. J. Ind. Ergonom. 1992, 10, 105–113. [Google Scholar] [CrossRef]
- Trick, L.M.; Enns, J.T. Lifespan changes in attention: The visual search task. Cogn. Dev. 1998, 13, 369–386. [Google Scholar] [CrossRef]
- Bouma, H. Visual interference in the parafoveal recognition of initial and final letters of words. Vis. Res. 1973, 13, 767–782. [Google Scholar] [CrossRef]
- Van Nes, F.L. A new teletext character set with enhanced legibility. IEEE Trans. Electron Devices 1986, 33, 1222–1225. [Google Scholar] [CrossRef] [Green Version]
- Mijksenaar, P. Visual Function: An Introduction to Information Design; 010 Publishers: Rotterdam, The Netherlands, 1997. [Google Scholar]
- Durrani, S.; Durrani, Q.S. Applying cognitive psychology to user interfaces. In Proceedings of the First International Conference on Intelligent Human Computer Interaction, Allahabad, India, 20–23 January 2009; Springer: New Delhi, India, 2009; pp. 156–168. [Google Scholar] [CrossRef]
- Roberts, M.J. Underground Maps Unravelled: Explorations in Information Design; Maxwell J Roberts: Wivenhoe, UK, 2012. [Google Scholar]
- Roberts, M.J. Schematic Maps in the Laboratory; Maxwell J Roberts: Wivenhoe, UK, 2014. [Google Scholar]
- Netzel, R.; Ohlhausen, B.; Kurzhals, K.; Woods, R.; Burch, M.; Weiskopf, D. User Performance and Reading Strategies for Metro Maps: An Eye Tracking Study. Spat. Cogn. Comput. 2016, 17, 39–64. [Google Scholar] [CrossRef]
- Bauerly, M.; Liu, Y. Computational modeling and experimental investigation of effects of compositional elements on interface and design aesthetics. Int. J. Hum. Comput. Stud. 2006, 64, 670–682. [Google Scholar] [CrossRef]
- Palmer, S.E.; Schloss, K.B.; Sammartino, J. Visual aesthetics and human preference. Annu. Rev. Psychol. 2013, 64, 77–107. [Google Scholar] [CrossRef] [PubMed] [Green Version]
- Lindell, A.K.; Mueller, J. Can science account for taste? Psychological insights into art appreciation. J. Cogn. Psychol. 2011, 23, 453–475. [Google Scholar] [CrossRef]
- Burch, M. Which Symbols, Features, and Regions Are Visually Attended in Metro Maps? In Proceedings of the Eye Movement Data Processing and Analysis (EMDPA), Vilamoura, Portugal, 21 June 2017. [Google Scholar]
- Burch, M.; Woods, R.; Netzel, R.; Weiskopf, D. The Challenges of Designing Metro Maps. In Proceedings of the International Conference on Information Visualization Theory and Applications, Rome, Italy, 27–29 February 2016; pp. 195–202. [Google Scholar] [CrossRef] [Green Version]
- DiBiase, D.; MacEachren, A.M.; Krygier, J.B.; Reeves, C. Animation and the role of map design in scientific visualization. Cartogr. Geogr. Inf. Syst. 1992, 19, 201–214. [Google Scholar] [CrossRef]
- Becker, R.A.; Cleveland, W.S.; Shyu, M.J. The visual design and control of trellis display. J. Comput. Graph. Stat. 1996, 5, 123–155. [Google Scholar]
- Finke, R.A. Creative Imagery: Discoveries and Inventions in Visualization; Psychology Press: New York, NY, USA, 2014. [Google Scholar] [CrossRef]
- Saffer, D. Microinteractions: Full Color Edition Designing with Details; O’Reilly Media, Inc.: Sebastopol, CA, USA, 2013. [Google Scholar]
- Hickman, M.D.; Wilson, N.H. Passenger travel time and path choice implications of real-time transit information. Transp. Res. Part C Emerg. Technol. 1995, 3, 211–226. [Google Scholar] [CrossRef]
- Holdsworth, N.; Enoch, M.P.; Ison, S.G. Examining the political and practical reality of bus-based real time passenger information. Transp. Plan. Technol. 2007, 30, 183–204. [Google Scholar] [CrossRef] [Green Version]
- Wu, C.F.; Cho, W.J.; Lin, K.C.; Lee, F.Y. Legibility of light-emitting diode destination indicators mounted on the front of public buses. Symmetry 2019, 11, 42. [Google Scholar] [CrossRef] [Green Version]
- Rogers, Y. Moving on from weiser’s vision of calm computing: Engaging ubicomp experiences. In UbiComp 2006: Ubiquitous Computing, Proceedings of the 8th International Conference, UbiComp 2006, Orange County, CA, USA, 17–21 September 2006; Springer: Berlin/Heidelberg, Germany, 2006; pp. 404–421. [Google Scholar] [CrossRef] [Green Version]
- Blok, C.A. Interactive animation to visually explore time series of satellite imagery. In Visual Information and Information Systems, Proceedings of the 8th International Conference, VISUAL 2005, Amsterdam, The Netherlands, 5 July 2005; Springer: Berlin/Heidelberg, Germany, 2005; pp. 71–82. [Google Scholar] [CrossRef]
- MacEachren, A.M. Visualization in Modern Cartography; Pergamon Press: Oxford, UK, 1994; Volume 28, pp. 1–2. [Google Scholar]
- Touch, A.N.; Bargas-Avila, J.A.; Opwis, K.; Wilhelm, F.H. Visual complexity of websites: Effects on users’ experience, physiology, performance, and memory. Int. J. Hum. Comput. Stud. 2009, 67, 703–715. [Google Scholar] [CrossRef]
- Moray, N. Mental Workload: Its Theory and Measurement; Springer: Berlin, Germany, 2013. [Google Scholar]
- Hart, S.G. NASA-task load index (NASA-TLX); 20 years later. In Proceedings of the Human Factors and Ergonomics Society Annual Meeting, San Francisco, CA, USA, 16–20 October 2006; Sage Publications: Los Angeles, CA, USA, 2006; Volume 50, pp. 904–908. [Google Scholar] [CrossRef] [Green Version]
- Hart, S.G.; Staveland, L.E. Development of NASA-TLX (Task Load Index): Results of empirical and theoretical research. Adv. Psychol. 1988, 52, 139–183. [Google Scholar] [CrossRef]
- Desolda, G.; Ardito, C.; Jetter, H.C.; Lanzilotti, R. Exploring spatially-aware cross-device interaction techniques for mobile collaborative sensemaking. Int. J. Hum. Comput. St. 2018, 122, 904–908. [Google Scholar] [CrossRef]
- Sketch Course. Available online: https://www.sketch.net.cn/list/course (accessed on 8 December 2021).
- Grant, D.A. The Latin square principle in the design and analysis of psychological experiments. Psychol. Bull. 1948, 45, 427. [Google Scholar] [CrossRef] [PubMed]
- Mayas, C.; Hörold, S.; Stelzer, A.; Englert, F.; Krömker, H. Evaluation of dispatcher requirements on automated customer feedback in public transport. In Human-Computer Interaction—INTERACT 2015, Proceedings of the 15th IFIP TC 13 International Conference, Bamberg, Germany, 14–18 September 2015; Springer: Cham, Switzerland, 2015; pp. 537–541. [Google Scholar] [CrossRef] [Green Version]
- Mayer, R.E.; Moreno, R. Nine ways to reduce cognitive load in multimedia learning. Educ. Psychol. 2003, 38, 43–52. [Google Scholar] [CrossRef] [Green Version]
- Yan, Y.; Long, Y.; Shen, Q.; Wang, J. Spatial cognitive analysis of electronic map considering gender difference. Geogr. Geogr. Inf. Sci. 2011, 27, 48–51. [Google Scholar]
- Lawton, C.A. Gender differences in way-finding strategies: Relationship to spatial ability and spatial anxiety. Sex Roles 1994, 30, 765–779. [Google Scholar] [CrossRef]
- Lang, P.J.; Bradley, M.M.; Cuthbert, B.N. Motivated attention: Affect, activation, and action. Atten. Orienting Sens. Motiv. Processes 1997, 97, 135. [Google Scholar]
- Lavie, N. Distracted and confused? Selective attention under load. Trends Cogn. Sci. 2005, 9, 75–82. [Google Scholar] [CrossRef]
- Wang, J.; Zhu, Z. Research progress in cognitive psychology of visual attention selectivity. Appl. Psychol. 1997, 3, 58–64. [Google Scholar]
- Fang, H.; Xin, S.; Zhang, Y.; Wang, Z.; Zhu, J. Assessing the Influence of Landmarks and Paths on the Navigational Efficiency and the Cognitive Load of Indoor Maps. ISPRS Int. J. Geoinf. 2020, 9, 82. [Google Scholar] [CrossRef] [Green Version]


| Experiment | Independent Variable | Hierarchy |
|---|---|---|
| Search of buses available | Bus route map design | Straight-line collinear type |
| Map-based collinear type | ||
| Dynamic real-time information design | The flashing of the number of the bus entering the stop | |
| The flashing of the route of the bus entering the stop |
| Independent Variable | Level | M | SD | F | p |
|---|---|---|---|---|---|
| Route map design | Map-based | 12.436 | 6.199 | 0.074 | 0.788 |
| Linear type | 12.147 | 6.100 | |||
| Real-time information | Number flashing | 10.315 | 4.391 | 19.805 | 0.000 |
| Route flashing | 14.268 | 6.962 |
| Independent Variable | Gender | Map-Based (M) | p | Linear Type (M) | p |
|---|---|---|---|---|---|
| search time | Male | 10.663 | 0.008 | 11.378 | 0.333 |
| Female | 14.210 | 12.915 |
| Independent Variable | Gender | Number Flashing (M) | p | Route Flashing (M) | p |
|---|---|---|---|---|---|
| search time | Male | 9.227 | 0.033 | 12.814 | 0.072 |
| Female | 11.403 | 15.721 |
| Independent Variable | Level | M | SD | F | p |
|---|---|---|---|---|---|
| Mental Demand | Map-based | 4.938 | 2.1 | 20.208 | 0.000 |
| Linear type | 3.5 | 1.763 | |||
| Number flashing | 3.547 | 2.282 | 30.318 | 0.000 | |
| Route flashing | 4.891 | 1.561 | |||
| Physical Demand | Map-based | 2.547 | 1.425 | 5.947 | 0.021 |
| Linear type | 2.078 | 0.931 | |||
| Number flashing | 2.047 | 1.075 | 16.452 | 0.000 | |
| Route flashing | 2.578 | 1.307 | |||
| Temporal Demand | Map-based | 4.484 | 2.023 | 14.004 | 0.001 |
| Linear type | 3.547 | 1.763 | |||
| Number flashing | 3.547 | 1.975 | 23.936 | 0.000 | |
| Route flashing | 4.484 | 1.817 | |||
| Performance | Map-based | 3.656 | 2.01 | 5.578 | 0.025 |
| Linear type | 2.969 | 1.522 | |||
| Number flashing | 3.156 | 1.766 | 6.424 | 0.017 | |
| Route flashing | 3.469 | 1.851 | |||
| Effort | Map-based | 4.359 | 1.684 | 95.726 | 0.000 |
| Linear type | 2.5 | 1.234 | |||
| Number flashing | 3.281 | 1.741 | 3.642 | 0.066 | |
| Route flashing | 3.578 | 1.744 | |||
| Frustration level | Map-based | 3.563 | 2.13 | 24.24 | 0.000 |
| Linear type | 2.219 | 1.119 | |||
| Number flashing | 2.484 | 1.782 | 27.743 | 0.000 | |
| Route flashing | 3.297 | 1.788 |
Publisher’s Note: MDPI stays neutral with regard to jurisdictional claims in published maps and institutional affiliations. |
© 2022 by the authors. Licensee MDPI, Basel, Switzerland. This article is an open access article distributed under the terms and conditions of the Creative Commons Attribution (CC BY) license (https://creativecommons.org/licenses/by/4.0/).
Share and Cite
Wu, C.-F.; Gao, C.; Lin, K.-C.; Chang, Y.-H. Evaluating Impacts of Bus Route Map Design and Dynamic Real-Time Information Presentation on Bus Route Map Search Efficiency and Cognitive Load. ISPRS Int. J. Geo-Inf. 2022, 11, 338. https://doi.org/10.3390/ijgi11060338
Wu C-F, Gao C, Lin K-C, Chang Y-H. Evaluating Impacts of Bus Route Map Design and Dynamic Real-Time Information Presentation on Bus Route Map Search Efficiency and Cognitive Load. ISPRS International Journal of Geo-Information. 2022; 11(6):338. https://doi.org/10.3390/ijgi11060338
Chicago/Turabian StyleWu, Chih-Fu, Chenhui Gao, Kai-Chieh Lin, and Yi-Hsin Chang. 2022. "Evaluating Impacts of Bus Route Map Design and Dynamic Real-Time Information Presentation on Bus Route Map Search Efficiency and Cognitive Load" ISPRS International Journal of Geo-Information 11, no. 6: 338. https://doi.org/10.3390/ijgi11060338
APA StyleWu, C.-F., Gao, C., Lin, K.-C., & Chang, Y.-H. (2022). Evaluating Impacts of Bus Route Map Design and Dynamic Real-Time Information Presentation on Bus Route Map Search Efficiency and Cognitive Load. ISPRS International Journal of Geo-Information, 11(6), 338. https://doi.org/10.3390/ijgi11060338