Abstract
Recognizing building group patterns is fundamental to numerous fields, such as urban landscape evaluation, social analysis, and map generalization. Despite the increasing number of algorithms available for building group pattern recognition, there is still a lack of satisfactory grouping results due to insufficient information and only geometric features being provided to recognition methods. This study aims to provide a novel building grouping method that combines building function and geometric information. We specifically focus on the process of recognizing building groups in topographic maps as a prerequisite to subsequent map generalization. First, the building functions are inferred using the dynamic time warping (DTW) algorithm based on Tencent user density data and POIs (points of interest). Then, two types of constrained Delaunay triangulations (CDTs) are created for each building block, from which several spatial indices, such as the continuity index (SCI), direction, and distance of every two adjacent buildings, are derived. Finally, each building block is modeled as a graph on the grounds of derived matrices and building function information, and a graph segmentation approach is proposed to extract building groups. A case study is conducted to test the proposed approach. The experimental results indicate that the proposed approach can produce satisfactory results, given that the correctness value is above 81.63% for our study area. Comparative studies reveal that the method without building function information is an ineffective grouping method when buildings with different functions are close to each other. In addition, generalization results derived from the proposed method are more in line with those of maps for daily use, as they provide users with more accurate spatial divisions of urban buildings.
1. Introduction
The building group pattern in cartography usually refers to the spatial distribution pattern of buildings in the mapping space. The spatial distribution pattern is usually determined by the size, distance, and direction of buildings [1,2]. Recognizing building group patterns can provide structural information that assists in choosing and parameterizing map generalization operators [3,4]. As the map generalization prerequisite (i.e., the procedure that utilizes generalization operators to solve spatial conflicts of entities and derive smaller-scale maps from larger-scale maps), recognizing building group patterns gained wide attention with the development of cartography, and gradually become one of the basic problems of geographic information science [5,6,7].
Detecting building groups is a challenging task because building group patterns are often scale-dependent and vary with building distributions (e.g., the distances, relative orientations, and topological relationships between buildings) [8,9]. However, a variety of methods were developed to recognize building group patterns for map generalization. The idea underlying these methods consists of finding potential building groups and determining the optimal building groups. These methods can be categorized into two types. The clustering method forms a potential pattern by comparing the spatial relationships between adjacent buildings. Another approach is to obtain building group patterns via template matching. Clustering methods usually use graphs to model buildings and their proximities based on constrained Delaunay triangulation (CDT) [10,11]. In a graph, nodes represent buildings, edges represent proximity relationships between buildings, and edges are weighted with spatial similarity values. Building similarity, such as the European distances, including the nearest distance [12], average distance [13], and visible distance [14], are the most common similarity measurements. In addition, the shape, area, and orientation of buildings are also utilized to measure similarity [15,16,17,18]. Template matching methods also receive wide attention, as they can be used to identify some special types of group patterns. The template approach first defines template parameters, then determines the potential group pattern, and finally compares whether the two match. Patterns recognized using this method include centerline alignment patterns [5], linear alignment patterns [19], and road alignment patterns [20]. In addition to graph segmentation methods [16], machine learning methods such as convolutional neural networks [21], random forest [22], and SVM [23] are also used to recognize building groups. However, the abovementioned methods only consider buildings’ geometric information and do not address building semantics (i.e., building functions), leading to great differences between the grouping results and those derived manually.
As geospatial big data booms, it is possible to understand urban structures via various building functions inferred using integrating multisource spatial data (such as POIs, social media data, GPS and trajectory data). With the support of machine learning methods, extracting building functions from geospatial big data emerged as an important new trend [24]. The scale of research on building function mainly focuses on the building block or community level [25,26] and the building level [27,28]. However, these two building functions are not suitable for daily use as a map. Specifically, the recognition unit at the building block level is too large for users to accurately understand building scenes, while the recognition unit at the building level scale is too small to permit understanding building scenes at high levels. In addition, such research does not consider buildings’ geometric information, leading to a lack of building pattern information. These mapping results can constrain the building group recognition process. Geospatial big data present a new opportunity for cartographic researchers in technical, methodological, and artistic realms [29]. The recognition method of combining building function information and geometric characteristics may yield more accurate and reasonable grouping results.
The remainder of this article is organized as follows: the case study and experimental datasets are described in Section 2; Section 3 provides a detailed description of a series of steps in the proposed methodology; the experiments consisting of software, implementation, recognition results, and discussion are presented in Section 4. Finally, the conclusion is presented.
2. Study Area and Data
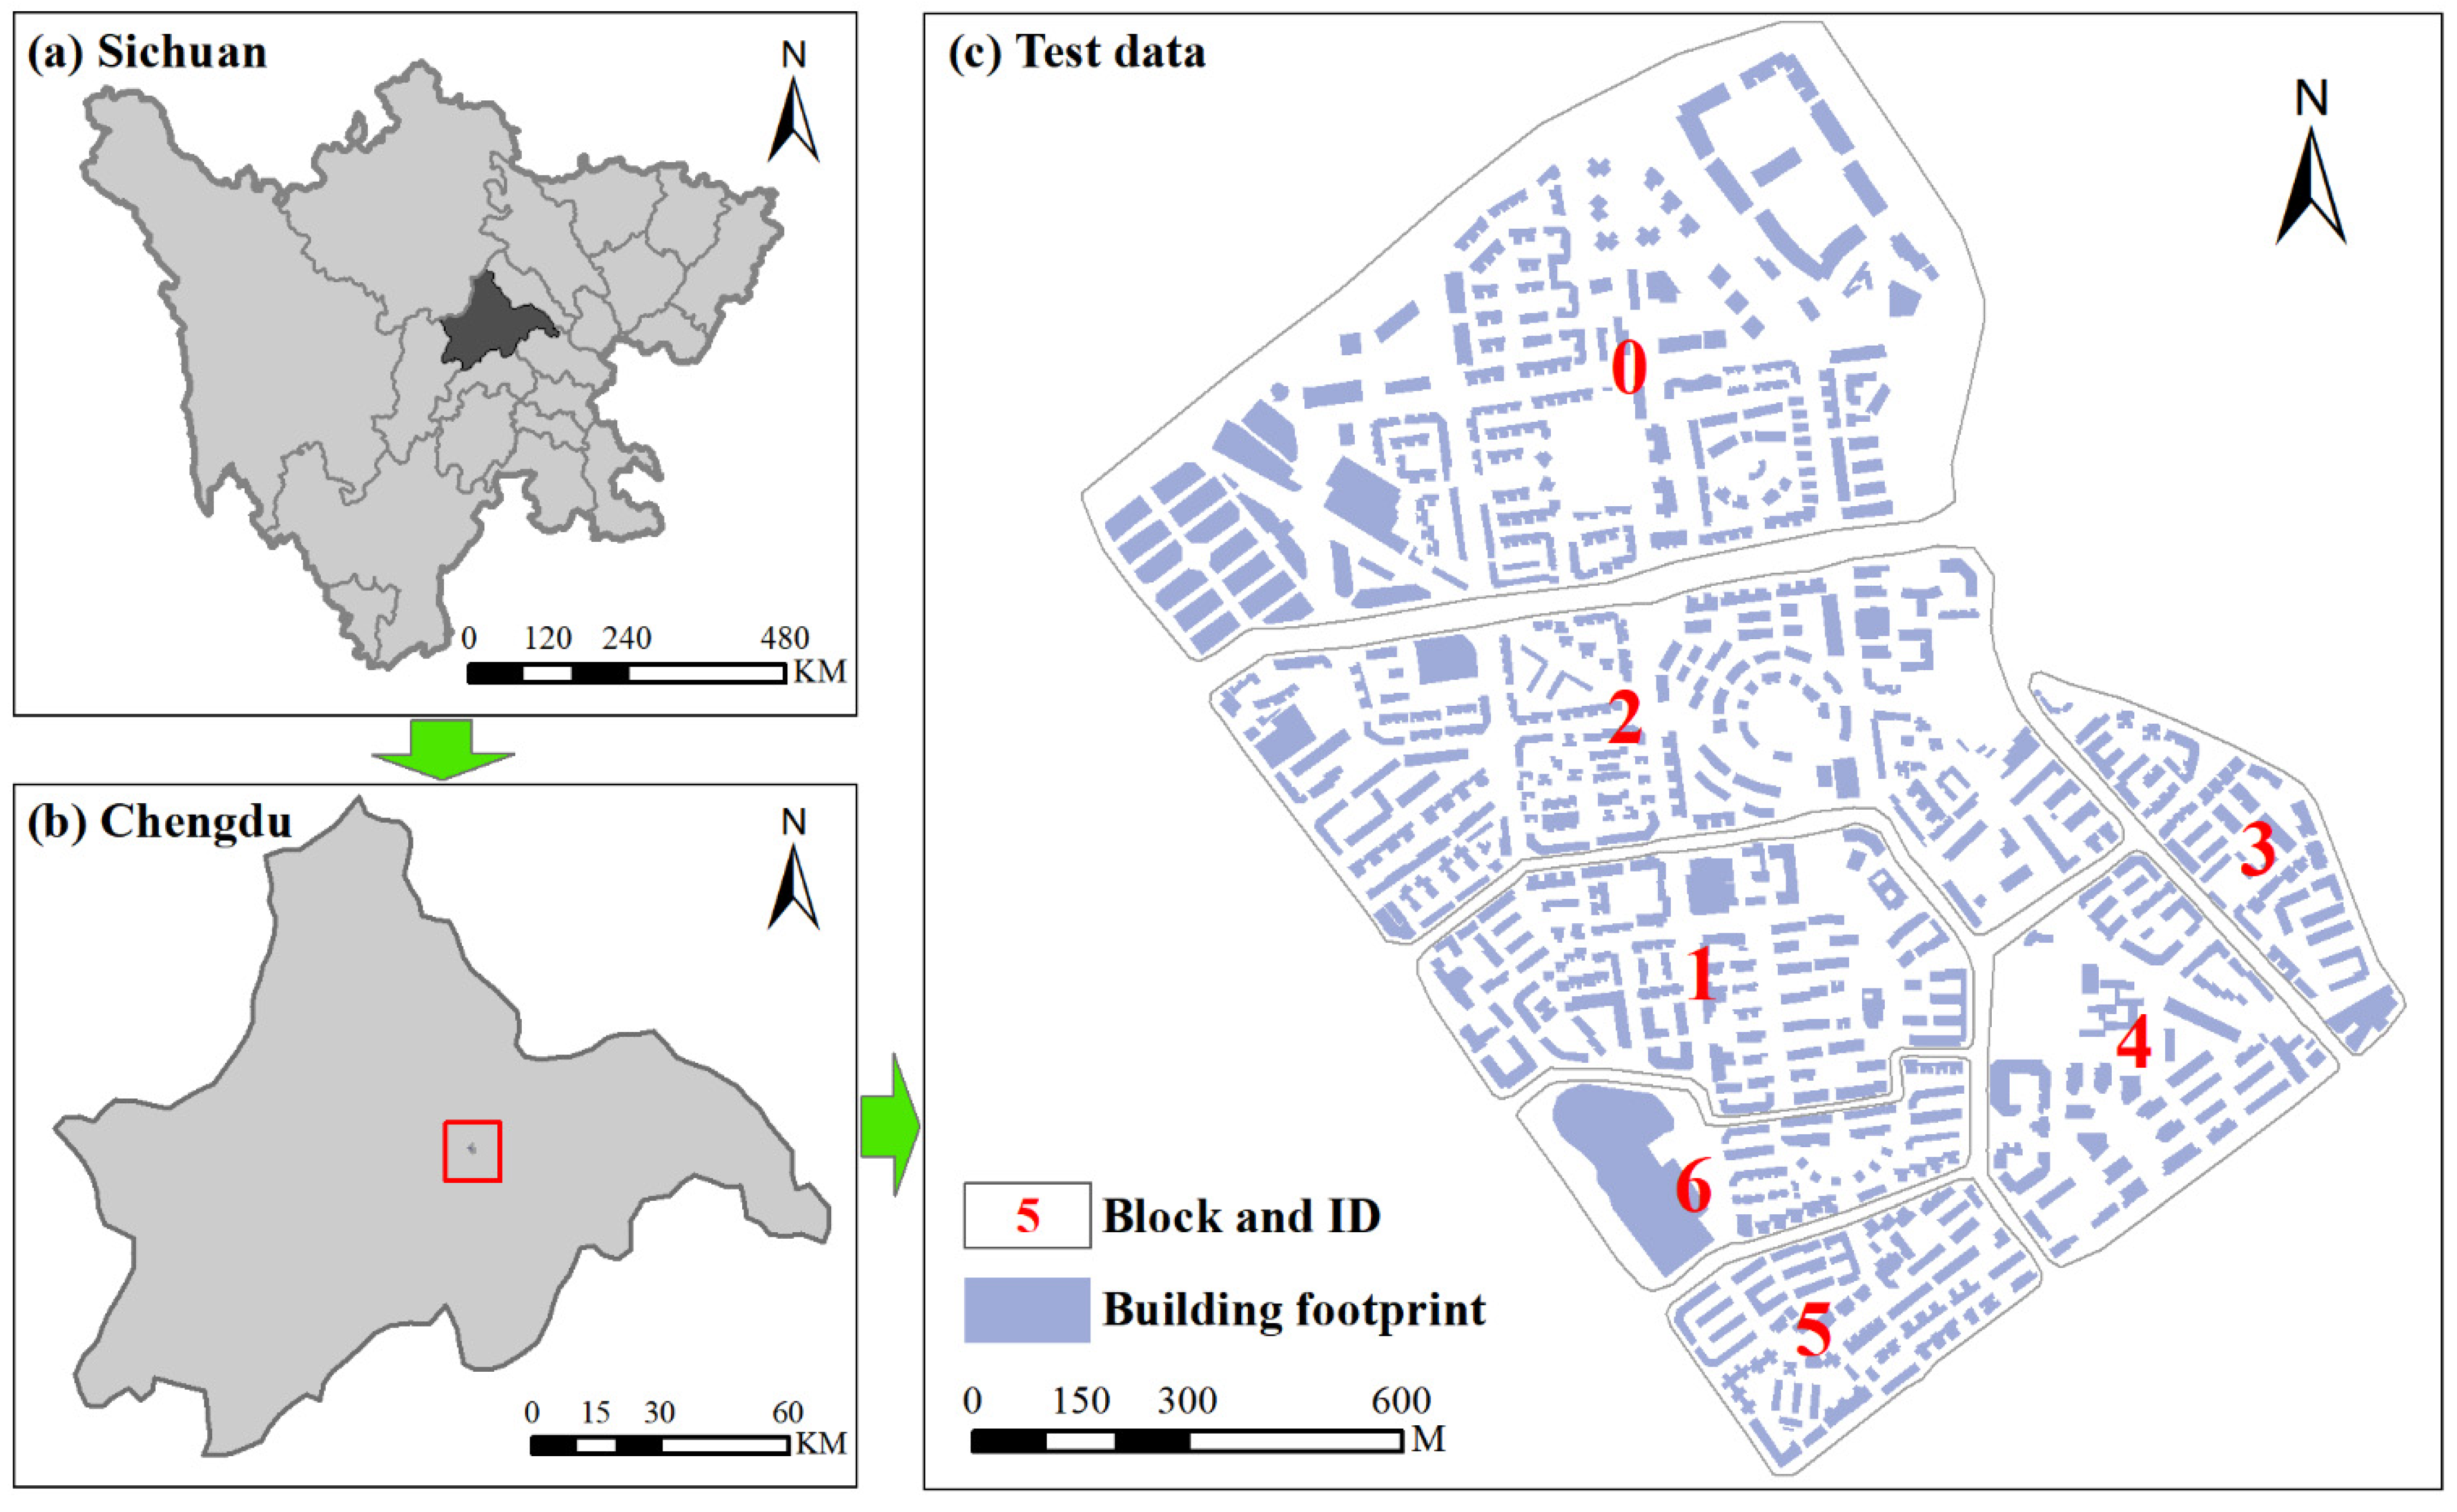
Our case study area is located in the Chinese city of Chengdu, which is the largest city in southwestern China (Figure 1). The study materials in our research consist of building footprints, road networks and real-time Tencent user density (RTUD). The building dataset and road networks were provided by the Province Urban Planning and Design Survey Research Institutes of Sichuan Province, China. This dataset includes 546 buildings in the ESRI shapefile. They are partitioned into several blocks by the road networks. These buildings are grouped into district units on electronic maps. RTUD data record the location information of smart terminal devices using Tencent products, including Tencent QQ, WeChat, Tencent Maps and other mobile applications that provide location-based services (LBS). A web crawler was developed to capture this data every two hours on the Tencent website (http:ur.tencent.com, accessed on 5 June 2020). Given that people generally have different activities on workdays and non-work days, we selected RTUD data on a workday (5 June 2020) and a non-work day (6 June 2020) in our study area to infer building functions. Additionally, we utilized Baidu Maps and Google Earth images to verify the experimental results. Road network data downloaded from AutoNavi map were used to discuss the generalization results. AutoNavi map is an electronic map that is widely used in daily life for driving navigation.
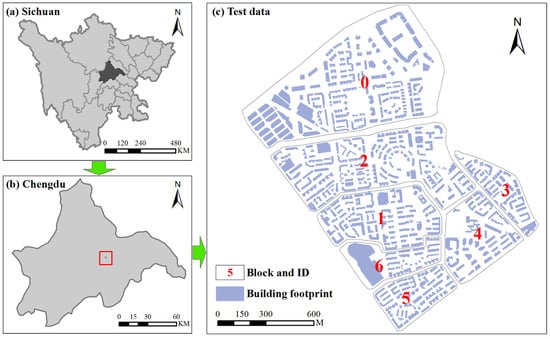
Figure 1.
Location of the study area and the experimental data are shown for (a) Sichuan Province, China, (b) the capital city of Sichuan Province, and (c) the experimental data.
3. Methodology
The proposed methodology includes a series of steps displayed in Table 1, and is described in detail below.

Table 1.
Methodological steps.
Step 1. The first step is to map user density distributions using Tencent user density data. This raw dataset consists of points in a shapefile, and each point contains a user count. Some points contain abnormal user counts that are several times larger than that of neighboring points. However, buildings near these points are similar to buildings near their neighboring points. After removing abnormal data manually, user density distributions are generated using the ArcMap kernel density tool. We map user density distributions for each time point.
Step 2. After mapping user density distributions, we select samples to compute the average user density of each building type. In our study area, the types of buildings include residential, office, and commercial buildings. Functional information regarding these buildings was acquired from points of interest (POIs) and street views in Baidu Maps. We select samples for each type of building based on Google Earth, Baidu maps, and surveys. Then, the average user density of each building type is derived using Equation (1) [24].
where k denotes the k type of functions, is the number of samples, denotes the user density of samples, and t represents the activity times of Tencent users.
Step 3. This step aims to infer building functions using the dynamic time warping (DTW) algorithm. Given that the activity peak curve of each building type was obtained in step 2, we only need to compare the activity peak curve of the predicted building to that of the samples to detect the function of the predicted buildings; that is, to determine their similarity. DTW [30] is a good method for measuring the similarity between two time series and is widely used in the field of time series data mining. DTW assumes that if the points of two sequences correspond correctly, then their distance (Euclidean distance) is minimized. The minimum distance can be considered the similarity of the two sequences. In this study, we use the time series of samples as the standard reference template R, which is an M-dimensional vector. R = {R(1), R(2), ……, R(m), ……, R(M)}. Each component represents the average user density value at each time point. The average user density sequence of each predicted building serves as a test template T, which may be an N-dimensional vector. T = {T(1), T(2), ……, T(m), ……, T(N)}. The DTW algorithm is utilized to compare the time series of each predicted building with the sequence of each type of sample. The function of predicted buildings is determined by the sample with the minimum distance.
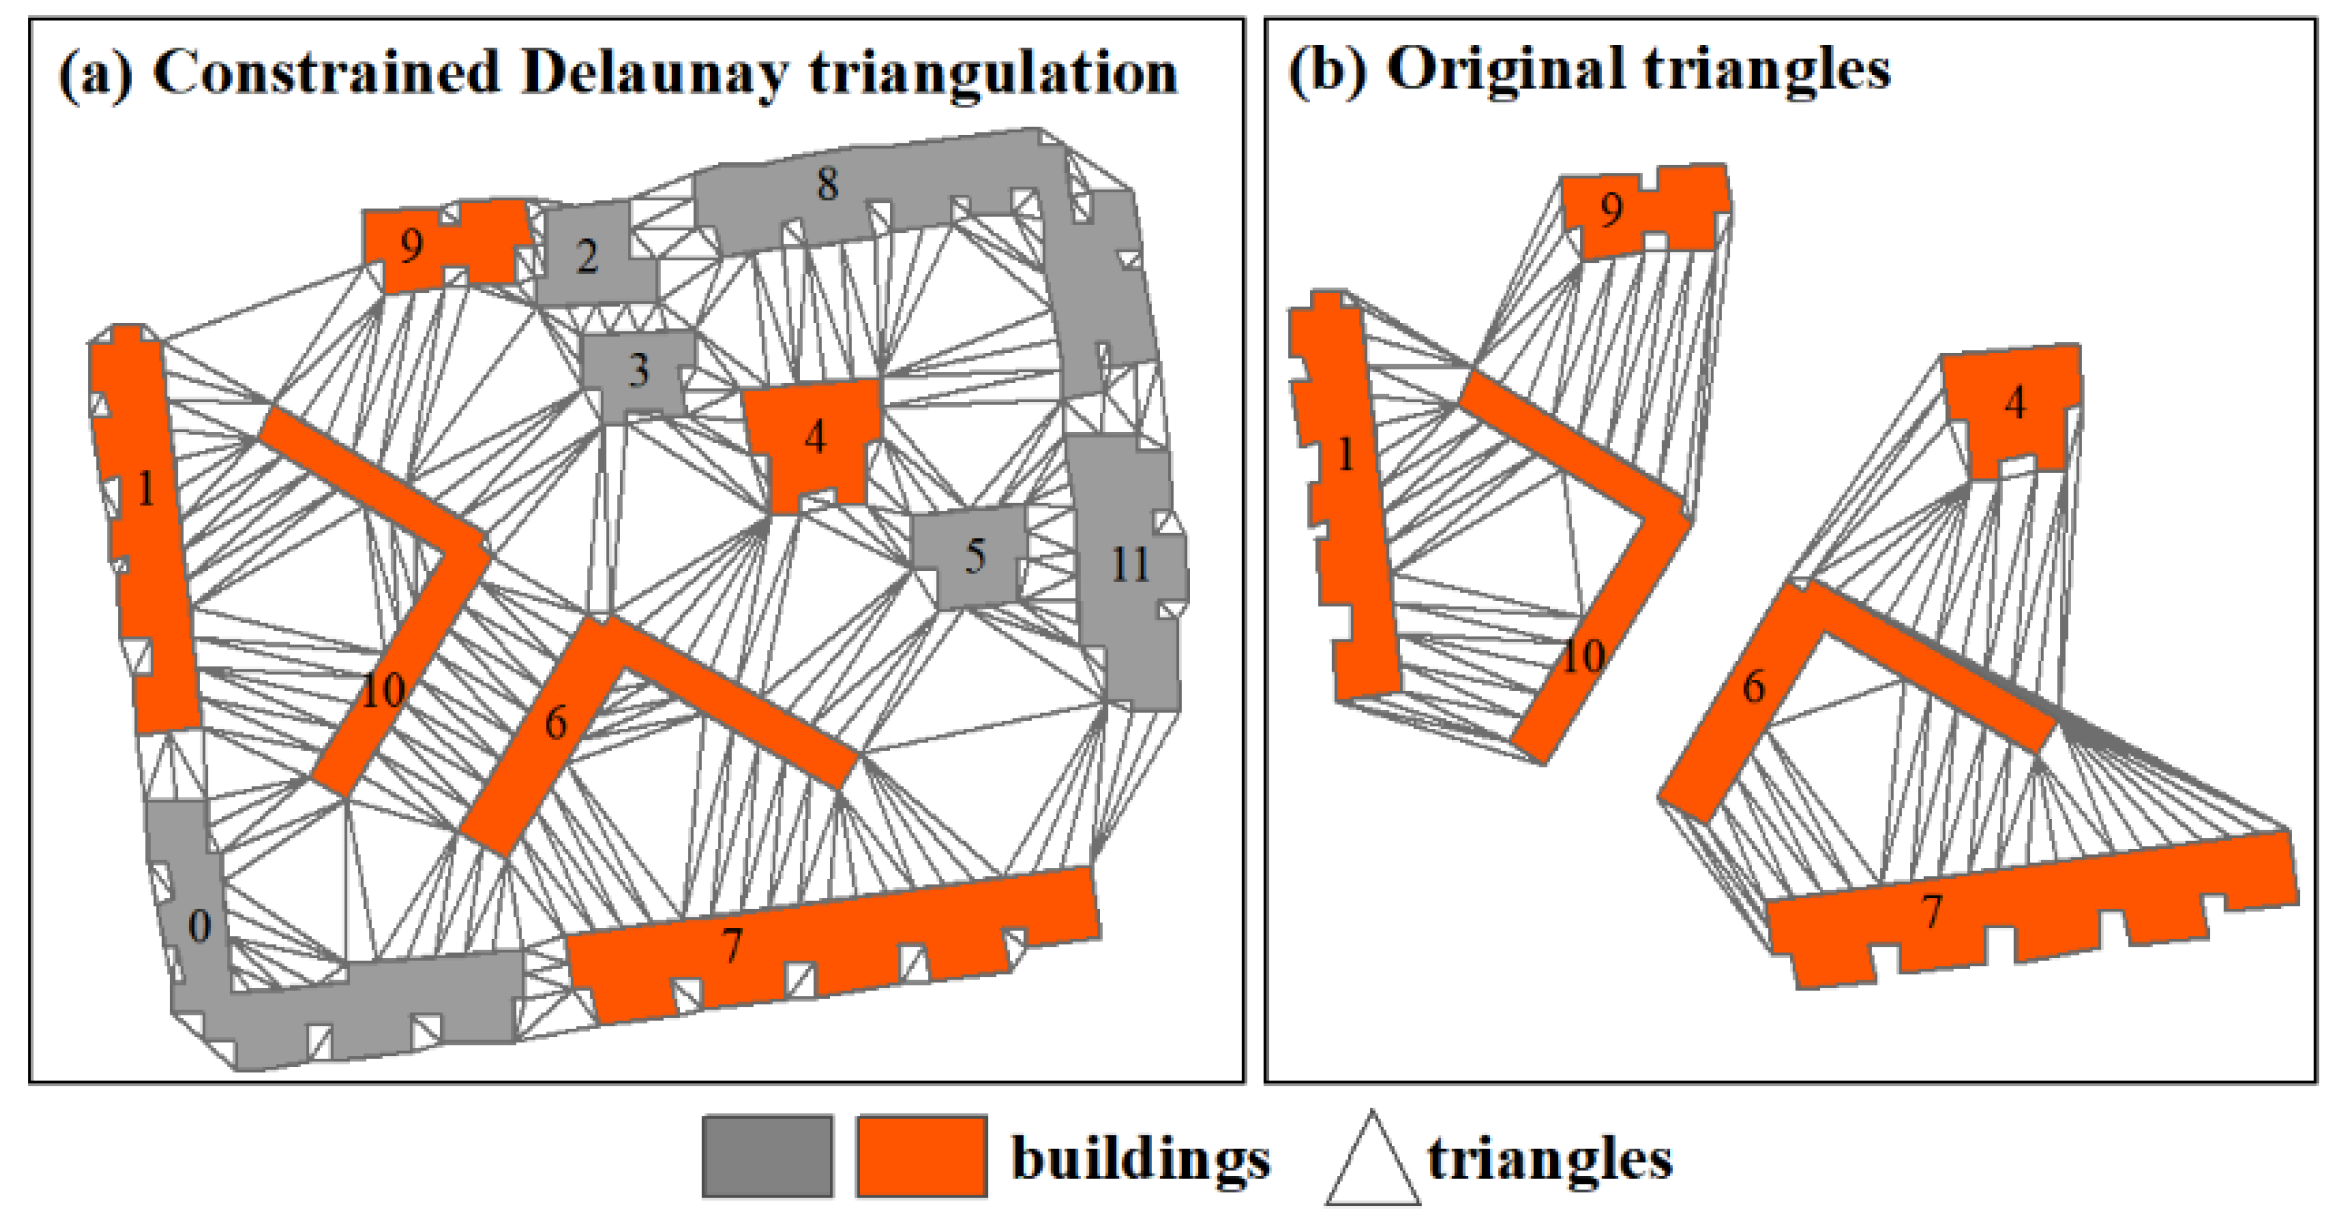
Step 4. To improve processing efficiency, the topographical map of buildings is partitioned into a series of building blocks by a road network. This is because every two buildings need to be compared to detect proximity relations during data processing. If the dataset is too large, traversing will take considerable time. Thus, each building block is an individual treatment unit in the subsequent processing. Then, two types of constrained Delaunay triangulations (CDT) are created for each individual block (Figure 2). The first type of CDT is computed for all buildings within each individual block (Figure 2a). Another type of CDT, namely, paired building triangles, is computed only for each pair of adjacent buildings (Figure 2b). The first type of CDT needs to be created first to detect adjacency relationships among buildings. If two buildings are adjacent, their paired building triangles are created. Before creating a CDT, it is better to add extra points on the line segments of building polygons and roads at an interval to avoid producing narrow triangles [31].

Figure 2.
Examples of constrained Delaunay triangulation are shown for (a) triangulation computed for all buildings within each individual block, and (b) triangulation computed for pairs of adjacent buildings.
Step 5. The index values of adjacent buildings is computed based on the two types of constrained Delaunay triangulation. Indices including the proximity relationship (Equation (2)), the length of the skeleton line (Equation (3)), the mean distance of adjacent buildings (Equation (4)), the spatial continuity index (SCI) (Equation (5)), the direction of the two adjacent buildings, and the path angle (Equation (6)) in a tracing process are defined based on triangles. All these index values except path angles are stored in matrices. The formula for calculating each index is described below.
The proximity relationship matrix is indicative of whether buildings are topologically adjacent and is derived based on whether buildings have shared triangles in the CDT:
where and denote the buildings within a block, and is a Boolean variable; where indicates that and are adjacent, and indicates that and are not adjacent.
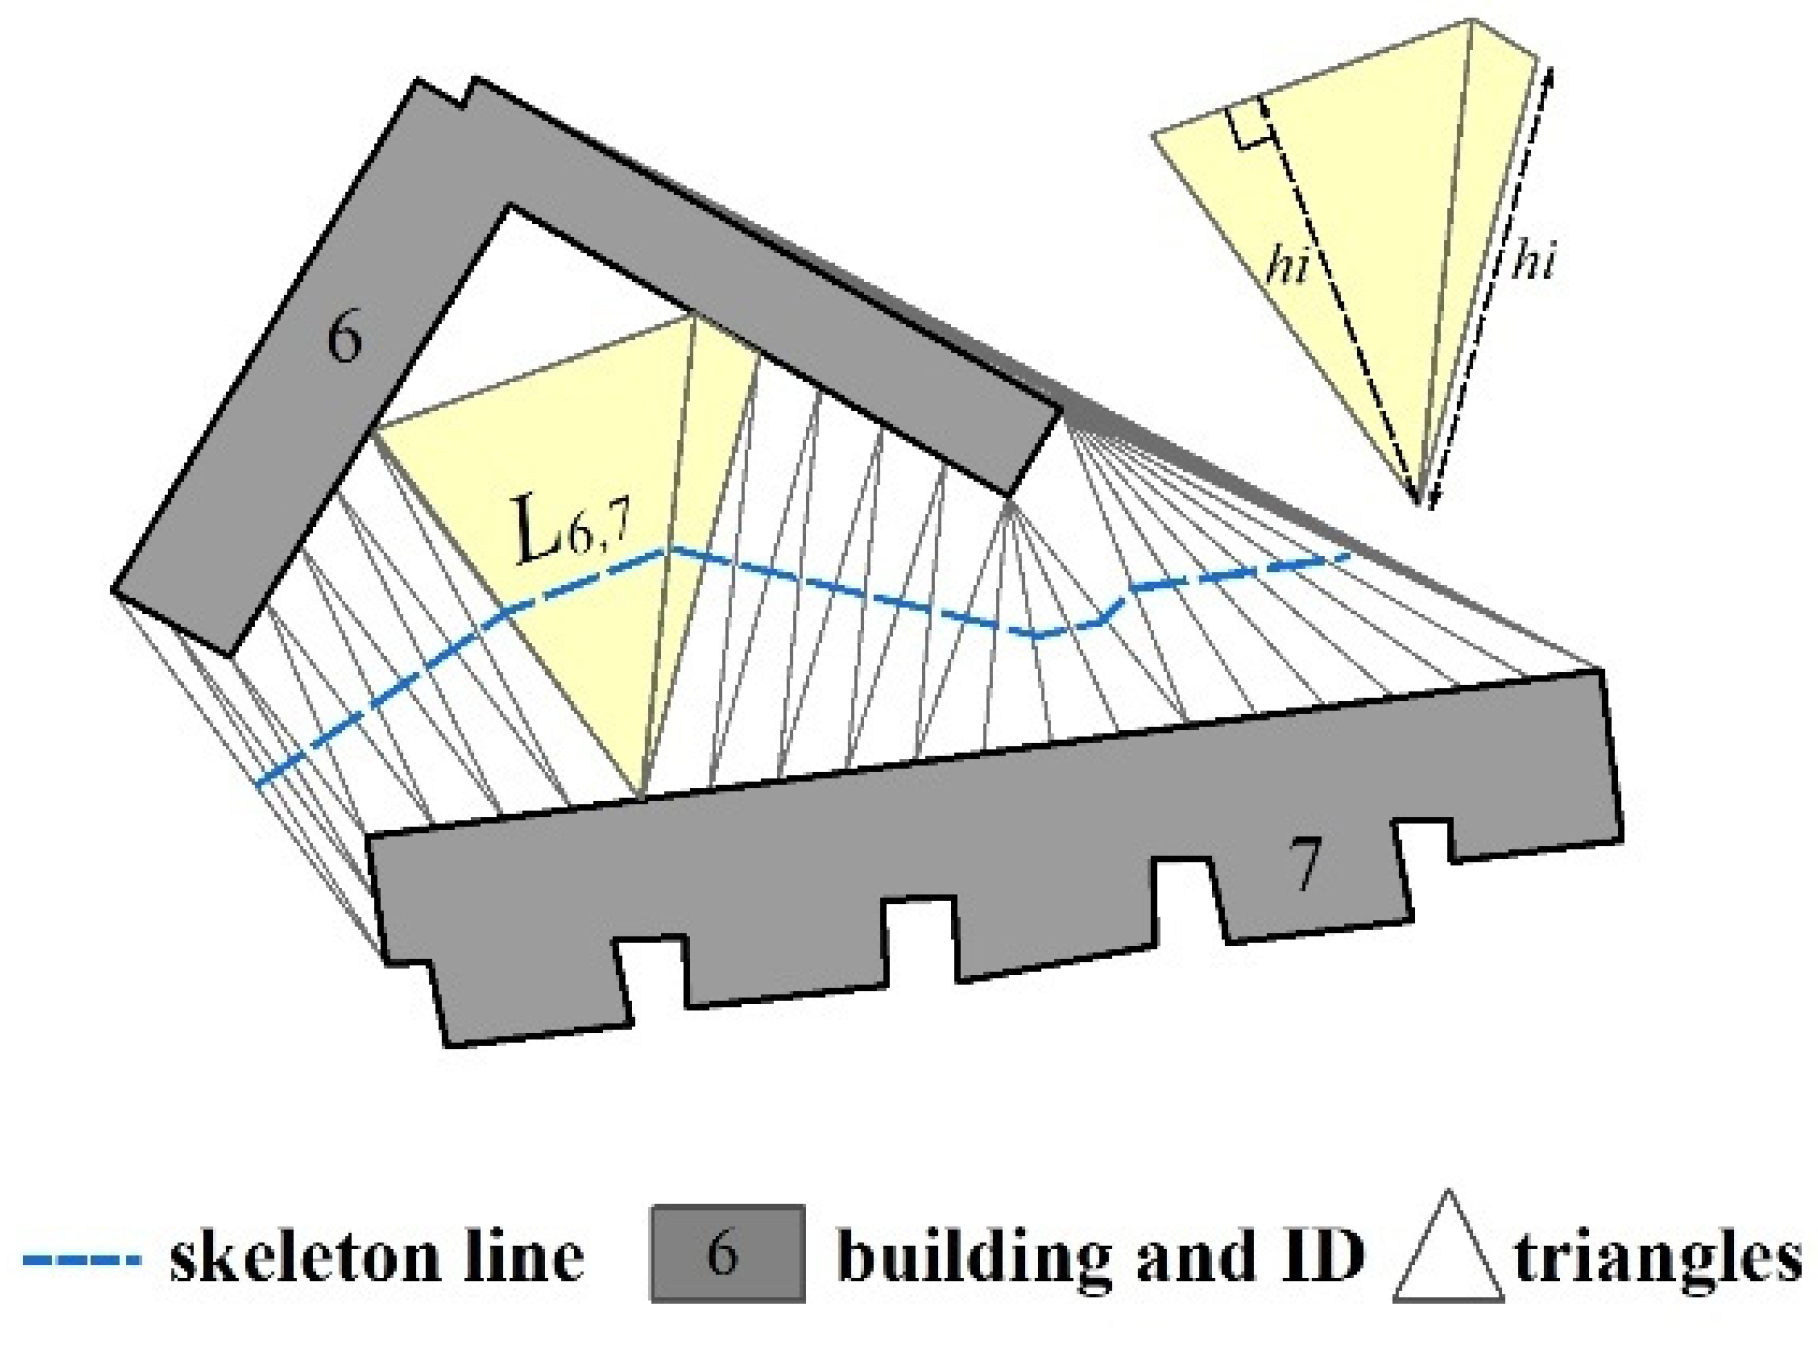
The skeleton line is formed by the middle points of triangle sides that link two adjacent buildings (Figure 3). The length of a skeleton line is derived as follows:
where denotes the distance between the two middle points of the sides of a triangle that link two adjacent buildings, denotes the sum length of the skeleton line between two adjacent buildings, and if two buildings and are not adjacent, as obtained in Equation (2).

Figure 3.
Example of the heights and skeleton lines of adjacent buildings.
The mean distance of adjacent buildings is derived based on the skeleton line as follows [13]:
where denotes the height of triangle with the base that falls in either adjacent building polygon, denotes the distance between the two middle points of the sides of triangle that link two adjacent buildings, as obtained from Equation (3), and if two buildings and are not adjacent, as obtained in Equation (2). If the triangle is acute or right, is the height from the side shared with the buildings; if the triangle is obtuse, is the shortest side of the triangle linking two buildings (Figure 3).
The spatial continuity index (SCI) of adjacent buildings is the ratio of the skeleton line to distance as follows:
where is the spatial continuity between buildings i and j, denotes the length of the skeleton line of two buildings as described in Equation (3), and denotes the distance of the two adjacent buildings as described in Equation (4).
The azimuth angles of two adjacent buildings are derived based on two types of constrained Delaunay triangulation. The calculation of this index is described in detail in the literature [15]. There are three steps for calculating the azimuth angle of two adjacent buildings (Figure 4).
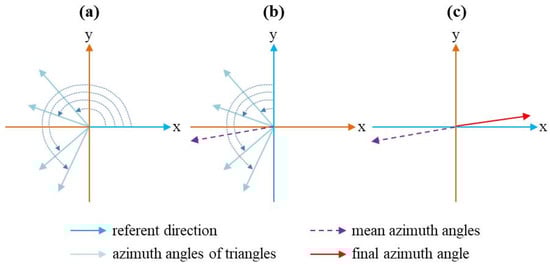
Figure 4.
Example of calculating the azimuth angles of adjacent buildings are shown for (a) the azimuth angles of all triangles; (b) the mean azimuth angle of two adjacent buildings; (c) the final azimuth angle of two adjacent buildings.
The path angle at the middle building is the angle formed by the building direction () and building direction () in the path. The closer to 0 the angle is, the better the linear pattern.
where denotes the azimuth angle of a triangle with the base that falls in either adjacent building and denotes the distance between the two middle points of the two sides of the triangle that link two adjacent buildings, as obtained from Equation (4).
Step 6. This step consists of graph creation and graph segmentation. Before graph segmentation, each building block is first modeled as a graph, where nodes represent buildings and edges denote the adjacent relationships of two adjacent buildings with the same function. Then, the edges of the graph are weighted with index values derived in step 5. In graph segmentation, linear patterns are first identified due to their high homogeneity. Based on SCI and azimuth angle, the method proposed in the literature [15] is applied to recognize linear patterns. After that, edges with abnormal distances are removed to obtain the final building groups. Specifically, the pair of nodes connected with an edge that weighted the smallest distance is determined first, then all their neighboring nodes are found, and the standard deviation of distances belonging to the above neighboring nodes are calculated. If the standard deviation exceeds a given threshold (e.g., 0.2), the edge with the maximum distance is deleted, and the standard deviation is recalculated to determine whether an edge with the maximum distance needs to be deleted. After the above process is completed, the pair of nodes with the second shortest distance is found, and the same operation is performed. The edges that do not meet the requirements are deleted.
Step 7. To evaluate the efficiency of our approach, an expert evaluation was conducted. We compared the results recognized using the proposed method with those identified manually by users. Such a comparison method is widely used in pattern recognition research [22,32]. To evaluate the building functions detected using the DTW algorithm, we compared the results with the Baidu Map POIs. The reference data applied to evaluate the building group recognition result are identified manually based on Baidu Maps and Google Earth images. When assessing the results of building group recognition, there can be four different cases, including the correct patterns (i.e., the modeled patterns and the reference patterns are consistent), the inclusion patterns (i.e., one modeled pattern contains multiple reference patterns), the within patterns (i.e., one reference pattern contains multiple modeled patterns), and the overlap patterns (i.e., a modeled pattern overlaps the reference pattern). Here, two metrics, including correctness and completeness, were utilized to assess the accuracy of the pattern recognition results. Correctness refers to the ratio of the correct patterns to the total extracted patterns, whereas completeness refers to the ratio of the correct patterns to the reference patterns. In addition, to understand the robustness of the proposed method based on comparative studies, a method without building function recognition (a standard CTD method) was also used to recognize building groups in our experiment. This method involves the second main step in Table 1, which consists of step 4 to step 6. These steps only used CTD to compute the index values of adjacent buildings without considering building functions. Specifically, in the graph creation step, edges will be created between adjacent buildings, no matter what their function is.
All experiments were performed on a personal computer with an Intel (R) Core (TM) i7-7700 CPU (central processing unit) and a memory of 8 GB. All algorithms proposed in Section 3 were realized using C# on Microsoft Windows 10 (×64). Component libraries and tool libraries of ArcGIS Engine 10.1 were applied to develop related algorithms.
4. Results and Discussion
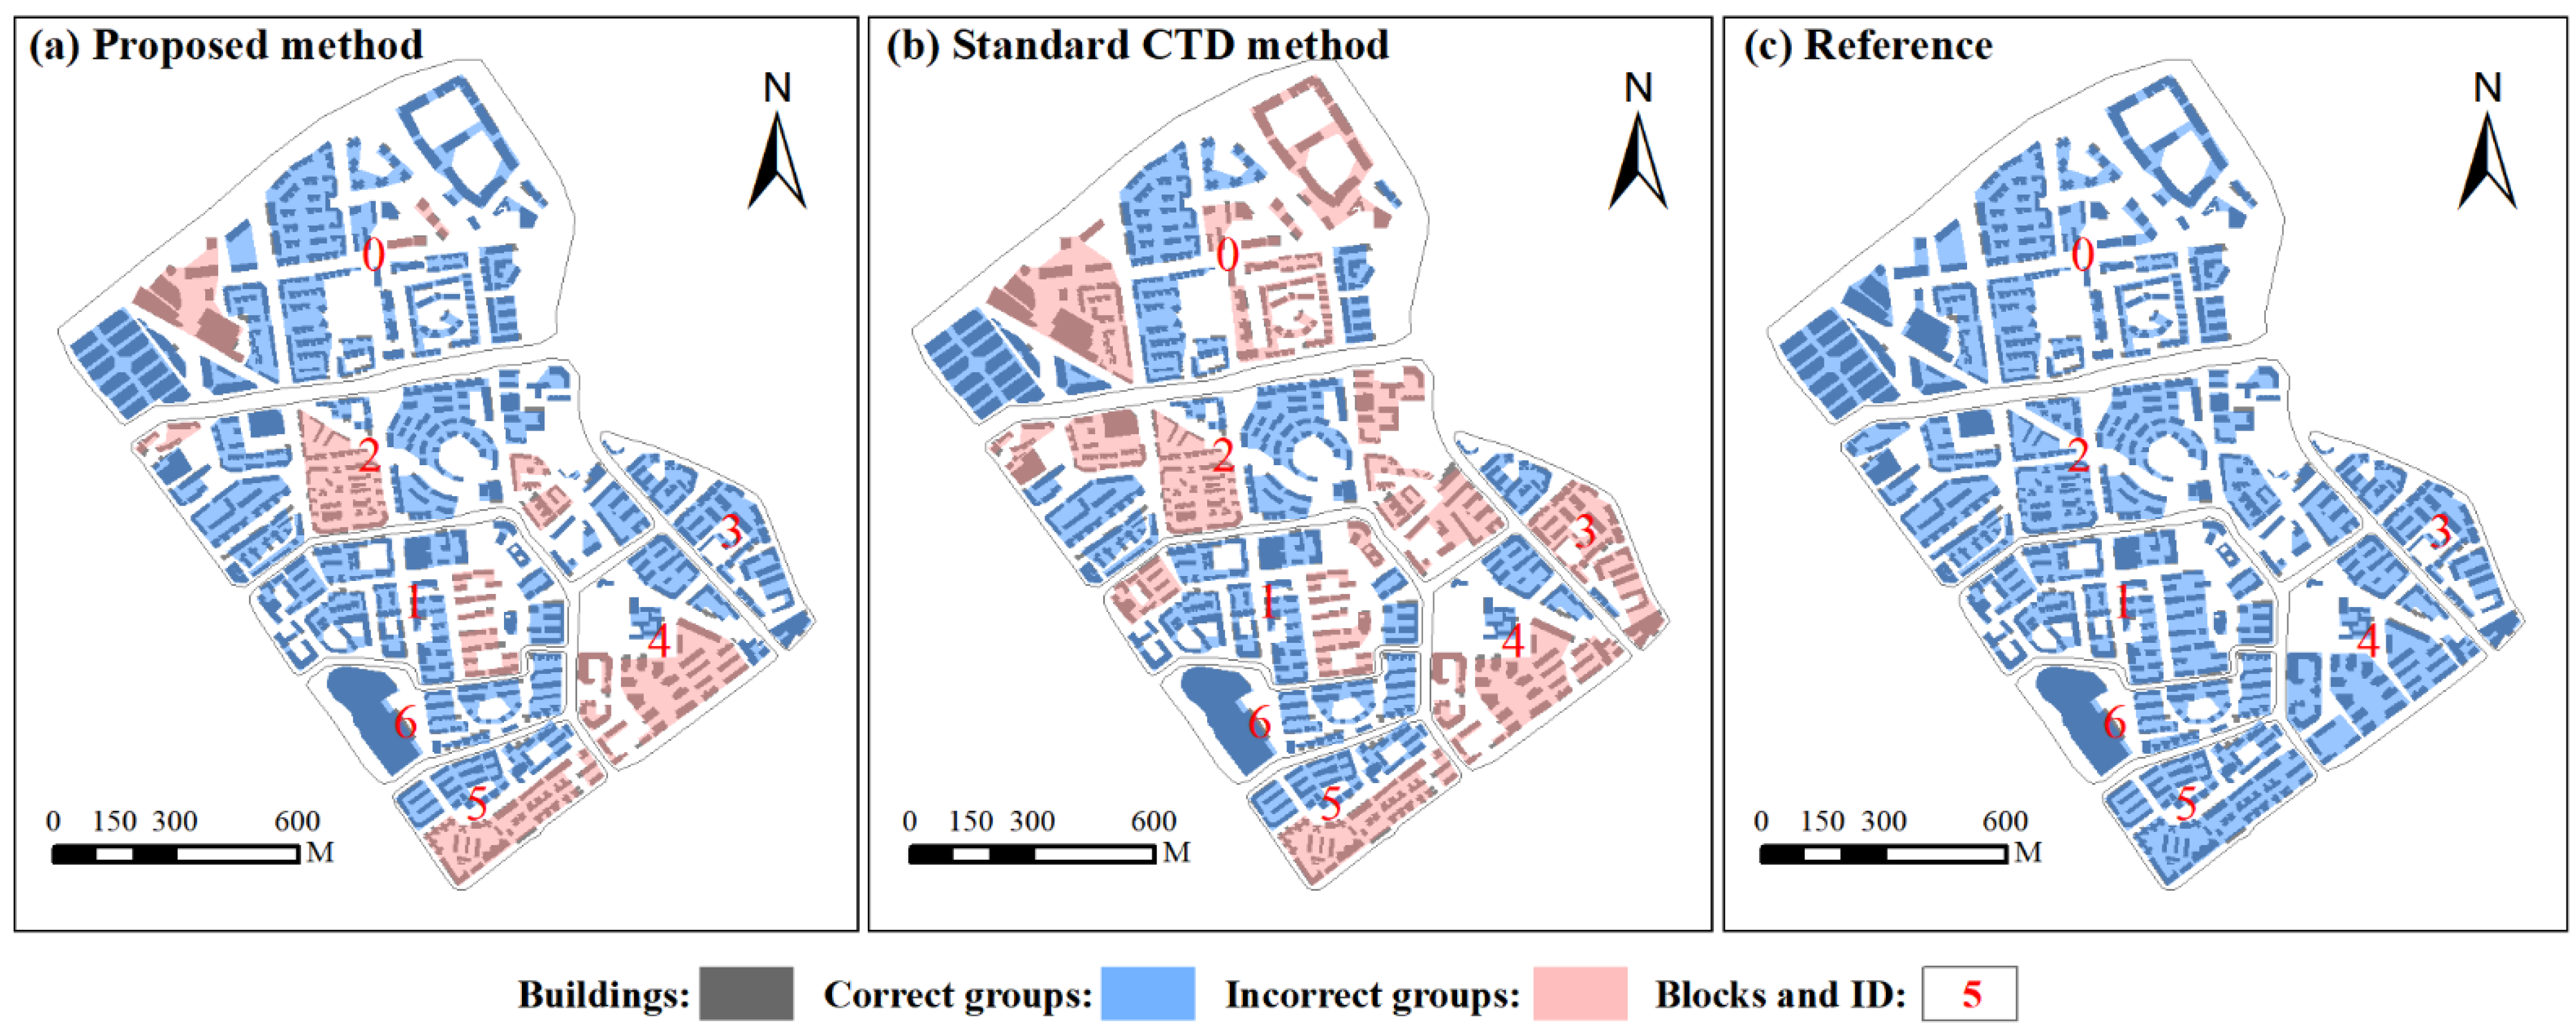
Figure 5 presents the results of building group recognition extracted using different methods. Buildings covered with blue hatched patterns were correctly grouped, whereas those inconsistent with the reference maps are covered with red hatched patterns. Visually, the proposed method is effective in recognizing different building group patterns. Buildings are reasonably grouped in terms of residential area. These residential buildings are partitioned into different groups from other functional building types. In comparison, the results detected using the standard CTD method largely deviated from the reference patterns. Many other functional types of buildings are grouped into the same groups as residential buildings. This is because they are close to each other.

Figure 5.
Building group recognition results are shown for (a) the proposed method, (b) the standard CTD method, and (c) the reference map. Buildings covered with blue hatched patterns were correctly grouped, whereas those inconsistent with the reference maps are covered with red hatched patterns.
The accuracy assessment results of building pattern recognition are summarized in Table 2. Overall, the proposed method can detect building groups with correctness values and completeness values above 81%, indicating that the recognition results agree well with the reference data. Specifically, the proposed method can obtain high accuracy in blocks 0, 1, 3, and 6, whereas it works poorly in blocks 4 and 5. Most of these errors are due to over-segmentation, as the distance between the buildings within the same group is larger than that between groups. This suggests that the distance between buildings is not the most important factor in group recognition in some cases. In comparison, the standard CTD method performs poorly in most building blocks except block 6. Since there is no functional information that serves as a constraint, it easily leads to under-segmentation.
Table 2.
The accuracy of building pattern recognition.
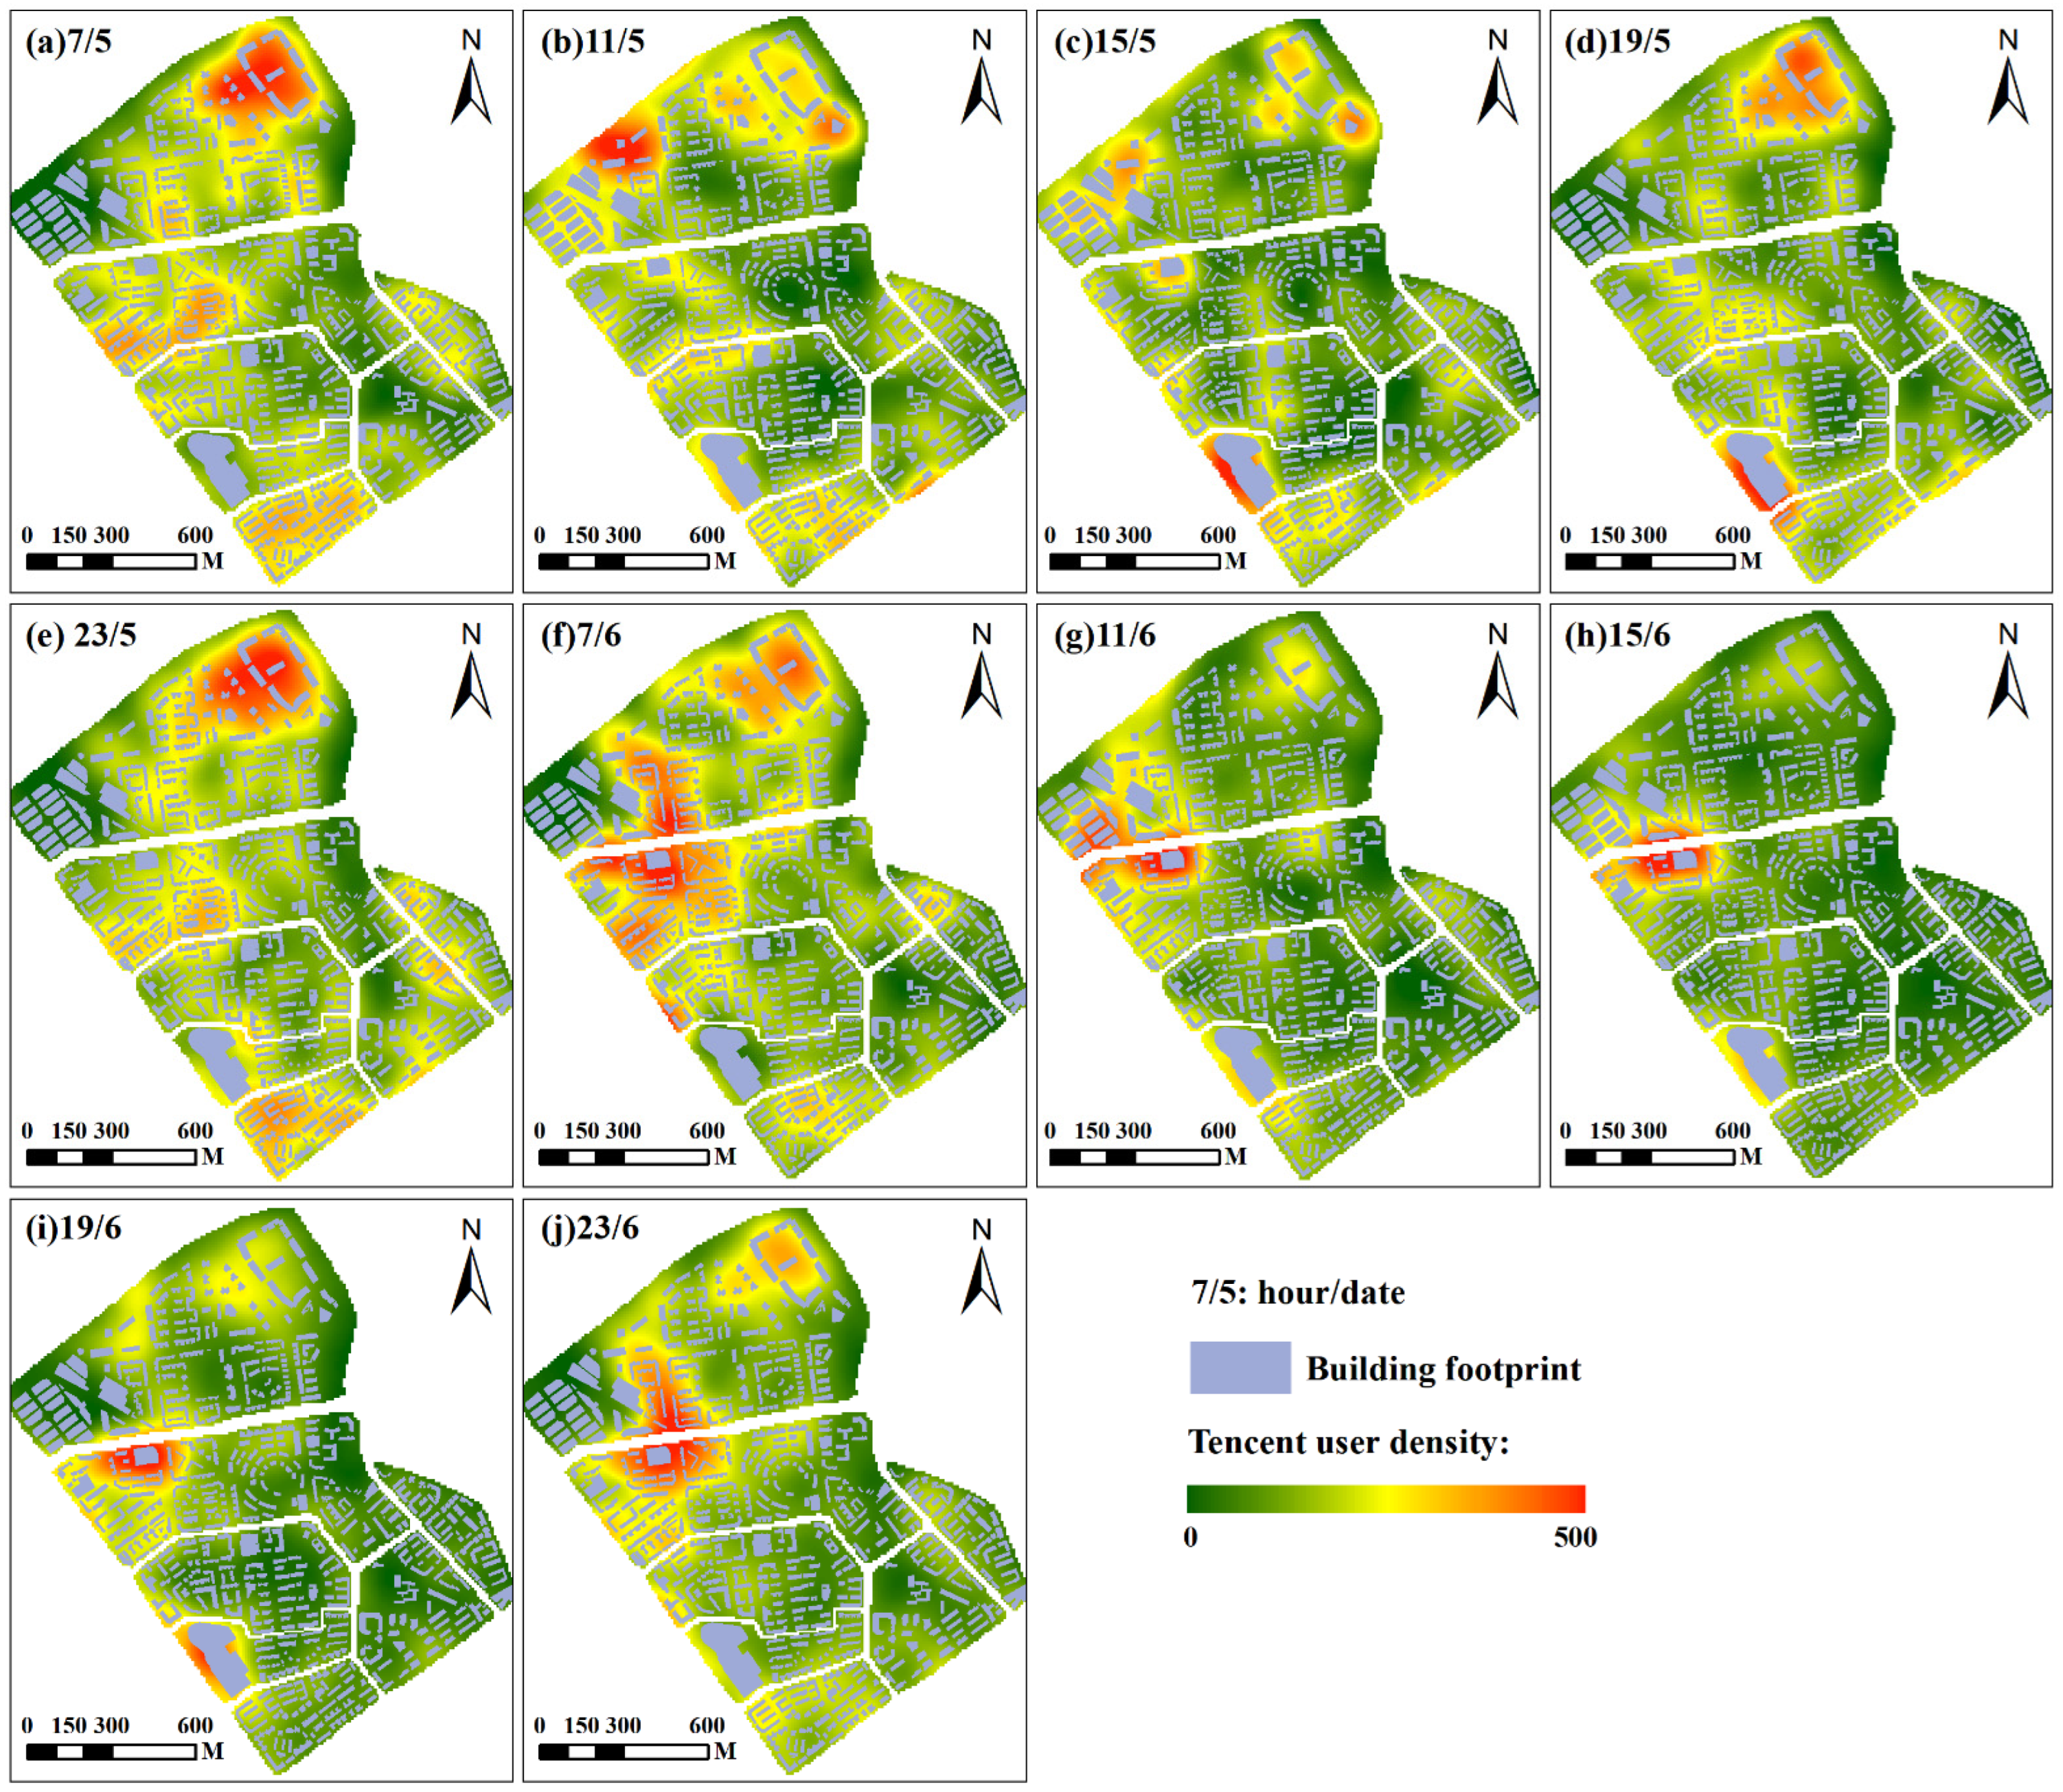
Figure 6 shows the mapping results of Tencent user density for different times in our study area. These mapping results indicate that the Tencent user density was significantly different over time. In other words, the space for people activities is different over time, especially on workdays and non-workdays. Thus, it is possible to infer building functions according to these changes.

Figure 6.
The mapping results of Tencent user density for different times in our study area. The redder the color, the higher the density of Tencent users. Hour/date: 7/5 represents 7 o’clock on 5 June. Type of day: 5 June was a working day, and 6 June was a non-working day.
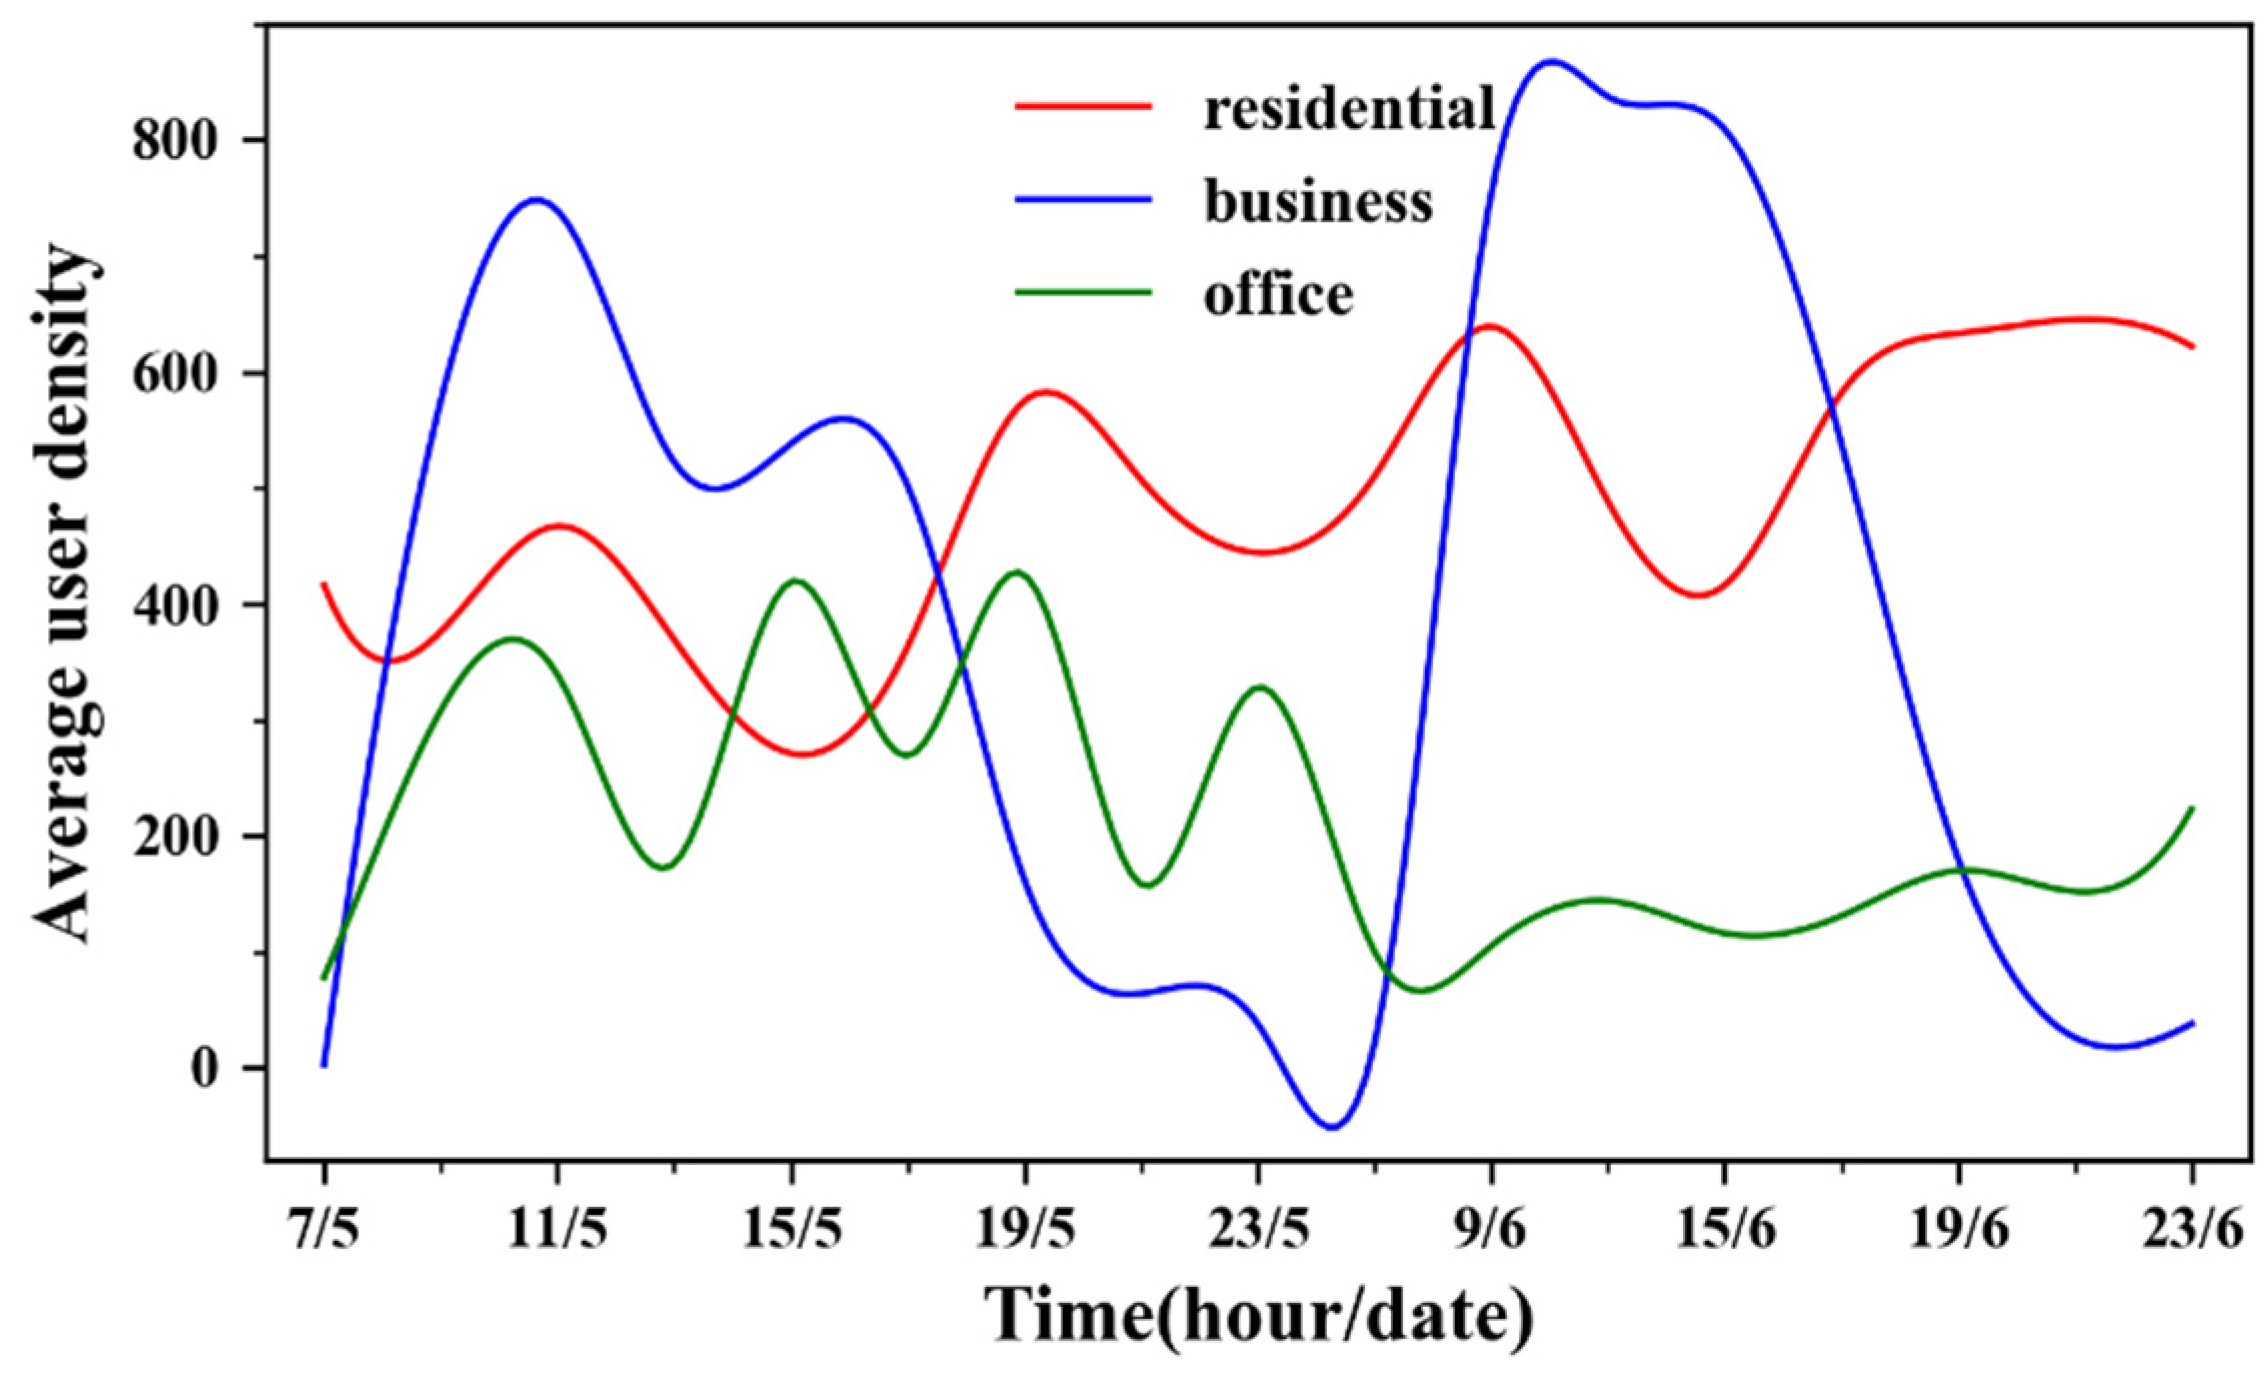
Figure 7 displays the temporal changes in the average Tencent user density in the study area over the two days. Clearly, obvious periodic oscillations occurred for the average user density curve of business buildings over the two days. There is almost no one in commercial buildings late at night. The temporal changes in average user density of residential buildings showed a slight difference between weekdays and rest days. Conversely, the average user density of office buildings varied considerably in the two days. This is because most people stay away from their workplaces on weekends.
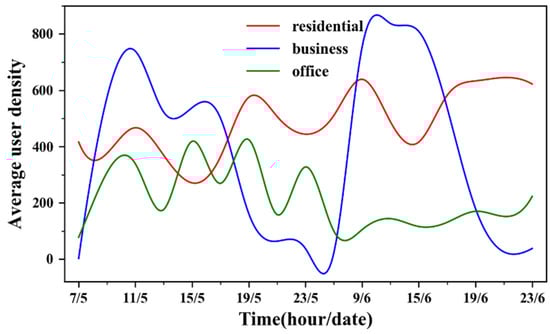
Figure 7.
The temporal changes in average user density over time.
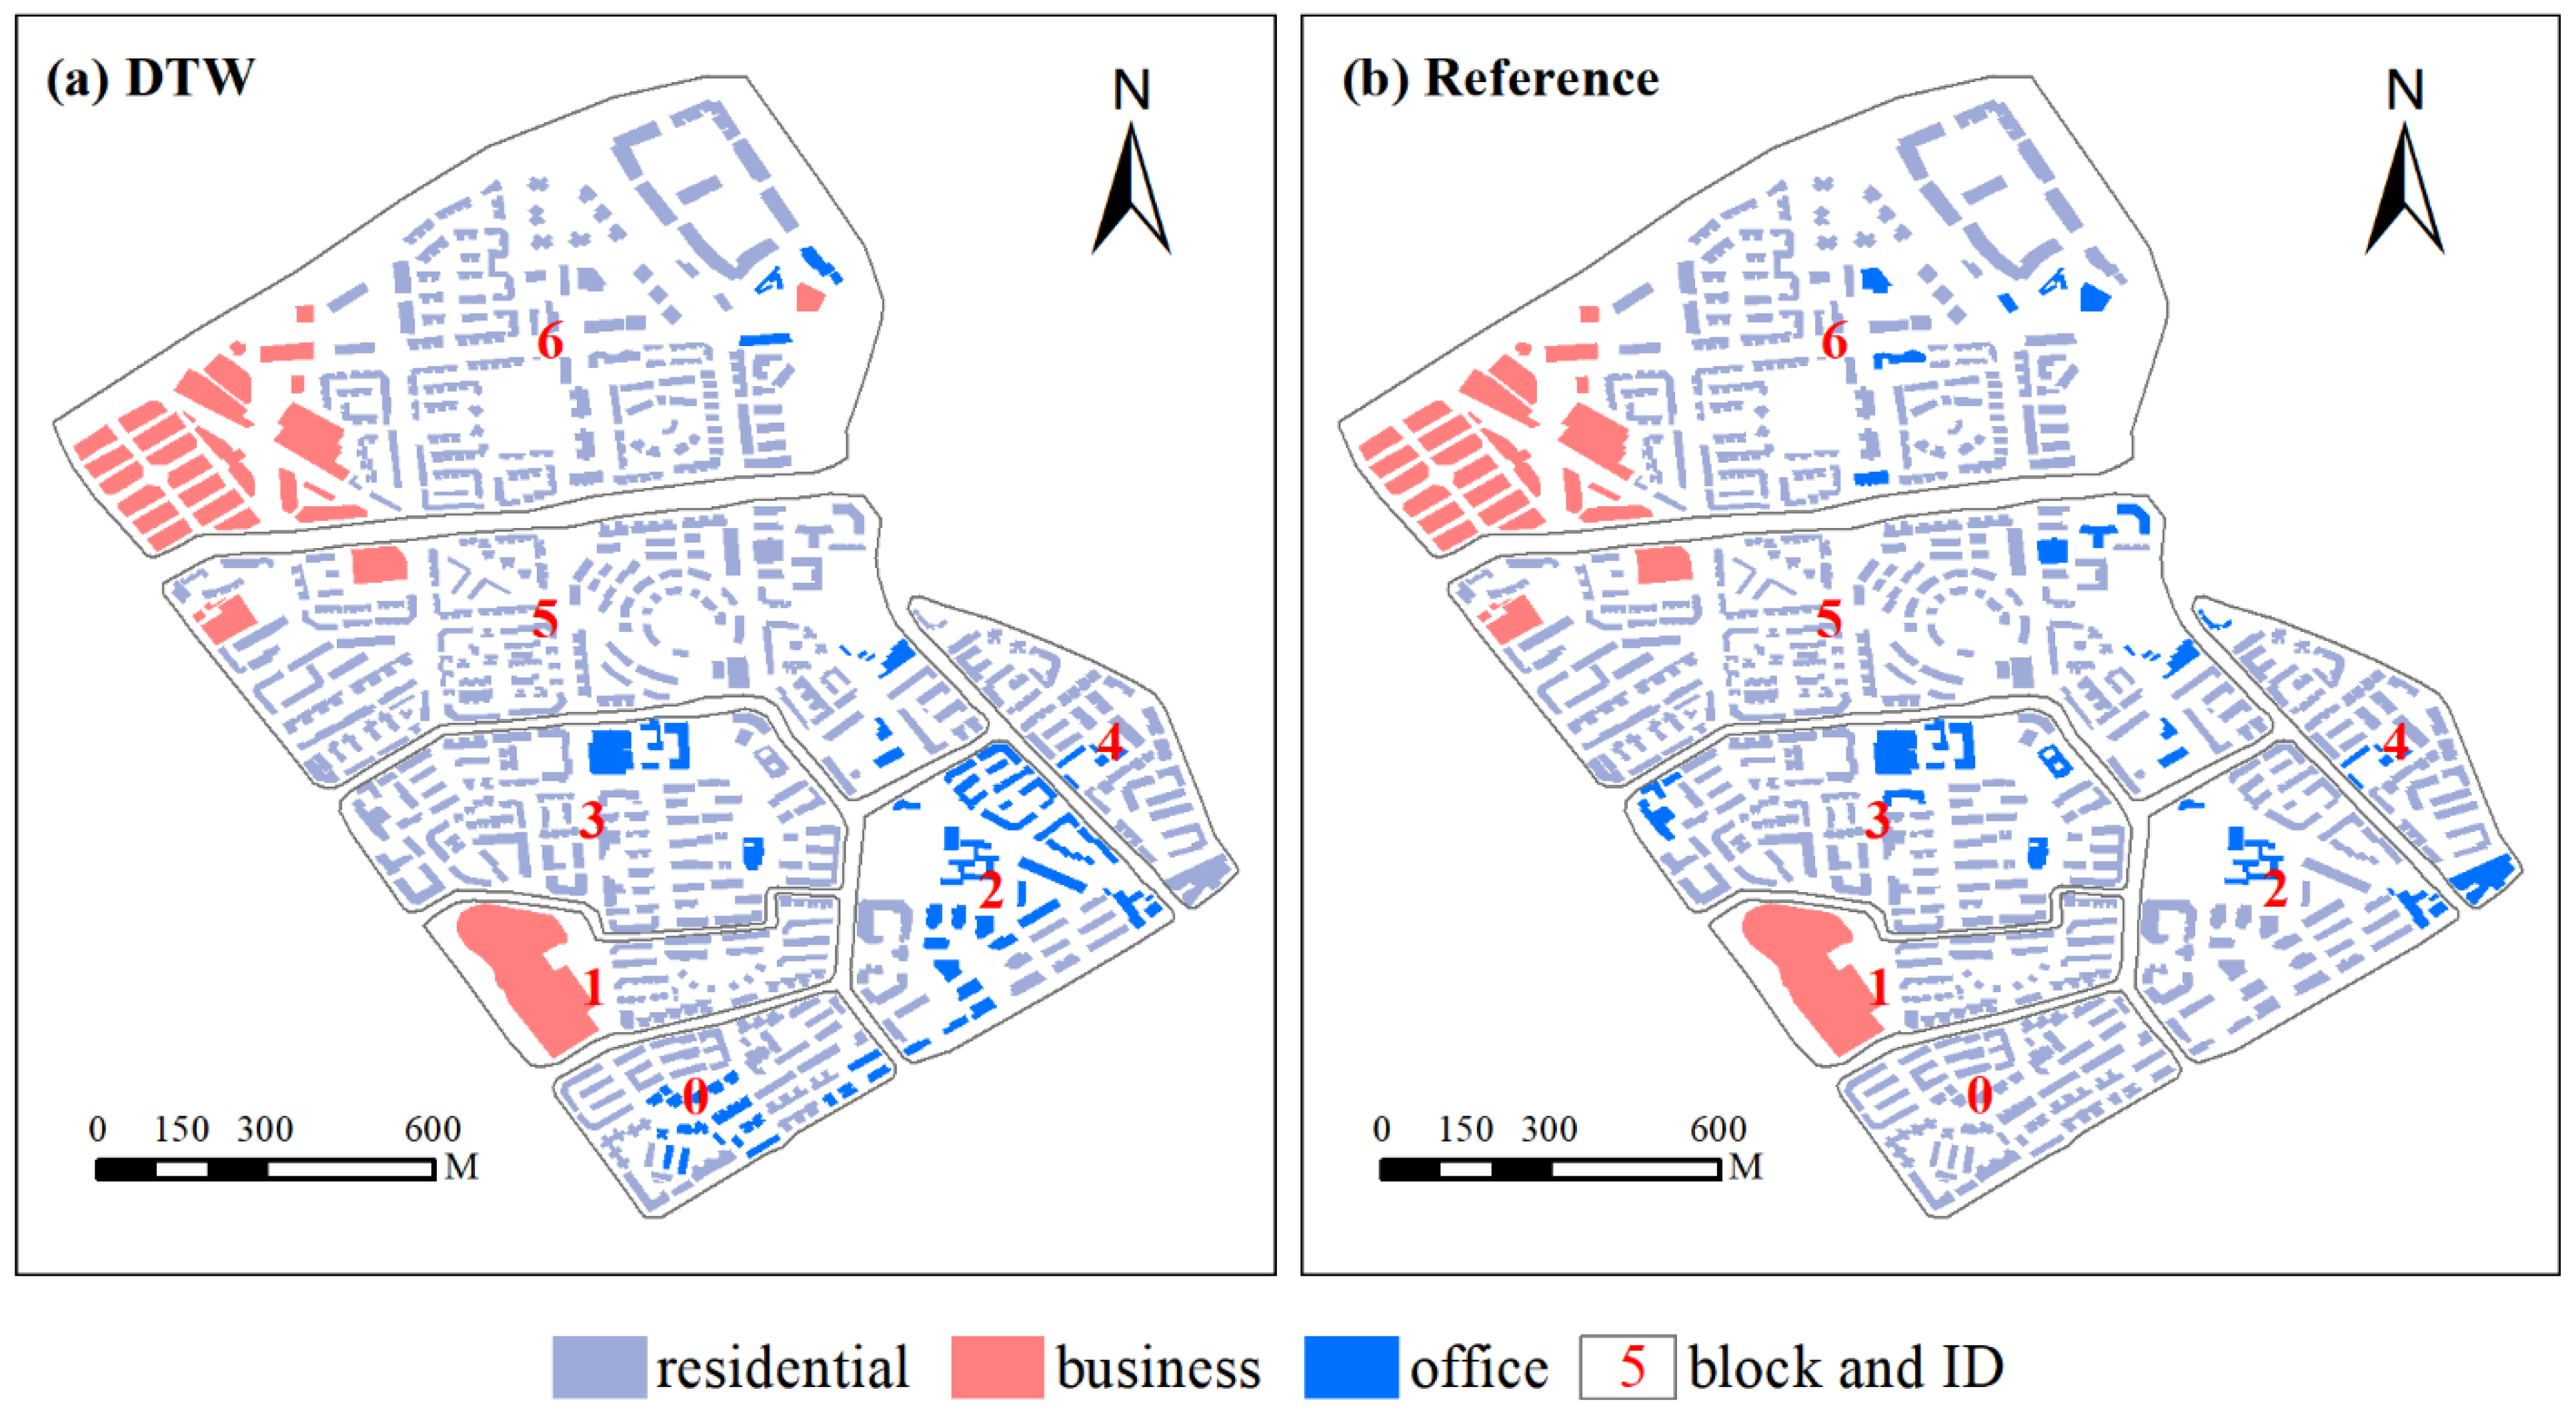
Figure 8 shows the results of building function recognition. The overall recognition accuracy reaches 87.91%. Specifically, the identification accuracy of residential, commercial, and office buildings is 91.70%, 96.77%, and 47.82%, respectively. The overall recognition accuracy is higher than those of the methods proposed in the literature [24,27]. The main reason for this is that the two methods recognized building functions using integrating road trajectory data; however, this data cannot accurately reflect changes in population density in the same manner as Tencent’s user density data. The highest accuracy in commercial building recognition is probably because the curves of user density obtained from this type of building are more obvious than those of the other two types of buildings (Figure 7). The lowest accuracy in office building recognition is because the activity curves of user density in office buildings are very similar to those of residential buildings, leading to some residential buildings being identified as office buildings. Moreover, many buildings in block 0 and block 2 are recognized as official buildings. By comparing Baidu Maps and Google Earth images, we found that these residential buildings are used as office buildings, which makes it difficult to distinguish them from office buildings. Another possible reason for this is that the COVID-19 pandemic led to workplace limitations, quarantines, and selective lockdowns, causing some people to work from home.
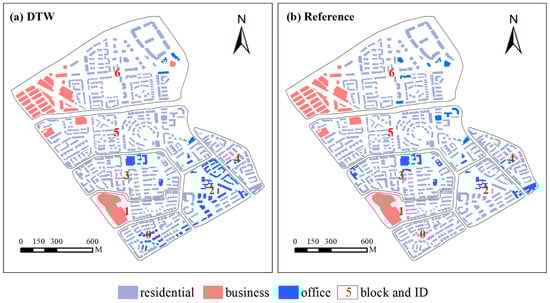
Figure 8.
Results of building function recognition are shown for (a) DTW method, and (b) reference data.
Returning to the grouping results in Figure 5, we find that the proposed method has a competitive performance for commercial building grouping, given that there is only one error group. In contrast, there are three incorrect groups recognized using the standard CTD method. For office building grouping, the grouping results of the proposed method are all correct, whereas the results recognized with the standard CTD method are all wrong. This approach mistakenly grouped office and residential buildings into the same groups. Neither method grouped the residential buildings identified as office buildings correctly.
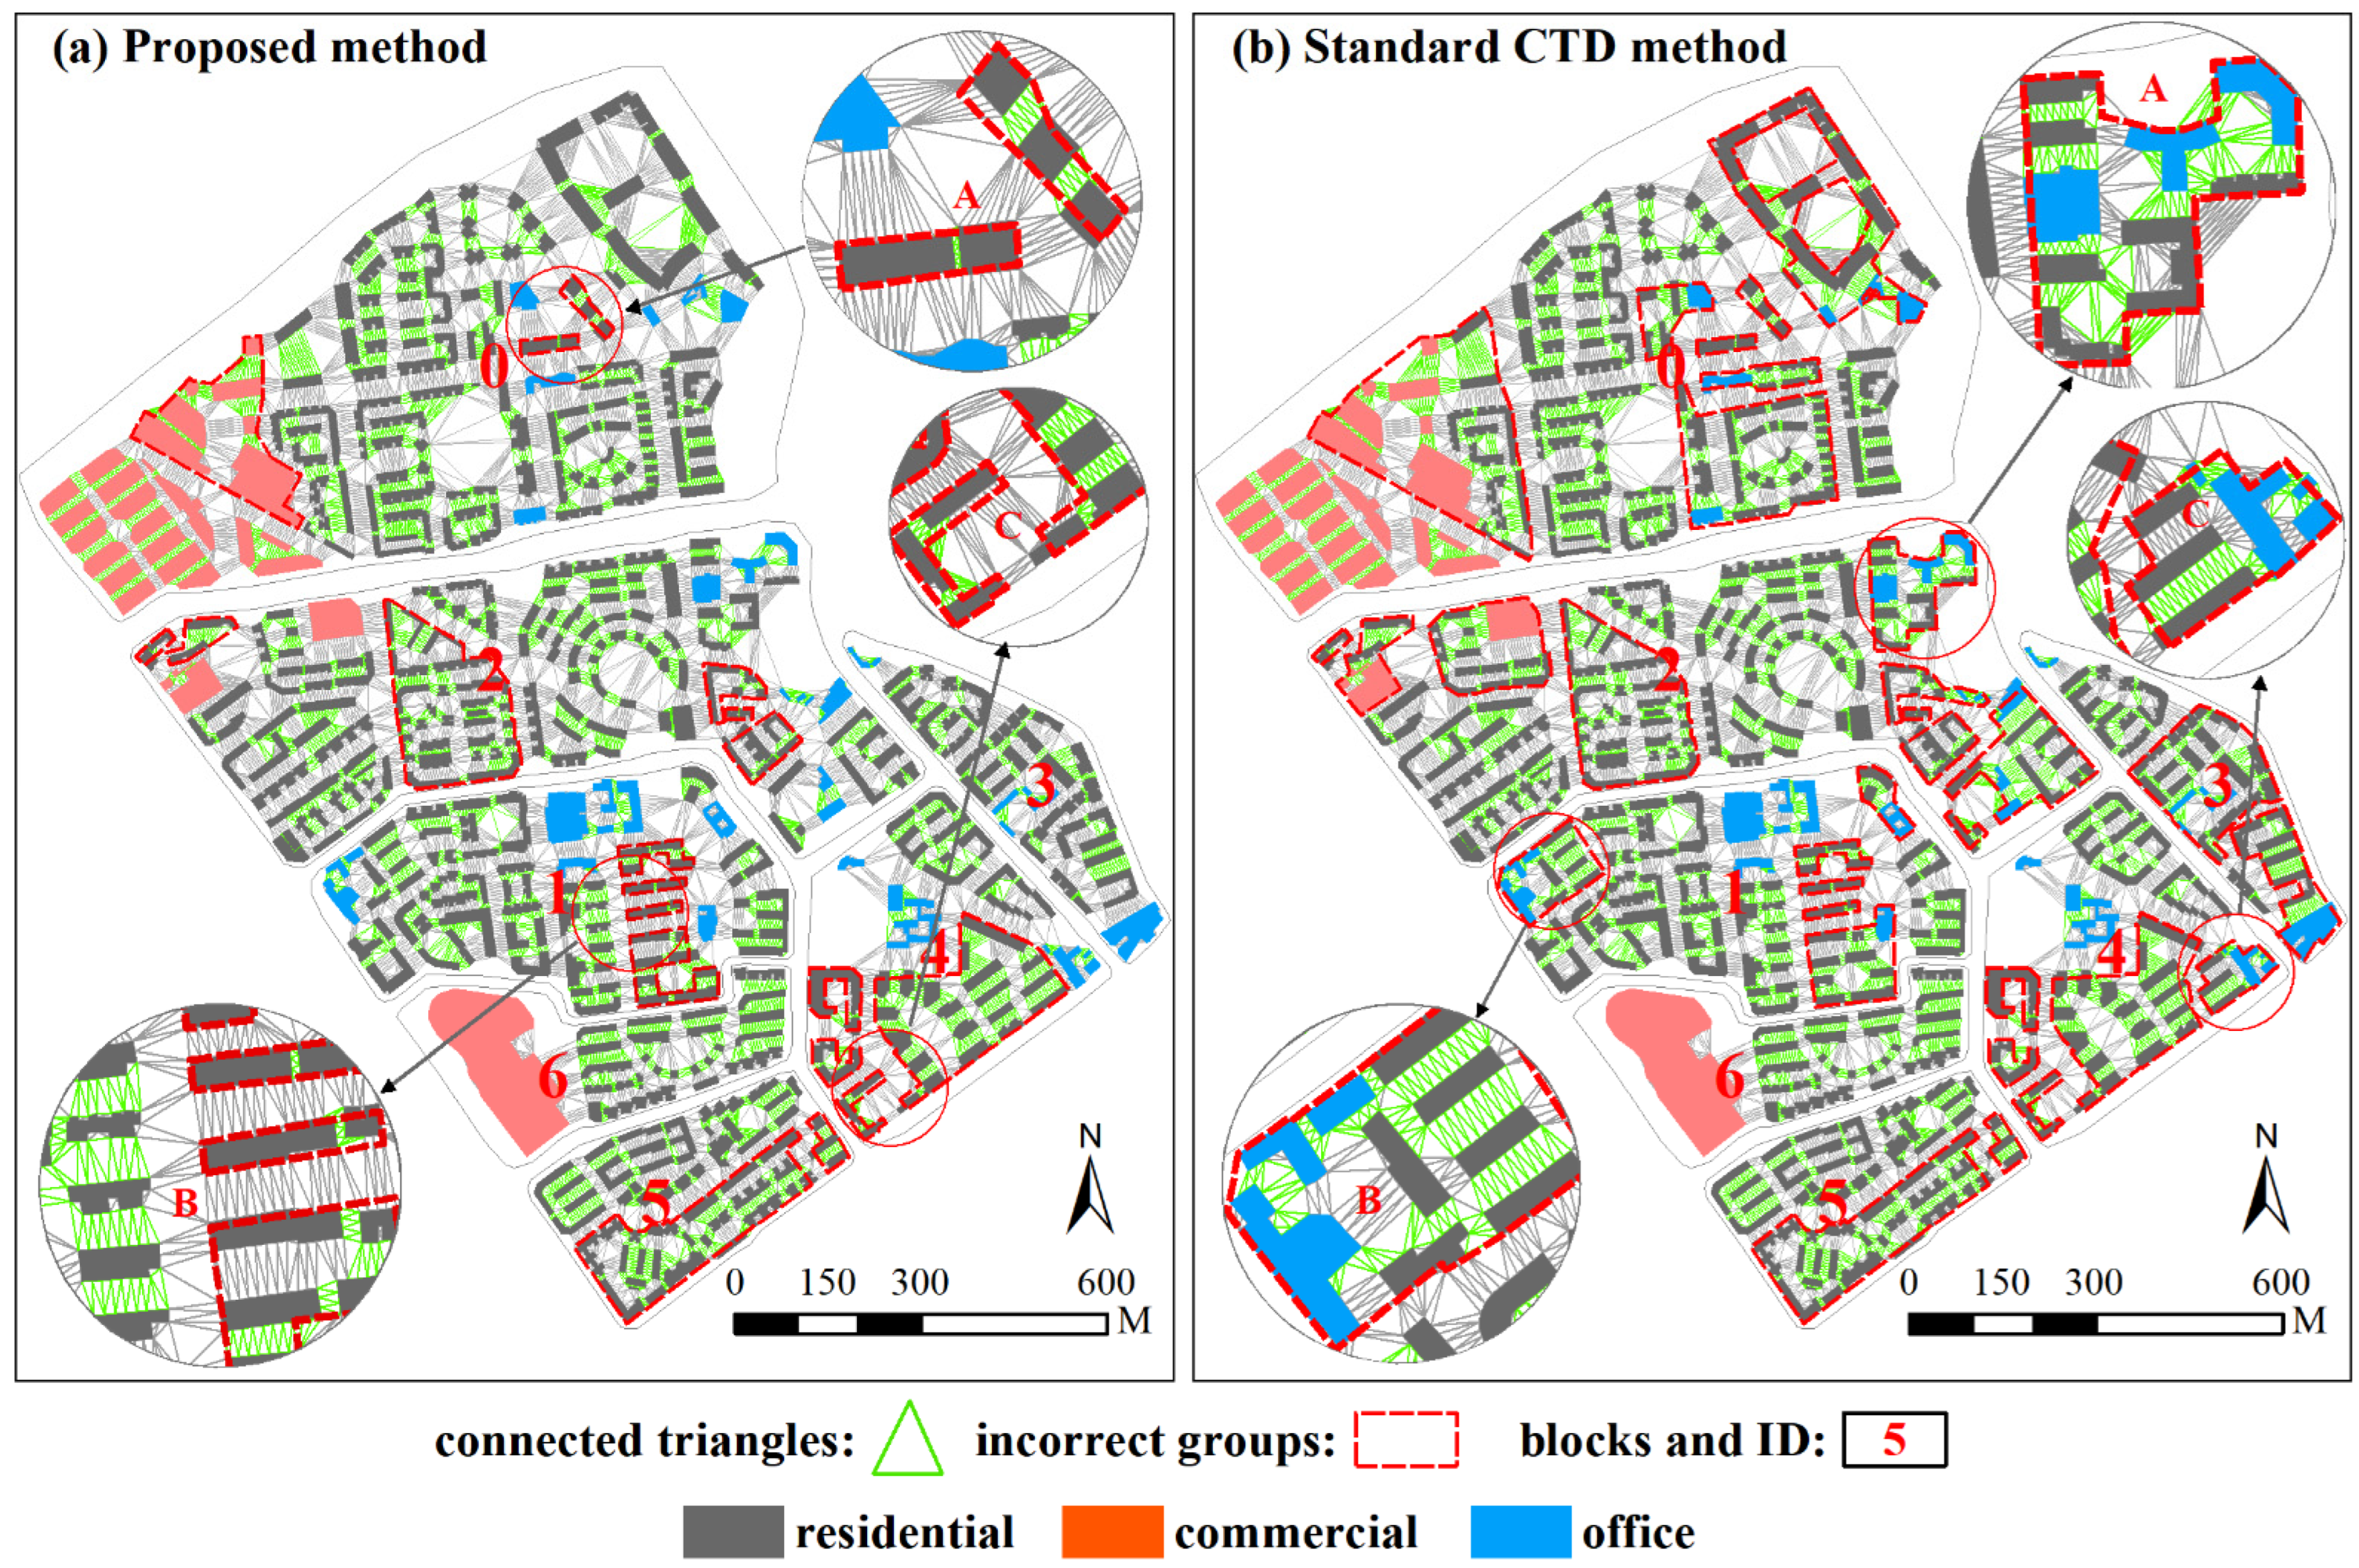
Figure 9 presents the remaining triangles during the segmentation procedure (step 6). Green triangles indicate proximity relationships between buildings. This figure provides a clear understanding of why some relationships are deleted, whereas others are retained. This is because indicators used in the graph segmentation process are derived from triangles connecting buildings. When conducting the segmentation of a graph, if the proximity relationship of two buildings (i.e., two nodes) is removed, triangles connecting the two buildings are also deleted. From this figure, we found that there are two reasons for the proposed method to over-segment. First, the distance between buildings in the same group varies greatly (Figure 9a(A)), and some of them are greater than that between groups (Figure 9a(B,C)). Moreover, abnormal distance causes a low continuity value (Figure 9a(A)). In contrast, the standard CTD method does not take function information as a constraint except for the above reasons, leading to more error groups being recognized. However, these buildings with different functions are close to each other, leading to all buildings being grouped together (Figure 9b(B,C)). Moreover, without the help of semantic information, it is difficult to divide school buildings into building groups with different functions (Figure 9b(A)).
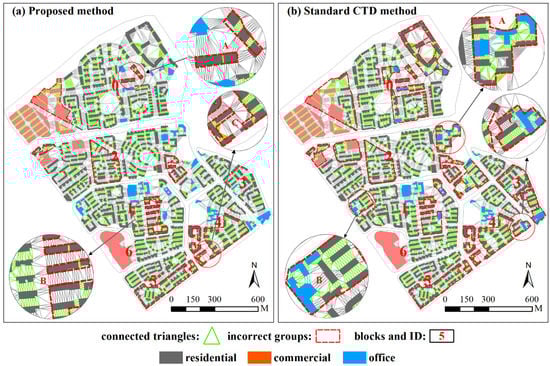
Figure 9.
The remaining triangles during the segmentation procedure (step 6) are shown for (a) the proposed method, and (b) the standard CTD method. Buildings within the red outlines indicate misclassified building groups.
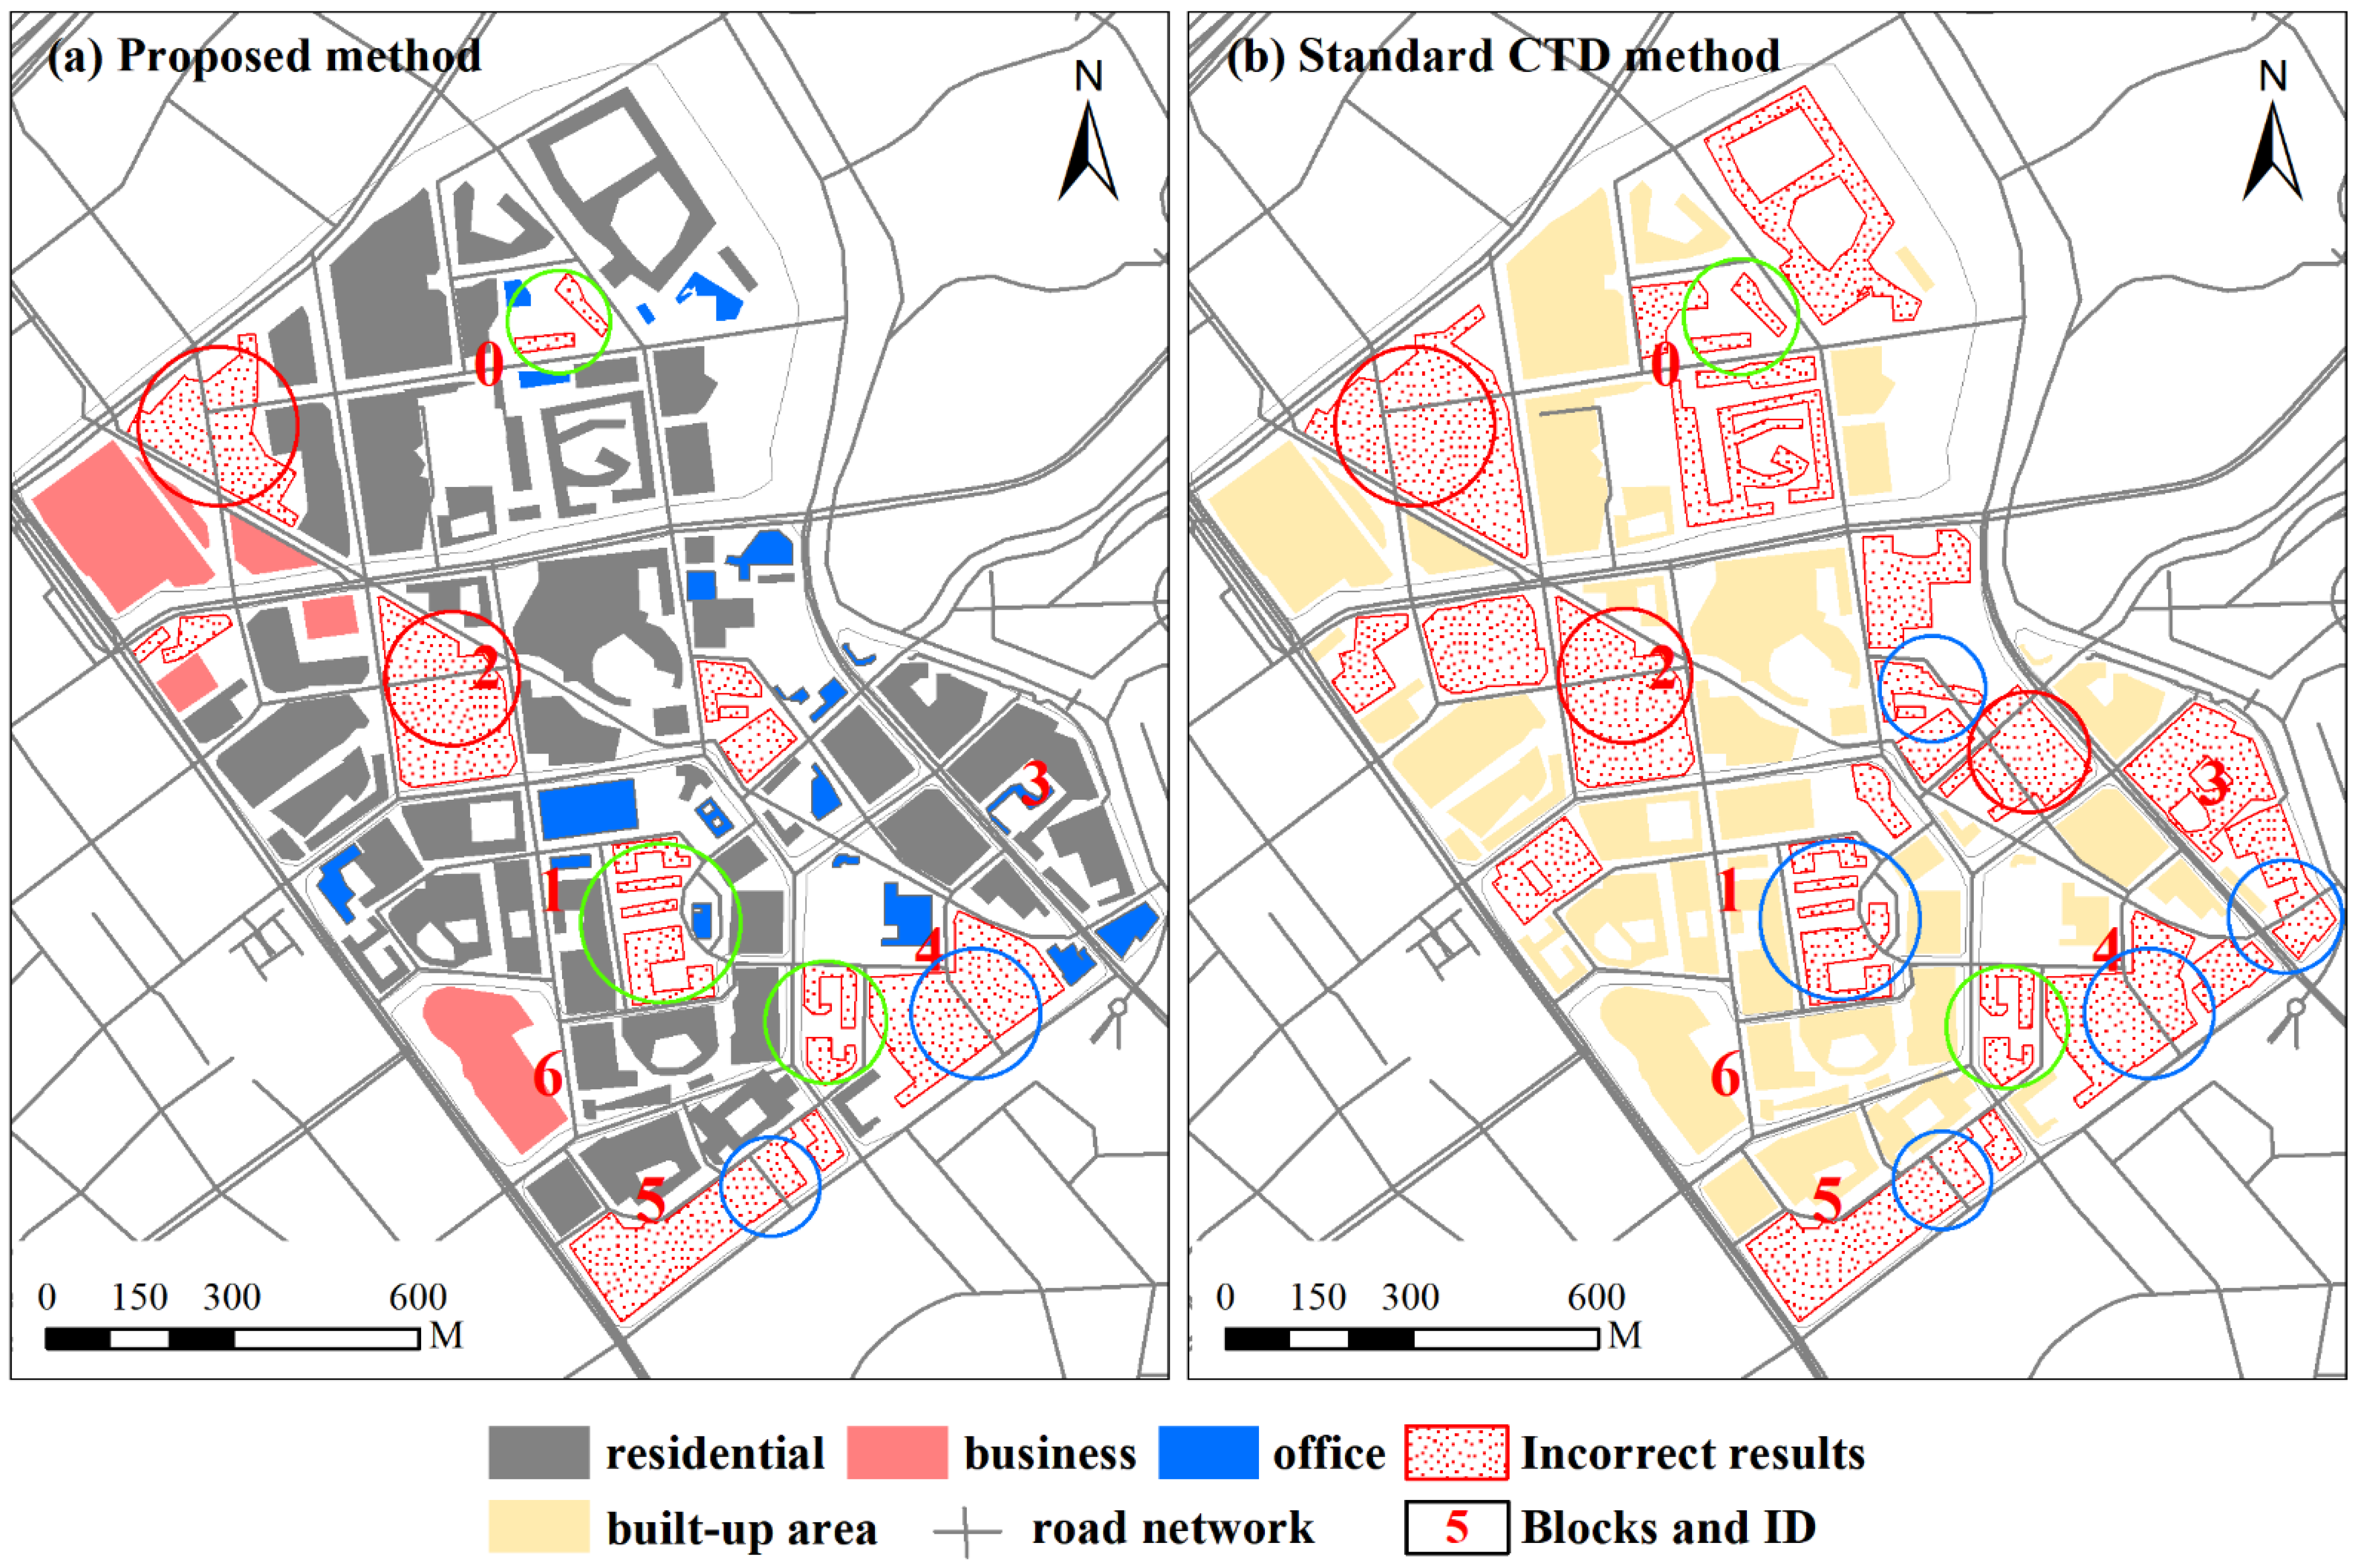
Map generalization is an important downstream application of building group recognition. Thus, we conducted an experiment to test whether the recognized results can form a basis for subsequent map generalization. Figure 10 presents the generalization results derived from the building groups that are recognized using the proposed method and the compared method. The generalization approach is the method proposed in the literature [33]. The generalization results are superimposed on the road network of the AutoNavi map for display. This figure shows how building grouping affects the quality of a map. First, under-segmentation (i.e., inclusion patterns) allows users to make more detours when heading to a destination (e.g., built-up areas marked with red circles in Figure 10). Second, the generalized results of within patterns identified using an over-segmentation method do not have a great impact on navigation because over-segmentation mostly occurs for buildings within the same communities (e.g., built-up areas marked with green circles in Figure 10). Third, the generalized results of the groups recognized using the standard CTD method are the same as the under-segmentation results, which require more detours for navigation (e.g., built-up areas marked with red circles in Figure 10). The incorrect generalized results derived from overlap patterns (e.g., built-up areas marked with blue circles in Figure 10) can cause navigation errors when driving. This is because the gaps between these generalized results look like driving roads; they are actually walkways in residential compounds.
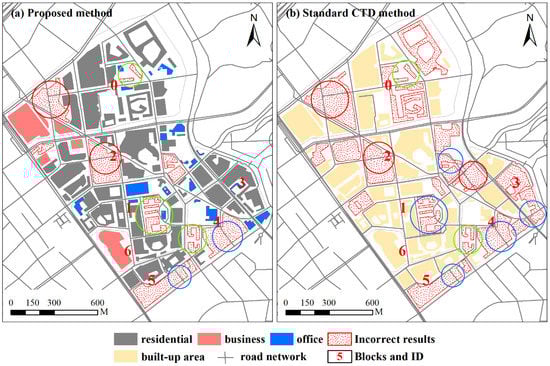
Figure 10.
The generalized results based on building group patterns recognized using the two methods are shown for (a) the proposed method, and (b) the standard CTD method. Incorrect results marked with red circles were generalized from inclusion patterns. Incorrect results marked with green circles were generalized from the within patterns. Incorrect results marked with blue circles were generalized from overlap patterns.
5. Conclusions
Due to the lack of valid data, most traditional building grouping methods only consider the geometric characteristics of buildings, resulting in unsatisfactory grouping results. With the support of geospatial big data, this paper proposed a method of combining building geometric characteristics and functional information to detect building groups. Specifically, the proposed approach consists of two parts, namely, building function detection and building group recognition. Tencent user density data and POI data were used to infer building functions based on the DTW algorithm. Only buildings with the same function can be grouped together. We validated our approaches using a case study. The experimental results indicate that the proposed methods can produce satisfactory results, given that the correctness values are all above 81.63% for the study area. In contrast, the compared method does not take function information as a constraint, leading to more error groups being recognized. Notably, when buildings with different functions are close to each other, the compared method grouped all buildings together. The generalization results derived from the groups with function information are more in line with daily map use needs, as they can provide users with a more accurate spatial division of urban buildings.
Further tests are needed to improve the proposed method, such as testing it with more semantic information in addition to building functions (e.g., the height of buildings). More work is also required to automatically calibrate the parameters (e.g., path angle) used in the presented segmentation strategy.
Author Contributions
Conceptualization, Min Deng and Xianjin He; data curation, Guowei Luo; formal analysis, Xianjin He; investigation, Guowei Luo; methodology, Xianjin He; software, Xianjin He and Guowei Luo; writing—original draft, Xianjin He; writing—review and editing, Min Deng. All authors have read and agreed to the published version of the manuscript.
Funding
This research was funded by the National Natural Science Foundation of China, grant number 41901404, Guangxi Natural Science Foundation, grant number 2020GXNSFAA159060.
Informed Consent Statement
Informed consent was obtained from all subjects involved in the study.
Data Availability Statement
Not applicable.
Conflicts of Interest
The authors declare no conflict of interest.
References
- Du, S.; Luo, L.; Cao, K.; Shu, M. Extracting building patterns with multilevel graph partition and building grouping. ISPRS J. Photogramm. Remote Sens. 2016, 122, 81–96. [Google Scholar] [CrossRef]
- Steiniger, S. Enabling Pattern-Aware Automated Map Generalization. Ph.D. Thesis, University of Zurich, Zurich, Switzerland, 2007. [Google Scholar]
- Regnauld, N. Contextual Building Typification in Automated Map Generalization. Algorithmica 2001, 30, 312–333. [Google Scholar] [CrossRef]
- Sayidov, A.; Weibel, R.; Leyk, S. Recognition of group patterns in geological maps by building similarity networks. Geocarto Int. 2020, 37, 1–20. [Google Scholar] [CrossRef]
- Zhang, L.; Hao, D.; Dong, C.; Zhen, W. A spatial cognition-based urban building clustering approach and its applications. Int. J. Geogr. Inform. Sci. 2013, 27, 721–740. [Google Scholar]
- Fang, W.; Xianyong, G.; Jiawei, D. Overview of the research Progress in Automated Map Generalization. Acta Geod. Cartogr. Sin. 2017, 46, 1645–1664. [Google Scholar]
- Mackaness, W.; Burghardt, D.; Cécile, D. Map Generalisation: Fundamental to the Modelling and Understanding of Geographic Space. In Abstracting Geographic Information in a Data Rich World; Burghardt, D., Cécile, D., Mackaness, W., Eds.; Springer: Berlin/Heidelberg, Germany, 2014; pp. 1–15. [Google Scholar]
- Zhang, X.; Ai, T.; Stoter, J.; Kraak, M.; Molenaar, M. Building pattern recognition in topographic data: Examples on collinear and curvilinear alignments. GeoInformatica. 2013, 17, 1–33. [Google Scholar] [CrossRef] [Green Version]
- Wabiński, J.; Mościcka, A. Automatic (Tactile) Map Generation—A Systematic Literature Review. ISPRS Int. J. Geo-Inf. 2019, 8, 293. [Google Scholar] [CrossRef] [Green Version]
- Du, S.; Shu, M.; Feng, C. Representation and discovery of building patterns: A three-level relational approach. Int. J. Geogr. Inform. Sci. 2016, 30, 1161–1186. [Google Scholar] [CrossRef]
- Yu, W.; Zhou, Q.; Zhao, R. A heuristic approach to the generalization of complex building groups in urban villages. Geocarto Int. 2019, 36, 155–179. [Google Scholar] [CrossRef]
- Cetinkaya, S.; Basaraner, M.; Burghardt, D. Proximity-based grouping of buildings in urban blocks: A comparison of four algorithms. Geocarto Int. 2015, 30, 618–632. [Google Scholar] [CrossRef]
- Ai, T.; Guo, R. Polygon cluster pattern mining based on Gestalt principles. Acta Geod. Cartogr. Sin. 2007, 36, 302–308. [Google Scholar]
- Shuai, Y.; Shuai, H.; Ni, L. Polygon cluster pattern recognition based on new visual distance. In Geoinformatics 2007: Geospatial Information Science; International Society for Optics and Photonics: Bellingham, WA, USA, 2007; p. 675316. [Google Scholar]
- He, X.; Deng, M.; Luo, G. Recognizing Linear Building Patterns in Topographic Data by Using Two New Indices based on Delaunay Triangulation. ISPRS Int. J. Geo-Inf. 2020, 9, 231. [Google Scholar] [CrossRef] [Green Version]
- Wang, W.; Du, S.; Guo, Z.; Luo, L. Polygonal clustering analysis using multilevel graph-partition. Trans. GIS. 2015, 19, 716–736. [Google Scholar] [CrossRef]
- Yu, W.; Ai, T.; Liu, P.; Cheng, X. The analysis and measurement of building patterns using texton co-occurrence matrices. Int. J. Geogr. Inform. Sci. 2017, 31, 1079–1100. [Google Scholar] [CrossRef]
- Chen, Z.; Ma, X.; Wu, L.; Xie, Z. An Intuitionistic Fuzzy Similarity Approach for Clustering Analysis of Polygons. ISPRS Int. J. Geo-Inf. 2019, 8, 98. [Google Scholar] [CrossRef] [Green Version]
- Christophe, S.; Ruas, A. Detecting building alignments for generalisation purposes. In Advances in Spatial Data Handling; Springer: Berlin/Heidelberg, Germany, 2002; pp. 419–432. [Google Scholar]
- Zhang, X.; Ai, T.; Stoter, J. Characterization and detection of building patterns in cartographic data: Two algorithms. In Advances in Spatial Data Handling and GIS; Springer: Berlin/Heidelberg, Germany, 2012; pp. 93–107. [Google Scholar]
- Yan, X.; Ai, T.; Yang, M.; Yin, H. A graph convolutional neural network for classification of building patterns using spatial vector data. ISPRS J. Photogramm. Remote Sens. 2019, 150, 259–273. [Google Scholar] [CrossRef]
- He, X.; Zhang, X.; Xin, Q. Recognition of building group patterns in topographic maps based on graph partitioning and random forest. ISPRS J. Photogramm. Remote Sens. 2018, 136, 26–40. [Google Scholar] [CrossRef]
- Wang, Y.; Zhang, L.; Mathiopoulos, P.T.; Deng, H. A Gestalt rules and graph-cut-based simplification framework for urban building models. Int. J. Appl. Earth Obs. Geoinf. 2015, 35, 247–258. [Google Scholar] [CrossRef]
- Niu, N.; Liu, X.; Jin, H.; Ye, X.; Liu, Y.; Li, X.; Chen, Y.; Li, S. Integrating multi-source big data to infer building functions. Int. J. Geogr. Inform. Sci. 2017, 31, 1871–1890. [Google Scholar] [CrossRef]
- Yao, Y.; Li, X.; Liu, X.; Liu, P.; Liang, Z.; Zhang, J.; Mai, K. Sensing spatial distribution of urban land use by integrating points-of-interest and Google Word2Vec model. Int. J. Geogr. Inf. Sci. 2017, 31, 825–848. [Google Scholar] [CrossRef]
- Jiang, S.; Alves, A.; Rodrigues, F.; Ferreira, J.; Pereira, F.C. Mining point-of-interest data from social networks for urban land use classification and disaggregation. Comput. Environ. Urban Syst. 2015, 53, 36–46. [Google Scholar] [CrossRef] [Green Version]
- Zhong, C.; Huang, X.; Müller Arisona, S.; Schmitt, G.; Batty, M. Inferring building functions from a probabilistic model using public transportation data. Comput. Environ. Urban Syst. 2014, 48, 124–137. [Google Scholar] [CrossRef]
- Du, S.; Zhang, F.; Zhang, X. Semantic classification of urban buildings combining VHR image and GIS data: An improved random forest approach. ISPRS J. Photogramm. Remote Sens. 2015, 105, 107–119. [Google Scholar] [CrossRef]
- Robinson, A.C.; Demšar, U.; Moore, A.B.; Buckley, A.; Jiang, B.; Field, K.; Kraak, M.-J.; Camboim, S.P.; Sluter, C.R. Geospatial big data and cartography: Research challenges and opportunities for making maps that matter. Int. J. Cartogr. 2017, 3 (Suppl. 1), 32–60. [Google Scholar] [CrossRef] [Green Version]
- Keogh, E.J.; Pazzani, M.J. Derivative dynamic time warping. In Proceedings of the 2001 SIAM International Conference on Data Mining (SDM 2001), Chicago, IL, USA, 5–7 April 2001; pp. 1–11. [Google Scholar]
- Ai, T.; Zhang, X. The aggregation of urban building clusters based on the skeleton partitioning of gap space. In The European Information Society; Springer: Berlin/Heidelberg, Germany, 2007; pp. 153–170. [Google Scholar]
- Zhang, X.; Stoter, J.; Ai, T.; Kraak, M.; Molenaar, M. Automated evaluation of building alignments in generalized maps. Int. J. Geogr. Inform. Sci. 2013, 27, 1550–1571. [Google Scholar] [CrossRef]
- He, X.; Zhang, X.; Yang, J. Progressive Amalgamation of Building Clusters for Map Generalization Based on Scaling Subgroups. ISPRS Int. J. Geo-Inf. 2018, 7, 116. [Google Scholar] [CrossRef] [Green Version]

Publisher’s Note: MDPI stays neutral with regard to jurisdictional claims in published maps and institutional affiliations. |
© 2022 by the authors. Licensee MDPI, Basel, Switzerland. This article is an open access article distributed under the terms and conditions of the Creative Commons Attribution (CC BY) license (https://creativecommons.org/licenses/by/4.0/).