Article

Limiting the Collection of Ground Truth Data for Land Use and Land Cover Maps with Machine Learning Algorithms

1
Department of Engineering, Faculty of Agriculture, Dalhousie University, Truro, NS B2N 5E3, Canada
2
Faculty of Sustainable Design Engineering, University of Prince Edward Island, Charlottetown, PE C1A 4P3, Canada
3
College of Engineering Technology, University of Doha for Science and Technology, Doha P.O. Box 24449, Qatar
*
Author to whom correspondence should be addressed.
ISPRS Int. J. Geo-Inf. 2022, 11(6), 333; https://doi.org/10.3390/ijgi11060333
Submission received: 19 March 2022 / Revised: 17 May 2022 / Accepted: 31 May 2022 / Published: 3 June 2022

Abstract

:
Land use and land cover (LULC) classification maps help understand the state and trends of agricultural production and provide insights for applications in environmental monitoring. One of the major downfalls of the LULC technique is inherently linked to its need for ground truth data to cross-validate maps. This paper aimed at evaluating the efficiency of machine learning (ML) in limiting the use of ground truth data for LULC maps. This was accomplished by (1) extracting reliable LULC information from Sentinel-2 and Landsat-8 s images, (2) generating remote sensing indices used to train ML algorithms, and (3) comparing the results with ground truth data. The remote sensing indices that were tested include the difference vegetation index (DVI), the normalized difference vegetation index (NDVI), the normalized built-up index (NDBI), the urban index (UI), and the normalized bare land index (NBLI). Extracted vegetation indices were evaluated on three ML algorithms, namely, random forest (RF), k-nearest neighbour (K-NN), and k dimensional-tree (KD-Tree). The accuracy of these algorithms was assessed with standard statistical measures and ground truth data randomly collected in Prince Edward Island, Canada. Results showed that high kappa coefficient values were achieved by K-NN (82% and 74%), KD-Tree (80% and 78%), and RF (83% and 73%) for Sentinel-2A and Landsat-8 imagery, respectively. RF was a better classifier than K-NN and KD-Tree and had the highest overall accuracy with Sentinel-2A satellite images (92%). This approach provides the basis for limiting the collection of ground truth data and thus reduces the labour cost, time, and resources needed to collect ground truth data for LULC maps.

1. Introduction

Land use and land cover (LULC) classification is the most widely researched topic in the remote sensing field as it provides valuable information for urban planning, resource management, environmental monitoring, and agricultural mapping [1]. LULC classification can be used to highlight historical trends or provide evidence-based tools in decision making for resource management [2]. For several years, satellite imagery has been used in LULC classification in a variety of statistical and empirical methods. Unfortunately, these methods have several limitations on accuracy assessment, as each satellite has different spectral, temporal, and radiometric resolutions [3]. Recently, the data science and remote sensing communities have successfully achieved higher accuracy due to the launch of new satellite constellations and machine learning (ML) algorithms [4]. Furthermore, free access to data from earth observation satellites, including Sentinel-2 and Landsat-8, has created competition among big data scientists to increase classification accuracy with new classification algorithm approaches.
According to Showqi et al. [5], population growth is a primary driving factor for LULC transformation. As a region’s population grows, so does the demand increase for built-up space and food, while other land cover types, such as barren land, agricultural, and forest, decline. Food consumption is increasing due to the world’s population having more than doubled between 1961 and 2016 [6]. Cropland covers about a third of the land, while grazing pastures and meadows cover the remaining two-thirds. Farmland area per capita has decreased substantially from 0.45 hectares per capita in 1961 to 0.21 hectares per capita in 2016. Urban areas expand outwards when agricultural and other natural land cover types are transformed into developed areas. Rapid urbanization triggered rapid economic growth and land-use changes, raising the demand for efficient natural resource management [7]. An increased population induced rapid urbanization, and the resulting economic growth and land-use changes heightened the demand for efficient natural resource management [8]. If the land cover changes are not continuously monitored with an increasing population, it may negatively impact the environment and resource management of the area [9]. An up-to-date and cost-effective method is required to prepare the LULC map for its resource management and planning and is helpful to meet the increased food demand.
The national and regional LULC maps such as the Agriculture and Agri-Food Canada (AAFC) Annual Crop Inventory are produced yearly and help to understand the state and trends in agriculture production in Canada. The method commonly used for preparing these maps consists of collecting ground truth data and training a classifier [10]. Although this technique can be very accurate, the process of collecting reference data requires extensive planning, time, and important financial resources [11]. In addition, if ground truth data cannot be collected for a year due to unforeseeable events, the creation of LULC maps can be compromised and create a gap in the data. This situation occurred in 2020 when the AAFC Annual Crop Inventory could not be completed in Nova Scotia due to COVID-19 travel restrictions. These restrictions prevented ground data collection, making it impossible to define some agricultural classes [12]. Although ground truth data remain essential to validate LULC maps, this situation highlights the importance of developing new methods that would limit the amount of ground truth data for LULC maps generation.
The quantity of training and validation data is another factor that can influence the classification accuracy of ML algorithms [13]. For example, ML algorithms perform better with larger training data sets than with smaller data sets [14]. The minimal number of training samples should be 10 times the number of variables, according to a long-standing ‘rule of thumb’ in ML [15]. Unfortunately, there appears to be no comparable guidance in the literature regarding the minimum number of samples required for ML classification. According to the [16] classification method, the number of input variables and the size and spatial heterogeneity of the mapped area can each influence the number of training samples required in classification. Large, precise training data sets are required, according to the general conclusion [17]. However, in the realm of applied remote sensing, training and validation data were both costly and scarce [18]. As a result, most remote sensing studies used a single fixed data set to test the accuracy of ML algorithms [19,20].
Several supervised and unsupervised algorithms have been developed to process satellite images for LULC classification. Unsupervised classification algorithms use automated statistical algorithms to separate LULC classes without training data. Vishwanath et al. [21] used an unsupervised algorithm to distinguish the land cover features in remotely sensed images. They used the K-means cluster algorithm to classify the LULC classes effectively. In another study, Shivakumar and Rajashekararadhya [22] tested the maximum likelihood classifier for mapping the LULC classes under different scenarios.
Supervised classification algorithms are very efficient at mapping LULC features. The supervised classification method involves the representative samples from each predefined class, followed by the training of algorithms to learn about LULC classes for efficient classification. Related work by Mather and Tso and Abbas and Jaber [23,24] documented that supervised classification algorithms are likely to perform better than unsupervised classification algorithms.
LULC maps require an appropriate classification algorithm to solve real-world problems with high accuracy [25]. Several studies have shown the potential of ML and statistical algorithms in LULC classification. For example, Desai and Umrikar [25] tested two supervised classifiers, namely maximum likelihood and minimum distance for LULC classification using Landsat imagery. The maximum likelihood classification of Landsat data had a higher accuracy than the minimum distance method. Nguyen et al. [26] used the ground truth data to train the ML algorithms for LULC classification. Other studies by Jia et al. [27] tested a support vector machine (SVM) and maximum likelihood algorithms on Landsat-8 imagery. The maximum likelihood classifier results were more accurate than the results of SVM. Over time, more advanced algorithms have been used in LULC classification, including decision trees (DT) and random forest (RF). Thanh Noi and Kappas [28] tested RF, k-nearest neighbour (K-NN), and SVM using training sample sizes generated from Sentinel imagery. Results from the study showed that SVM had the highest accuracy and had the least sensitivity to the size of the training sample. However, K-NN and RF classifiers attained a higher accuracy with a large training size compared to SVM.
The literature also reveals that every classification method performs differently depending on the types of satellites used to capture images. For example, Jia et al. [27] compared Landsat-7 and Landsat-8 using similar algorithms and found that the latter showed a higher accuracy than the former satellite. Similarly, Ali et al. [29] recorded a higher accuracy on ALOS-2 dual-polarization bands than the Landsat-8 optical imagery data with a maximum likelihood classifier. Clerici et al. [30] tested Sentinel-1 and Sentinel-2 satellite imagery to enhance mapping accuracy and found a higher accuracy for Sentinel-2 data than Sentinel-1 data in conjunction with the SVM algorithm. The above-mentioned results proved that the accuracy of LULC maps depends on the choice of satellite and the classification algorithms used.
Due to the high cost associated with the collection of ground truth points and the heightened demand for efficient natural resource management, the objective of this study was to evaluate the efficiency of ML algorithms in limiting the use of ground truth data for LULC maps. This will be accomplished by extracting LULC information from Sentinel-2 and Landsat-8 satellite images and by generating remote sensing indices used to train ML algorithms. The results of this paper are divided into three parts. First, results from the ML algorithms were evaluated against ground truth data. Second, standard statistical measures were used to evaluate the performance of each ML algorithm. Third, algorithms were compared to each other to understand their performance better.
The paper has been divided into two main sections, i.e., the materials and methods section and the results and discussion section. The materials utilized in this investigation and their processing details are mentioned in the materials and methods section. The accuracy of the ML algorithm is examined and compared in the results and discussion section with the findings of prior studies.

2. Materials and Methods
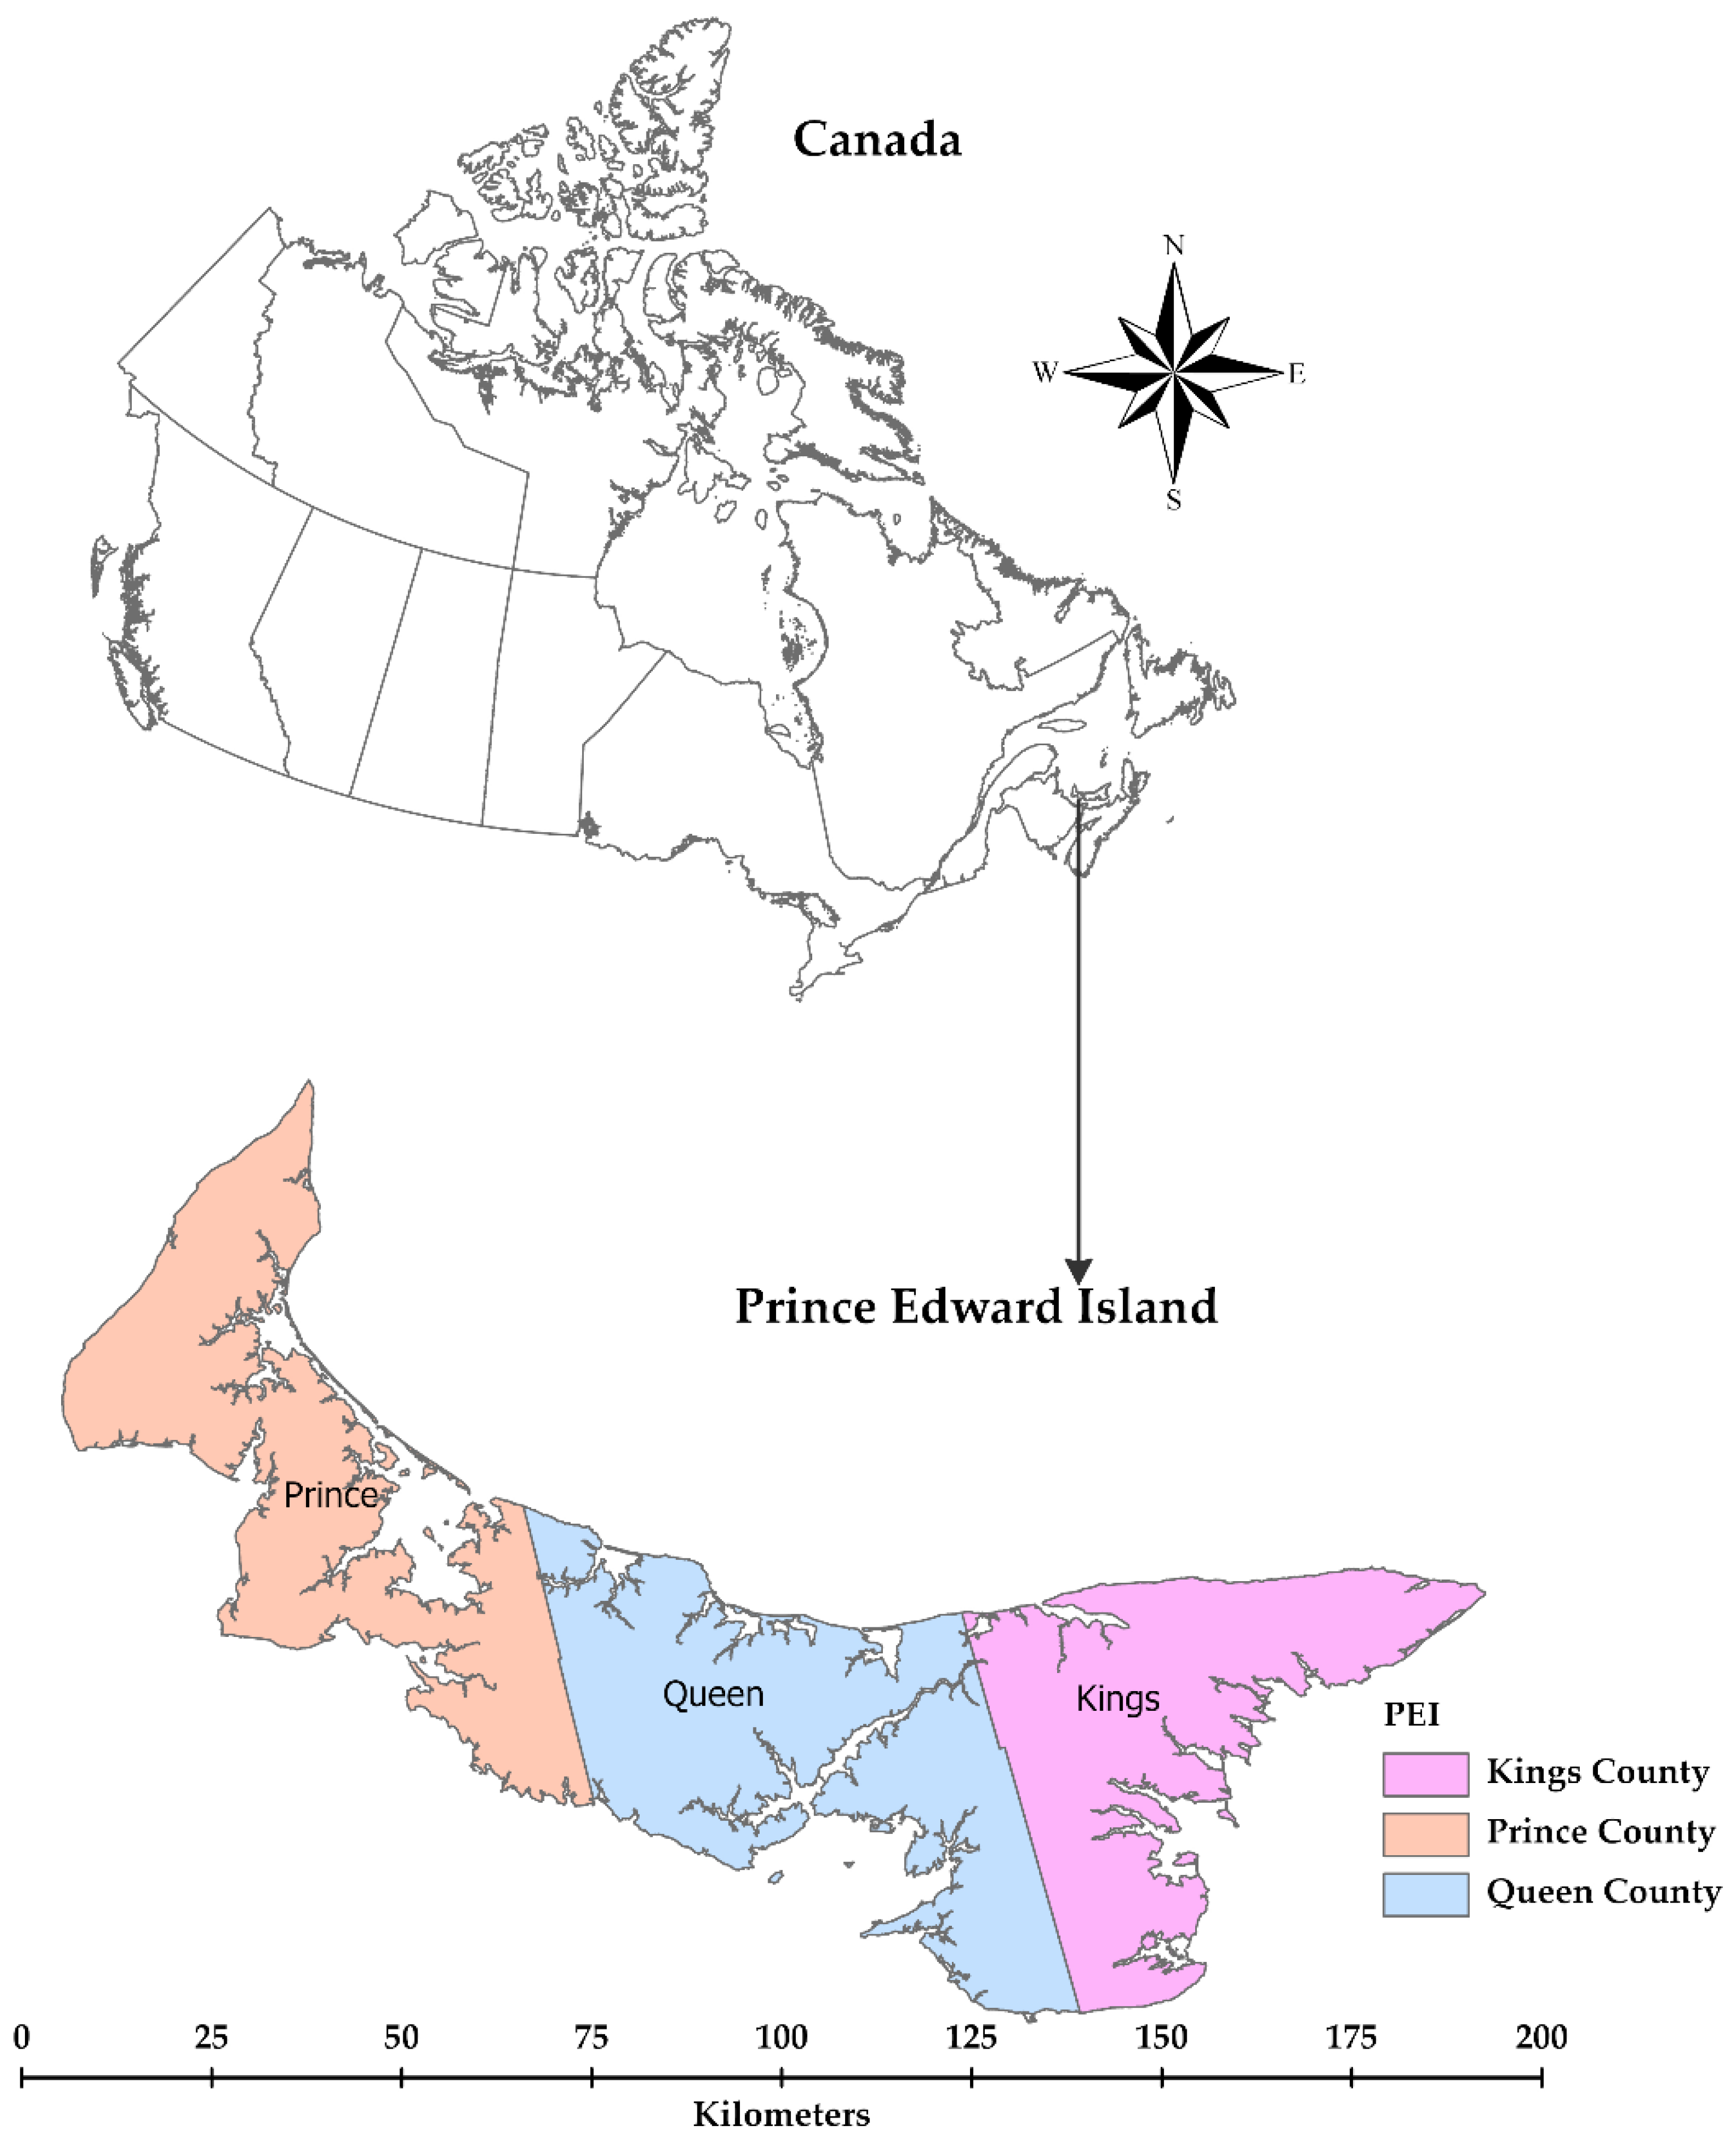
2.1. The Study Area

The study area consists of Prince Edward Island (PEI), one of Canada’s smallest provinces with a land area of approximately 5669 square kilometres (Figure 1). In 2019, the province had a total population of 157,262, which represents less than 0.5% of Canada’s total population [31]. The climate on the Island is mild and strongly influenced by the warm waters of the Gulf of St. Lawrence [32]. PEI has a wide variety of landscape uses, including forests, agriculture, meadows, water, wetlands, and urban areas.

2.2. Data Acquisition

Two types of satellite images were evaluated, since the literature reveals that classification methods perform differently on different types of satellite imagery [33]. A total of seven satellite scenes were acquired from the USGS website from 7 July to 28 July 2019 (Table 1).
The Sentinels satellites are a constellation that consists of two twin satellites, Sentinel-2A and Sentinel-2B. When these satellites operate simultaneously from the same orbit, phased at 180° to each other, they can monitor the variability in land surface conditions every 5 days [34]. Sentinel-2 satellites acquire optical imagery at a resolution ranging from 10 to 60 m depending on the spectral bands. The satellite coverage limits are between 56° latitude South and 84o longitude North with a swath width of 290 km.
The Landsat-8 satellite is also an Earth observation satellite equipped with two payloads that collect 11 spectral bands with a spatial resolution ranging from 30 to 100 m. Landsat-8 was selected due to its enhanced thematic mapper in the range of visible bands compared to other Landsat satellites [27]. The Landsat-8 has improved capabilities from the previous generation due to the addition of new spectral bands in the blue spectrum, the use of two new thermal bands, and an enhanced duty cycle that has increased the daily image collection capacity of the satellite [35].
The Landsat-8 satellite scenes were selected with the lowest cloud cover available to reduce the scattering and absorption of light in the atmosphere (Table 1). Additionally, the satellite scenes were taken from the collection-1 level-1, which was already geometrically and radiometrically corrected.

2.3. Data Preparation

The Sentinel-2A and Landsat-8 images were processed using the Sentinel Application Toolbox version 8.0.0 (SNAP). All Sentinel-2A and Landsat-8 satellite image bands were resampled in SNAP using the nearest neighbour method into 20 and 30 m resolutions, respectively. The resampled images were mosaicked to cover PEI’s provincial boundary using the SNFAP built-in raster mosaicking tool. Three Landsat-8 scenes were mosaicked to cover the entire Island. Two of these scenes were collected on 26 July 2019, and the other one was acquired on 19 July 2019. The satellite images were reprojected to a local coordinate system, imported in ArcGIS Pro, and used to create training data for the LULC maps.

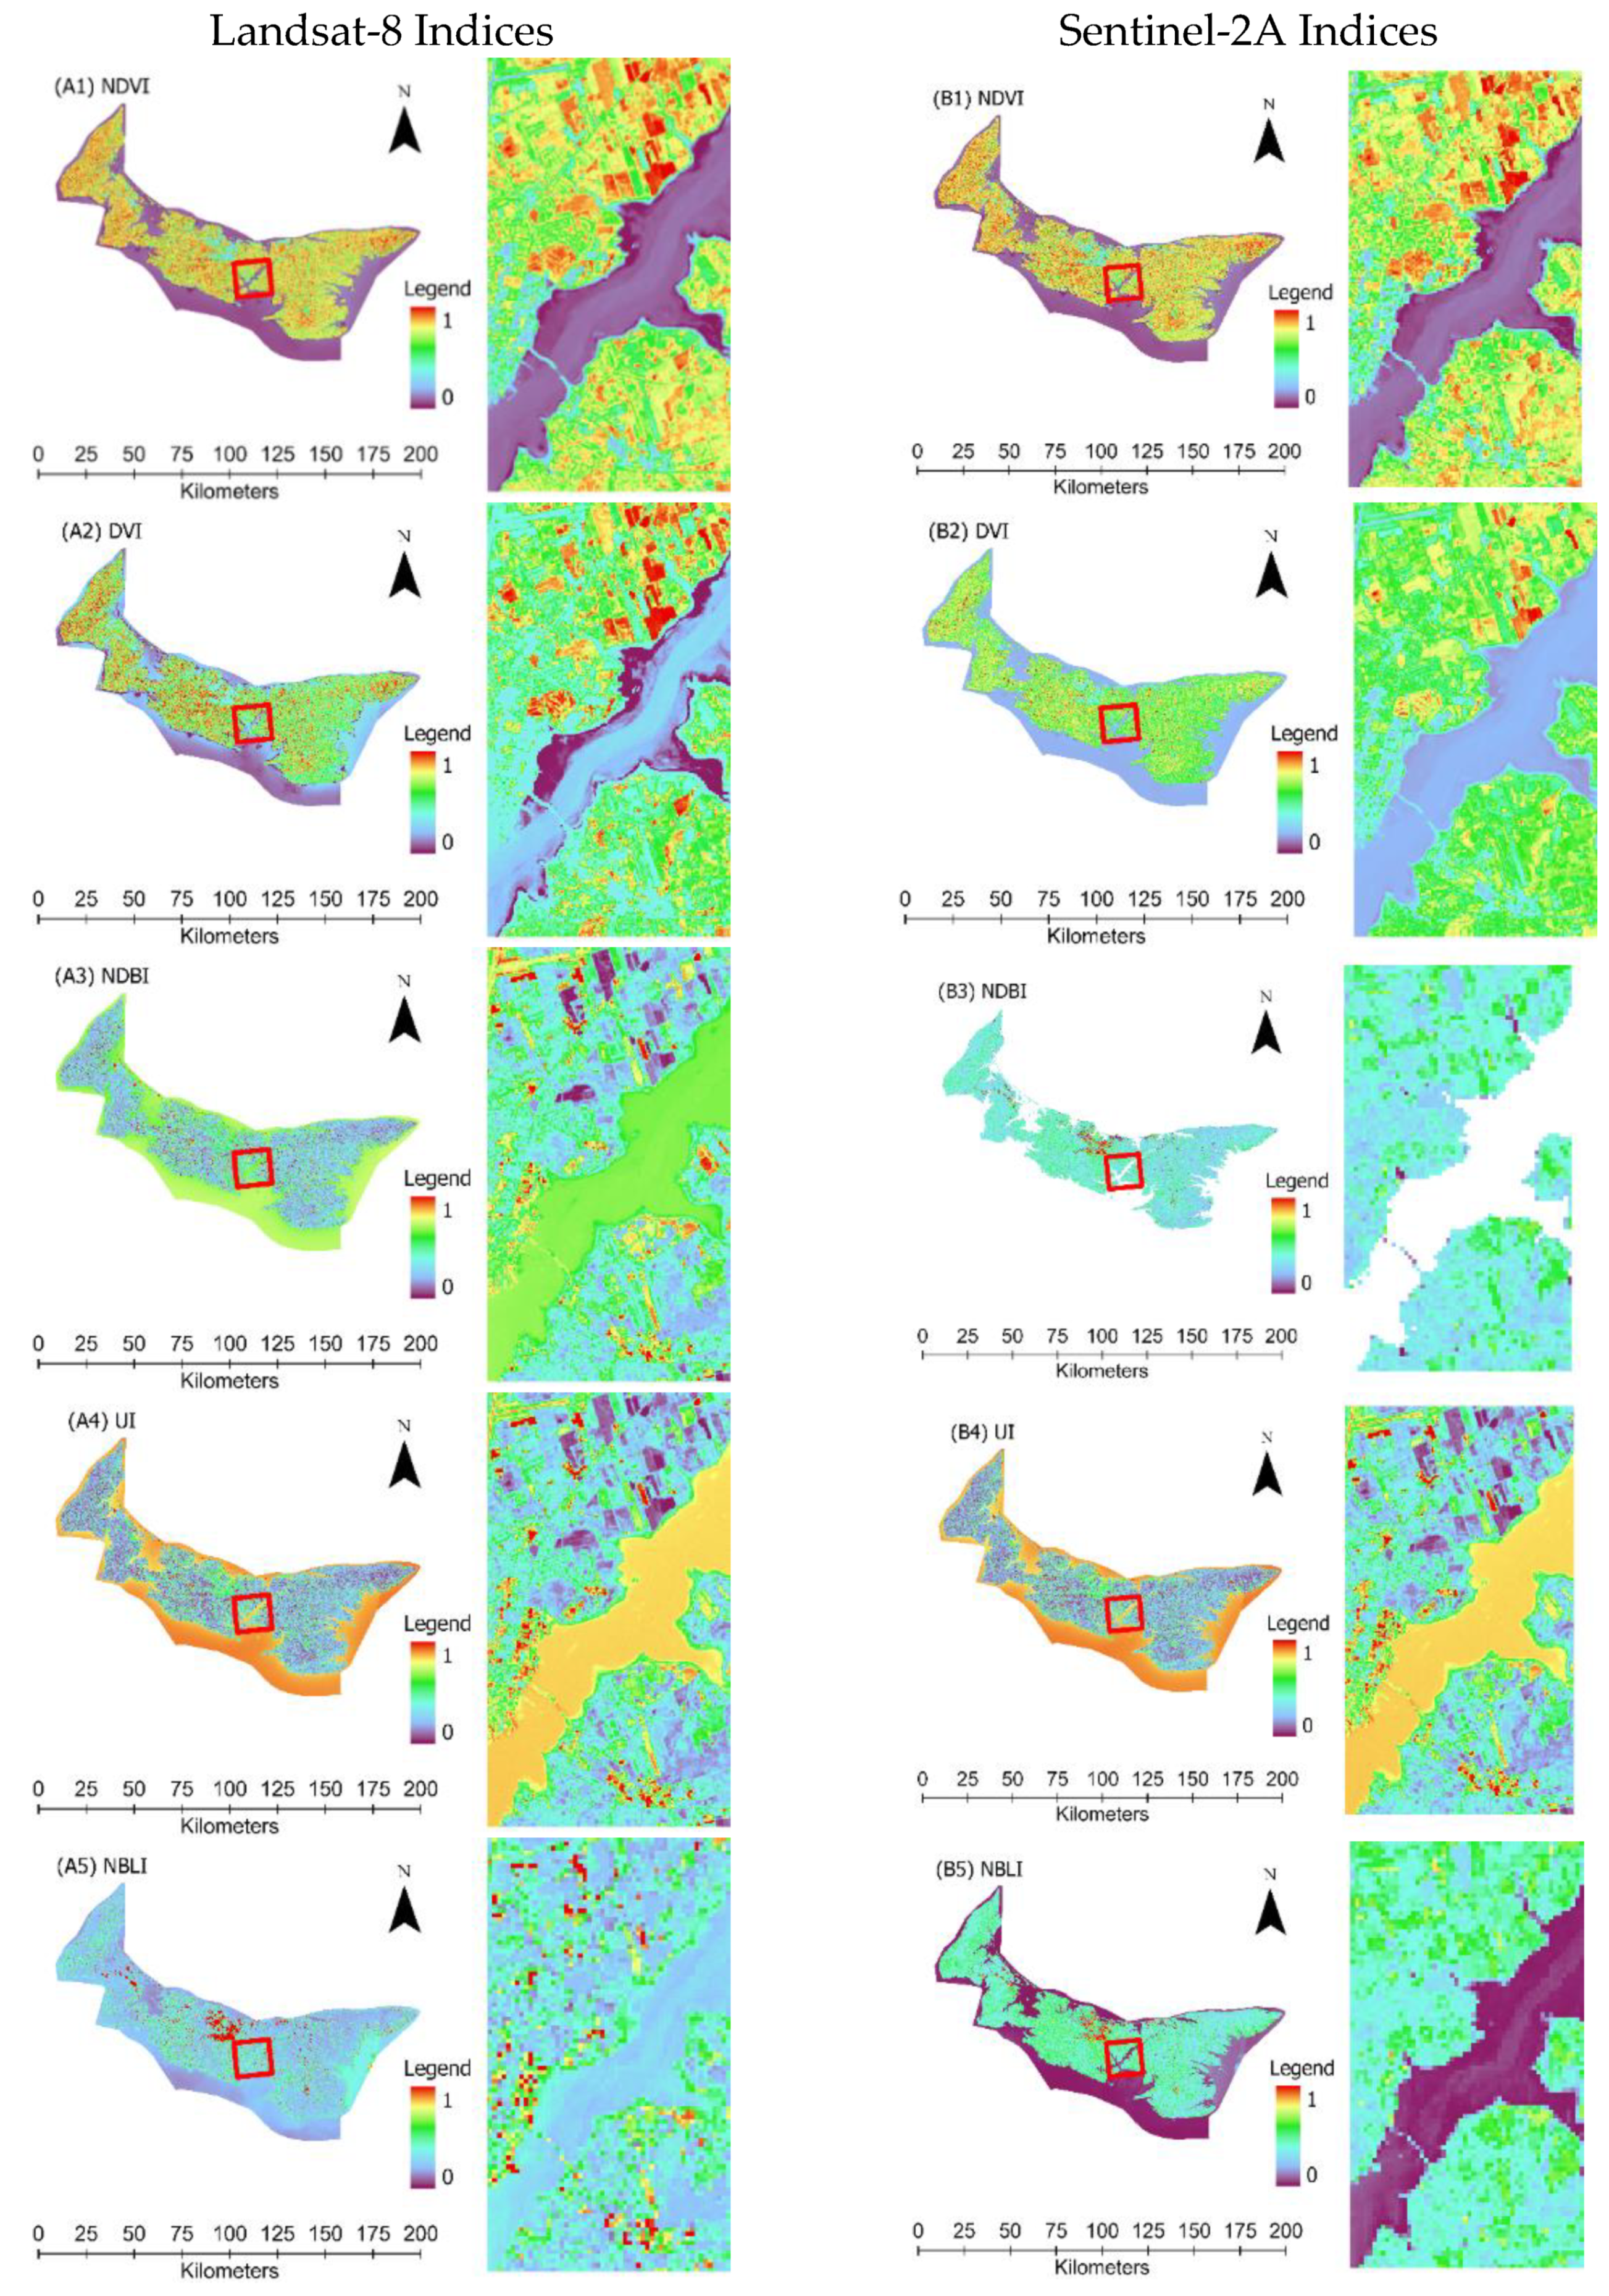
2.4. Remote Sensing Indices and LULC Classes

Vegetation indices such as normalized difference vegetation index (NDVI) or soil adjusted vegetation index (SAVI) can be obtained from remotely sensed data. Vegetation indices are simple to generate from multispectral satellite imagery and effective algorithms for evaluating vegetation cover quantitatively and qualitatively. Similarly, an urban index, such as a normalized built-up index (NDBI), can be used to identify urban features on satellite images. In the hands of trained geospatial analysts, remote sensing indices can highlight different types of land cover and can be particularly useful for training classifiers used in LULC maps.
In this study, the difference vegetation index (DVI) and NDVI were used to identify vegetation cover [7]. Since agriculture and forest have similar values in both indices, the barren lands were identified using the normalized bare land index (NBLI) index to overcome this issue (Figure 2A1–A5,B1–B5). The NBLI index is effective in highlighting soil composition and is helpful to differentiate agriculture from forested areas Figure 2A5,B5 [11]. Urban features were identified with the NDBI and built-up index (UI). These indices were used because they distinguish barren land from urban features [11]. Results of the NDBI index presented in Figure 2A3,B3 showed that some pixels representing urban areas on the Landsat-8 and Sentinel images were mixed with bare land features. This issue was resolved by using the UI index, since urban features can be identified with more precision in Figure 2A4,B4. The minimum and maximum values of vegetation indices between 0 and 1 are shown in the legend in Figure 2. To construct the training samples for LULC mapping, maximum value pixels were used in each index.
Remote sensing indices presented in Table 2 were used to delineate the LULC classes. Four LULC classes, namely agriculture, urban, barren land, and forest, were identified in the study area (Table 3). These indices were used for extracting the training samples for LULC classification in ArcGIS Pro. A total of 2000 training samples, 500 samples for each class, were created to train the classifier. The sample size was determined to be large enough since it adequately covers the entire study area without exhausting the classifier computing power.

2.5. Machine Learning Algorithm

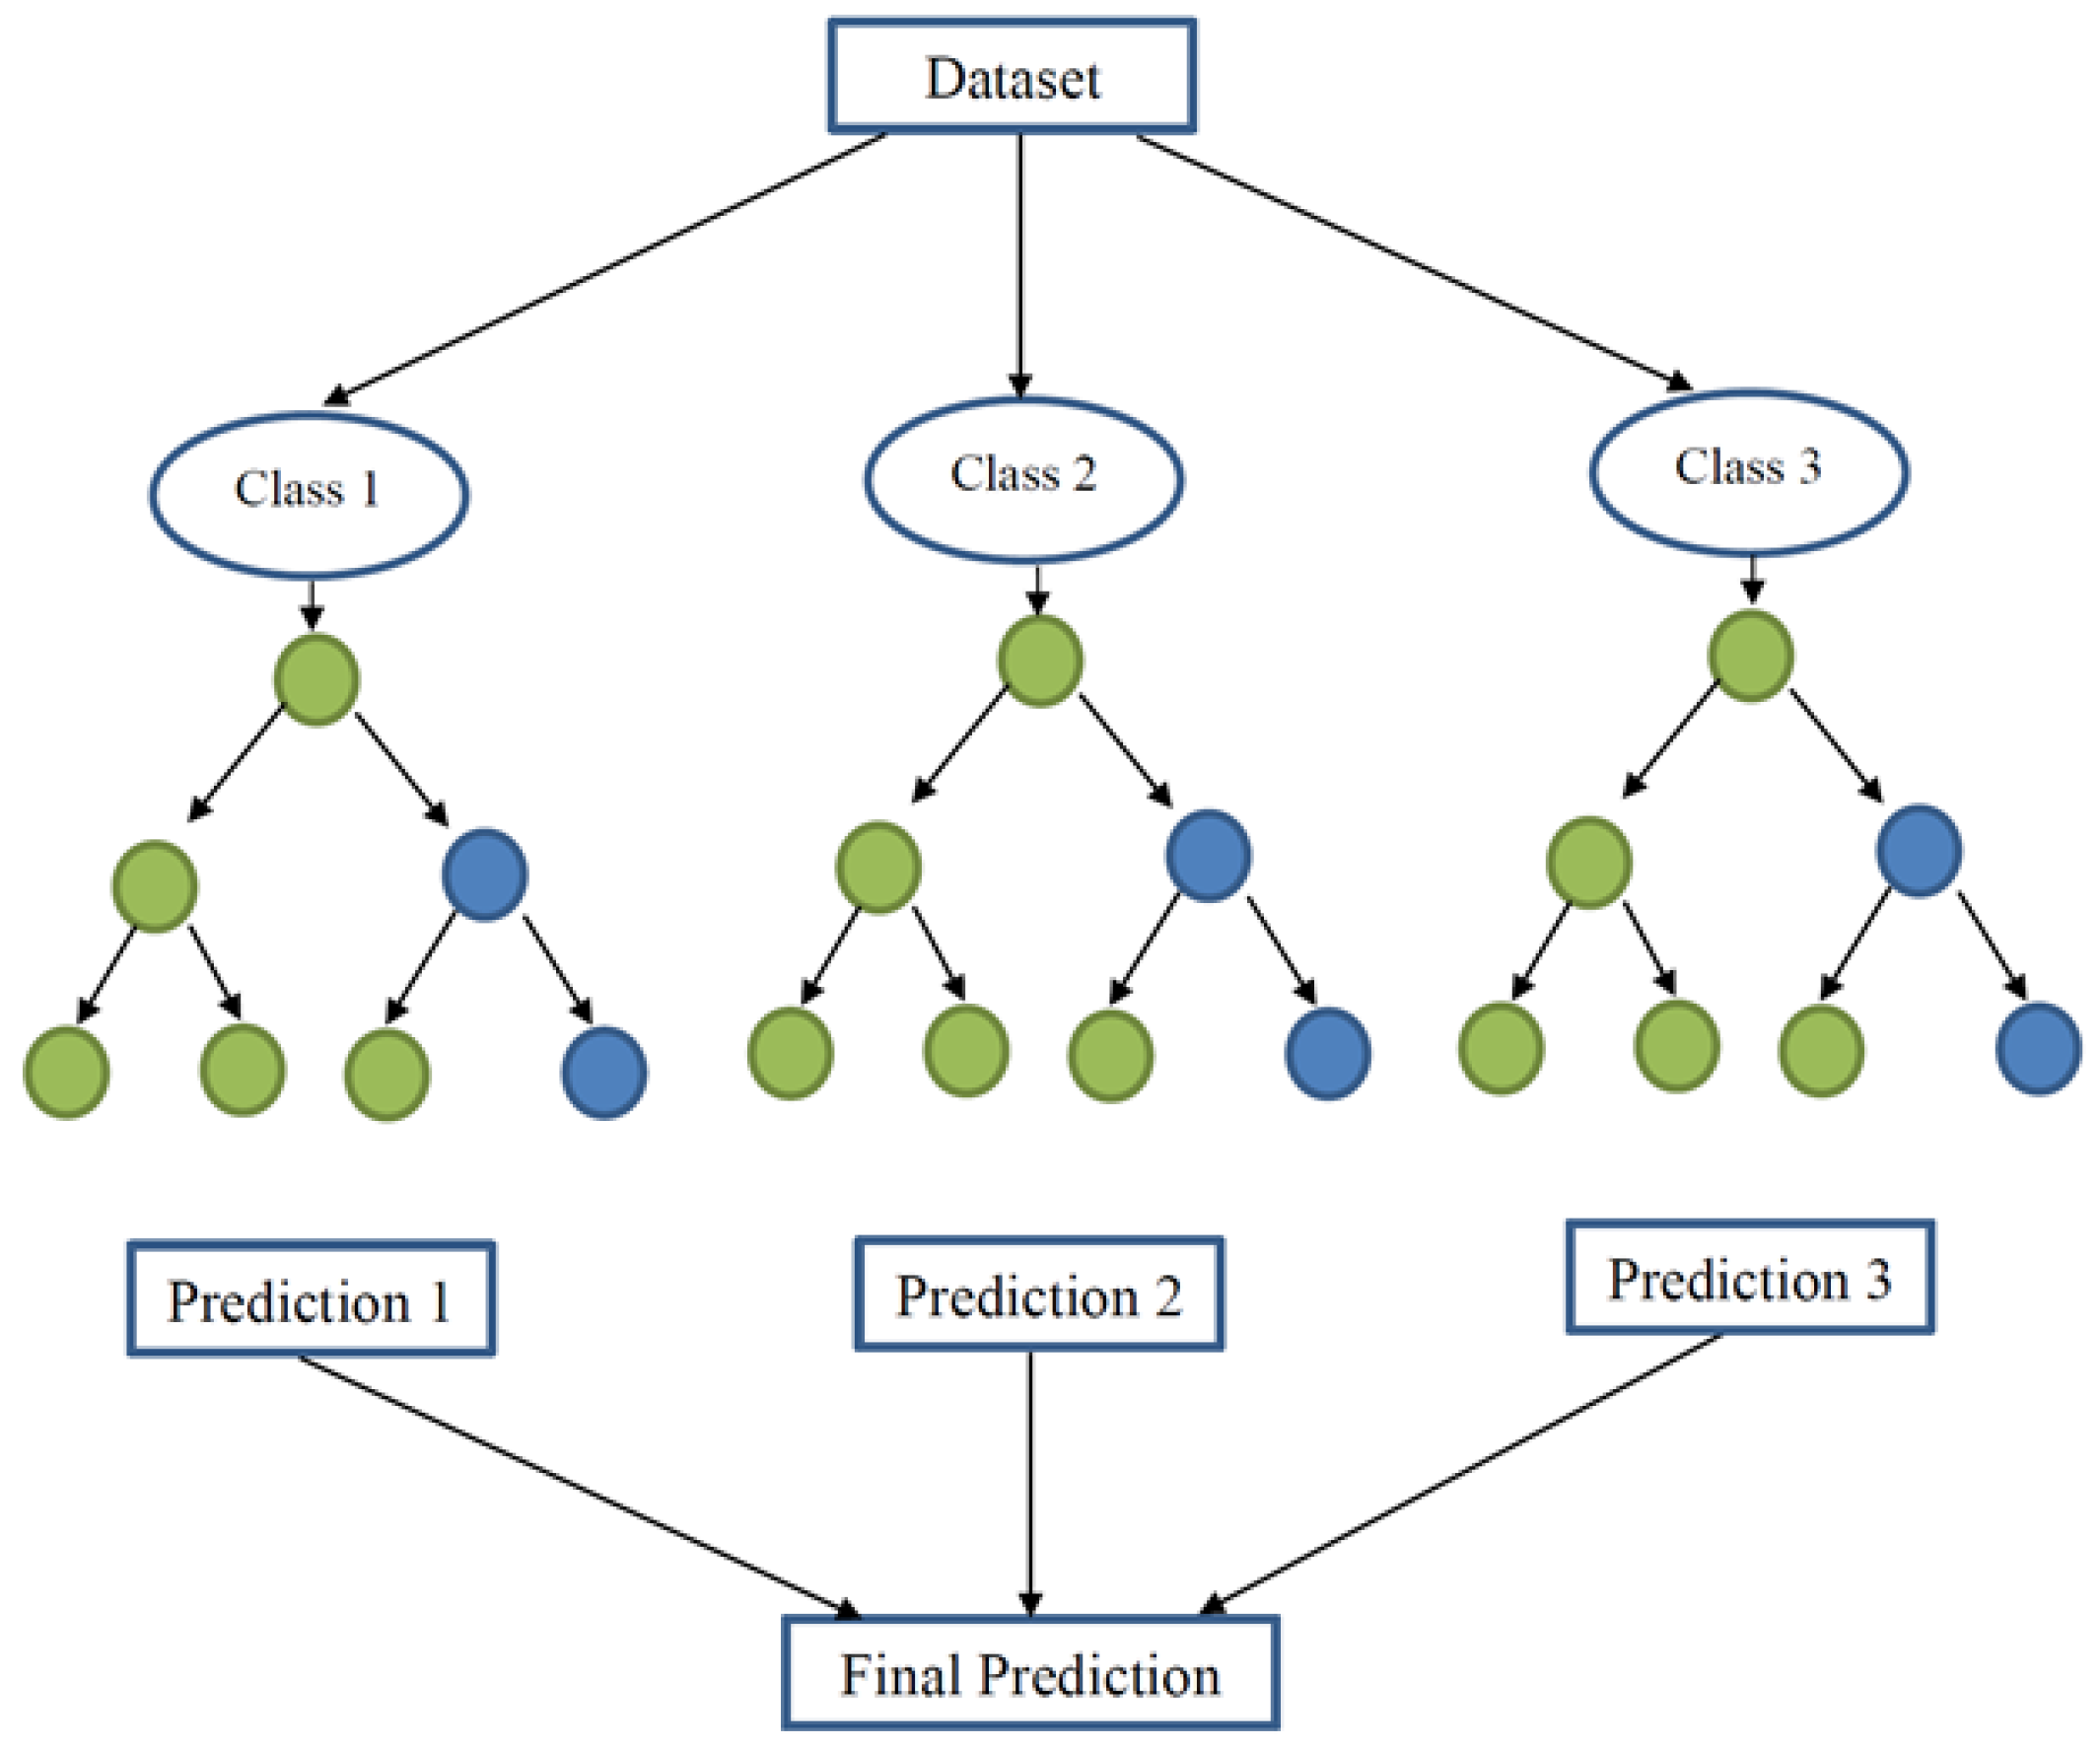
2.5.1. Random Forest Classifier

The RF is a combination of tree predictors with each tree depending on an independently sampled random vector value with a similar distribution in all trees (Figure 3) [40]. Boosting and bagging are two ensemble methods capable of squeezing additional predictive accuracy out of classification algorithms. Bagging algorithms are used to reduce the complexity of the models that overfit the training data, while the boosting algorithm increases models’ complexity. The training samples, which are not used in the training sample, were included in the evaluation and were referred to as ‘out of bag’ samples [4]. In addition, the RF classifier is easy to use since it only uses two parameters (e.g., number of variables at each node and number of trees), which is not sensitive to the parameter value [41]. The number of trees and predictors in RF classification are vital parameters to achieving the highest accuracy possible. For assessing the accuracy of the current RF output, these parameters were set at 50 for the number of trees, and the maximum number of tree depth and samples per class were set as 30 and 500, respectively.

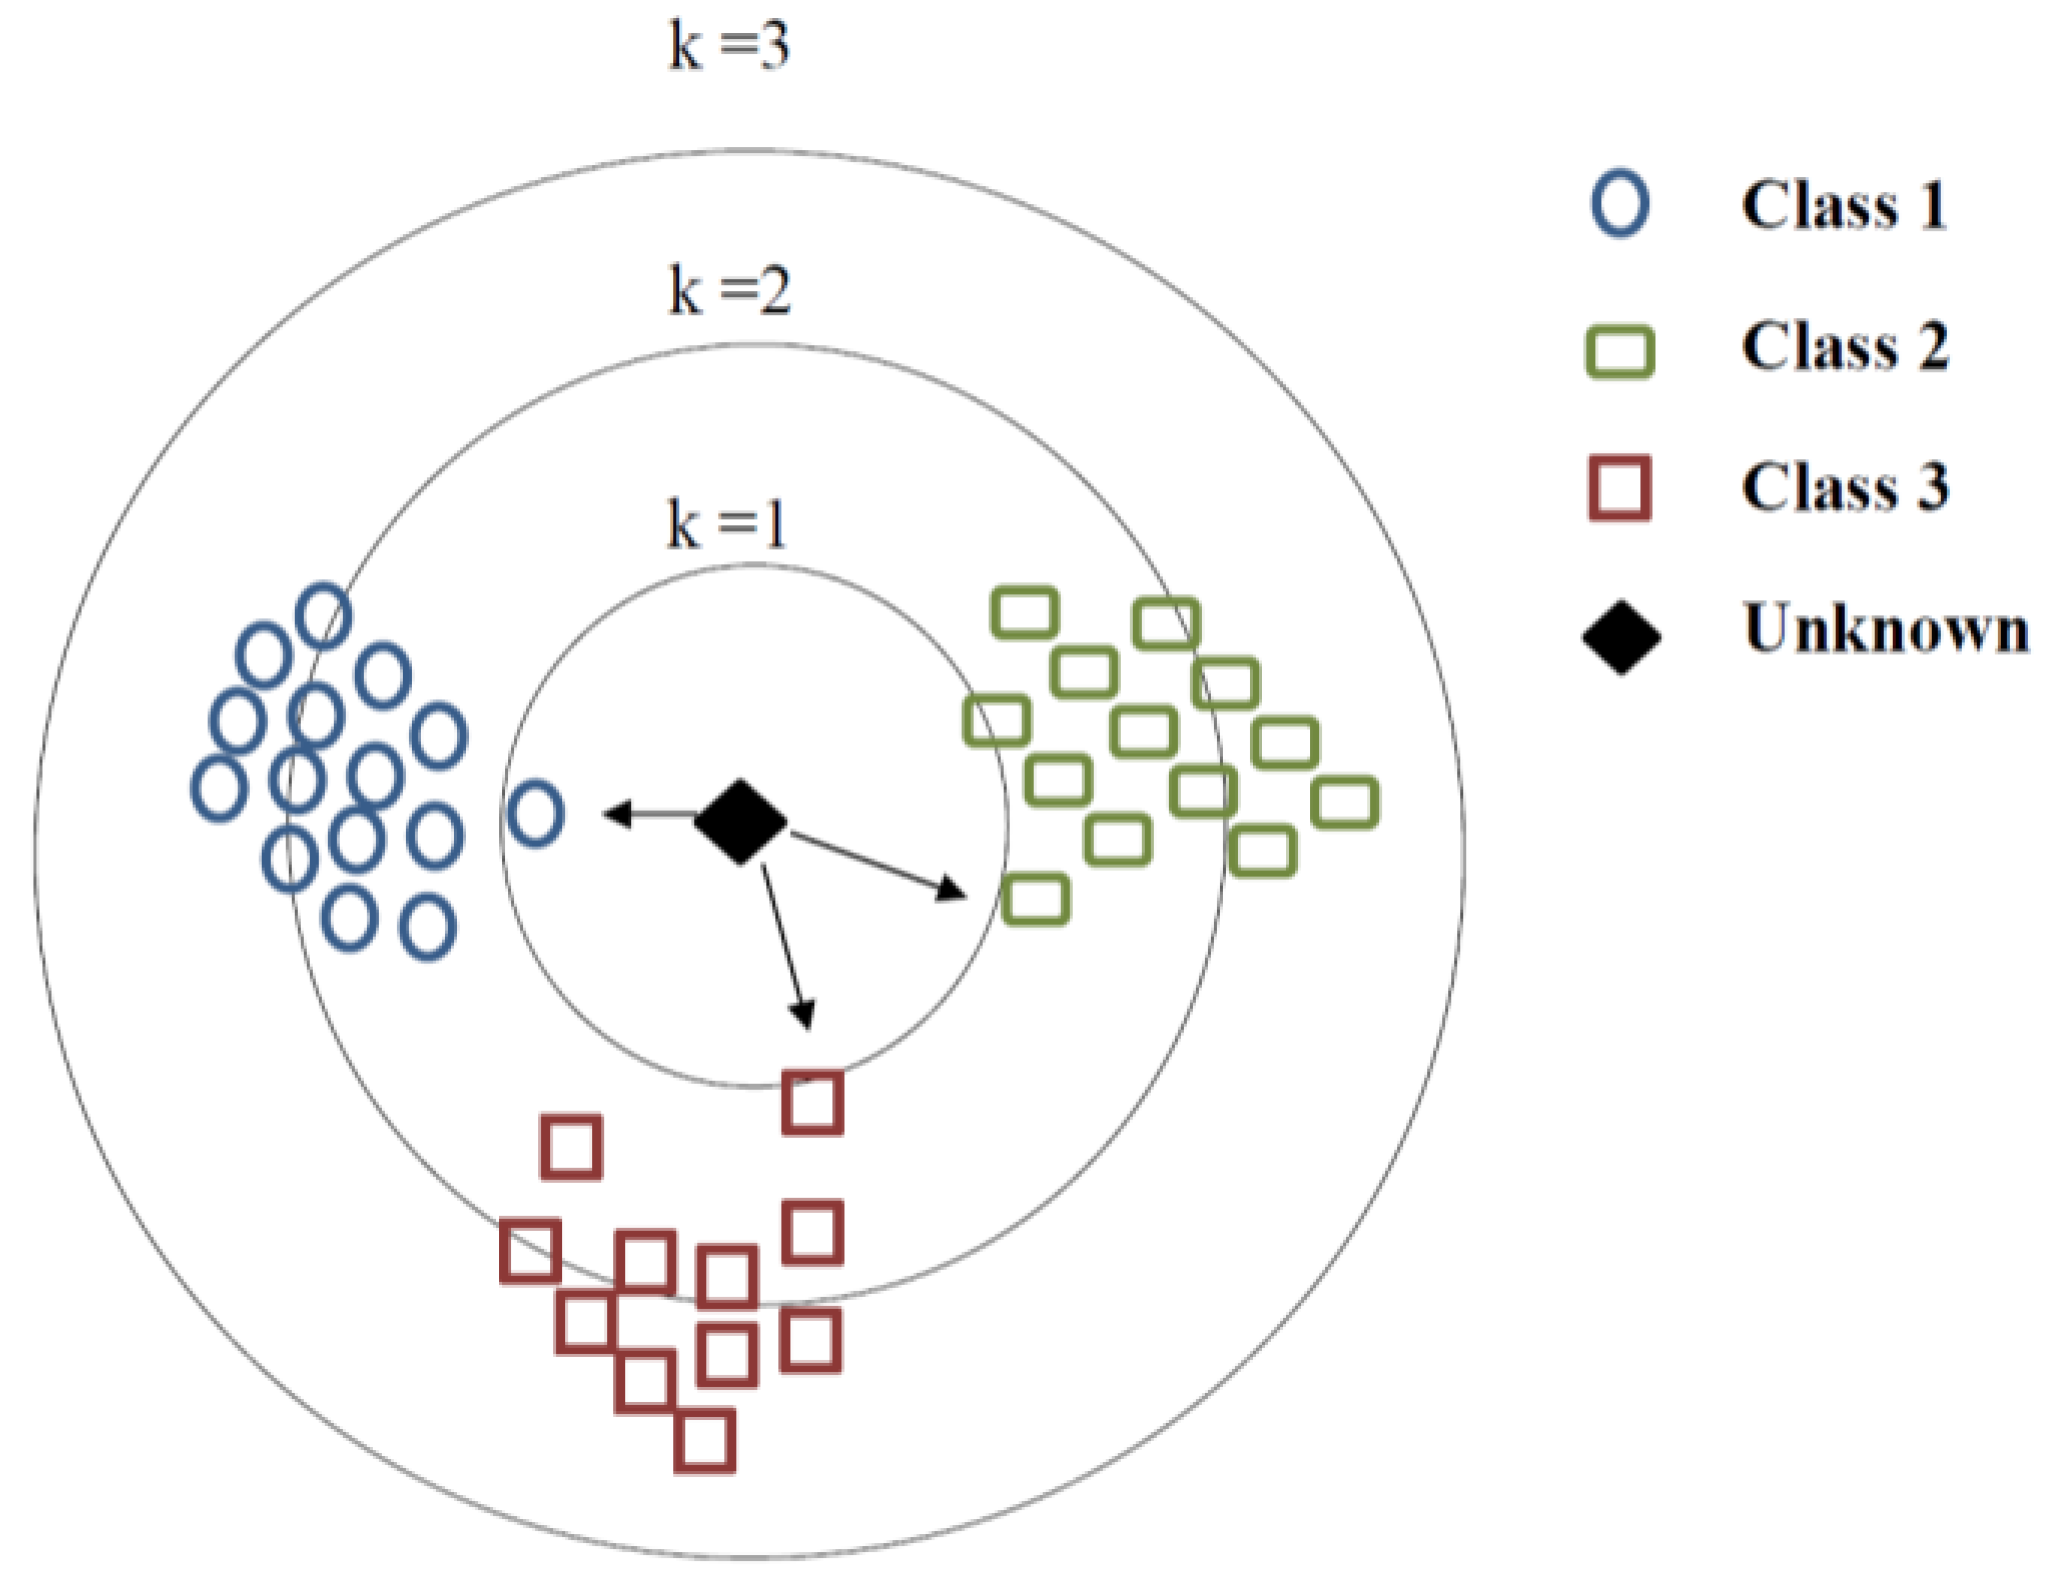
2.5.2. K-Nearest Neighbour

The K-NN is a supervised ML algorithm that can be used to solve classification and regression problems. It was first discussed in an unpublished report by [42], followed by more detailed K-NN rules published by [43]. It categorizes the objects based on the nearest neighbour class. The major deciding factor in the classification task is the number of neighbours (k) used to classify an object (Figure 4). Small k values indicate relatively inaccurate results, while higher k values indicate a more credible result [44]. Through trial and error, the optimal k value was found and set to k = 20.

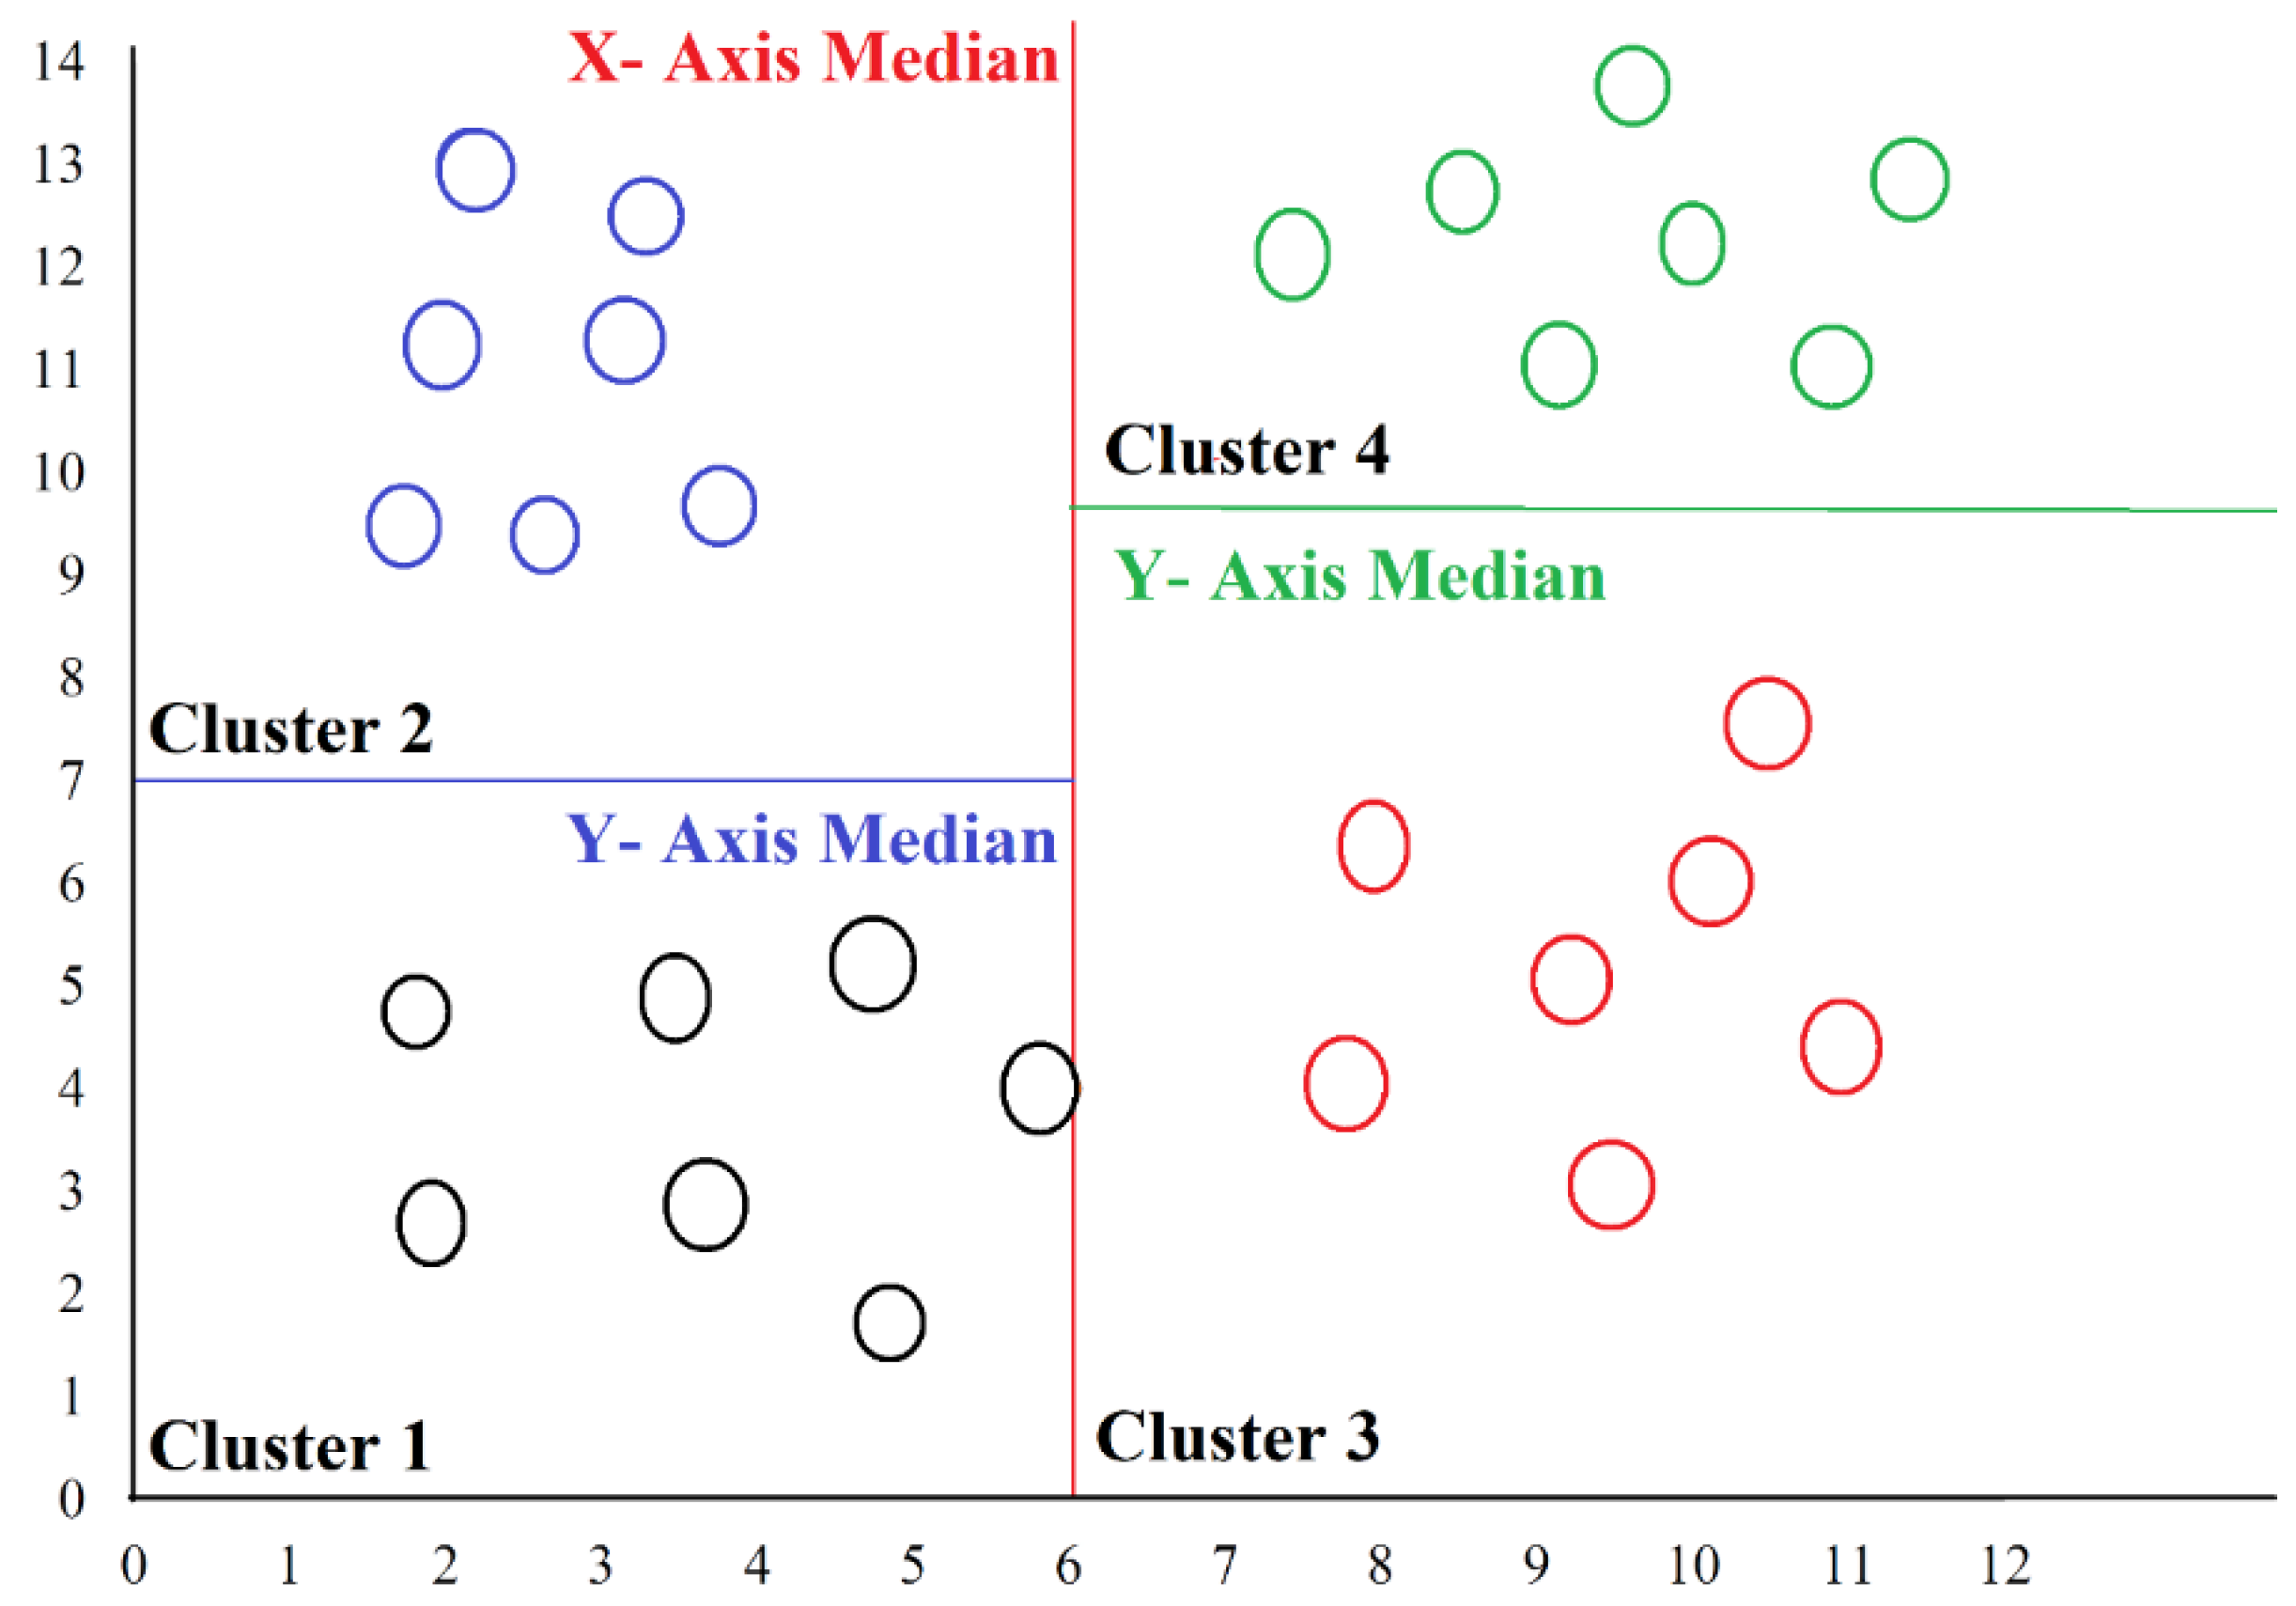
2.5.3. K Dimensional-Tree

KD-Tree is the most common binary algorithm used for the nearest neighbour algorithm family. In KD-Tree classifiers, the clusters are developed based on the median of the x and y axes (Figure 5). KD-Tree categorizes points based on the projections in lower dimensions [45]. For lower-dimensional datasets, the KD-Tree is designed to perform better compared to other algorithms such as ball–tree [46]. For an accuracy comparison of KD-Tree on both satellites, the number of training samples was set at 2000, and the number of neighbours was set at 20. Similar to the k value in the K-NN algorithm, the optimal number of neighbours was determined through trial and error.

2.6. Ground Truth Data for Validation and Model Evaluation Criteria

Five sites on PEI were selected to collect ground truth data. Using a Real-Time Kinematic (RTK) GPS with sub-meter accuracy, a total of 200 validation points were collected at each site. These points were equally distributed in each class, meaning that 50 points were collected per class at each site. The same ground truth data were used to validate LULC maps generated with Sentinel-2A and Landsat-8 imagery.
Several statistical indicators were used to assess the accuracy of the models. The overall accuracy of the models was used to describe the correct proportion of mapped pixels. The overall accuracy considers that 100% of all the classified reference sites are mapped accurately [47]. The overall accuracy was calculated using the following formula:
Ovrall   Accracy   ( % ) = Number   of   correctly   classified   pixels Total   number   of   referenced   site   pixels × 100
Similarly, each LULC class’s accuracy was determined using producer/user accuracies. Producer/user accuracy determines the real feature on the ground surface correctly shown on the classified map [47]. The producer and user accuracy were calculated using the following formula:
Producer / User   Accuracy   ( % ) = Correctly   classified   pixels   in   one   category   Total   classified   pixels   in   all   categories × 100
The kappa coefficient is another statistical indicator to evaluate classification accuracy. Kappa evaluates how well the classification has performed compared to the randomly assigned value. Its values range from -1 to 1, with the lowest value indicating that the classification is not better than a random classification, while a value close to a positive one indicates that the classification is significantly better than the random classification [48]. The kappa coefficient was calculated using the following formula:
Kappa   Cofficient = ( T S T C S ) ( C o l u m n   t o t a l R o w   T o t a l )   T S 2 ( C o l u m n   t o t a l R o w   T o t a l )   × 100
where TS is the total number of samples, TCS is the total number of classified samples, and column sum and row sum represent the total number of classified pixels for each class in each column and row, respectively.

3. Results

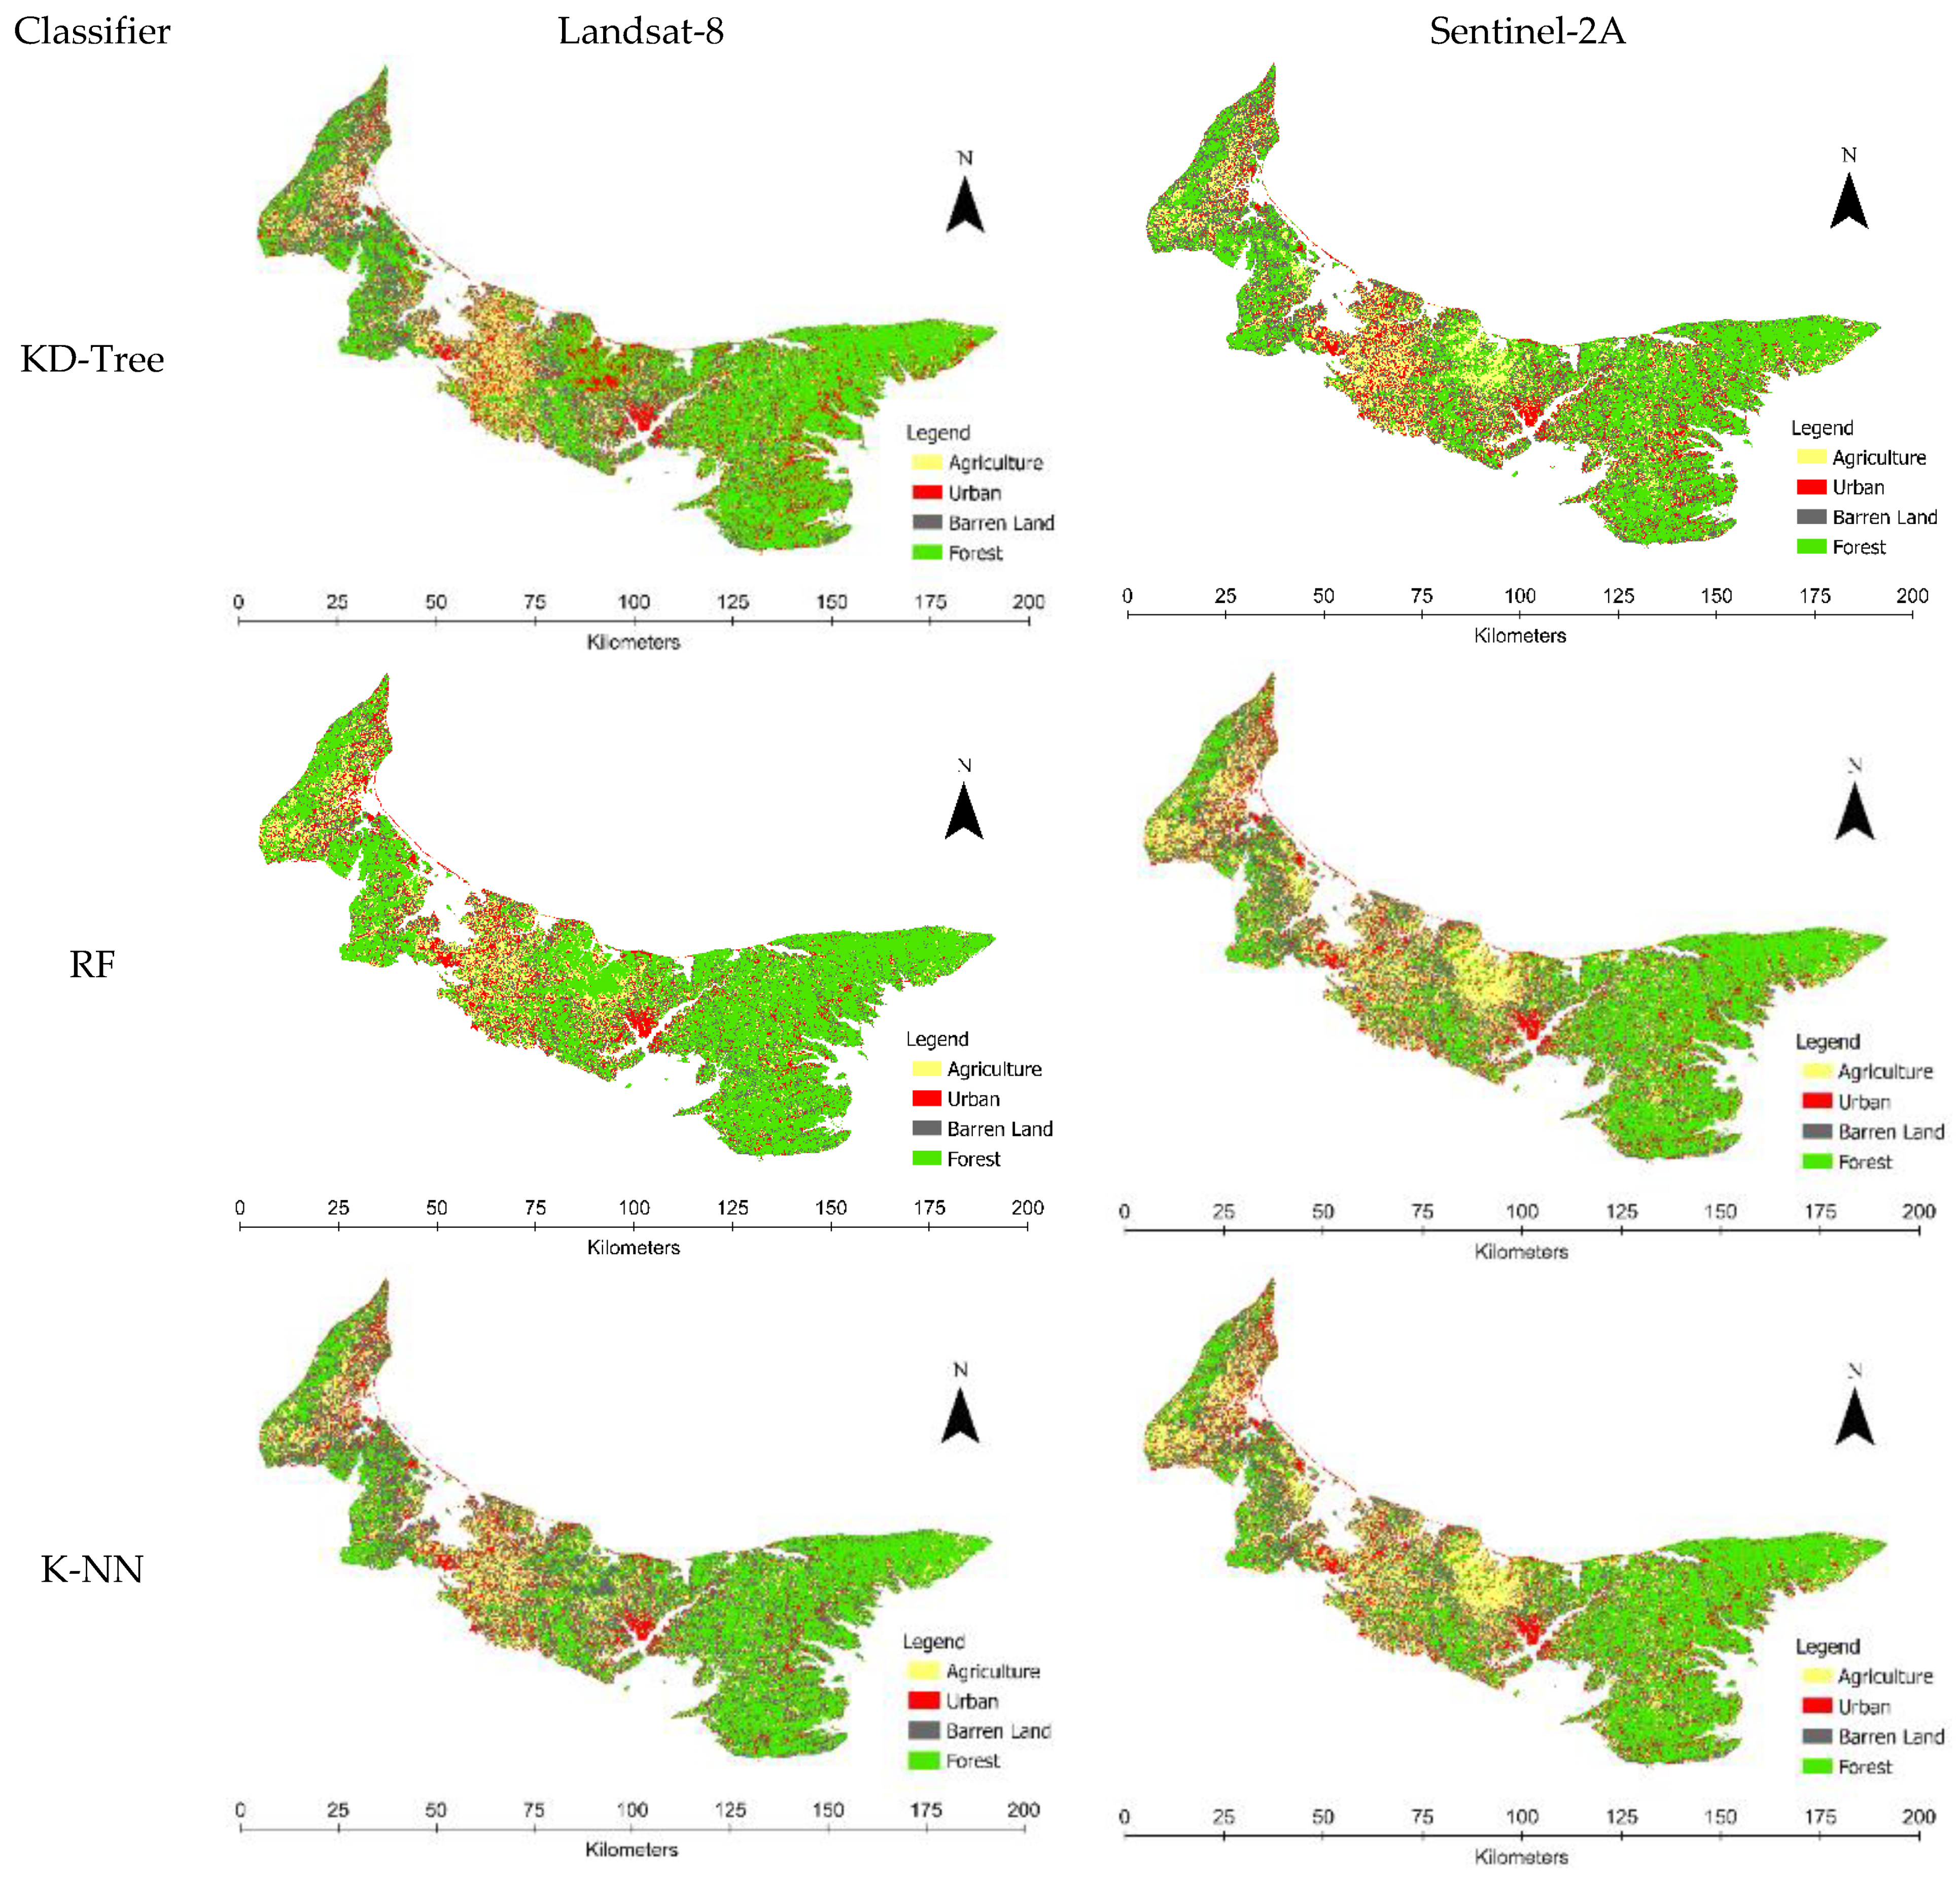
3.1. Land Use and Land Cover Mapping Results

In the prepared LULC maps (Figure 6), the yellow colour represents the agricultural area, the green colour represents the forest area, battleship grey represents barren land, and red represents the urban area.
From the Landsat-8 imagery, the KD-Tree classifier detected the true positives for the agriculture class, e.g., 45 out of 50 with a user accuracy of 90% and a producer accuracy of 79% (Figure 7A and Table 4). For Sentinel-2A imagery, the highest true positives were classified by the K-NN algorithm, e.g., 47 out of 50 for the agriculture class. The RF and K-NN in Landsat-8 and KD-Tree and RF in Sentinel-2A recorded true positives for agriculture classes ranging within 38–45 out of 50 (Figure 7A,D). Interestingly, the highest and lowest true positives for the agriculture class were recorded by the K-NN algorithm. This implies that the performance of classification may be improved by using a finer resolution and more refined imagery [49,50].
For the barren land class, the highest true positives were recorded by the KD-Tree classifier with the Sentinel-2A imagery, i.e., 49 out of 50 [51] with a user accuracy of 98% and a producer accuracy of 80% (Figure 7D and Table 4). However, the performance of the KD-Tree classifier with Landsat-8 imagery for the barren land class recorded relatively lower true positives, e.g., 42 out of 50. Similarly, the highest true positives for the urban forest class were recorded by the random forest classifier with Sentinel-2A imagery. However, a relatively lower number of true positives was recorded for the forest class with Landsat-8 imagery, e.g., 32, 39, and 36 for the KD-Tree, RF, and K-NN classifiers, respectively (Figure 7A–C). For the urban class, the highest average true positives were recorded for both satellite images. For the urban class, the RF algorithm with the Sentinel-2A satellite achieved the highest possible user accuracy (100%) compared to all other satellite–algorithm comparisons (Table 4). These results concur with the findings reported in the literature that mention that the resolution, image characteristics, classification algorithms, and the need of the user affect the classification accuracy of LULC mapping [49,51].

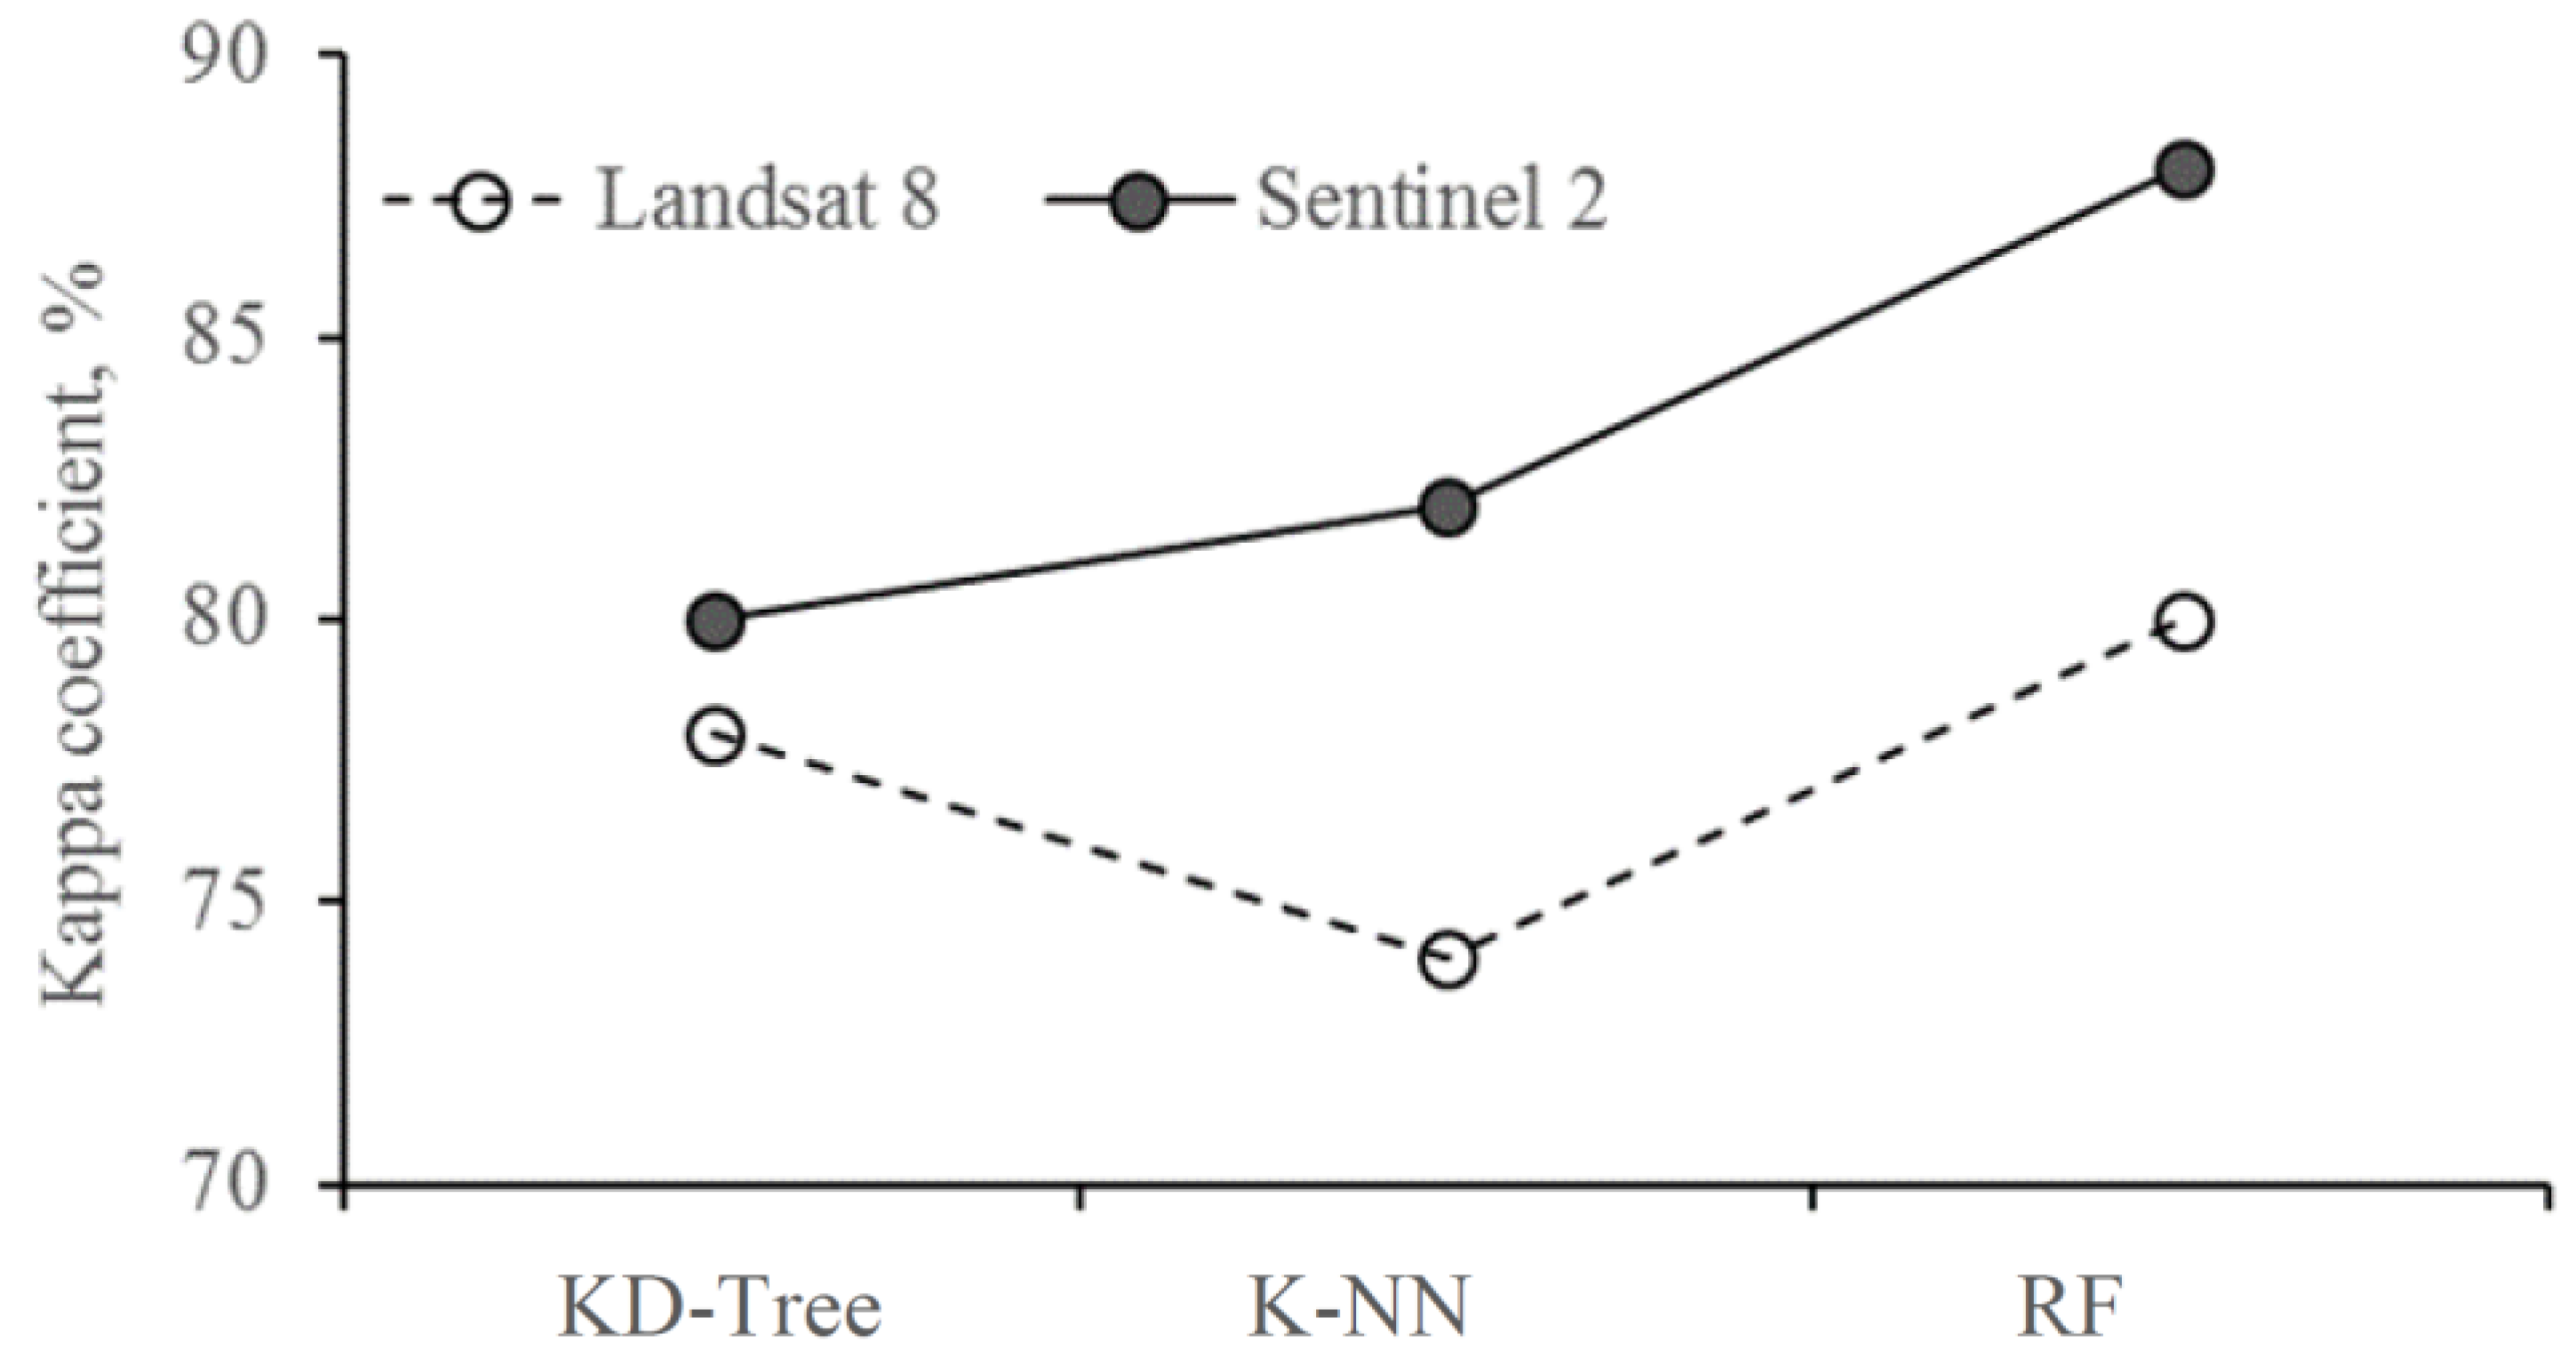
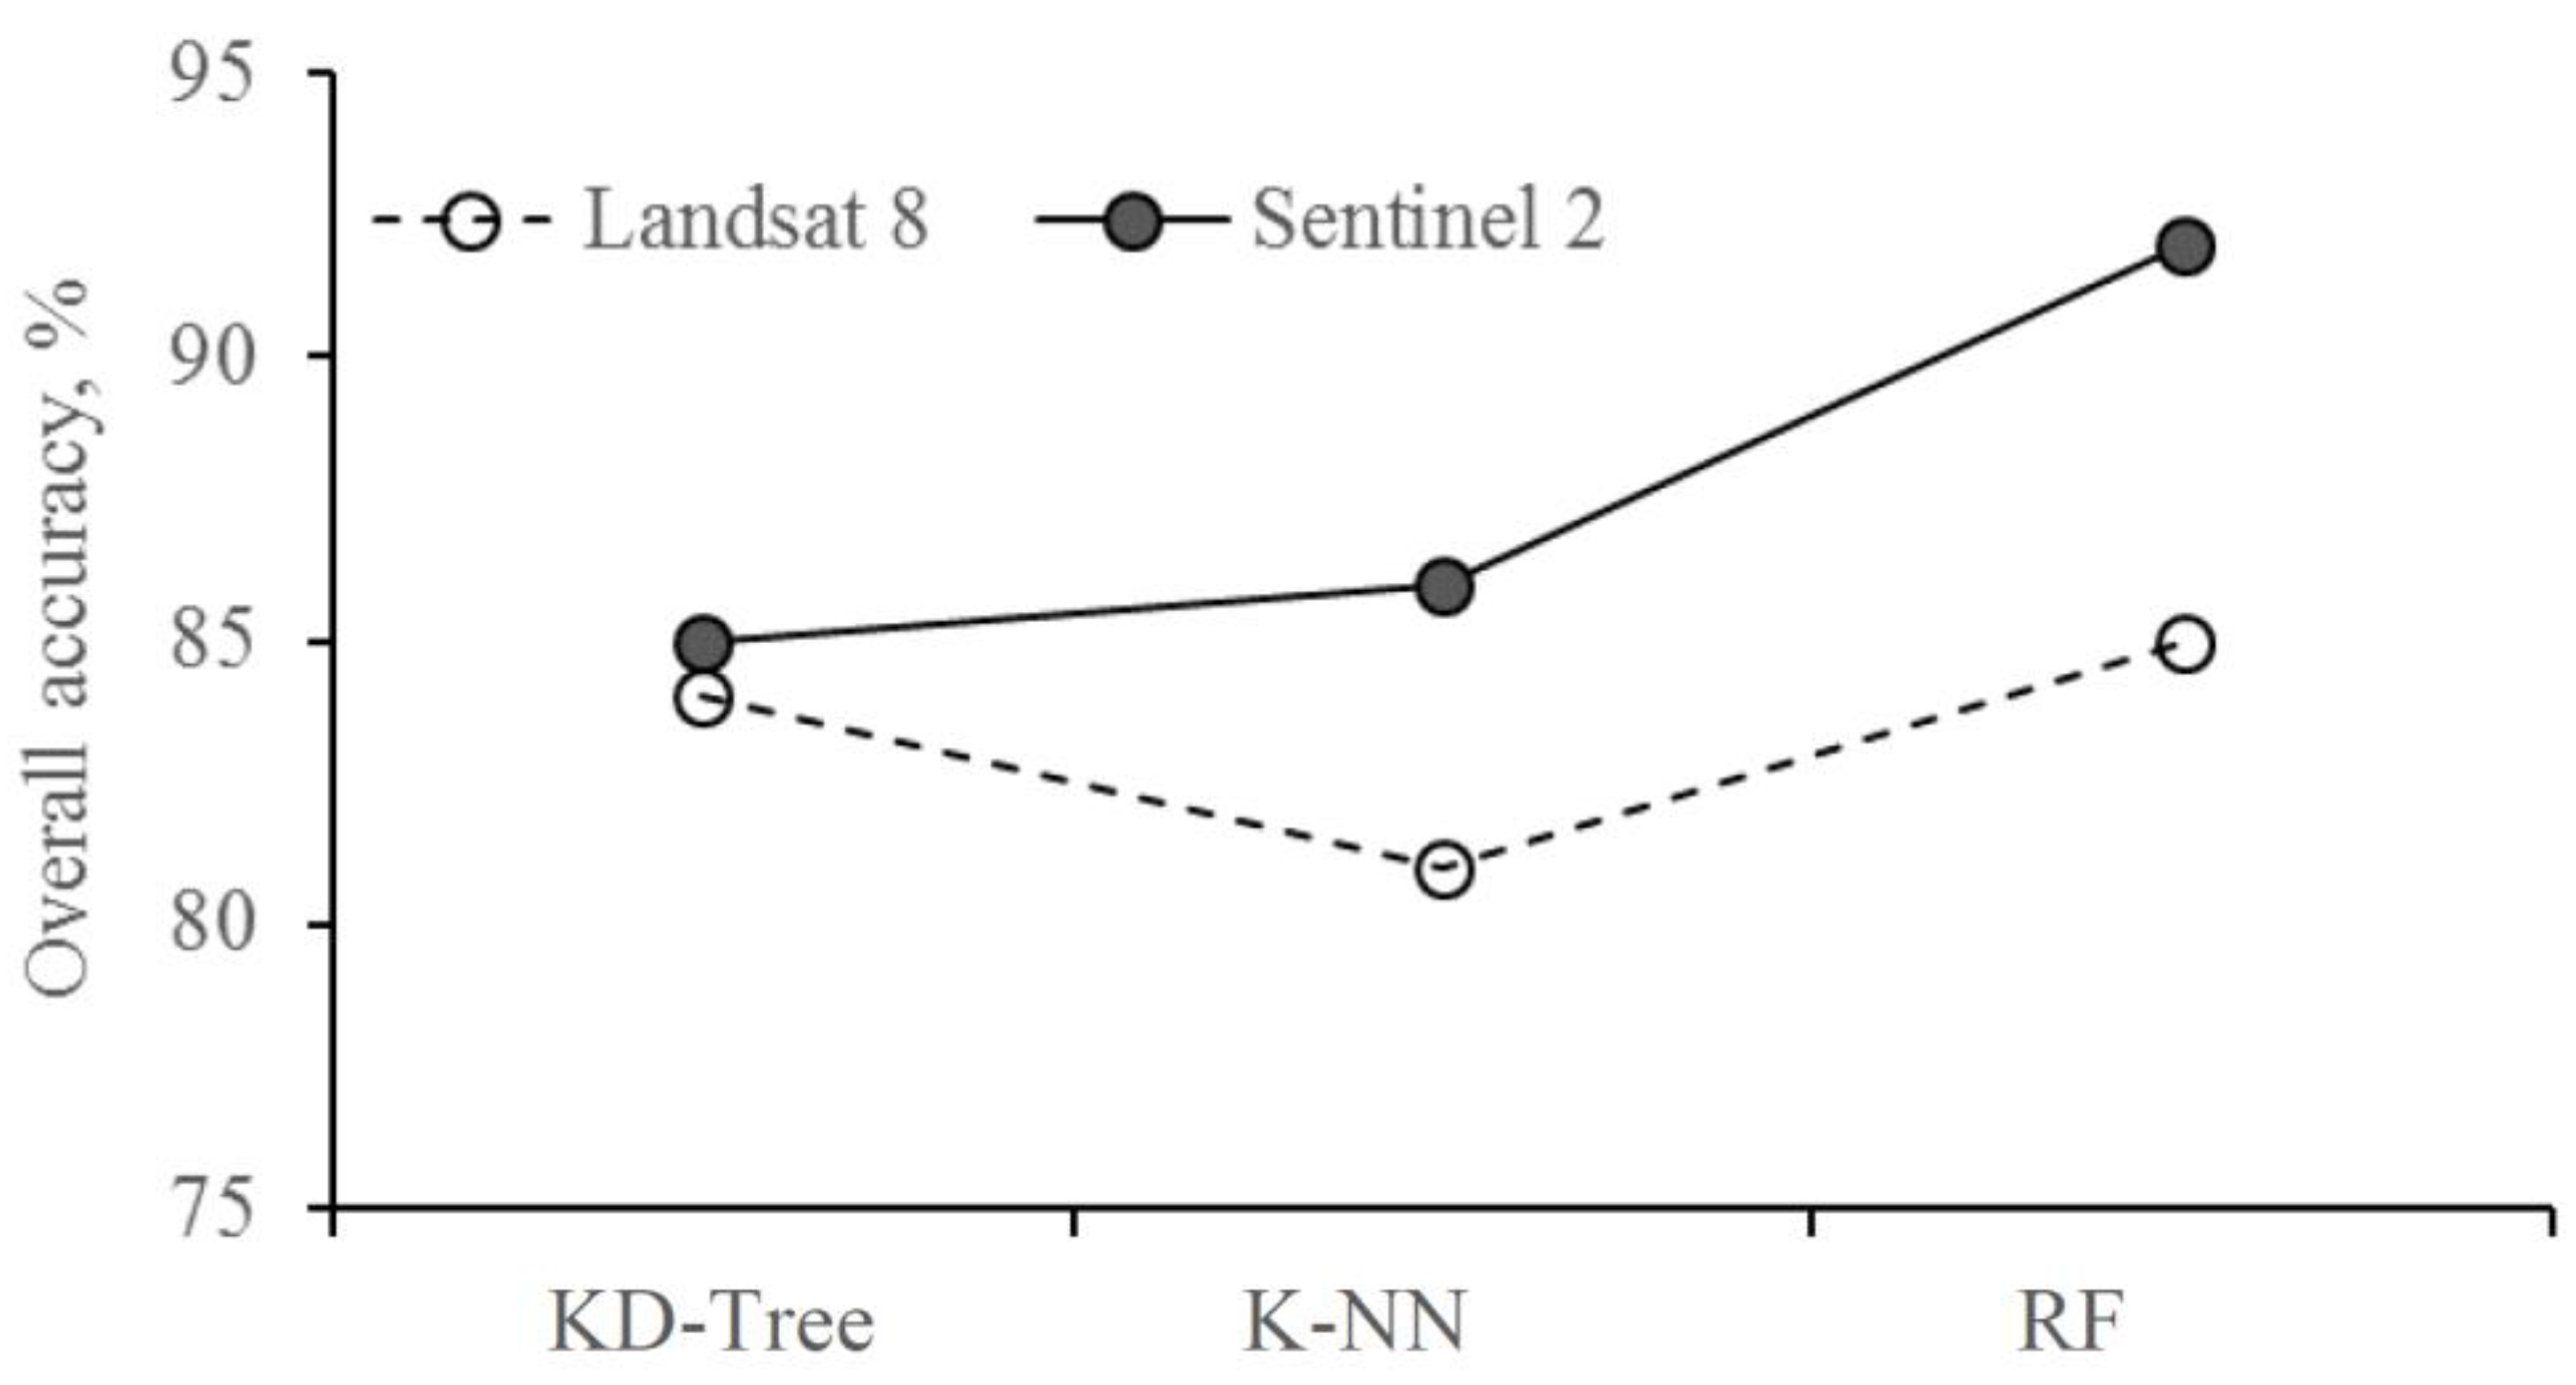
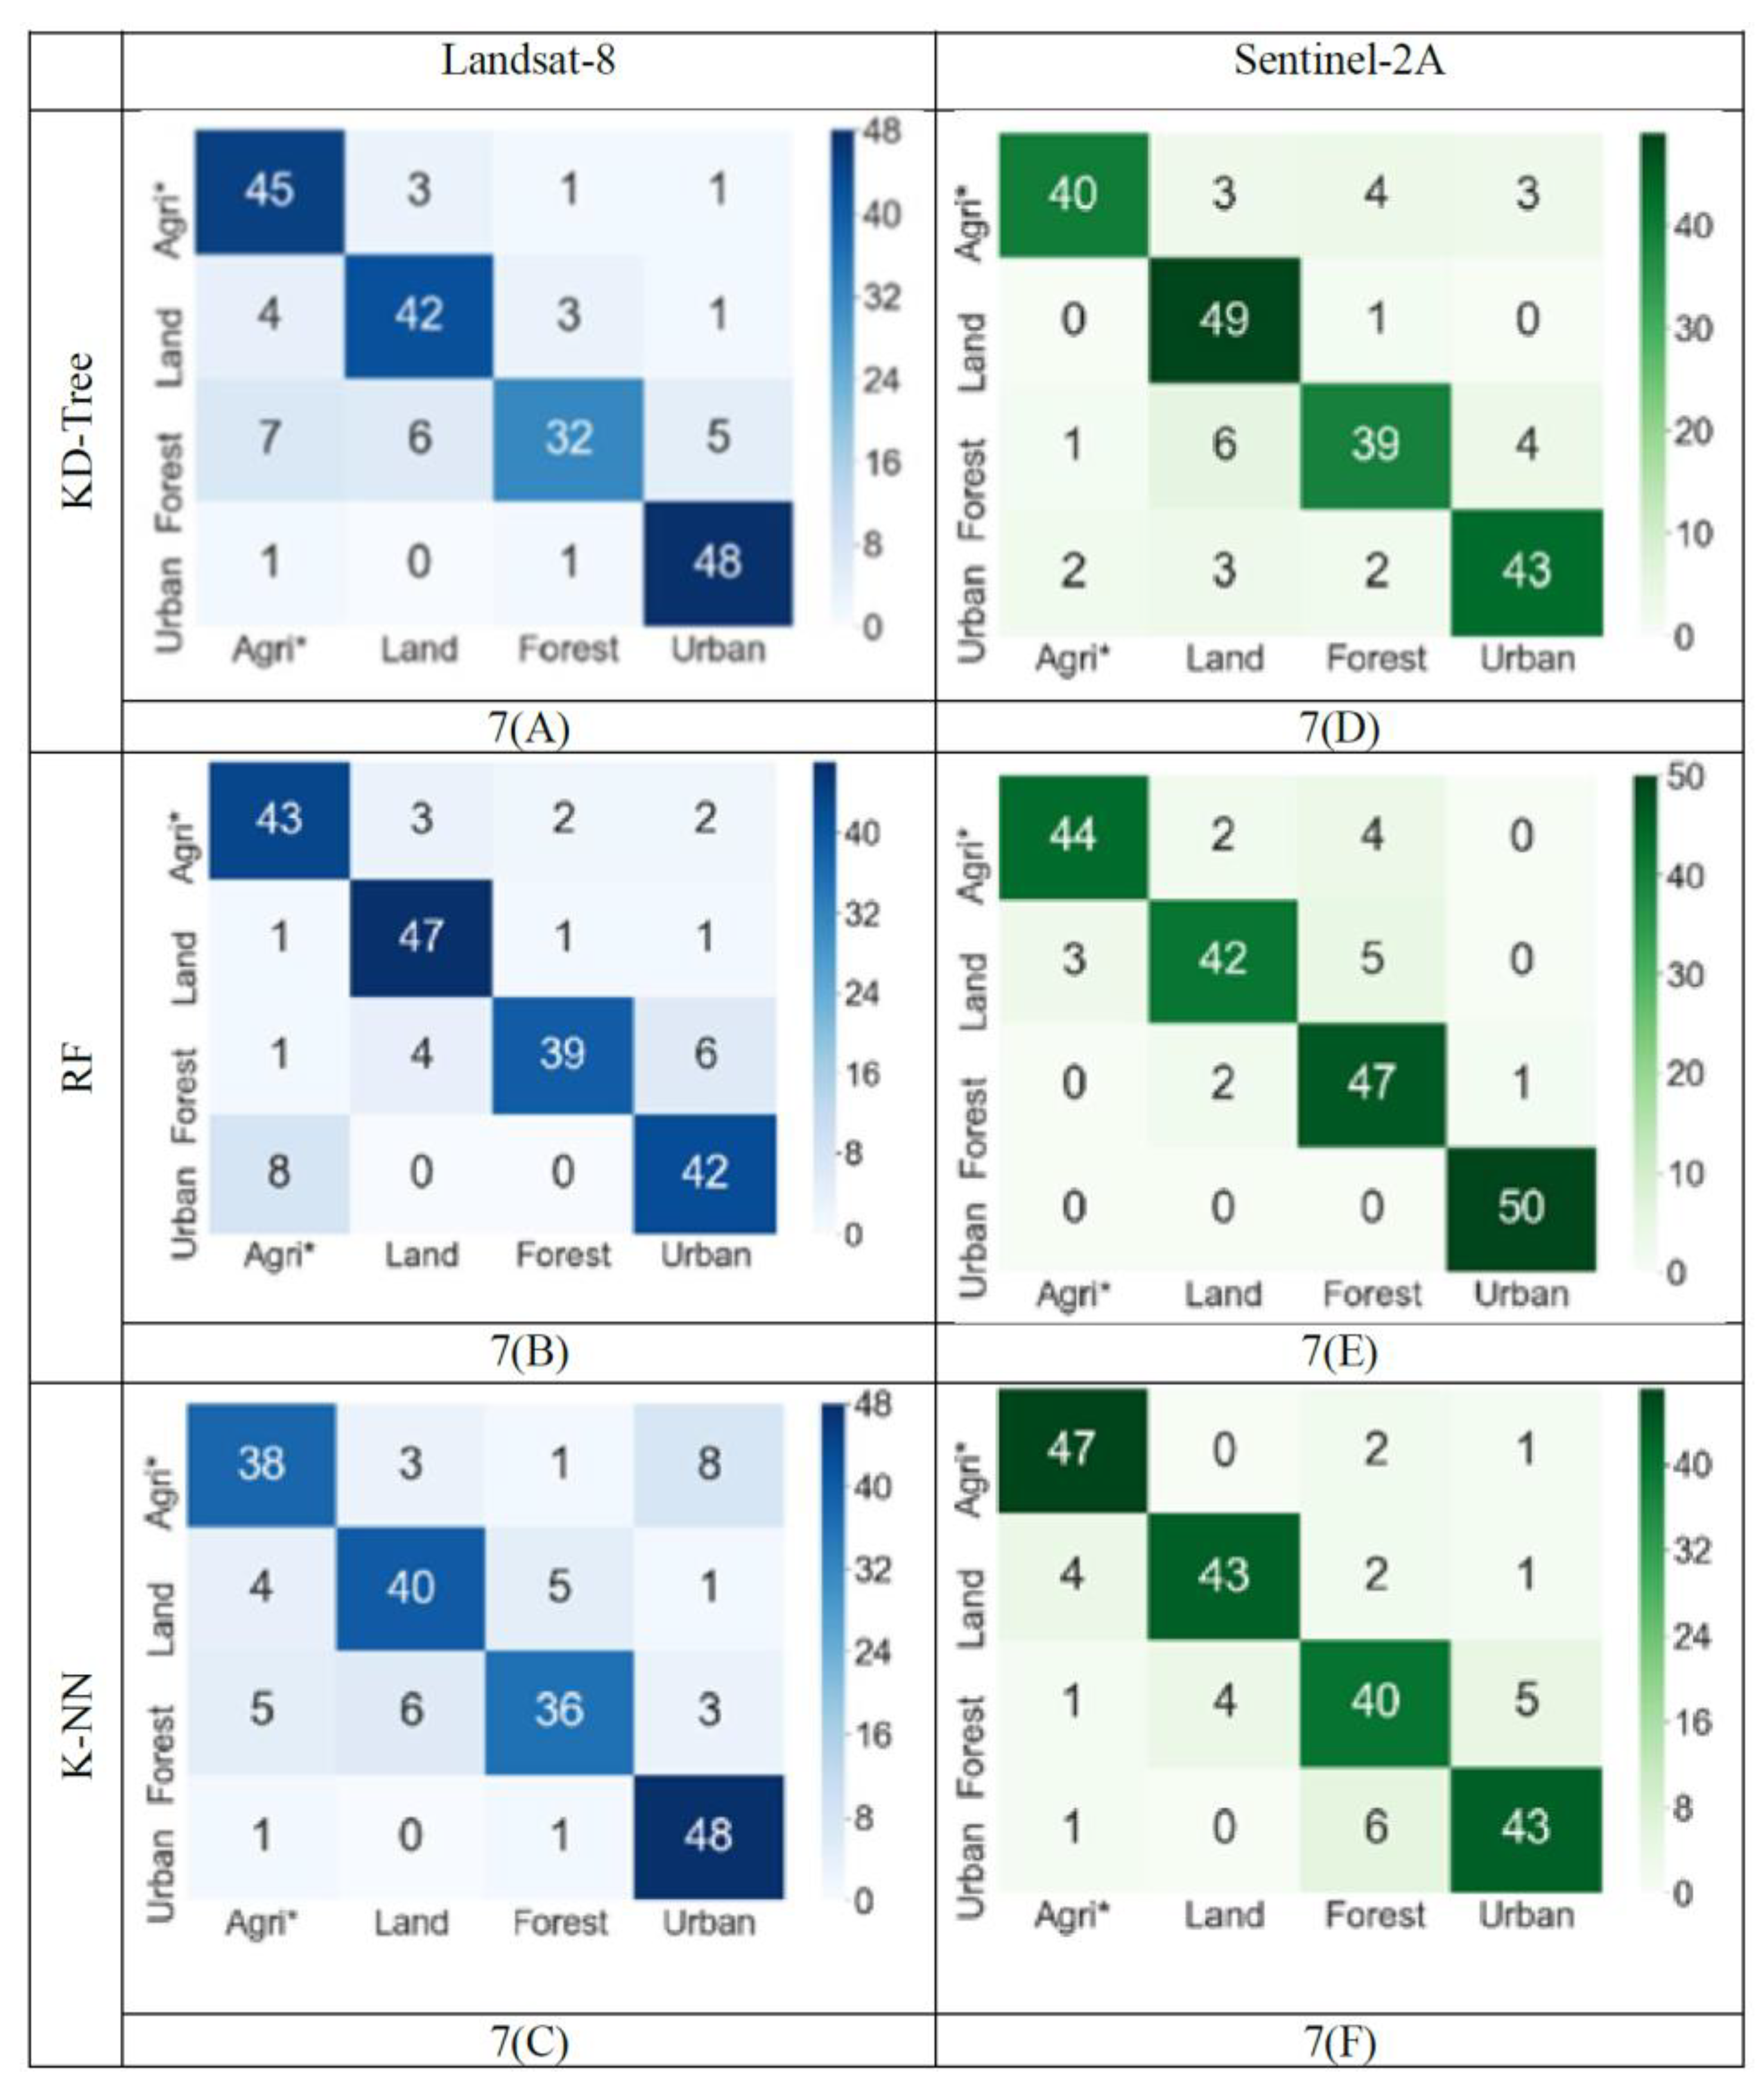
3.2. Satellite Accuracy Comparison

For Landsat-8 imagery, the algorithm’s kappa coefficient was recorded as 78, 80, and 74% for KD-Tree, RF, and K-NN, respectively (Figure 8). For Sentinel-2A imagery, the same algorithms recorded considerably increased kappa coefficient values, i.e., 2.5, 10, and 10.8% for the KD-Tree, RF, and K-NN algorithms, respectively. Similarly, the average kappa coefficient was 83.3% for the Sentinel-2A, while the average was 77.3% for the Landsat-8.
The random forest classifier’s overall accuracy was recorded as 92 and 85% for Sentinel-2A and Landsat-8 satellites, respectively (Figure 9). The average accuracy of the KD-Tree classifier for both satellites was recorded to be 84.5%. The K-NN achieved 86 and 81% overall accuracy for the Sentinel-2A and Landsat-8 satellites, respectively. A slightly lower average overall accuracy of 83.5% was recorded for the K-NN algorithm in comparison with the KD-Tree classifier (Figure 9).

4. Discussion

The sentinel-2A and Landsat-8 presently operate at medium resolution at 10, 20, and 30 m. The resolutions of these two satellite bands are different. Before further processing, all Landsat-8 bands were resampled to 30 m resolution, while Sentinel-2A bands were resampled to 20 m resolution. This study presented the potential of different remote sensing indices to create the training samples for LULC mapping in PEI in conjunction with three ML algorithms. The Island population is increasing, and major land cover classes such as forest, agriculture, barren land, and urban will be affected. These rapid changes demand more effective methods to map land cover changes and conduct resource management analyses.
The remote sensing indices, including DVI, NDVI, NDBI, UI, and NBLI, were selected to highlight the agriculture, forest, barren land, and urban area. This approach to preparing LULC maps is much cheaper and faster than other classification methods traditionally used. Although, for some LULC classes, it is hard to find suitable remote sensing indices. For example, it is hard to distinguish between forests and agriculture using remote sensing indices. The NBLI was used to overcome this problem because [6] documented that the NBLI can highlight the soil composition at the pixel level, which helps distinguish between agriculture and forest (Figure 2). The results from the experiment also verified the validity of this proposed method.
In the last step, we used the same algorithms processing conditions (same training and validation data sets) to compare the Landsat-8 and Sentinel-2A optimal data sets for LULC mapping. The comparison results indicated that the overall accuracy of each algorithm highly depends on the input data of the results. For example, the highest overall accuracy of RF 92% showed that RF offers the best classification results for Sentinel-2A, whereas KD-Tree and K-NN’s overall accuracies were slightly decreased. Interestingly, RF also offers the highest overall accuracy 85% for Landsat-8; likewise, KD-Tree and K-NN’s overall accuracy was slightly decreased compared to RF. All the results mentioned above proved that the outcomes of each classifier depend on the input data set. The results proved that RF is a suitable ML algorithm as compared to the KD-Tree and K-NN for land cover classification without considering input data sets. Therefore, it is necessary to compare the obtained results with the literature because it offers a realistic view of this study’s results.
For example, Lowe and Kulkarni [52] used the RF, SVM, maximum likelihood classifier for preparing the LULC map and achieved an overall accuracy of 87, 83, and 77%, respectively. Another study from Franco-Lopez et al. [53] prepared LULC maps with 13 classes using the K-NN algorithm and achieved an overall accuracy of 63%. These different results indicate that there are no clear rules for the acceptable accuracy for any land cover type, but it depends upon the user and adoptive methodology. In any LULC classification, errors are present in the form of estimation and prediction [54]. So far, no clear rules have been defined in the acceptable accuracy range because different users have different concerns about classification accuracy [55]. In addition, several factors influence the accuracy of classification, such as image quality, classifier, number of classes, and number sample size [51]. One study [51] that used Sentinel-2 data was for LULC mapping in Vietnam with RF, K-NN, and SVM algorithms, and it reported the highest accuracy by RF when the training vector size was appropriate to cover the study area. RF achieved a higher accuracy than the SVM by using Sentinel-1 data of the Brazilian Amazon [56]. These results indicate that Sentinel-2A and Landsat-8 data had satisfactory performance in LULC mapping. In [51], RF was recommended for LULC classification because of the ease in parameter selection in RF. The results of this study concur with the findings of [51].

5. Conclusions

This study proposed a methodology to produce LULC maps at a lesser cost and in a quick manner by using three ML algorithms (KD-Tree, RF, and K-NN) and two satellites (Landsat-8 and Sentinel-2A). Timely updated maps can help the local authorities with better resource management and land-use policy decisions. The proposed methodology to develop the LULC maps with remote sensing indices can be leveraged by researchers to determine the spatial-temporal changes of LULC due to human activities. The results of this study demonstrated the potential of remote sensing indices to limit the need for ground truth data for LULC mapping. This would lower the labour cost, time, and resources required to generate LULC maps.
In this study, training samples for four classes, forest, agriculture, urban, and barren land, were created on behalf of indices, and these training samples were used in conjunction with the ML algorithms for LULC mapping. The prepared LULC maps based on this proposed methodology showed promising results when they were validated with ground truth data. The six LULC maps, produced by running the three ML algorithms using the same training data for the two sources of imagery, were subjected to an accuracy assessment to determine the effectiveness of the ML algorithms.
Results from the study demonstrated that K-NN achieved average kappa coefficients of 82 and 74% and high overall accuracies of 86 and 81% for Sentinel-2A and Landsat-8, respectively. In comparison, the KD-Tree had average kappa coefficients of 80 and 78% and overall accuracies of 85 and 84% for Sentinel-2A and Landsat-8. Random forest achieved the highest average kappa coefficients, at 83.3 and 73.3%, and highest overall accuracies, at 92 and 85%. for Sentinel-2A and Landsat-8 data, respectively, compared to K-NN and KD-Tree.
Further research should be conducted in two tasks: (1) the evaluation of this methodology on satellite images with a higher resolution as well as refining the data by training samples for subclasses of crops such as potato, wheat, rice, maize, and grasses and (2) the quantity and quality of training samples have an impact on land cover classification. By assuring quality and increasing the training sample size, classification accuracy can be enhanced. The ideal combination of training sample size will also be researched in the future.

Author Contributions

Conceptualization, Usman Ali, Aitazaz A. Farooque, Farhat Abbas and Mathieu F. Bilodeau; Data curation, Usman Ali; Formal analysis, Usman Ali.; Funding acquisition, Travis J. Esau and Qamar U. Zaman; Investigation, Usman Ali; Methodology, Usman Ali; Project administration, Travis J. Esau; Resources, Travis J. Esau; Supervision, Travis J. Esau and Qamar U. Zaman; Validation, Usman Ali and Farhat Abbas; Visualization, Usman Ali; Writing—original draft, Usman Ali; Writing—review and editing, Travis J. Esau, Aitazaz A. Farooque, Qamar U. Zaman, Farhat Abbas and Mathieu F. Bilodeau. All authors have read and agreed to the published version of the manuscript.

Funding

This research was financially supported by the following grant source: Natural Sciences and Engineering Research Council of Canada (NSERC) Discovery Grants Program [RGPIN-06295-2019].

Institutional Review Board Statement

Not applicable.

Informed Consent Statement

Not applicable.

Data Availability Statement

This website, https://earthexplorer.usgs.gov/ (accessed on 30 May 2022), provides access to the data used in this study.

Acknowledgments

The authors would like to thank the Dalhousie University Agricultural Mechanized Systems Team and the University of Prince Edward Island’s Precision Agriculture Research Team for their help and assistance with this project.

Conflicts of Interest

The authors declare that they have no conflict of interest.

References

  1. Nguyen, H.T.T.; Doan, T.M.; Radeloff, V. Applying Random Forest Classification to Map Land Use/Land Cover Using Landsat 8 OLI. Int. Arch. Photogramm. Remote Sens. Spat. Inf. Sci. 2018, 42, 363–367. [Google Scholar] [CrossRef] [Green Version]
  2. Burkhard, B.; Kroll, F.; Nedkov, S.; Müller, F. Mapping Ecosystem Service Supply, Demand and Budgets. Ecol. Indic. 2012, 21, 17–29. [Google Scholar] [CrossRef]
  3. Phiri, D.; Morgenroth, J. Developments in Landsat Land Cover Classification Methods: A Review. Remote Sens. 2017, 9, 967. [Google Scholar] [CrossRef] [Green Version]
  4. Abdi, A.M. Land Cover and Land Use Classification Performance of Machine Learning Algorithms in a Boreal Landscape Using Sentinel-2 Data. GISci. Remote Sens. 2020, 57, 1–20. [Google Scholar] [CrossRef] [Green Version]
  5. Showqi, I.; Rashid, I.; Romshoo, S.A. Land Use Land Cover Dynamics as a Function of Changing Demography and Hydrology. GeoJournal 2014, 79, 297–307. [Google Scholar] [CrossRef]
  6. United Nations Department of Economic and Social Affairs—Population Division. Global Population Growth and Sustainable Development; United Nations Department of Economic and Social Affairs—Population Division: New York, NY, USA, 2021; ISBN 9789211483505. [Google Scholar]
  7. Li, P.; Moon, W.M. Land Cover Classification Using MODIS–ASTER Airborne Simulator (MASTER) Data and NDVI: A Case Study of the Kochang Area, Korea. Can. J. Remote Sens. 2004, 30, 123–136. [Google Scholar] [CrossRef]
  8. Vajda, S.; Santosh, K.C. A Fast K-Nearest Neighbor Classifier Using Unsupervised Clustering. In Proceedings of the Communications in Computer and Information Science, Istanbul, Turkey, 17–18 December 2017; Volume 709, pp. 185–193. [Google Scholar]
  9. Mohan, M.; Pathan, S.K.; Narendrareddy, K.; Kandya, A.; Pandey, S. Dynamics of Urbanization and Its Impact on Land-Use/Land-Cover: A Case Study of Megacity Delhi. J. Environ. Prot. 2011, 2, 1274–1283. [Google Scholar] [CrossRef] [Green Version]
  10. Serra, P.; More, G.; Pons, X. Thematic Accuracy Consequences in Cadastre Land-Cover Enrichment from a Pixel and from a Polygon Perspective. Photogramm. Eng. Remote Sens. 2009, 75, 1441–1449. [Google Scholar] [CrossRef] [Green Version]
  11. Li, H.; Wang, C.; Zhong, C.; Zhang, Z.; Liu, Q. Mapping Typical Urban LULC from Landsat Imagery without Training Samples or Self-Defined Parameters. Remote Sens. 2017, 9, 700. [Google Scholar] [CrossRef] [Green Version]
  12. Fisette, T.; Davidson, A.; Daneshfar, B.; Rollin, P.; Aly, Z.; Campbell, L. Annual Space-Based Crop Inventory for Canada: 2009–2014. In Proceedings of the 2014 IEEE Geoscience and Remote Sensing Symposium, Quebec City, QC, Canada, 13–18 July 2014; pp. 5095–5098. [Google Scholar] [CrossRef]
  13. Foody, G.M.; Mathur, A.; Sanchez-Hernandez, C.; Boyd, D.S. Training Set Size Requirements for the Classification of a Specific Class. Remote Sens. Environ. 2006, 104, 1–14. [Google Scholar] [CrossRef]
  14. Lu, D.; Weng, Q. A Survey of Image Classification Methods and Techniques for Improving Classification Performance. Int. J. Remote Sens. 2007, 28, 823–870. [Google Scholar] [CrossRef]
  15. Piper, J. Variability and Bias in Experimentally Measured Classifier Error Rates. Pattern Recognit. Lett. 1992, 13, 685–692. [Google Scholar] [CrossRef]
  16. Heydari, S.S.; Mountrakis, G. Effect of Classifier Selection, Reference Sample Size, Reference Class Distribution and Scene Heterogeneity in per-Pixel Classification Accuracy Using 26 Landsat Sites. Remote Sens. Environ. 2018, 204, 648–658. [Google Scholar] [CrossRef]
  17. Huang, C.; Davis, L.S.; Townshend, J.R.G. An Assessment of Support Vector Machines for Land Cover Classification. Int. J. Remote Sens. 2002, 23, 725–749. [Google Scholar] [CrossRef]
  18. Ramezan, C.A.; Warner, T.A.; Maxwell, A.E.; Price, B.S. Effects of Training Set Size on Supervised Machine-Learning Land-Cover Classification of Large-Area High-Resolution Remotely Sensed Data. Remote Sens. 2021, 13, 368. [Google Scholar] [CrossRef]
  19. Maxwell, A.E.; Warner, T.A.; Fang, F. Implementation of Machine-Learning Classification in Remote Sensing: An Applied Review. Int. J. Remote Sens. 2018, 39, 2784–2817. [Google Scholar] [CrossRef] [Green Version]
  20. Jamali, A. Evaluation and Comparison of Eight Machine Learning Models in Land Use/Land Cover Mapping Using Landsat 8 OLI: A Case Study of the Northern Region of Iran. SN Appl. Sci. 2019, 1, 1448. [Google Scholar] [CrossRef] [Green Version]
  21. Vishwanath, N.; Ramesh, B.; Sreenivasa Rao, P. Unsupervised Classification of Remote Sensing Images Using K-Means Algorithm. Int. J. Latest Trends Eng. Technol. 2016, 7, 548–552. [Google Scholar] [CrossRef]
  22. Shivakumar, B.R.; Rajashekararadhya, S.V. Investigation on Land Cover Mapping Capability of Maximum Likelihood Classifier: A Case Study on North Canara, India. Procedia Comput. Sci. 2018, 143, 579–586. [Google Scholar] [CrossRef]
  23. Mather, P.; Tso, B. Classification Methods for Remotely Sensed Data; CRC Press: Boca Raton, FL, USA, 2016; ISBN 9780429192029. [Google Scholar]
  24. Abbas, Z.; Jaber, H.S. Accuracy Assessment of Supervised Classification Methods for Extraction Land Use Maps Using Remote Sensing and GIS Techniques. IOP Conf. Ser. Mater. Sci. Eng. 2020, 745, 012166. [Google Scholar] [CrossRef]
  25. Desai, C.; Umrikar, B. Image classification tool for land use land cover analysis: A comparative study of maximum likelihood and minimum distance method. Int. J. Geol. Earth Environ. Sci. 2012, 2, 189–196. [Google Scholar]
  26. Nguyen, H.A.T.; Sophea, T.; Gheewala, S.H.; Rattanakom, R.; Areerob, T.; Prueksakorn, K. Integrating Remote Sensing and Machine Learning into Environmental Monitoring and Assessment of Land Use Change. Sustain. Prod. Consum. 2021, 27, 1239–1254. [Google Scholar] [CrossRef]
  27. Jia, K.; Wei, X.; Gu, X.; Yao, Y.; Xie, X.; Li, B. Land Cover Classification Using Landsat 8 Operational Land Imager Data in Beijing, China. Geocarto Int. 2014, 29, 941–951. [Google Scholar] [CrossRef]
  28. Thanh Noi, P.; Kappas, M. Comparison of Random Forest, k-Nearest Neighbor, and Support Vector Machine Classifiers for Land Cover Classification Using Sentinel-2 Imagery. Sensors 2017, 18, 18. [Google Scholar] [CrossRef] [Green Version]
  29. Ali, M.Z.; Qazi, W.; Aslam, N. A Comparative Study of ALOS-2 PALSAR and Landsat-8 Imagery for Land Cover Classification Using Maximum Likelihood Classifier. Egypt. J. Remote Sens. Space Sci. 2018, 21, 29–35. [Google Scholar] [CrossRef]
  30. Clerici, N.; Valbuena Calderón, C.A.; Posada, J.M. Fusion of Sentinel-1a and Sentinel-2A Data for Land Cover Mapping: A Case Study in the Lower Magdalena Region, Colombia. J. Maps 2017, 13, 718–726. [Google Scholar] [CrossRef] [Green Version]
  31. Government of Prince Edward Island. Prince Edward Island Population Report 2020; Government of Prince Edward Island: Charlottetown, PE, Canada, 2020.
  32. Department of Environment, E. and C.A. Our Changing Climate. Available online: https://www.princeedwardisland.ca/en/information/environment-energy-and-climate-action/our-changing-climate (accessed on 27 July 2021).
  33. Asokan, A.; Anitha, J.; Ciobanu, M.; Gabor, A.; Naaji, A.; Hemanth, D.J. Image Processing Techniques for Analysis of Satellite Images for Historical Maps Classification-An Overview. Appl. Sci. 2020, 10, 4207. [Google Scholar] [CrossRef]
  34. Drusch, M.; Del Bello, U.; Carlier, S.; Colin, O.; Fernandez, V.; Gascon, F.; Hoersch, B.; Isola, C.; Laberinti, P.; Martimort, P.; et al. Sentinel-2: ESA’s Optical High-Resolution Mission for GMES Operational Services. Remote Sens. Environ. 2012, 120, 25–36. [Google Scholar] [CrossRef]
  35. Roy, D.P.; Wulder, M.A.; Loveland, T.R.; Woodcock, C.E.; Allen, R.G.; Anderson, M.C.; Helder, D.; Irons, J.R.; Johnson, D.M.; Kennedy, R.; et al. Landsat-8: Science and Product Vision for Terrestrial Global Change Research. Remote Sens. Environ. 2014, 145, 154–172. [Google Scholar] [CrossRef] [Green Version]
  36. Richardson, A.J.; Everitt, J.H. Using Spectral Vegetation Indices to Estimate Rangeland Productivity. Geocarto Int. 1992, 7, 63–69. [Google Scholar] [CrossRef]
  37. Tucker, C.J. Red and Photographic Infrared Linear Combinations for Monitoring Vegetation. Remote Sens. Environ. 1979, 8, 127–150. [Google Scholar] [CrossRef] [Green Version]
  38. Zha, Y.; Gao, J.; Ni, S. Use of Normalized Difference Built-up Index in Automatically Mapping Urban Areas from TM Imagery. Int. J. Remote Sens. 2003, 24, 583–594. [Google Scholar] [CrossRef]
  39. Li, H.; Wang, C.; Zhong, C.; Su, A.; Xiong, C.; Wang, J.; Liu, J. Mapping Urban Bare Land Automatically from Landsat Imagery with a Simple Index. Remote Sens. 2017, 9, 249. [Google Scholar] [CrossRef] [Green Version]
  40. Breiman, L. Random Forests. Mach. Learn. 2001, 45, 5–32. [Google Scholar] [CrossRef] [Green Version]
  41. Liaw, A.; Wiener, M. Classification and Regression by RandomForest. R News 2002, 2, 18–22. [Google Scholar]
  42. Fix, E. Discriminatory Analysis: Nonparametric Discrimination, Consistency Properties; International Statistical Institute: Voorburg, The Netherlands, 1951. [Google Scholar]
  43. Cover, T.M.; Hart, P.E. Nearest Neighbor Pattern Classification. IEEE Trans. Inf. Theory 1967, 13, 21–27. [Google Scholar] [CrossRef]
  44. Karegowda, A.G.; Jayaram, M.A.; Manjunath, A.S. Cascading K-Means Clustering and K-Nearest Neighbor Classifier for Categorization of Diabetic Patients. Int. J. Eng. Adv. Technol. 2012, 1, 147–151. [Google Scholar]
  45. Narasimhulu, Y.; Suthar, A.; Pasunuri, R.; China Venkaiah, V. Ckd-Tree: An Improved Kd-Tree Construction Algorithm. CEUR Workshop Proc. 2021, 2786, 211–218. [Google Scholar]
  46. Dolatshah, M.; Hadian, A.; Minaei-Bidgoli, B. Ball*-Tree: Efficient Spatial Indexing for Constrained Nearest-Neighbor Search in Metric Spaces. arXiv 2015, arXiv:1511.00628. [Google Scholar]
  47. Story, M.; Congalton, R.G. Remote Sensing Brief Accuracy Assessment: A User’s Perspective. Photogramm. Eng. Remote Sens. 1986, 52, 397–399. [Google Scholar]
  48. McHugh, M.L. Lessons in Biostatistics Interrater Reliability: The Kappa Statistic. Biochem. Med. 2012, 22, 276–282. [Google Scholar] [CrossRef]
  49. Chen, D.; Stow, D.A.; Gong, P. Examining the Effect of Spatial Resolution and Texture Window Size on Classification Accuracy: An Urban Environment Case. Int. J. Remote Sens. 2004, 25, 2177–2192. [Google Scholar] [CrossRef]
  50. Rao, P.; Zhou, W.; Bhattarai, N.; Srivastava, A.K.; Singh, B.; Poonia, S.; Lobell, D.B.; Jain, M. Using Sentinel-1, Sentinel-2, and Planet Imagery to Map Crop Type of Smallholder Farms. Remote Sens. 2021, 13, 1870. [Google Scholar] [CrossRef]
  51. Nguyen, H.T.T.; Doan, T.M.; Tomppo, E.; McRoberts, R.E. Land Use/Land Cover Mapping Using Multitemporal Sentinel-2 Imagery and Four Classification Methods-A Case Study from Dak Nong, Vietnam. Remote Sens. 2020, 12, 1367. [Google Scholar] [CrossRef]
  52. Lowe, B.; Kulkarni, A. Multispectral Image Analysis Using Random Forest. Int. J. Soft Comput. 2015, 6, 1–14. [Google Scholar] [CrossRef]
  53. Franco-Lopez, H.; Ek, A.R.; Bauer, M.E. Estimation and Mapping of Forest Stand Density, Volume, and Cover Type Using the k-Nearest Neighbors Method. Remote Sens. Environ. 2001, 77, 251–274. [Google Scholar] [CrossRef]
  54. Salovaara, K.J.; Thessler, S.; Malik, R.N.; Tuomisto, H. Classification of Amazonian Primary Rain Forest Vegetation Using Landsat ETM+ Satellite Imagery. Remote Sens. Environ. 2005, 97, 39–51. [Google Scholar] [CrossRef]
  55. Olofsson, P.; Foody, G.M.; Herold, M.; Stehman, S.V.; Woodcock, C.E.; Wulder, M.A. Good Practices for Estimating Area and Assessing Accuracy of Land Change. Remote Sens. Environ. 2014, 148, 42–57. [Google Scholar] [CrossRef]
  56. Chaves, M.E.D.; Picoli, M.C.A.; Sanches, I.D. Recent Applications of Landsat 8/OLI and Sentinel-2/MSI for Land Use and Land Cover Mapping: A Systematic Review. Remote Sens. 2020, 12, 3062. [Google Scholar] [CrossRef]
Figure 1. Prince Edward Island, Canada.
Ijgi 11 00333 g001
Figure 2. Sentinel-2A and Landsat-8 indices are used to classify the agriculture, urban, forest, and barren land cover. The right portion (A1A5) and (B1B5) of each figure shows the details of the selected portion. The minimum and maximum values of vegetation indices vary from 0 to 1.
Ijgi 11 00333 g002
Figure 3. A pictorial view of the random forest working principle.
Ijgi 11 00333 g003
Figure 4. A pictorial view of the k-nearest neighbor working principle.
Ijgi 11 00333 g004
Figure 5. A pictorial view of the k dimensional-tree working principle.
Ijgi 11 00333 g005
Figure 6. Remote sensing indices based LULC map prepared based on two satellites’ data. Land allocation was divided into four classes including agriculture, urban, forest and barren land.
Ijgi 11 00333 g006
Figure 7. Error matrix showing correct and incorrect training vectors of the evaluation samples by each ML algorithm. The error matrices for Landsat-8 data are shown in Figures (AC). The error matrices for Sentinel-2A data are shown in Figures (DF). Table 4 shows the producer and user accuracy calculated based on the error matrices.
Ijgi 11 00333 g007
Figure 8. Kappa coefficient comparison of two satellites using different classifiers.
Ijgi 11 00333 g008
Figure 9. Overall accuracy comparison of two satellites using different classifiers.
Ijgi 11 00333 g009
Table 1. List of satellite images used in the study.
SatellitesNumber of BandsResolution (m)Acquisition Date (Day/Month/Year)Path-Row/Tile (Number)Cloud Cover (%)
Sentinel-2A1310–6026 July 2019T20TLS≤10
16 July 2019T20TMT≤10
20 July 2019T20TNS≤10
28 July 2019T20TMS≤10
Landsat-81115–10026 July 2019008-028≤10
26 July 2019007-028≤10
7 July 2019007-027≤10
Table 2. Remote sensing indices for highlighting LULC classes.
TypeIndexFormulasReferences
Vegetation IndexDVI N I R R e d [36]
NDVI N I R R e d N I R + R e d [37]
Urban indexNDBI S W I R N I R S W I R + N I R [38]
UI S W I R 2 N I R S W I R 2 + N I R [39]
Barren land indexNBLI R e d T I R R e d + T I R [39]
Table 3. Description of land-use and land-cover classes used in this study.
LULC ClassDescription
AgricultureCultivated land, crop fields, vegetable fields
UrbanResidential, commercial, industrial, mixed urban, other urban
Barren LandExposed soil, construction site, fallow land
ForestDeciduous forest and mix forest, shrubs, and other
Table 4. User and producer accuracies for LULC types used in this study.
ClassifierClassesUser Accuracy (%)Producer Accuracy (%)User Accuracy (%)Producer Accuracy (%)
Sentinel-2ALandsat-8
KD-TreeAgriculture80939079
Barren Land98808482
Forest78856486
Urban86869687
RFAgriculture88948681
Barren Land84919487
Forest94847892
Urban100988482
K-NNAgriculture94897679
Barren Land86918082
Forest80807284
Urban86869680
Publisher’s Note: MDPI stays neutral with regard to jurisdictional claims in published maps and institutional affiliations.

