
Development of Spatial Model for Food Security Prediction Using Remote Sensing Data in West Java, Indonesia

 , ,
, ,  , ,
, , 
Abstract
:1. Introduction
2. Related Works
3. Data and Employed Methods
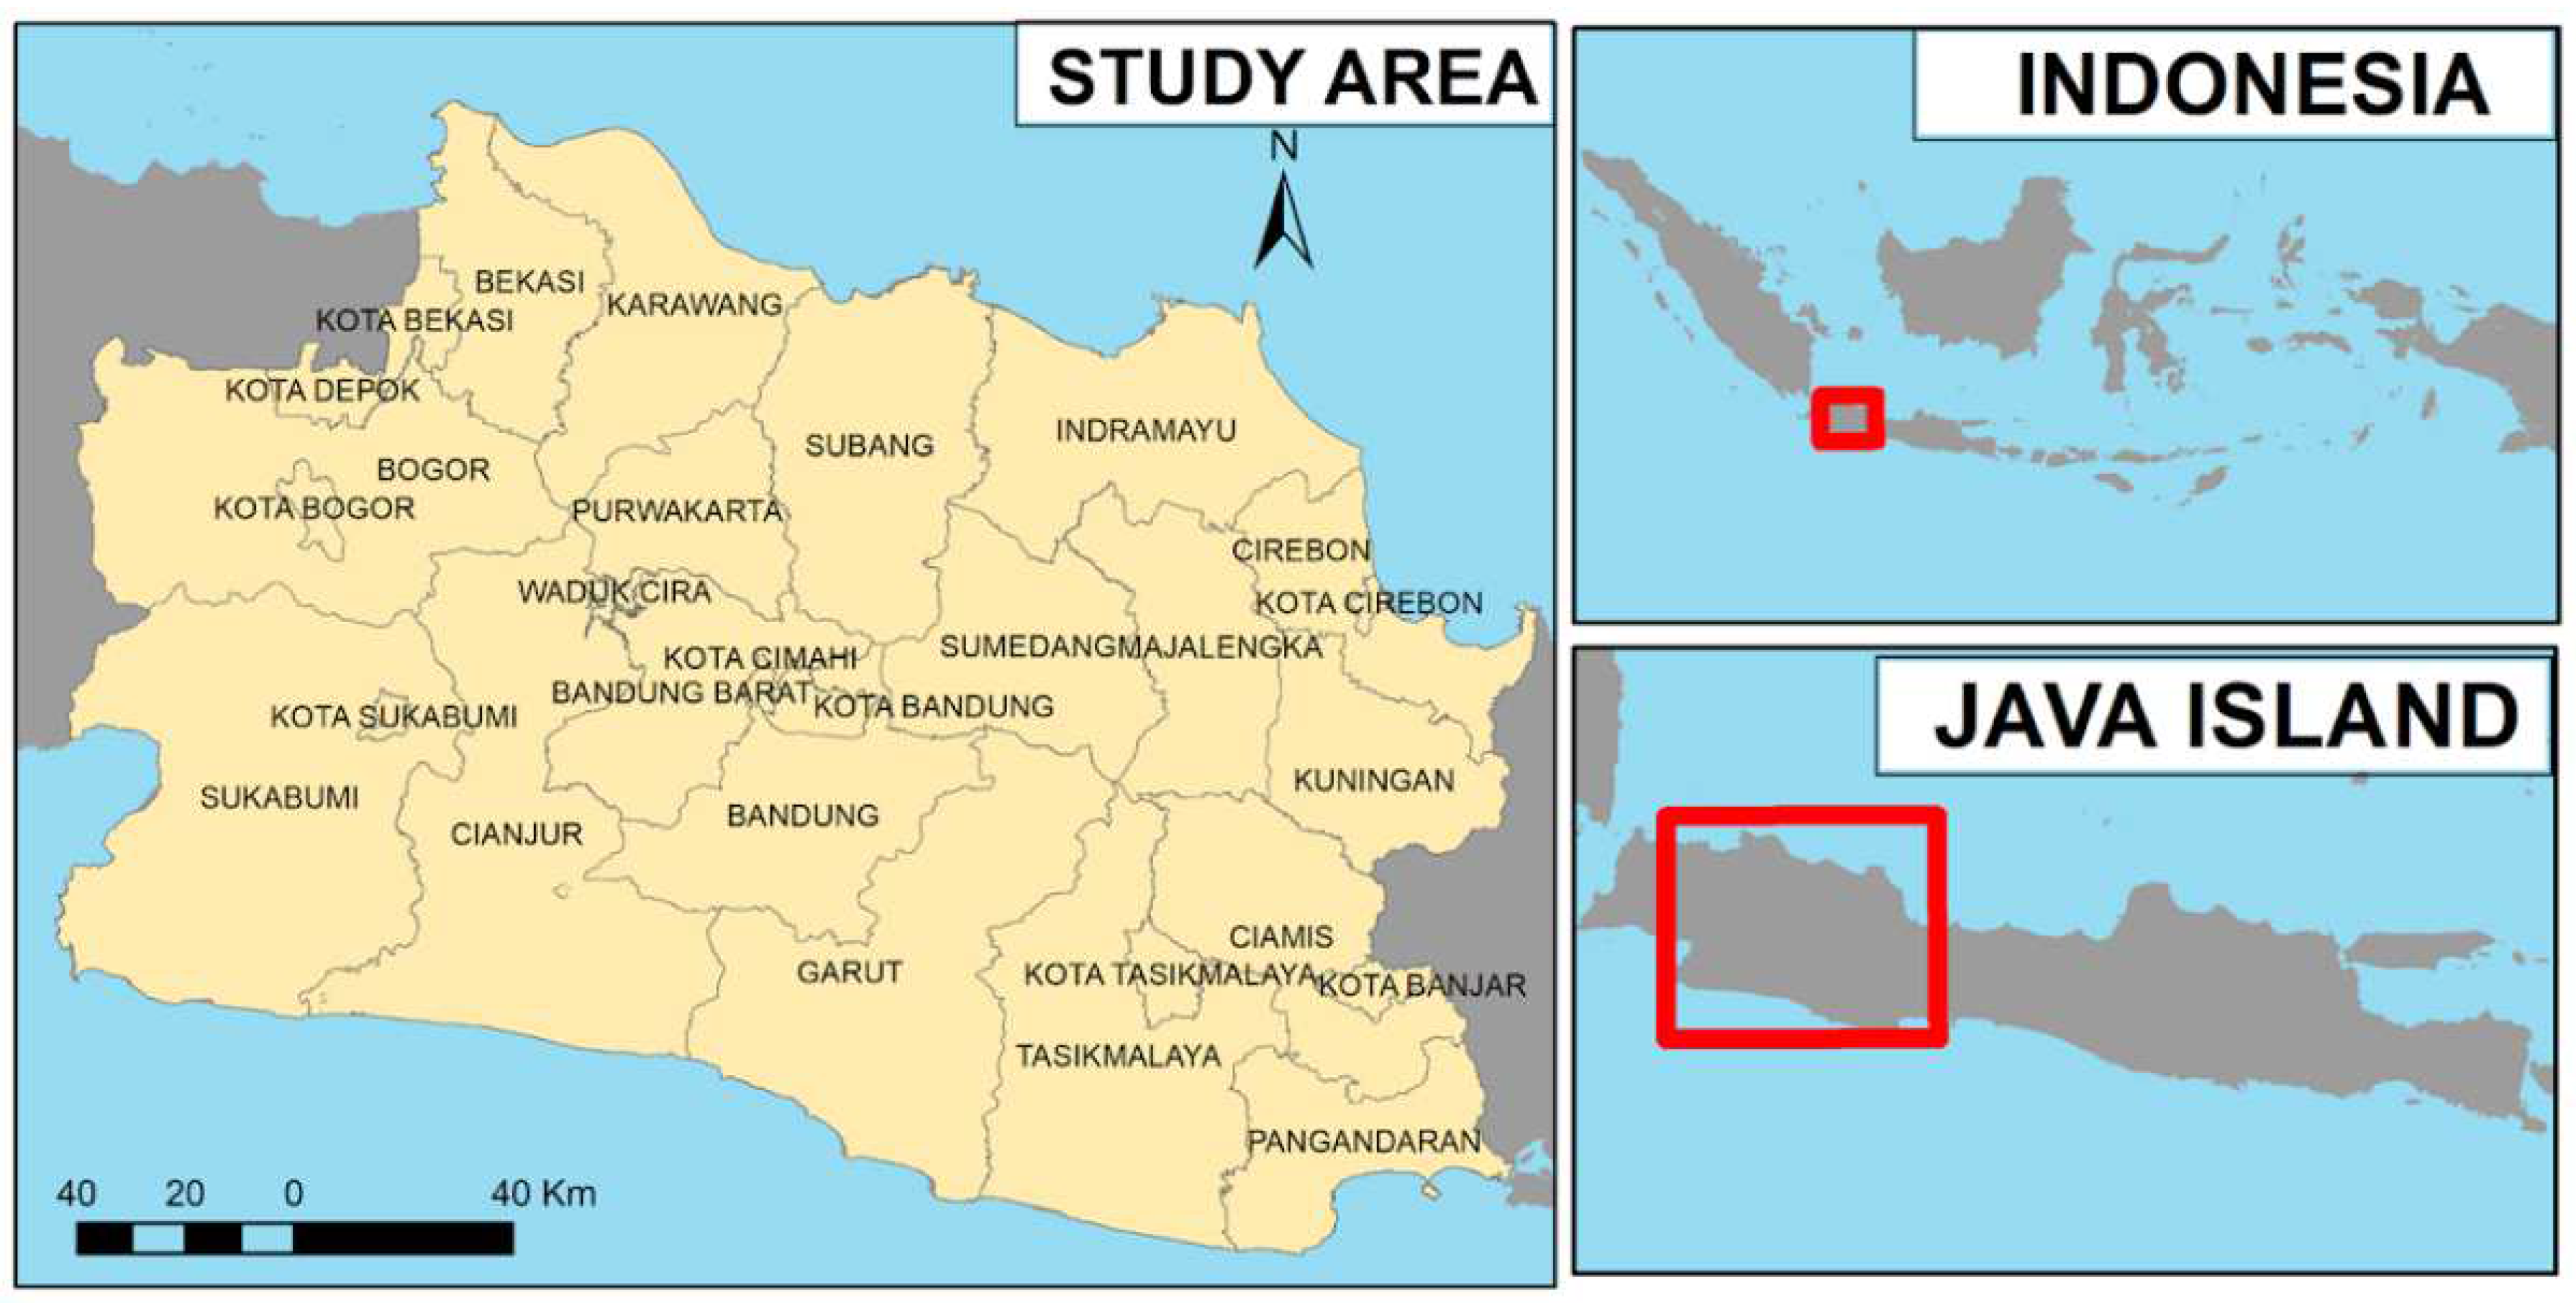
3.1. Study Area
3.2. Data
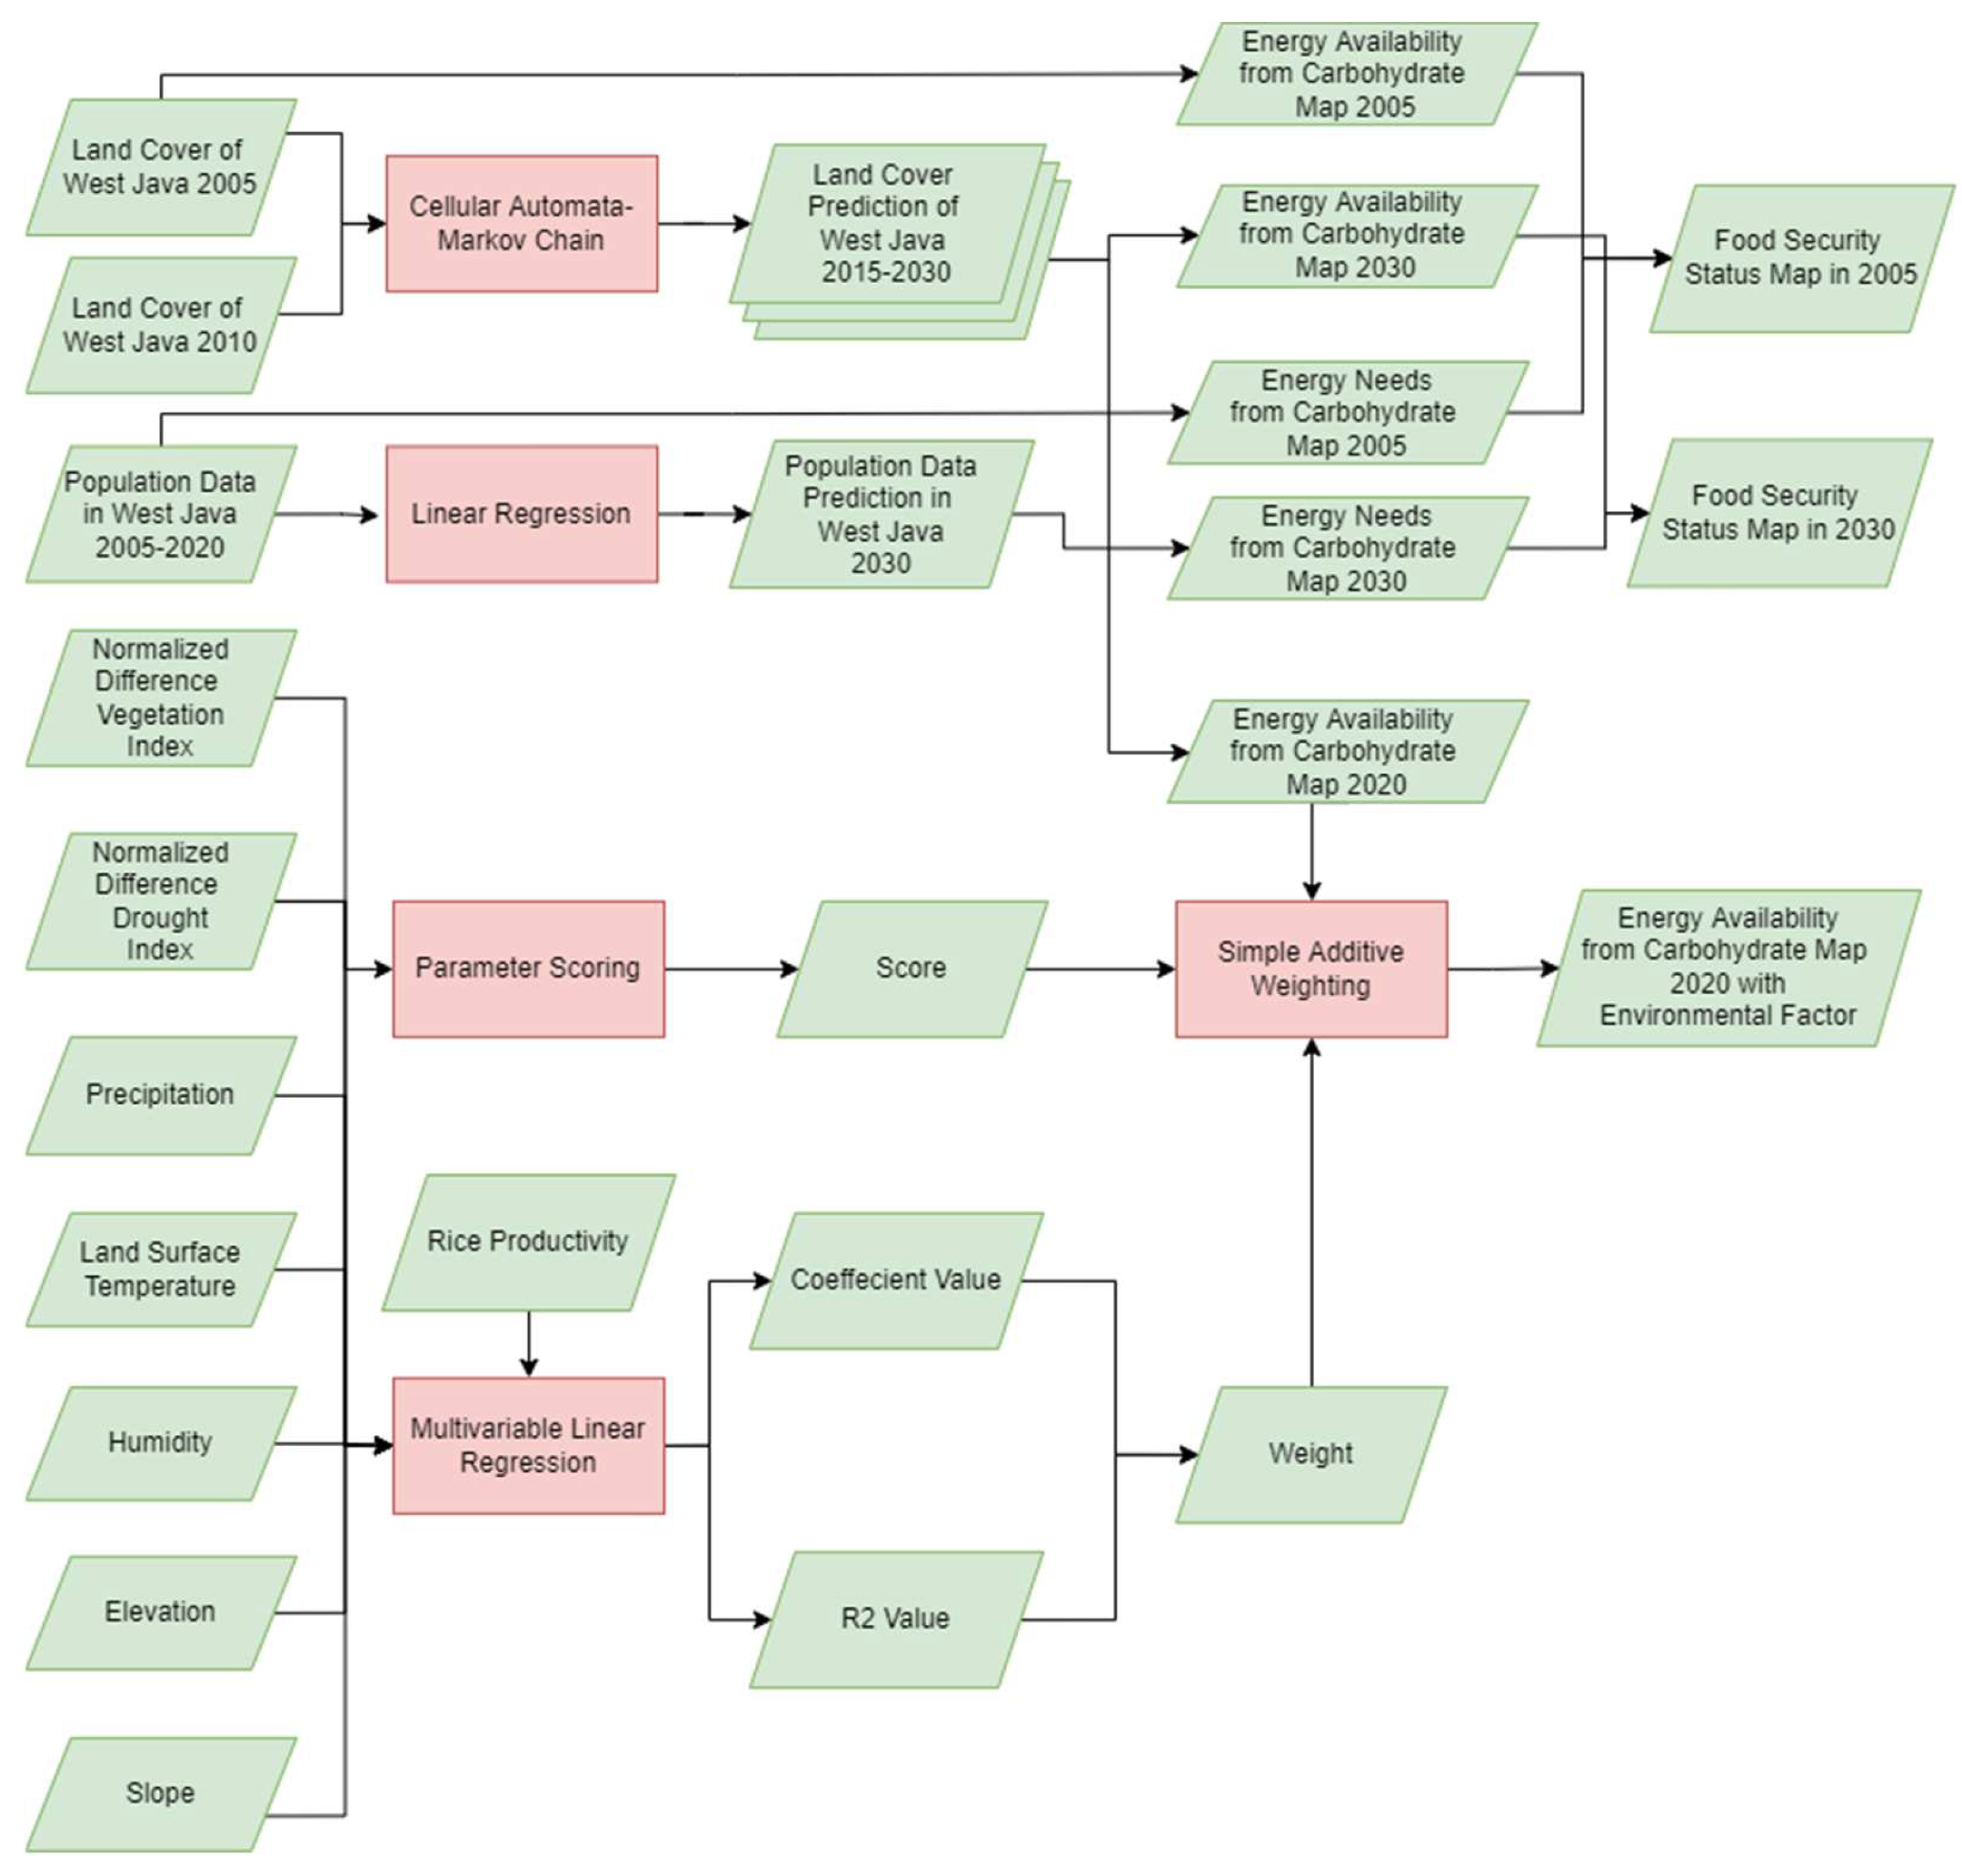
3.3. Methods
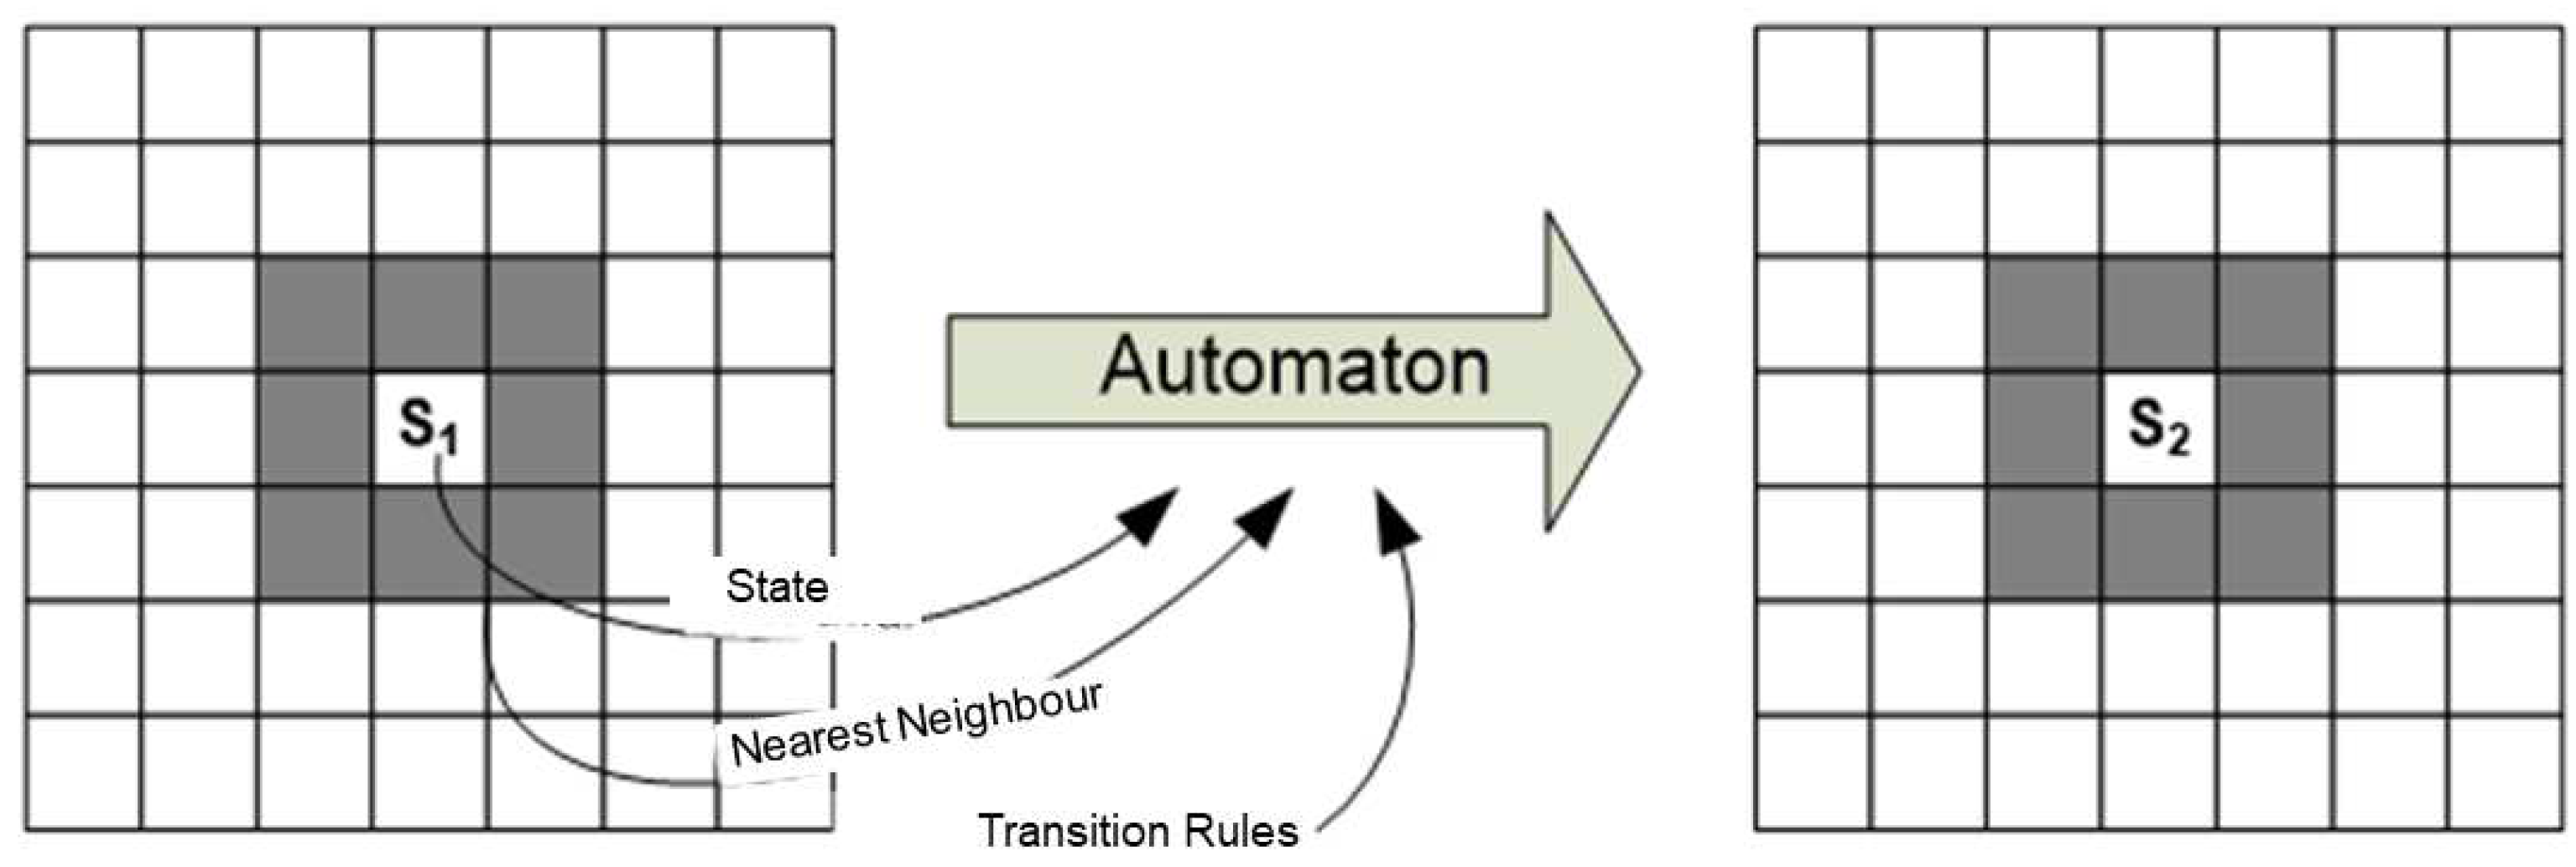
3.3.1. Land Cover Change Methodology
3.3.2. Mapping Food Status
3.3.3. Identification of Environmental Factors Influence on Paddy Fields Productivity
3.3.4. Prediction of Food Availability by Integrating Paddy Fields Area and Environmental Factors Methods
4. Results and Discussion
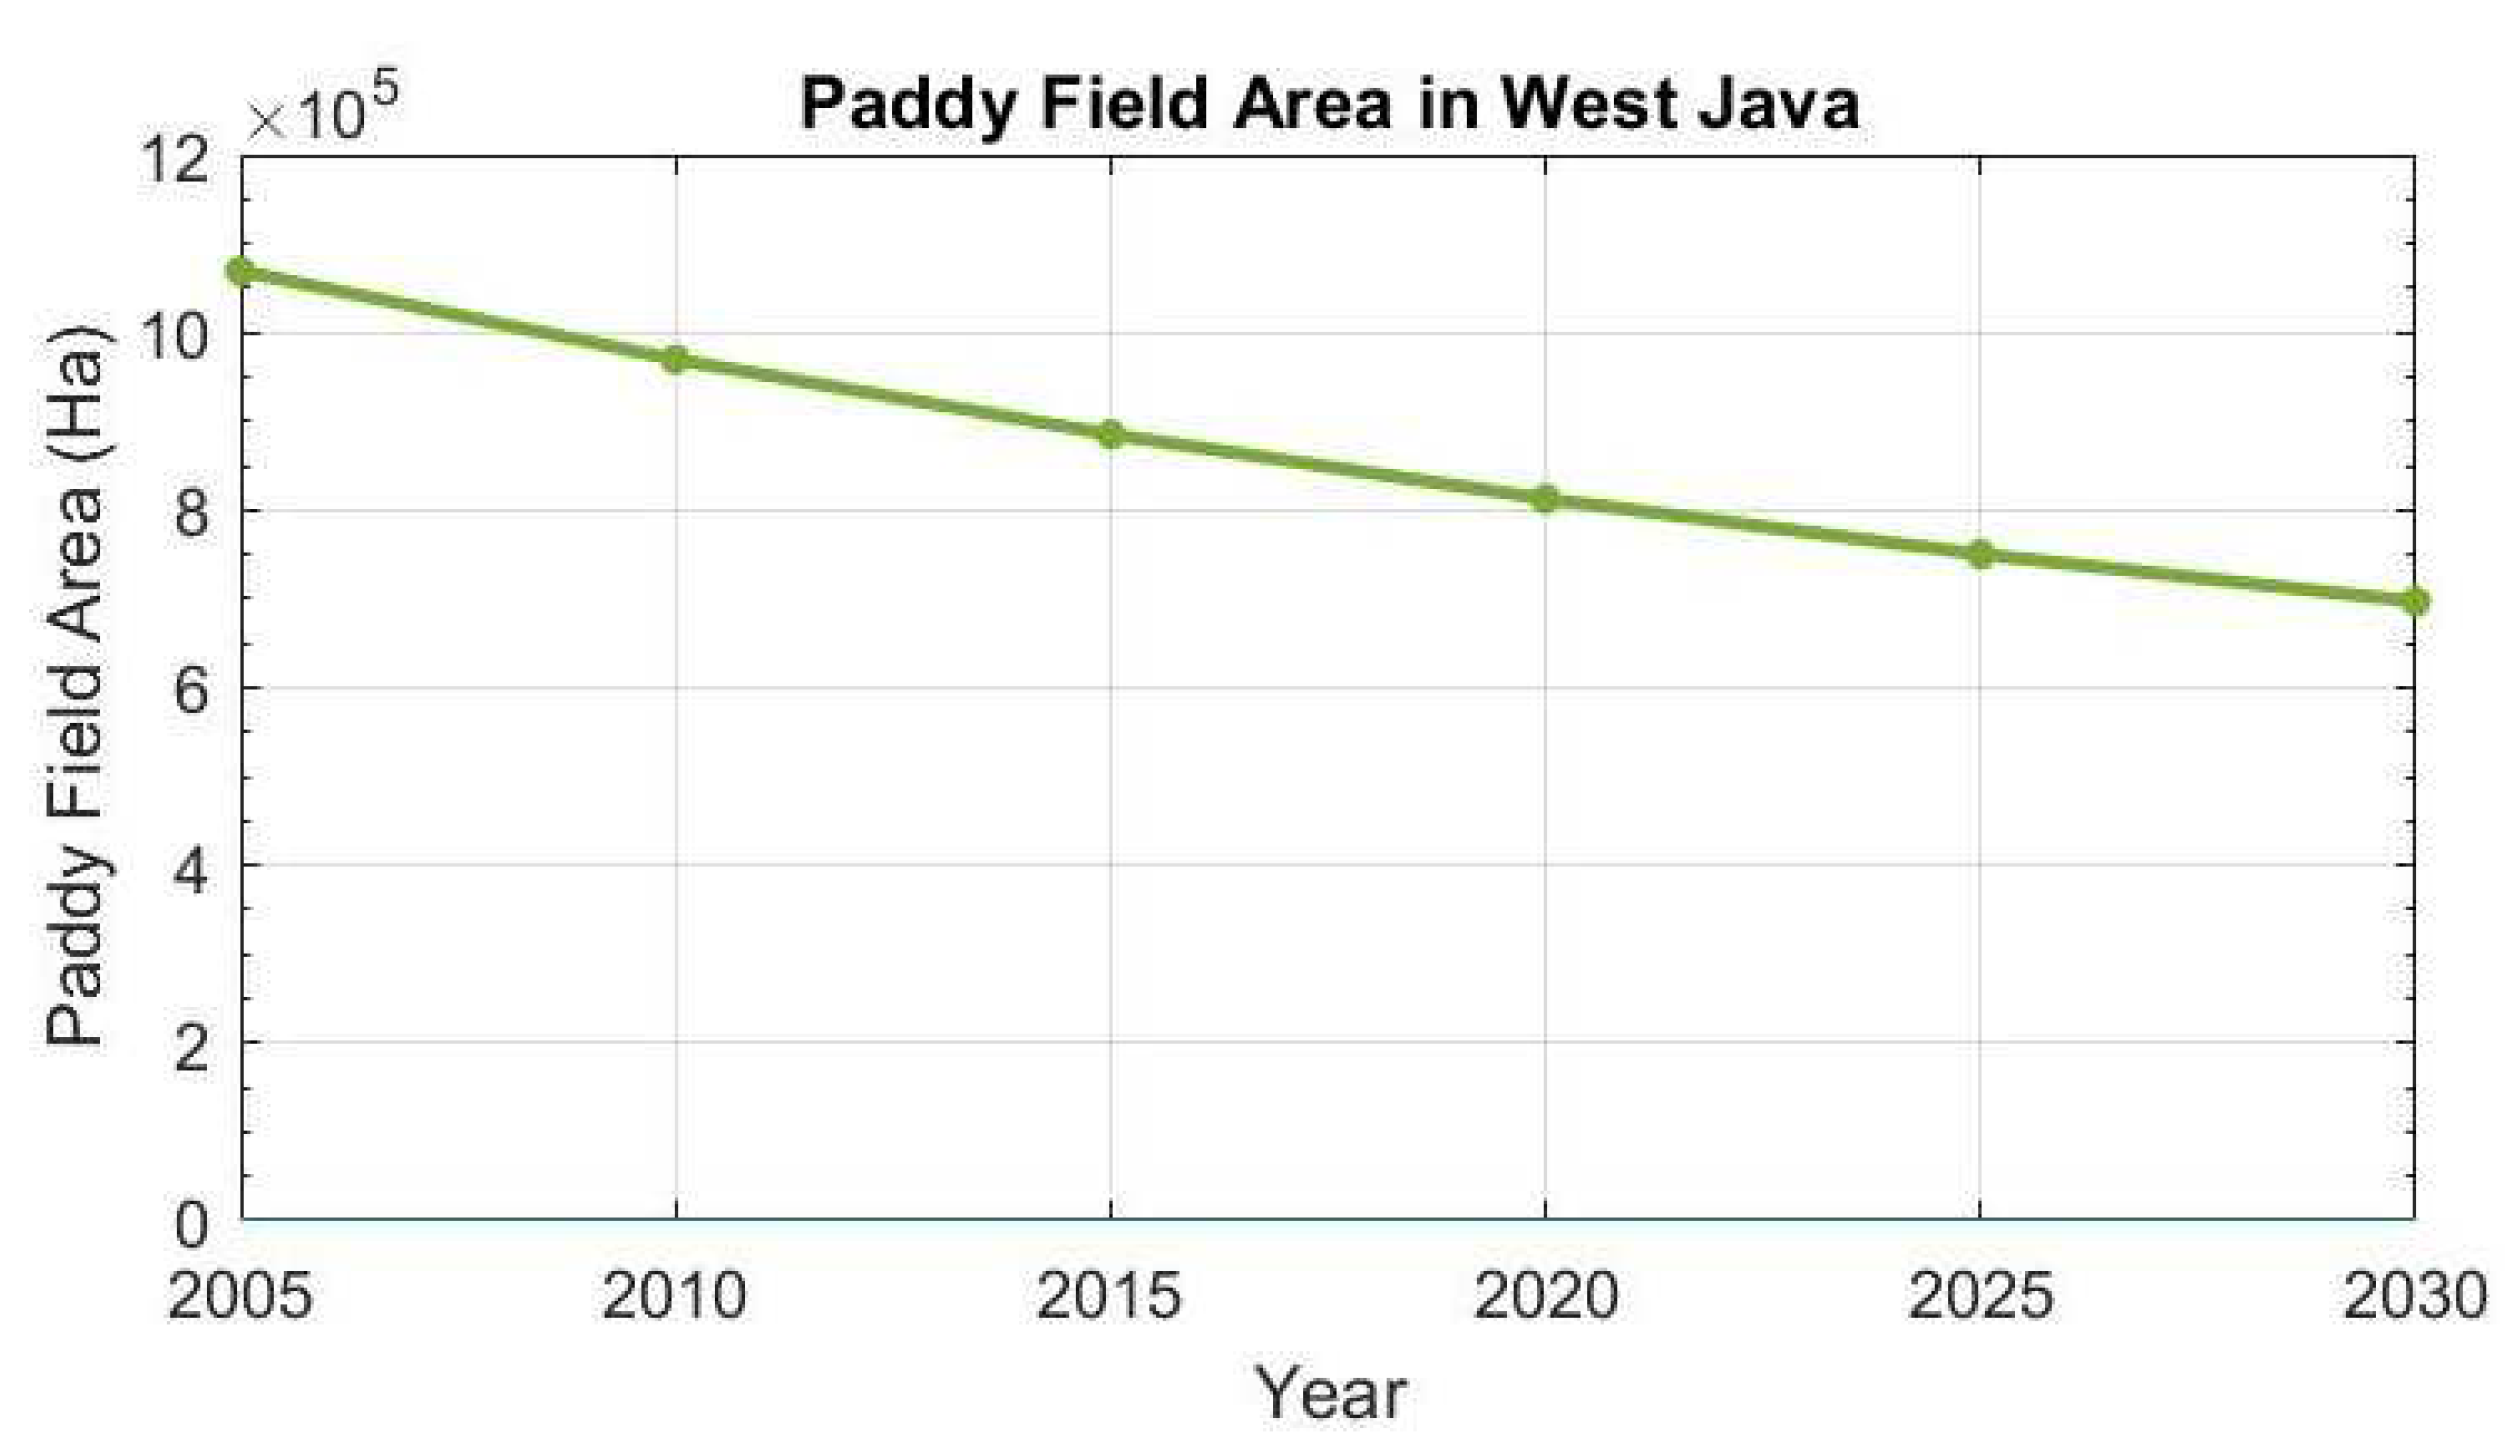
4.1. Land Change Model
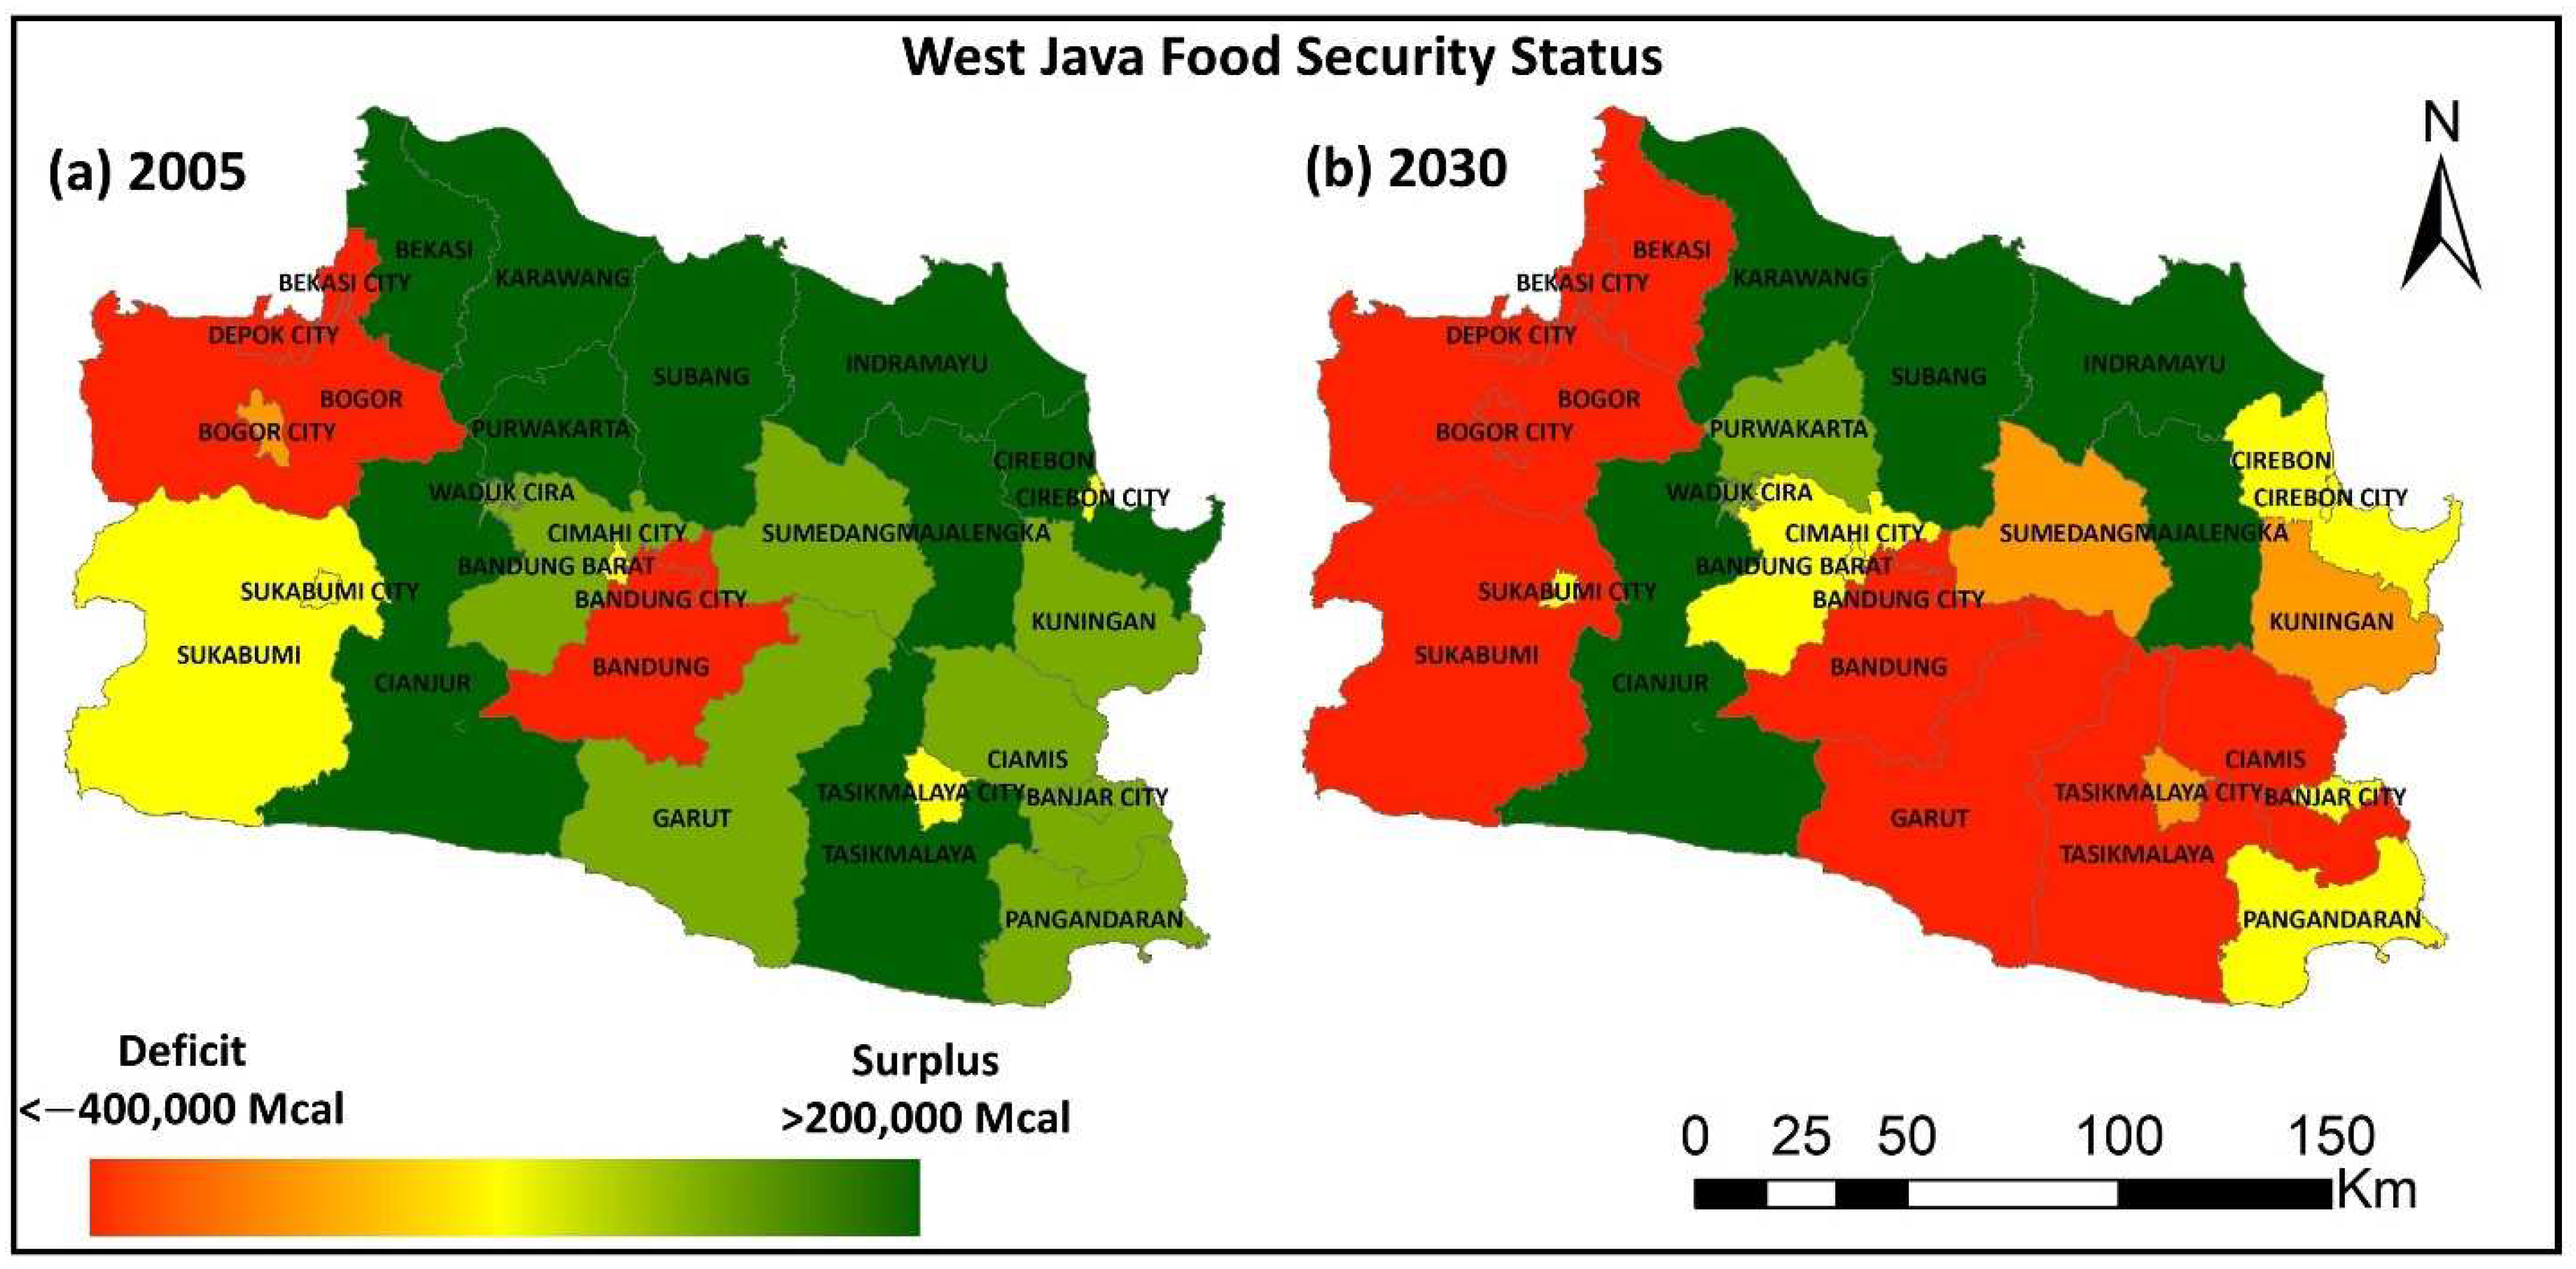
4.2. Food Status Model
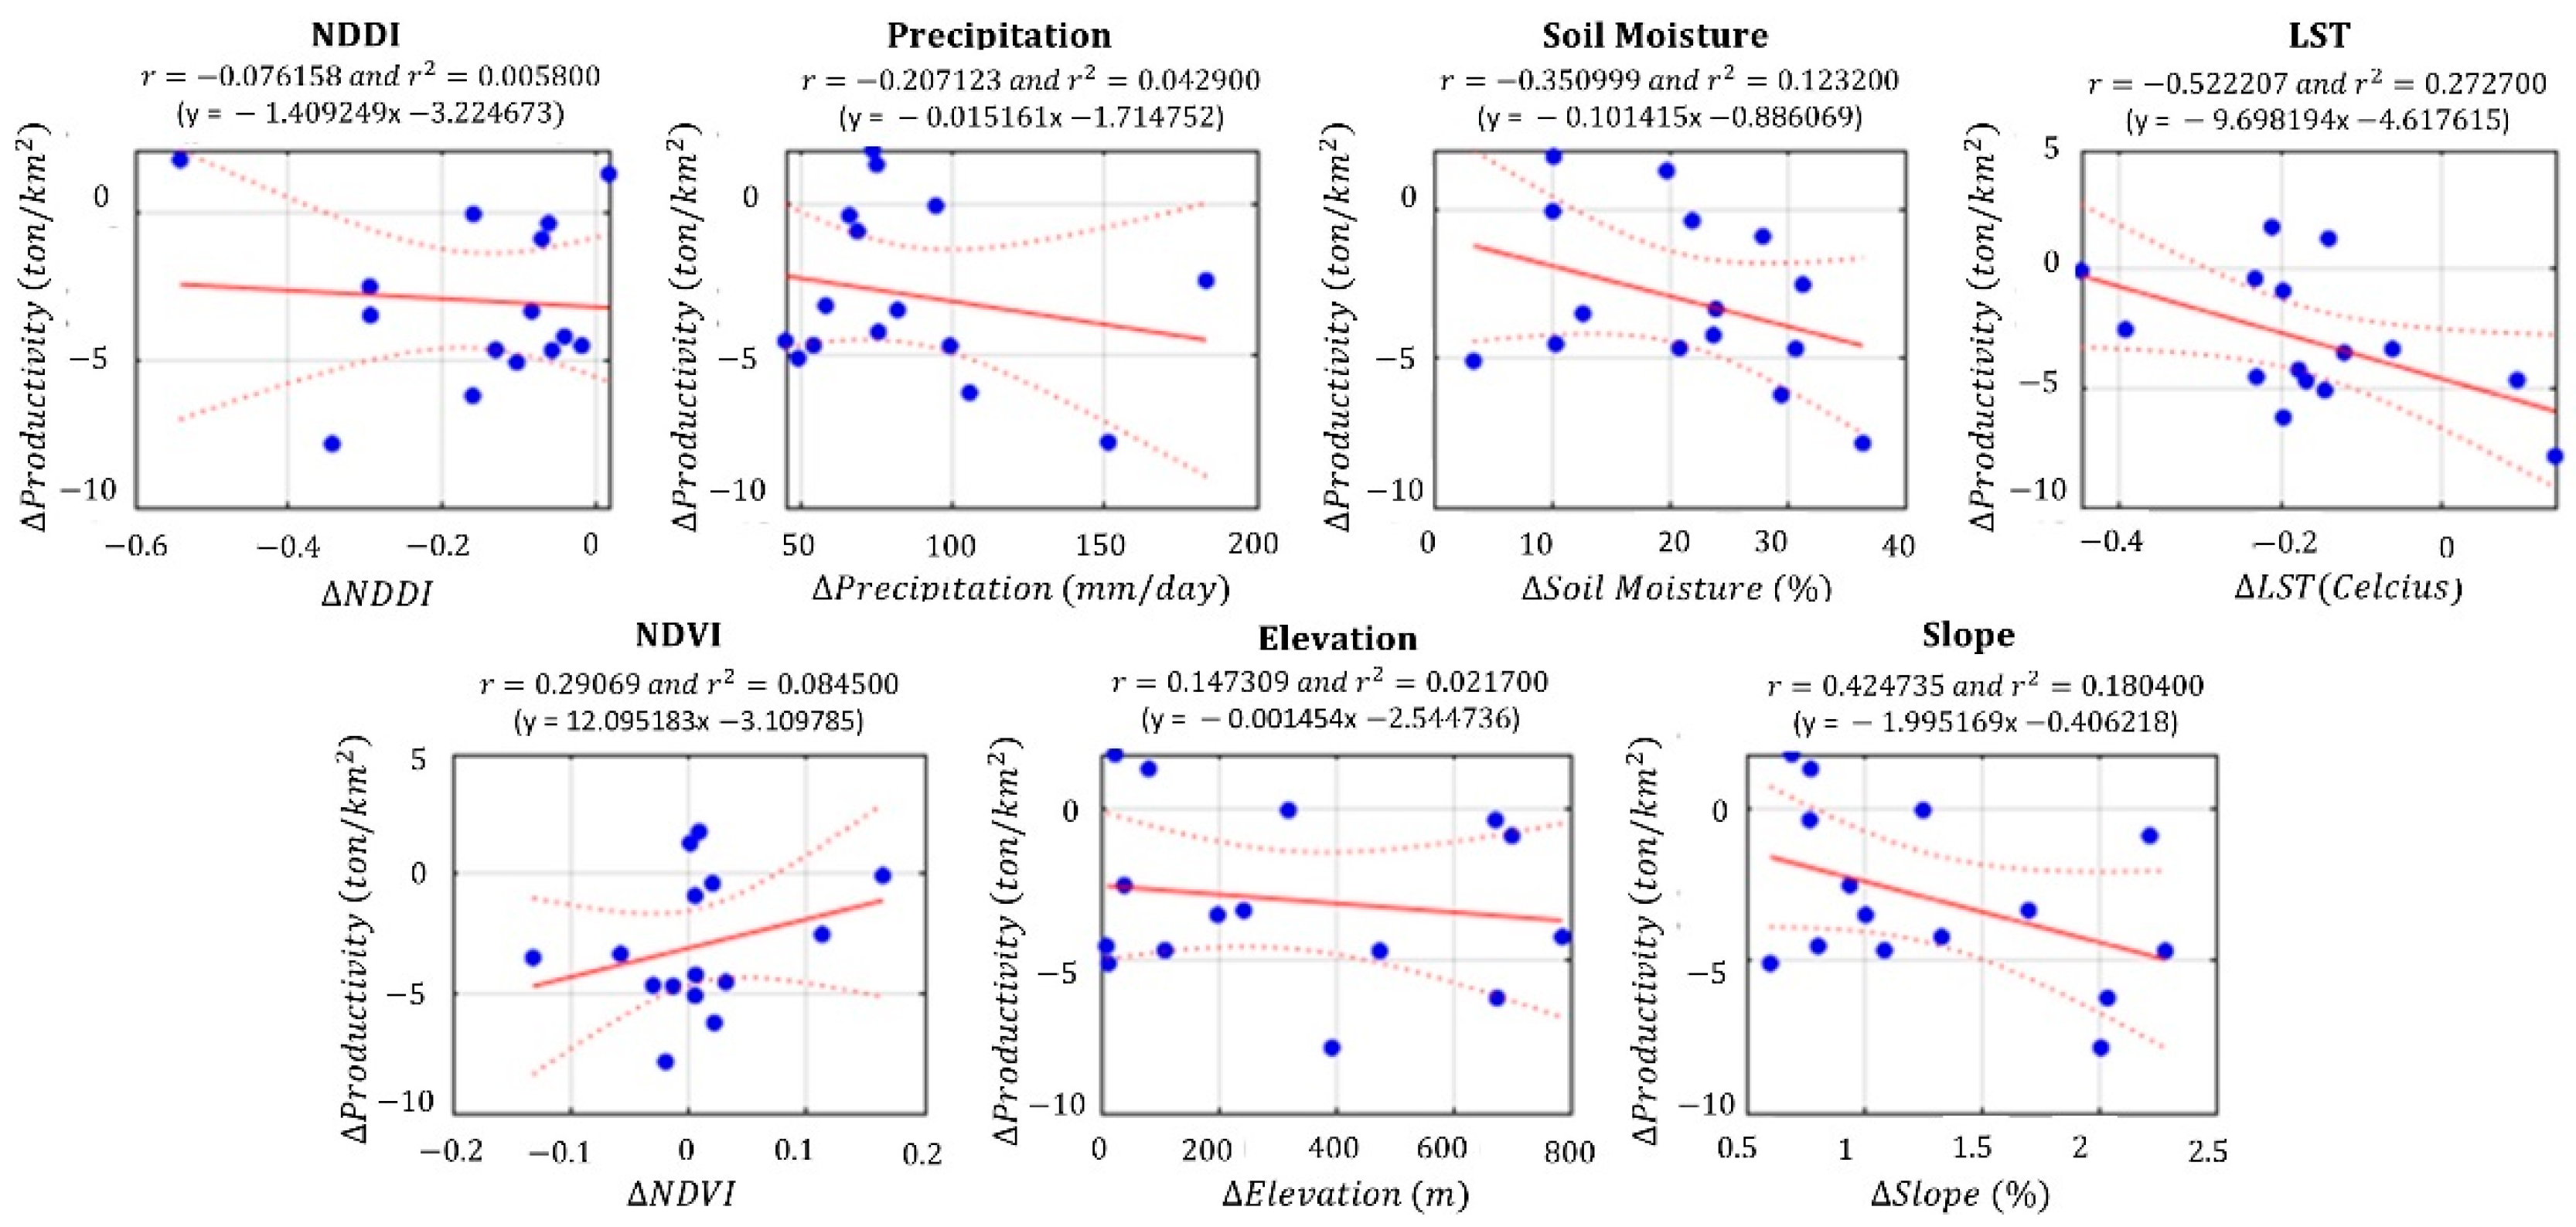
4.3. Identification of Factors Influencing Rice Productivity in West Java
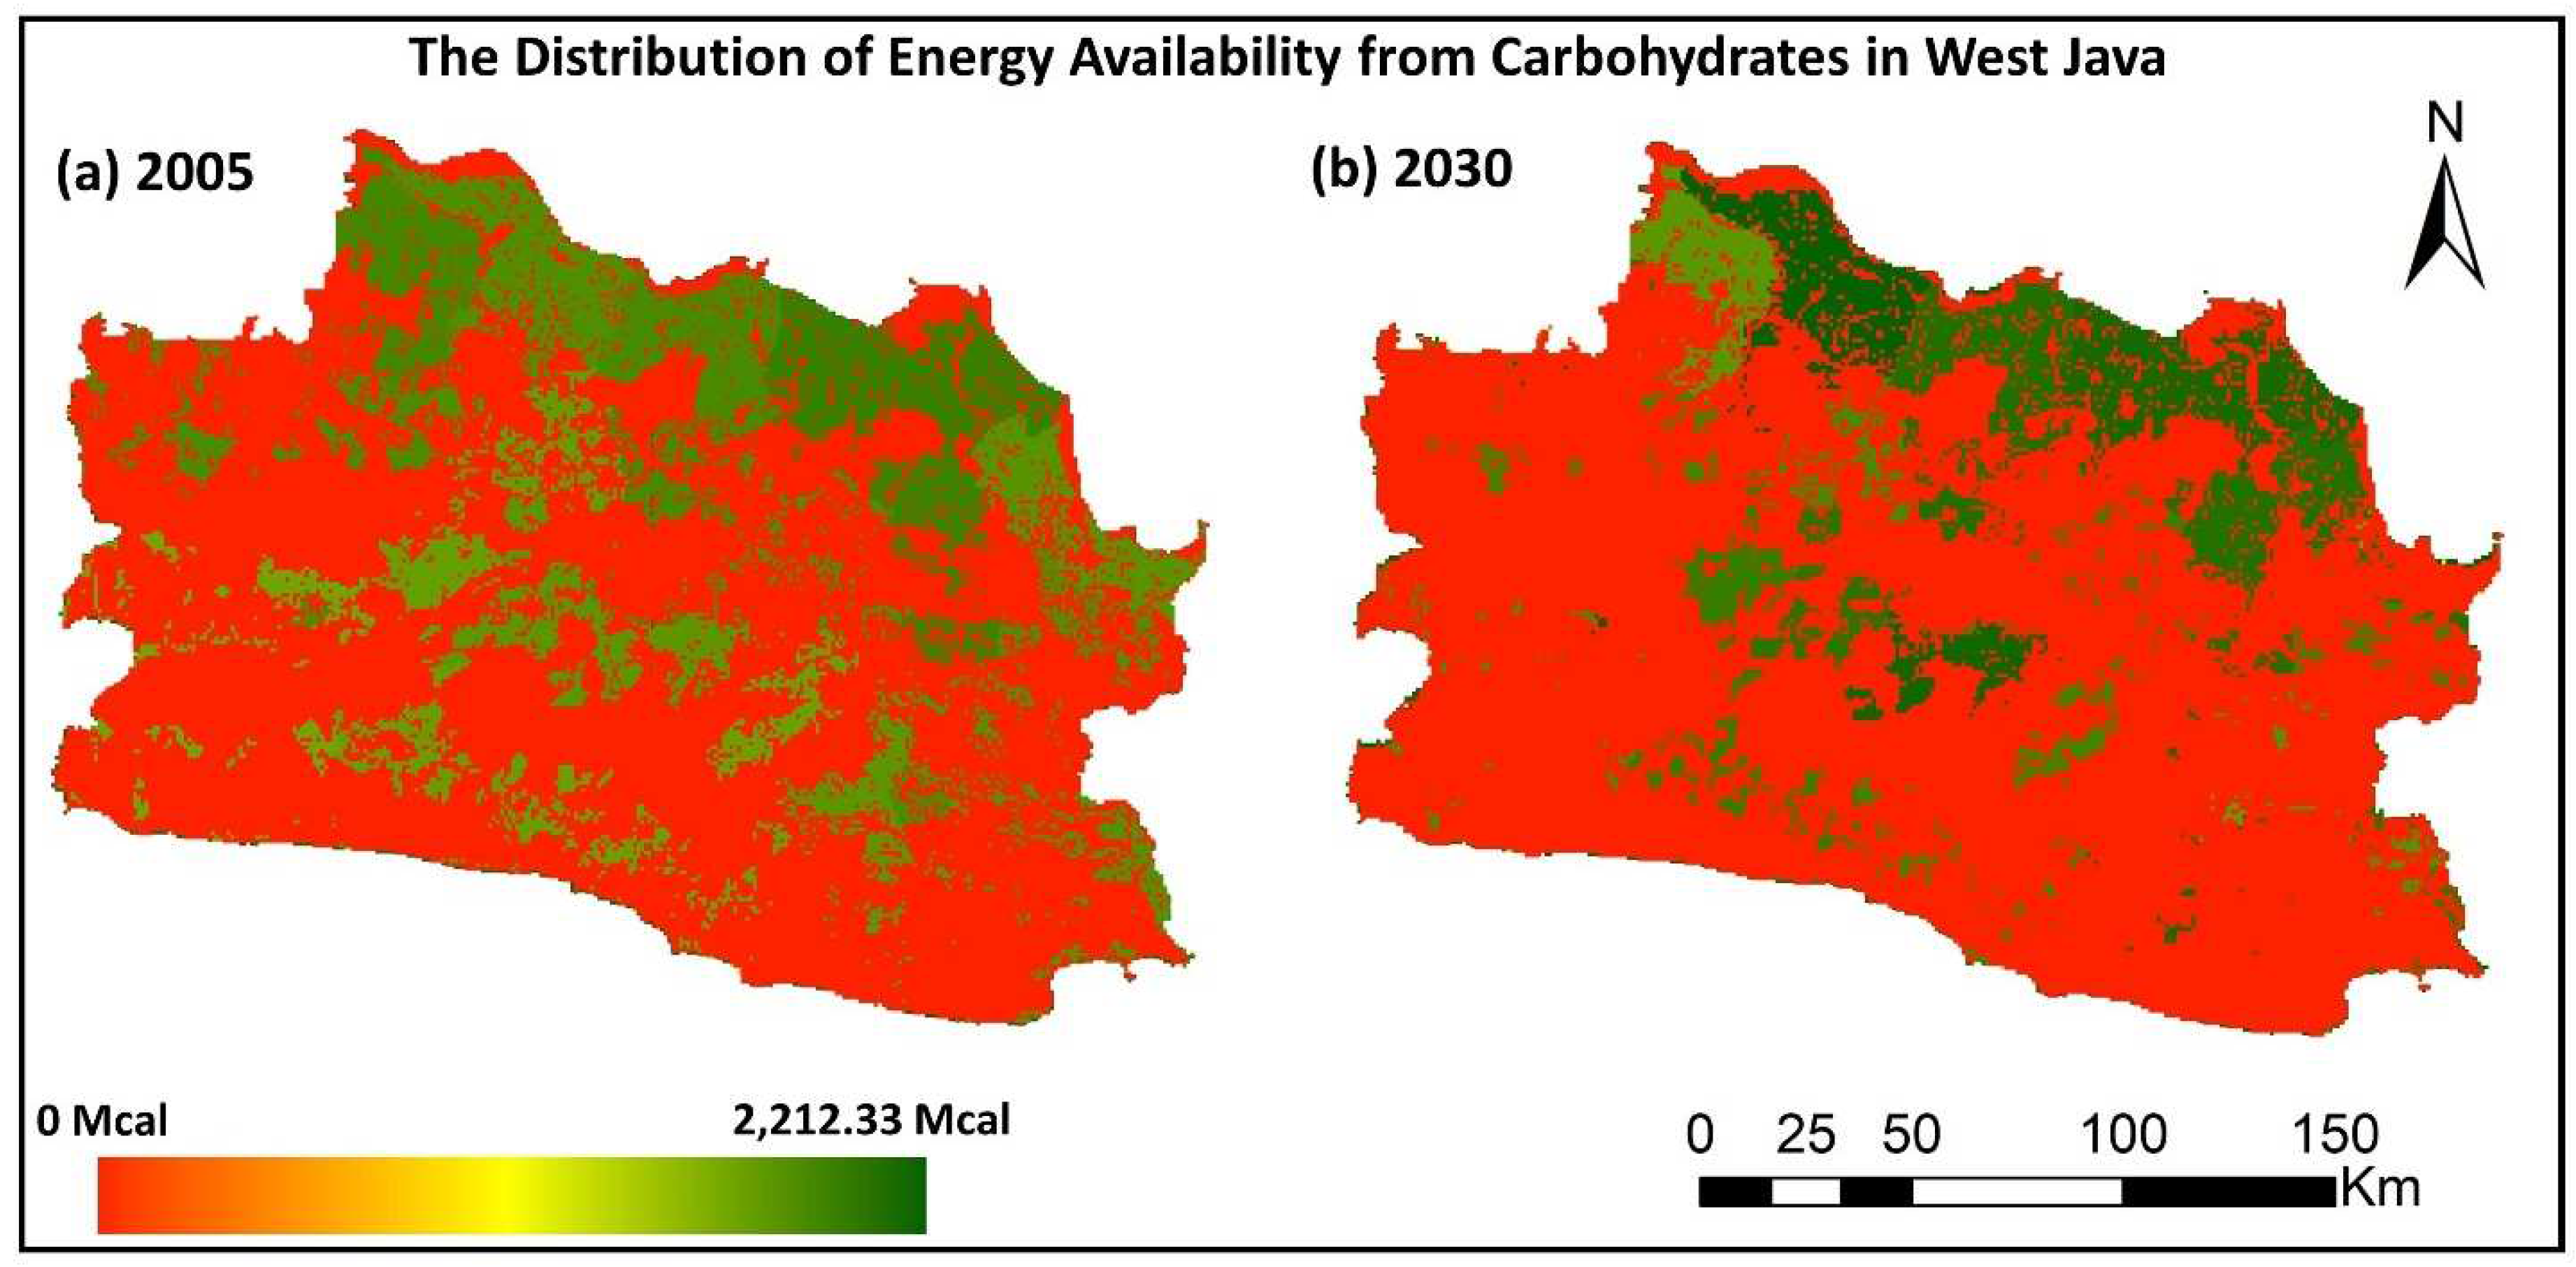
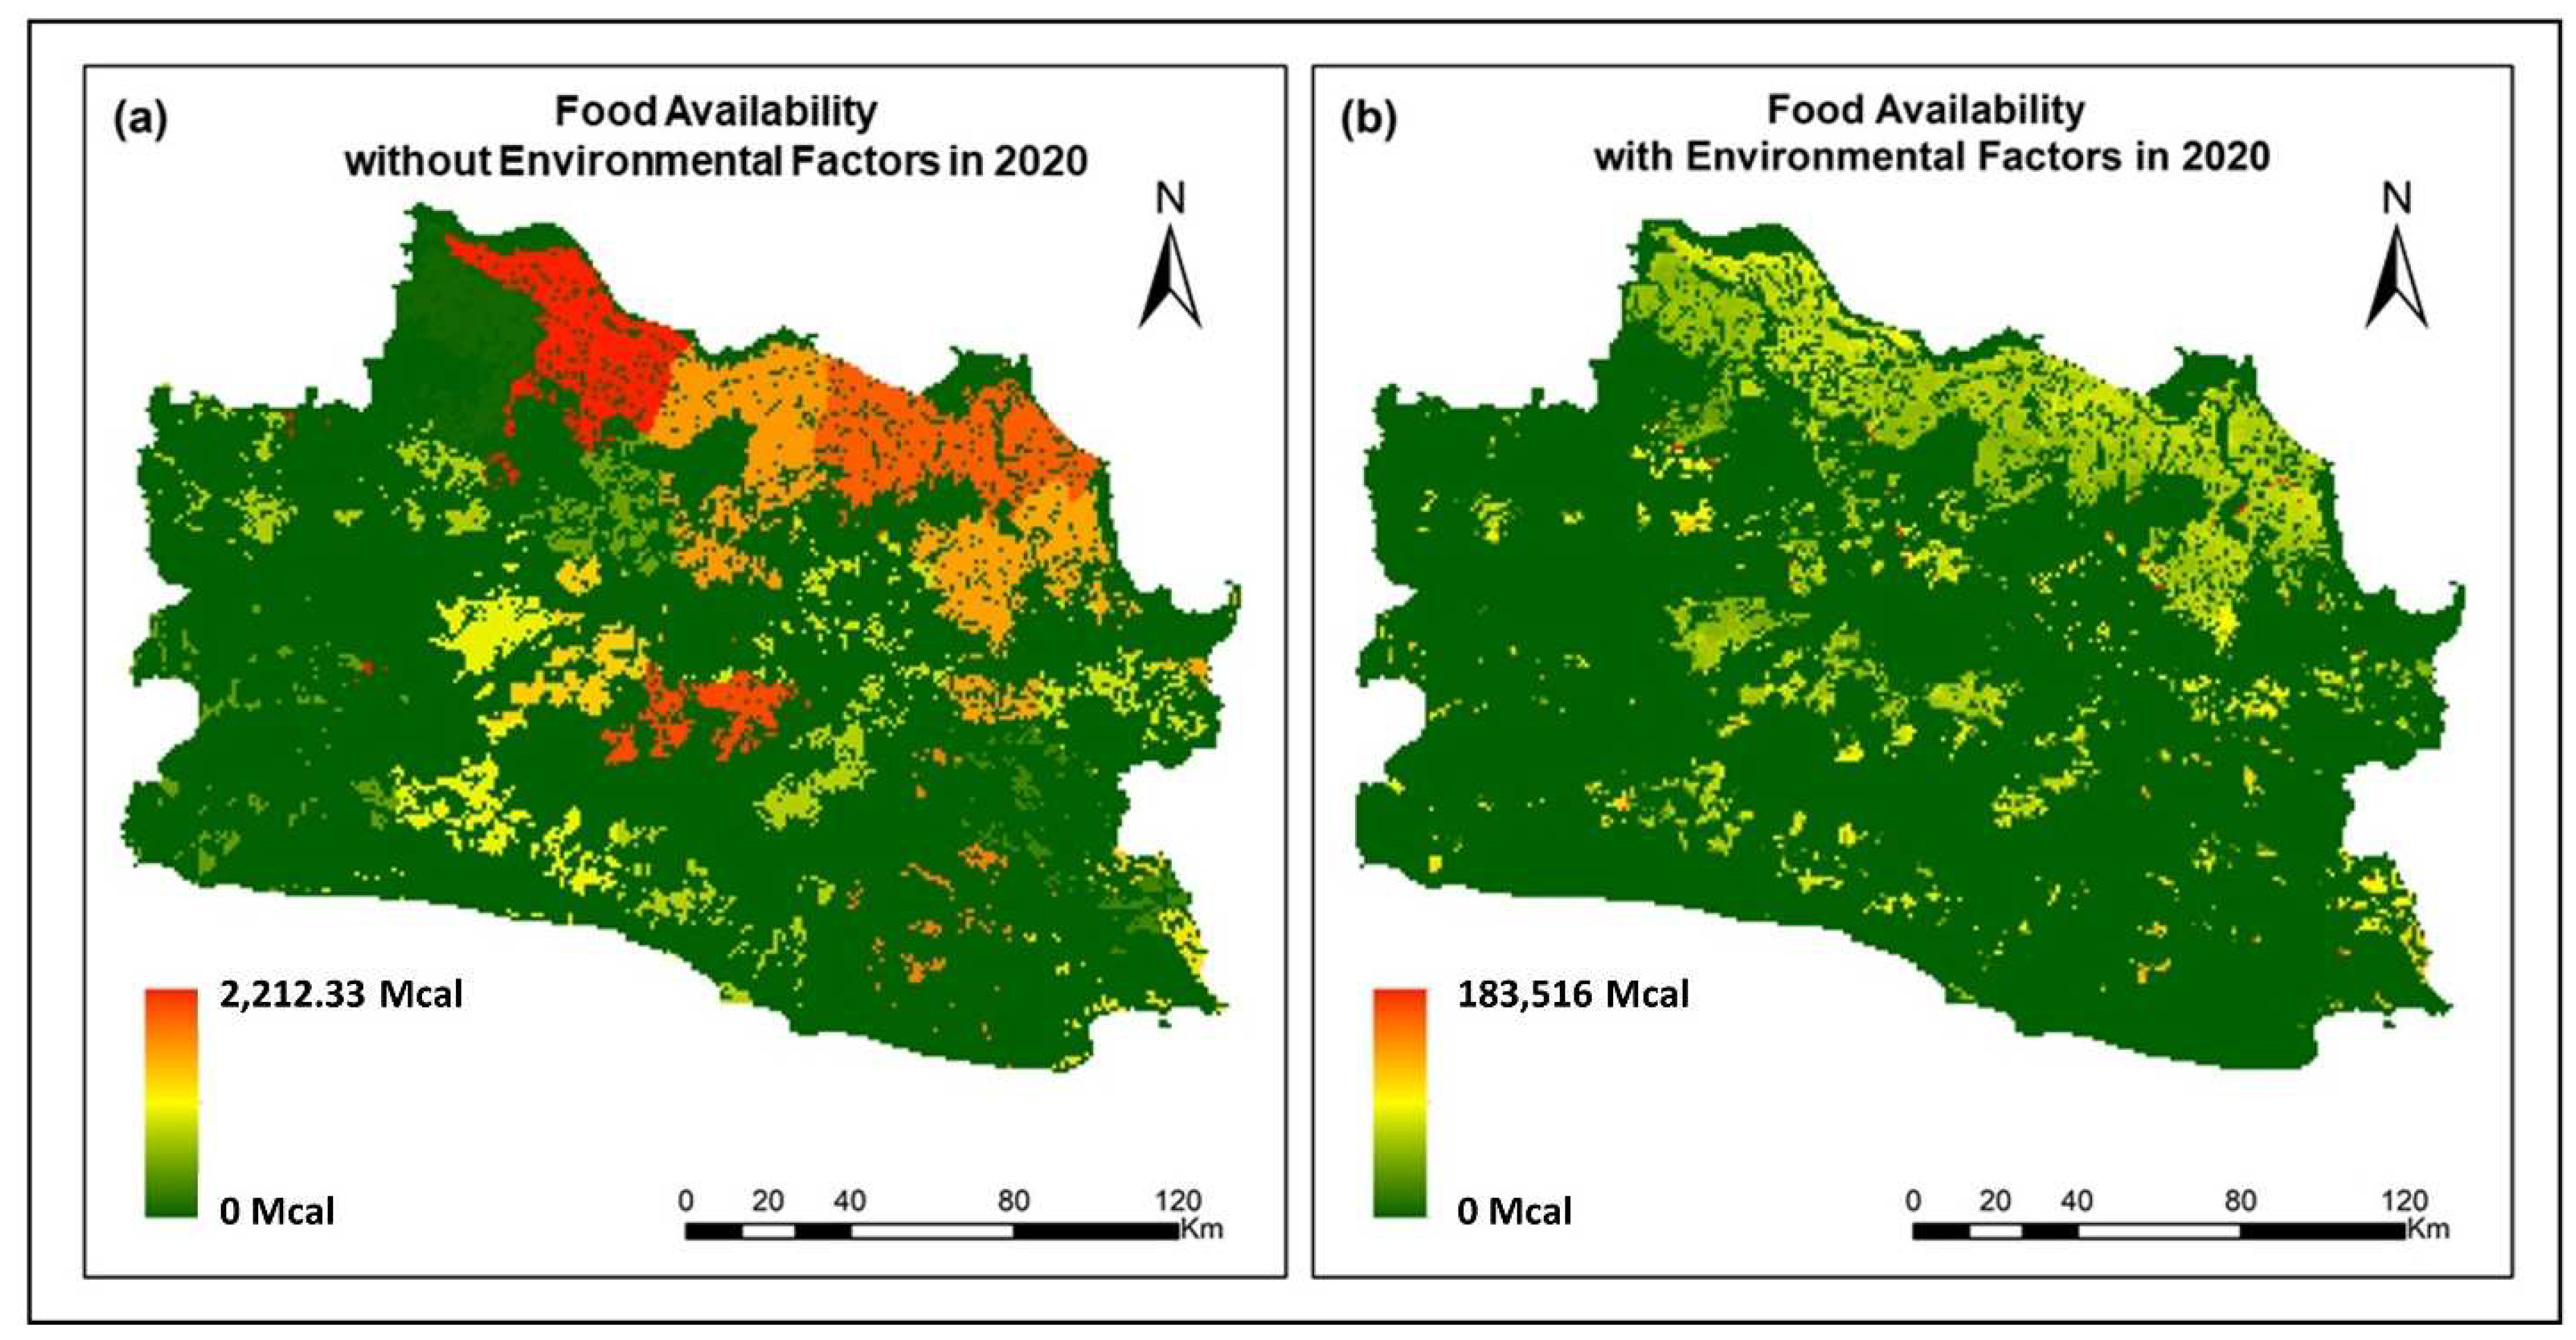
4.4. Prediction of Food Availability by Integrating Paddy Fields Area and Environmental Factors
4.5. Limitation and Future Possible Direction
5. Conclusions
Author Contributions
Funding
Institutional Review Board Statement
Informed Consent Statement
Data Availability Statement
Conflicts of Interest
References
- Nasmiati, C.; Ginting, R.; Rahman, A. Analisis Produksi Dan Ketersediaan Serta Kebutuhan Kedelai Dalam Kaitannya Dengan Ketahanan Pangan Di Provinsi Sumatera Utara. J. Agrica 2014, 7, 13–25. [Google Scholar]
- Constitution 1945 of the Republic of Indonesia. Available online: https://jdih.bapeten.go.id/unggah/dokumen/peraturan/116-full.pdf (accessed on 31 January 2022).
- Webb, K.L. Introduction—Food Banks of the Future: Organizations Dedicated to Improving Food Security and Protecting the Health of the People They Serve. J. Hunger Environ. Nutr. 2013, 8, 257–260. [Google Scholar] [CrossRef]
- Santosa, I.; Gede, M.A.; I Ketut, K.D. Dampak Alih Fungsi Lahan Sawah Terhadap Ketahanan Pangan Beras. 2011. Available online: https://core.ac.uk/download/pdf/35319562.pdf (accessed on 31 January 2022).
- Irawan, B. Konversi Lahan Sawah: Potensi Dampak, Pola Pemanfaatannya, dan Faktor Determinan. Forum Penelit. Agro Ekon. 2005, 23, 1. [Google Scholar] [CrossRef]
- Sampurno, R.M.; Seminar, K.B. Aplikasi Jaringan Syaraf Tiruan Pada Sistem Deteksi Dini Untuk Manajemen Krisis Pangan. J. Teknotan 2017, 11, 68–76. [Google Scholar]
- Villa, J.E.; Henry, A.; Xie, F.; Serraj, R. Hybrid Rice Performance in Environments of Increasing Drought Severity. F. Crop. Res. 2012, 125, 14–24. [Google Scholar] [CrossRef]
- Hawkins, D.B. A First-Order Markov-Chain Model of Zeolite Crystallization. Clays Clay Miner. 1989, 37, 433–438. [Google Scholar] [CrossRef]
- Collins, L. An Introduction to Markov Chain Analysis (Concepts and Techniques in Modern Geography; No. 1); University of East Anglia: Norwich, UK, 1975; pp. 7–12. ISBN 0902246437. [Google Scholar]
- Houet, T.; Hubert-Moy, L. Modeling and Projecting Land-Use and Land-Cover Changes with Cellular Automaton in Considering Landscape Trajectories. EARSeL eProceedings 2006, 5, 63–76. [Google Scholar]
- Liu, Y.; Phinn, S.R. Modelling Urban Development with Cellular Automata Incorporating Fuzzy-Set Approaches. Comput. Environ. Urban Syst. 2003, 27, 637–658. [Google Scholar] [CrossRef]
- Wang, S.W.; Munkhnasan, L.; Lee, W.-K. Land Use and Land Cover Change Detection and Prediction in Bhutan’s High Altitude City of Thimphu, Using Cellular Automata and Markov Chain. Environ. Chall. 2021, 2, 100017. [Google Scholar] [CrossRef]
- Farrukh, M.U.; Bashir, M.K.; Hassan, S.; Adil, S.A.; Kragt, M.E. Mapping the Food Security Studies in India, Pakistan and Bangladesh: Review of Research Priorities and Gaps. Glob. Food Sec. 2020, 26, 100370. [Google Scholar] [CrossRef]
- Rahman, M.A.; Kang, S.; Nagabhatla, N.; Macnee, R. Impacts of Temperature and Rainfall Variation on Rice Productivity in Major Ecosystems of Bangladesh. Agric. Food Secur. 2017, 6, 1–11. [Google Scholar] [CrossRef] [Green Version]
- dela Torre, D.M.G.; Gao, J.; Macinnis-Ng, C. Remote Sensing-Based Estimation of Rice Yields Using Various Models: A Critical Review. Geo-Spat. Inf. Sci. 2021, 24, 580–603. [Google Scholar] [CrossRef]
- Kuenzer, C.; Knauer, K. Remote Sensing of Rice Crop Areas. Int. J. Remote Sens. 2013, 34, 2101–2139. [Google Scholar] [CrossRef]
- Wang, C.; Zhang, Z.; Zhang, J.; Tao, F.; Chen, Y.; Ding, H. The Effect of Terrain Factors on Rice Production: A Case Study in Hunan Province. J. Geogr. Sci. 2019, 29, 287–305. [Google Scholar] [CrossRef] [Green Version]
- Estiningtyas, W.; Dermoredjo, S.K. Characteristics and Farmer’s Response to Climate Variability to Support Sustainable Agriculture: Case Study in Tasikmalaya, West Java. In IOP Conference Series: Earth and Environmental Science, Proceedings of the 2nd International Conference on Sustainable Agriculture for Rural Development 2020, Purwokerto, Indonesia, 20 October 2020; IOP Publishing: Bristol, UK, 2021; Volume 653, p. 12004. [Google Scholar]
- Badan Pusat Statistik Luas Panen Dan Produksi Padi Di Indonesia. 2019. Available online: https://www.bps.go.id/publication/2020/12/01/21930121d1e4d09459f7e195/luas-panen-dan-produksi-padi-di-indonesia-2019.html (accessed on 12 December 2021).
- Badan Pusat Statistik Indonesia. Kajian Konsumsi Bahan Pokok Tahun 2017; Pariwisata, S.S., Ed.; Badan Pusat Statistik Republik Indonesia: Jakarta, Indonesia, 2019; ISBN 978-602-438-277-3. [Google Scholar]
- USGS. Landsat Collection 2 Level-2 Science Products|U.S. Geological Survey. Available online: https://www.usgs.gov/landsat-missions/landsat-collection-2-level-2-science-products (accessed on 12 December 2021).
- Wan, Z.; Hook, S.; Hulley, G. MOD11A2 MODIS/Terra Land Surface Temperature/Emissivity 8-Day L3 Global 1 km SIN Grid V006. Available online: https://lpdaac.usgs.gov/products/mod11a2v006/ (accessed on 17 February 2022).
- University of Idaho TerraClimate: Monthly Climate and Climatic Water Balance for Global Terrestrial Surface. Available online: https://www.climatologylab.org/terraclimate.html (accessed on 12 December 2021).
- NASA; GSFC; NASA-USDA. Enhanced SMAP Global Soil Moisture Data. Available online: https://gimms.gsfc.nasa.gov/SMOS/SMAP/ (accessed on 12 December 2021).
- NASA LP DAAC. MOD13Q1.061 Terra Vegetation Indices 16-Day Global 250m. Available online: https://lpdaac.usgs.gov/products/mod13q1v061/ (accessed on 12 December 2021).
- Bappeda Jawa Barat Jabar Satu Pembangunan. Available online: http://bappeda.jabarprov.go.id/ (accessed on 12 December 2021).
- Kementerian Pertanian Republik Indonesia Luas Panen Dan Produktivitas Padi Di Indonesia. Available online: https://www.pertanian.go.id/home/?show=page&act=view&id=61 (accessed on 12 December 2021).
- Badan Pusat Statistik Proyeksi Penduduk Kabupaten/Kota Provinsi Jawa Barat 2015–2025. Available online: https://jabar.bps.go.id/publication/2019/02/13/f29be7065b314c975b00fccf/proyeksi-penduduk-kabupaten-kota-provinsi-jawa-barat-2015-2025-hasil-supas-2015.html (accessed on 12 December 2021).
- Farr, T.G.; Rosen, P.A.; Caro, E.; Crippen, R.; Duren, R.; Hensley, S.; Kobrick, M.; Paller, M.; Rodriguez, E.; Roth, L. The Shuttle Radar Topography Mission. Rev. Geophys. 2007, 45, 2. [Google Scholar] [CrossRef] [Green Version]
- Kang, J.; Fang, L.; Li, S.; Wang, X. Parallel Cellular Automata Markov Model for Land Use Change Prediction over MapReduce Framework. ISPRS Int. J. Geo-Inf. 2019, 8, 454. [Google Scholar] [CrossRef] [Green Version]
- Halmy, M.W.A.; Gessler, P.E.; Hicke, J.A.; Salem, B.B. Land Use/Land Cover Change Detection and Prediction in the North-Western Coastal Desert of Egypt Using Markov-CA. Appl. Geogr. 2015, 63, 101–112. [Google Scholar] [CrossRef]
- Sharma, R.; Nehren, U.; Rahman, S.A.; Meyer, M.; Rimal, B.; Aria Seta, G.; Baral, H. Modeling Land Use and Land Cover Changes and Their Effects on Biodiversity in Central Kalimantan, Indonesia. Land 2018, 7, 57. [Google Scholar] [CrossRef] [Green Version]
- Thanutgit, T.; Piyathamrongchai, K.; Choosumrong, S. Modelling Land Use Change Using Cellular Automata Model: A Case Study of Wangthong City, Phitsanulok, Thailand. In Proceedings of the International Conference on GeoInformatics for Spatial-Infrastructure Development in Earth & Allied Sciences (GIS-IDEAS), Hanoi, Vietnam, 12–15 November 2016. [Google Scholar]
- Deliar, A. Pemodelan Hibrid Dalam Prediksi Dinamika Perubahan Tutupan Lahan (Studi Kasus: Wilayah Bandung); Institut Teknologi: Bandung, Indonesia, 2010. [Google Scholar]
- Benenson, I.; Torrens, P. Geosimulation: Automata-Based Modeling of Urban Phenomena; John Wiley & Sons, The Atrium, Southern Gate: Chichester, UK, 2004; ISBN 0470843497. [Google Scholar]
- Abdallah, S.; Hemdan, S.; Ibrahem, K. Assessment of Land Use/Land Cover Changes Induced by Jizan Dam, Saudi Arabia, and Their Effect on Soil Organic Carbon. Arab. J. Geosci. 2019, 12, 350. [Google Scholar] [CrossRef]
- Shao, Z.; Fu, H.; Fu, P.; Yin, L. Mapping Urban Impervious Surface by Fusing Optical and SAR Data at the Decision Level. Remote Sens. 2016, 8, 945. [Google Scholar] [CrossRef] [Green Version]
- Strahler, A.H.; Boschetti, L.; Foody, G.M.; Friedl, M.A.; Hansen, M.C.; Herold, M.; Mayaux, P.; Morisette, J.T.; Stehman, S.V.; Woodcock, C.E. Global Land Cover Validation: Recommendations for Evaluation and Accuracy Assessment of Global Land Cover Maps. Eur. Communities Luxemb. 2006, 51, 1–60. [Google Scholar]
- Finegold, Y.; Ortmann, A.; Lindquist, E.; D’annunzio, R.; Sandker, M. Map Accuracy Assessment and Area Estimation Map Accuracy Assessment and Area Estimation: A Practical Guide. Food Agric. Organ. United Nations Natl. For. Monit. Assess. Work. Pap. 2016, 46, 69. [Google Scholar]
- Rosenfield, G.H.; Fitzpatrick-Lins, K. A Coefficient of Agreement as a Measure of Thematic Classification Accuracy. Photogramm. Eng. Remote Sens. 1986, 52, 223–227. [Google Scholar]
- Ministry of Agriculture of the Republic of Indonesia Pusat Ketersediaan Dan Kerawanan Pangan—FSVA. Available online: http://pusatkkp.bkp.pertanian.go.id/web/menu-fsva (accessed on 29 December 2021).
- Mayangsari, M. Pemetaan Distribusi Penduduk Untuk Setiap Klasifikasi Sosial Ekonomi Dalam Skala Ragam Grid 5” dan Grid 30” di Kota Bandung. Teknol. J. Ilm. Dan Teknol. 2020, 2, 20–26. [Google Scholar] [CrossRef]
- Ministry of Health of the Republic of Indonesia. Regulation of the Minister of Health of the Republic of Indonesia Number 28 of 2019 Concerning the Recommended Nutritional Adequacy Rate for the Indonesian People; Ministry of Health of the Republic of Indonesia: Jakrta, Indonesia, 2017. [Google Scholar]
- Nengsih, S.R. Pembangunan Model Distribusi Populasi Penduduk Resolusi Tinggi Untuk Wilayah Indonesia Menggunakan Sistem Grid Skala Ragam. GEOMATIKA 2015, 21, 31–36. [Google Scholar]
- Ministry of Health of the Republic of Indonesia. Table of Indonesian Food Composition in 2017; Ministry of Health of the Republic of Indonesia: Bogor, Indonesia, 2017. [Google Scholar]
- Minister of Agriculture Regulation. Pedoman Kesesuaian Lahan Pada Tanaman Pangan; Number 79/Permentan/OT.140/8/2013; Minister of Agriculture Regulation: Jakarta, Indonesia, 2013. [Google Scholar]
- Prasetyo, Y.; Sukmono, A.; Aziz, K.W.; Aji, B.J.P.S. Rice Productivity Prediction Model Design Based on Linear Regression of Spectral Value Using NDVI and LSWI Combination on Landsat-8 Imagery. In IOP Conference Series: Earth and Environmental Science, Proceedings of the 3rd International Conference of Indonesia Society for Remote Sensing (ICOIRS 2017), Semarang, Indonesia, 31 October–1 November 2017; IOP Publishing: Bristol, UK, 2018; Volume 165, p. 12002. [Google Scholar]
- Du, T.L.T.; Bui, D.D.; Nguyen, M.D.; Lee, H. Satellite-Based, Multi-Indices for Evaluation of Agricultural Droughts in a Highly Dynamic Tropical Catchment, Central Vietnam. Water 2018, 10, 659. [Google Scholar] [CrossRef] [Green Version]
- Lee, S.-J.; Cho, J.; Hong, S.; Ha, K.-J.; Lee, H.; Lee, Y.-W. On the Relationships between Satellite-Based Drought Index and Gross Primary Production in the North Korean Croplands, 2000–2012. Remote Sens. Lett. 2016, 7, 790–799. [Google Scholar] [CrossRef]
- Huang, M.; Zhang, W.; Jiang, L.; Zou, Y. Impact of Temperature Changes on Early-Rice Productivity in a Subtropical Environment of China. F. Crop. Res. 2013, 146, 10–15. [Google Scholar] [CrossRef]
- Rossato, L.; Alvalá, R.C.; Marengo, J.A.; Zeri, M.; Cunha, A.P.M.; Pires, L.; Barbosa, H.A. Impact of Soil Moisture on Crop Yields over Brazilian Semiarid. Front. Environ. Sci. 2017, 5, 73. [Google Scholar] [CrossRef] [Green Version]
- Zhou, Z.; Jin, J.; Wang, L. Modeling the Effects of Elevation and Precipitation on Rice (Oryza Sativa L.) Production Considering Multiple Planting Methods and Cultivars in Central China. Sci. Total Environ. 2021, 813, 152679. [Google Scholar] [CrossRef]
- Demirci, M.; Baltaci, A. Prediction of Suspended Sediment in River Using Fuzzy Logic and Multilinear Regression Approaches. Neural Comput. Appl. 2013, 23, 145–151. [Google Scholar] [CrossRef]
- Abba, S.I.; Hadi, S.J.; Abdullahi, J. River Water Modelling Prediction Using Multi-Linear Regression, Artificial Neural Network, and Adaptive Neuro-Fuzzy Inference System Techniques. Procedia Comput. Sci. 2017, 120, 75–82. [Google Scholar] [CrossRef]
- Malczewski, J.; Rinner, C. Multicriteria Decision Analysis in Geographic Information Science; Springer: New York, NY, USA, 2015; Volume 1. [Google Scholar]
- Jenks, G.F. The Data Model Concept in Statistical Mapping. Int. Yearb. Cartogr. 1967, 7, 186–190. [Google Scholar]
- Ratner, B. The Correlation Coefficient: Its Values Range Between +1/−1, or Do They? J. Target. Meas. Anal. Mark. 2009, 17, 139–142. [Google Scholar] [CrossRef] [Green Version]
- Ministry of Agriculture of the Republic of Indonesia Pencarian Data Dengan Keluaran Berdasarkan Indikator. Available online: https://aplikasi2.pertanian.go.id/bdsp/id/indikator (accessed on 20 October 2021).
- Landis, J.R.; Koch, G.G. The Measurement of Observer Agreement for Categorical Data. Biometrics 1977, 33, 159–174. [Google Scholar] [CrossRef] [Green Version]
- Hereher, M.E. Recent Trends of Temperature and Precipitation Proxies in Saudi Arabia: Implications for Climate Change. Arab. J. Geosci. 2016, 9, 575. [Google Scholar] [CrossRef]
- Russell, J.; Flood, V.; Yeatman, H.; Mitchell, P. Food Security in Older Australians. J. Nutr. Educ. Behav. 2011, 43, e1. [Google Scholar] [CrossRef]
- Gregory, P.J.; Ingram, J.S.I.; Brklacich, M. Climate Change and Food Security. Philos. Trans. R. Soc. B Biol. Sci. 2005, 360, 2139–2148. [Google Scholar] [CrossRef]
- Garrett, J.L.; Ruel, M.T. Are Determinants of Rural and Urban Food Security and Nutritional Status Different? Some Insights from Mozambique. World Dev. 1999, 27, 1955–1975. [Google Scholar] [CrossRef]
- Ruiter, D.W.P. A New Conceptual Framework. In Legal Institutions; Springer: Dordrecht, The Netherlands, 2001; Volume 55, pp. 1–27. [Google Scholar] [CrossRef]
- FAO. The Food System and Factors Affecting Household Food Security and Nutrition. In Agriculture, Food and Nutrition for Africa: A Resource Book for Teachers of Agriculture; Agriculture and Consumer Protection Department Rome: Rome, Italy, 1997; ISBN 9780128209325. [Google Scholar]
- Napoli, M.; De Muro, P.; Mazziotta, P.M. Towards a Food Insecurity Multidimensional Index; FIMI: Milano, Italy, 2011. [Google Scholar]
- Han, H.; Yang, C.; Song, J. Scenario Simulation and the Prediction of Land Use and Land Cover Change in Beijing, China. Sustainability 2015, 7, 4260–4279. [Google Scholar] [CrossRef] [Green Version]
- Wilson, T. A Review of Sub-Regional Population Projection Methods; Research Gate: Brisbane, QLD, Australia, 2011. [Google Scholar]
- Gaughan, A.E.; Stevens, F.R.; Linard, C.; Jia, P.; Tatem, A.J. High Resolution Population Distribution Maps for Southeast Asia in 2010 and 2015. PLoS ONE 2013, 8, e55882. [Google Scholar] [CrossRef] [PubMed]
- Chhay, N.; Seng, S.; Tanaka, T.; Yamauchi, A.; Cedicol, E.C.; Kawakita, K.; Chiba, S. Rice Productivity Improvement in Cambodia through the Application of Technical Recommendation in a Farmer Field School. Int. J. Agric. Sustain. 2017, 15, 54–69. [Google Scholar] [CrossRef]
- Tang, Y.; Zhang, F.; Engel, B.A.; Liu, X.; Yue, Q.; Guo, P. Grid-Scale Agricultural Land and Water Management: A Remote-Sensing-Based Multiobjective Approach. J. Clean. Prod. 2020, 265, 121792. [Google Scholar] [CrossRef]
- Ihsan, K.T.N.; Sakti, A.D.; Wikantika, K. Geospatial Assessment for Planning a Smart Energy City Using Rooftop Solar Photovoltaic in Bandung City, Indonesia. Int. Arch. Photogramm. Remote Sens. Spat. Inf. Sci. 2021, XLIV-M–3, 83–87. [Google Scholar] [CrossRef]
- Gökgöz, F.; Güvercin, M.T. Energy Security and Renewable Energy Efficiency in EU. Renew. Sustain. Energy Rev. 2018, 96, 226–239. [Google Scholar] [CrossRef]
- Campbell, C.; Keller, D.; Mancini, J. Geohazards and Climate Security and Resilience at United States Diplomatic Missions. In Geo-Extreme; American Society of Civil Engineers: Reston, VA, USA, 2021; pp. 299–308. [Google Scholar]
- Sakti, A.D.; Fauzi, A.I.; Takeuchi, W.; Pradhan, B.; Yarime, M.; Vega-Garcia, C.; Agustina, E.; Wibisono, D.; Anggraini, T.S.; Theodora, M.O. Spatial Prioritization for Wildfire Mitigation by Integrating Heterogeneous Spatial Data: A New Multi-Dimensional Approach for Tropical Rainforests. Remote Sens. 2022, 14, 543. [Google Scholar] [CrossRef]
- Sakti, A.D.; Rahadianto, M.A.E.; Pradhan, B.; Muhammad, H.N.; Andani, I.; Sarli, P.W.; Abdillah, M.R.; Anggraini, T.S.; Purnomo, A.D.; Ridwana, R. School Location Analysis by Integrating the Accessibility, Natural and Biological Hazards to Support Equal Access to Education. ISPRS Int. J. Geo-Inf. 2022, 11, 12. [Google Scholar] [CrossRef]
- Sakti, A.D.; Rinasti, A.N.; Agustina, E.; Diastomo, H.; Muhammad, F.; Anna, Z.; Wikantika, K. Multi-Scenario Model of Plastic Waste Accumulation Potential in Indonesia Using Integrated Remote Sensing, Statistic and Socio-Demographic Data. ISPRS Int. J. Geo-Inf. 2021, 10, 481. [Google Scholar] [CrossRef]


| No | Data | Product | Temporal Resolution | Spatial Resolution | References |
|---|---|---|---|---|---|
| 1 | Landsat-8 | USGS Landsat 8 Level 2, Collection 2, Tier 1 | 16 Days | 30 m (Raster Data) | [21] |
| 2 | Land Surface Temperature (LST) (Celsius) | MOD11A2.006 Terra Land Surface Temperature and Emissivity 8-Day Global 1 km | 8 Days | 1 km (Raster Data) | [22] |
| 3 | Precipitation (mm/day) | TerraClimate: Monthly Climate and Climatic Water Balance for Global Terrestrial Surfaces, University of Idaho | Monthly | 4638.3 m (Raster Data) | [23] |
| 4 | Soil Moisture (%) | NASA-USDA Enhanced SMAP Global Soil Moisture Data | 3 Days | 10 km (Raster Data) | [24] |
| 5 | Normalized Difference Vegetation Index | MOD13Q1.006 Terra Vegetation Indices 16-Day Global 250 m | 16 Days | 250 m (Raster Data) | [25] |
| 6 | Administrative boundaries | West Java Regional Planning Agency | - | 1:25,000 (Vector Data) | [26] |
| 7 | West Java Land Cover | West Java Regional Planning Agency | 2005 2010 | 30 m | [26] |
| 8 | West Java Paddy fields Productivity (ton/km2) | Ministry of Agriculture Republic of Indonesia | Yearly | City/ District level (Tabular Data) | [27] |
| 9 | West Java Population (person) | Indonesian Central Statistics Agency | Yearly | City/ District level (Tabular Data) | [28] |
| 10 | Digital Elevation Model (DEM) (meter) | NASA | - | 30 m (Raster Data) | [29] |
| Skor | Land Cover | Skor | Land Cover |
|---|---|---|---|
| 0.328 | Built up area | 0.018 | Shrubs |
| 0.048 | Rice field | 0.009 | Forest |
| 0.038 | Mine/Pond/Swamp | 0.002 | Plantation |
| 0.029 | Field/Moor | 0 | River/Lake/Reservoir |
| Years | Area (Ha) |
|---|---|
| 2005 | 1,069,095.78 |
| 2010 | 969,582.87 |
| 2015 | 885,170.05 |
| 2020 | 812,641.31 |
| 2025 | 750,275.99 |
| 2030 | 697,064.57 |
| Cross Tabulation 2005 and 2030 | ||||||||
|---|---|---|---|---|---|---|---|---|
| Unit (km sq) | Forest | Field/Moor | Plantation | Urban | Paddy Fields | Check/Shrub | Rivers/Lakes/Reservoirs | Pond/Swamp |
| Forest | 508.54491 | 4.70952 | 0.61047 | 0.00414 | 0.2106 | 2.29113 | 0 | 0 |
| Field/Moor | 114.94971 | 1276.56603 | 52.35633 | 5.05107 | 340.09515 | 48.49614 | 0.43515 | 0 |
| Plantation | 1.19673 | 5.81022 | 121.44402 | 0.01989 | 0.40959 | 6.65658 | 0.02052 | 0 |
| Urban | 3.93597 | 83.34171 | 6.48693 | 265.81608 | 55.58004 | 1.79244 | 0.02061 | 0.28854 |
| Paddy Fields | 8.68122 | 11.21238 | 2.44422 | 2.30094 | 672.36723 | 0.56376 | 0.05535 | 0.08199 |
| Check/Shrub | 1.0701 | 0.12555 | 0.00018 | 0 | 0..03213 | 7.22286 | 0.15219 | 0 |
| Rivers/Lakes/Reservoirs | 0.01323 | 0.01125 | 0 | 0.00945 | 0.00639 | 0.01764 | 24.91749 | 0.00198 |
| Pond/Swamp | 0.06417 | 0.24057 | 0 | 0 | 0.39465 | 0 | 0.01035 | 69.49602 |
| Reference | ||||||||||
|---|---|---|---|---|---|---|---|---|---|---|
| Unit (km sq) | Water Bodies | Paddy Fields | Urban | Vegetation | Total | Commission Error | Mapping Accuracy | Overall Accuracy | Kappa | |
| Classification | Water Bodies | 18 | 5 | 2 | 0 | 25 | 28% | 0.72000 | 93% | 0.9067 |
| Paddy Fields | 0 | 25 | 0 | 0 | 25 | 0% | 0.83333 | |||
| Urban | 0 | 0 | 25 | 0 | 25 | 0% | 0.92593 | |||
| Vegetation | 0 | 0 | 0 | 25 | 25 | 0% | 1.00000 | |||
| Total | 18 | 30 | 27 | 0 | 100 | |||||
| Omission Error | 0% | 16.67% | 7.41% | 0% | ||||||
Publisher’s Note: MDPI stays neutral with regard to jurisdictional claims in published maps and institutional affiliations. |
© 2022 by the authors. Licensee MDPI, Basel, Switzerland. This article is an open access article distributed under the terms and conditions of the Creative Commons Attribution (CC BY) license (https://creativecommons.org/licenses/by/4.0/).
Share and Cite
Virtriana, R.; Riqqi, A.; Anggraini, T.S.; Fauzan, K.N.; Ihsan, K.T.N.; Mustika, F.C.; Suwardhi, D.; Harto, A.B.; Sakti, A.D.; Deliar, A.; et al. Development of Spatial Model for Food Security Prediction Using Remote Sensing Data in West Java, Indonesia. ISPRS Int. J. Geo-Inf. 2022, 11, 284. https://doi.org/10.3390/ijgi11050284
Virtriana R, Riqqi A, Anggraini TS, Fauzan KN, Ihsan KTN, Mustika FC, Suwardhi D, Harto AB, Sakti AD, Deliar A, et al. Development of Spatial Model for Food Security Prediction Using Remote Sensing Data in West Java, Indonesia. ISPRS International Journal of Geo-Information. 2022; 11(5):284. https://doi.org/10.3390/ijgi11050284
Chicago/Turabian StyleVirtriana, Riantini, Akhmad Riqqi, Tania Septi Anggraini, Kamal Nur Fauzan, Kalingga Titon Nur Ihsan, Fatwa Cahya Mustika, Deni Suwardhi, Agung Budi Harto, Anjar Dimara Sakti, Albertus Deliar, and et al. 2022. "Development of Spatial Model for Food Security Prediction Using Remote Sensing Data in West Java, Indonesia" ISPRS International Journal of Geo-Information 11, no. 5: 284. https://doi.org/10.3390/ijgi11050284
APA StyleVirtriana, R., Riqqi, A., Anggraini, T. S., Fauzan, K. N., Ihsan, K. T. N., Mustika, F. C., Suwardhi, D., Harto, A. B., Sakti, A. D., Deliar, A., Soeksmantono, B., & Wikantika, K. (2022). Development of Spatial Model for Food Security Prediction Using Remote Sensing Data in West Java, Indonesia. ISPRS International Journal of Geo-Information, 11(5), 284. https://doi.org/10.3390/ijgi11050284