Article

Spatial Pattern of the Walkability Index, Walk Score and Walk Score Modification for Elderly

1
Department of Geoinformatics, VSB—Technical University of Ostrava, FMG, 17. listopadu 2172/15, Poruba, 70800 Ostrava, Czech Republic
2
Department of Economics, University of Hradec Králové, FIM, Rokitanského 62, 50003 Hradec Kralove, Czech Republic
*
Author to whom correspondence should be addressed.
ISPRS Int. J. Geo-Inf. 2022, 11(5), 279; https://doi.org/10.3390/ijgi11050279
Submission received: 24 February 2022 / Revised: 13 April 2022 / Accepted: 26 April 2022 / Published: 27 April 2022

Abstract

:
Contemporary cities require excellent walking conditions to support human physical activity, increase humans’ well-being, reduce traffic, and create a healthy urban environment. Various indicators and metrics exist to evaluate walking conditions. To evaluate the spatial pattern of objective-based indicators, two popular indices were selected—the Walkability Index (WAI), representing environmental-based indicators, and Walk Score (WS), which applies an accessibility-based approach. Both indicators were evaluated using adequate spatial units (circle buffers with radii from 400 m to 2414 m) in two Czech cities. A new software tool was developed for the calculation of WS using OSM data and freely available network services. The new variant of WS was specifically designed for the elderly. Differing gait speeds, and variable settings of targets and their weights enabled the adaptation of WS to local conditions and personal needs. WAI and WS demonstrated different spatial pattern where WAI is better used for smaller radii (up to approx. 800 m) and WS for larger radii (starting from 800 m). The assessment of WS for both cities indicates that approx. 40% of inhabitants live in unsatisfactory walking conditions. A sensitivity analysis discovered the major influences of gait speed and the β coefficient on the walkability assessment.

1. Introduction

Walking contributes to a healthy lifestyle. Urban residents’ lack of sufficient physical activity contributes to the development of chronic diseases. Physical inactivity has been noted as the second leading modifiable risk factor for chronic disease after smoking and contributes significantly to total mortality in Western countries [1,2]. Increasing population-level physical activity and reducing physical activity and health inequalities is a growing interest of policy makers [3,4,5,6].
Mobility is fundamental to active aging [7,8] and is a necessary prerequisite for seniors for their independent way of life and self-reliance, including the capacity to go out [9,10], and to carry out social and leisure activities [10,11]. With aging, declines in health often limit feasible activities [12] and put constraints on one’s capacity to perform daily life activities [11,13]. “Denied accessibility,” when the number of options shrinks, is a greater problem for the elderly [8]. However, seniors form a quite diverse social group [14] with heterogeneous travel behaviour. Many latent psycho-social factors affect their travel behaviour, such as diverse lifestyles and attitudes (e.g., [15]), as well as their self-reported physical and functional abilities (e.g., [12,16]).
Today’s cities focus on their inhabitants and aim to improve the urban environment through a complex set of activities [3,10,17,18]. Building a pleasant environment is essential to the well-being of residents and visitors, but also has a multiplicative synergy effect on business and entrepreneurship. Growing accents on green policy, natural protection, and friendly, safe, and healthy urban environments are leading local governments to progressively restrict individual and commercial motorized transport, namely in city centres, enlarge pedestrian zones, and adopt measures aimed at promoting pedestrians. “Pedestrian first” is a key term for many city representatives. “Cities for all” and a switch of paradigm towards more friendly and inclusive urban environments [8] are now internationally recognised policies (e.g., [1,8,19]). Such improvements positively affect the majority of seniors whether or not they themselves feel physically handicapped. Due to the gradual decline of physical capabilities and frequent temporal restrictions due to episodic health issues in seniors, any decrease in mobility barriers is welcome.
Webber et al. [7] established 5 fundamental categories of mobility determinants—cognitive, psycho-social, physical, environmental, and financial. Those studies addressing environmental factors prevail because they are modifiable and can be addressed by local stakeholders. They exhibit offers of the environment to the inhabitants which can be modified or improved to be more comfortable and attractive and, in turn, motivate people, including seniors, to walk more often.
Many studies explore the physical and environmental characteristics of the built environment to detect which factors influence the “walkability” of the elderly [12,17,20,21,22,23,24,25,26,27,28,29,30] so as to provide useful information for improving pedestrian accessibility. Mainly, higher levels of residential density, street connectivity, and land use mix reported higher walking and cycling frequency [31,32,33,34]. Additional factors may also play an important role in local studies, e.g., geomorphological factors such as the slope of the territory [26,35,36,37], the distribution of landmarks [38,39], block permeability [39,40], functional connotations [39,41], and attractiveness of the urban built environment [39,42,43,44].
Furthermore, the urban built environment is perceived and evaluated differently by different social groups. Differences in perception between adult and senior populations are explicated by [45] who documented that more than 60% of “good” pedestrian network for “adults” in two observed districts of Lisbon was categorised as “fair” or “bad” for seniors.
Scholars have developed more than 80 indicators to assess the walkability of an urban environment [46,47,48]. They are based principally on human perception (usually self-reporting, subjective measures), on measurable characteristics of urban environments (objective measures), or a combination of the two. They analyse urban conditions in different units of space with a variety of settings. However, their usage results in a great variability of operationalisation of relevant factors because any given neighbourhood characteristic can be measured many different ways [49] and their combination is highly affected by inconsistencies [49,50]. Moreover, walkability can be assessed using different spatial units [51] and different methods of aggregation.
Some of the indices enable the target and weight settings to adapt the measurement to local conditions and/or to the requirements of special groups of inhabitants. The question is how to set appropriate weights, targets, and values of distance-decay functions and what the impact of the uncertainty linked to these settings might be.
The goal of this paper is to contribute to the discussion on walkability metrics; we enumerate two mainstream indicators, each based on different approaches for identical spatial units, compare their pattern according to scale, describe differences between adult and elderly populations, and assess the sensitivity of the evaluation based on parameters such as gait speed, distance-decay function and mobility target weighting.
The paper is organized as follows: the background provides a review of different approaches and metrics used for walkability assessment, and two main groups of indicators are exemplified. Later, the configuration of indicators is discussed with a focus on destinations, distance-decay functions, weights, spatial units, search radii, and reasonable walking distances. The third chapter shortly introduces two pilot cities and explains the methods of calculation of two selected indicators, WAI and WS. Appropriate modifications and new software tools are documented. Results for WAI and WS in both cities for four different search radii are presented and discussed. A modification of WS for elderly in Czech conditions is introduced and compared with standard WS. Finally, a sensitivity analysis investigates the impact of different settings on WS for elderly assessment.

2. Background

In one of the most acknowledged analyses, Ewing and Cervero [30] outlined five dimensions of the walking environment influencing travel behaviour and walking. The basic three dimensions [52], i.e., density, destinations and design were later extended by adding—destination accessibility, and distance to transit. These 5 dimensions (5Ds) are often used to propose suitable one-dimensional indicators and allow a complex evaluation of walkability covering the majority of these dimensions. Density is usually measured by indicators such as Household/population density, Job density or Commercial floor area ratio. Diversity can be expressed as Land use mix (entropy index), eventually as Jobs-housing and similar ratios. Design measures include average block size, proportion of four-way intersections, and number of intersections per square mile. Destination accessibility measures ease of access to trip attractions. Distance to transit is usually measured as an average of the shortest routes from the origin to the nearest Public Transport (PT) stop. Coincidence of some of these dimensions frequently causes issues in strong collinearity between the 5Ds [48,53]. Zhang et al. [54] critisize the missing relationship between the dimensions and scale and the lacking guidance for implementation. However, this concept still represents a solid base to understand the main factors affecting walkability. Of course, not all walkability indices address all 5 dimensions. Authors can emphasize specific features with stronger influence in a given environment (e.g., shade or noise [55,56]) or for a specific group of people (e.g., street cleanliness for women’s walkability [57]; or vehicular traffic exposure for school walkability [58]).
Normally, basic environmental characteristics related to propensity to walk are modified for special interest groups such as youth or seniors. In the case of seniors, they are usually elaborated more towards detail urban characteristics (e.g., [19]), emphasizing the essential role of various obstacles and barriers for people with constrained mobility, as well as underlining psychological barriers such as fear of falling, and fear of crime.
Basically, we can classify indices based on measurable objective factors, perception (audit-based, surveys) factors, or a hybrid of the two. According to several authors, objective measures have stronger associations with walking than subjective measures [59,60,61]. In this study, we focus on objective measures which can be well operationalised in Geographic Information System (GIS).
Within the objective measures of walkability, two main approaches are popular:
  • Environmental (statistical) based indicators—calculate local urban characteristics related to walking potential. No distances are taken into account and certain relative measures of neighbourhood conditions such as ratios are applied.
  • Accessibility based indicators—evaluate travel parameters in a road network to selected destinations.
From the point of view of a three-accessible framework [54,62], walking measures are useful to assess local access to facilities (local accessibility) and transit access. Zhang et al. [63] emphasize non-linear and threshold effects of proximity to accessibility, and specification of effective ranges of specific land use variables.
One of the most frequently used environmental-based walkability indices is the Walkability Index (WAI) developed by Frank et al. [64], used in a multitude of available studies [19,28,48,65,66]. WAI evaluates connectivity, heterogeneity of land use, shopping area, and household density.
The Pedestrian Potential Index, based on WAI, evaluates residential density, intersection density, land use mix, and destination density. Due to clear similarity with WAI, results are quite similar to the outputs of WAI [48].
Improved comparability of communities is targeted in the National Walkability Index developed by the Environmental Protection Agency [67]. The index elements include design, distance to transit, and diversity of land use.
Usually, only a few urban textural properties are evaluated in each statistical index. This method is expanded in a new synthetic walkability index [42] where many types of amenities are explored for calculation of amenity density combined with a Shannon diversity index, intersection density, and average elevation and slope as topographical variables.
The dominant representative of accessibility-based walkability indices is Walk Score (WS) [65,68]. WS requires searching for the shortest paths to amenities in 9 categories, evaluating their distance using a specific distance decay function (DDF), applying weights to each category, and reducing the resulting WS in cases of poor pedestrian conditions. Advantages of WS are the evaluation of real network accessibility of the most important destinations, and the system of weighting based on a distance-decay approach [61]. WS is also broadly used by e.g., [19,28,42,66,69], but not worldwide due to data shortages.
WS also represents a start line for various modifications, partly driven by simplification efforts such as replacing network distances with Euclidean ones [42], or motivation to develop a better adapted formula for specific environments such as rapidly urbanizing cities [25].
There are many other walkability indices involving network accessible, objective, measurable components such as the Pedestrian Index of the Environment [48,65,70], the Neighbourhood Destination Accessibility Index [48,65,71], Pedshed [66,69], Movability index [66], and the Pedestrian Potential Index [48].
A mixed evaluation containing both network accessibility measures and statistical properties of the neighbourhood is exemplified by Area Walking Potential [4], assessing accessibility to 9 weighted destination categories (health, public transit, education, open space, social & cultural, non-food retail, financial, food retail and employment), as well as residential density and intersection density as statistical parameters of the neighbourhood. Another mixed index, Peel Walkability Composite Index, [72] consists of 3 equally weighted components where the first component is dedicated to residential density and diversity while the others evaluate network accessibility using access to retail and service outlets, schools and green spaces.

3. Configuration of Indicators

To measure walkability, one must first choose a basic unit of space. Spatial units used for walkability assessment are often administrative units or urban planning units. While urban planning units are the subject of natural development of urban environments, delimitation of administrative units is influenced by policy regulations which do not always conform to real urban catchments; abrupt temporal changes, variability in size, Modifiable Area Unit Problem (MAUP), and strong border effects are some of the typical issues that arise.
Walkability can be assessed for all or selected points (e.g., addresses of residences), but usually a regular grid is applied to provide continuous evaluation of the territory and to eliminate border effects [48] and undesired influences of different size and shape of spatial units. While some authors prefer grids around 100 m (e.g., 80 × 80 m [73], 100 × 100 m [66], 150 m [25], a highly dense grid of 25 m × 25 m is proposed in [12]), and a broader grid of 500 m was employed in assessments of German cities based on the OS-WALK-EU tool [74]. Scholars aim to provide detailed evaluations to address heterogeneous walking conditions, but the settings are seldom justified or explained [48].
Concerning search radius, Lefebvre-Ropars and Morency [48] comment “no consensus has been reached on the size of the catchment area that should be used to measure walkability”. Originally, Perry [75] proposed a 5-min walking distance which is usually translated into a 400 m radius, e.g., [66,76,77,78]. Ref. [12] used the 500 m buffer, [4] used 1000 m network buffer zones in Scotland, [28] a 1.6 km network buffer and [58] a 2 km network buffer around each school. WS extends each network buffer up to 1.5 miles (approx. 2.4 km).
Naturally, the search radius should correspond to acceptable walking distance. Maximal walking distance for people without limitations is usually set at 1–2 km [28,58,61], however some indices use a shorter appropriate walking distance such as 400 m [61,66,79,80]. Recommendations are more variable for seniors, partly due to their diversity of needs and levels of mobility. A common opinion is that seniors fulfil the majority of their needs within 15 min walking from their residence [10]. Some authors distinguish primary and secondary services for the elderly; basic services should be located within 400 m of elderly peoples’ residences, which corresponds to a 5-min walking distance [18], and secondary services should be located within 800 m, or twice the walking distance. Burton and Mitchell [81] argue for longer distances, recommending 500 m for the 1st group and substantially enlarging the second perimeter to not limit elderly people to reaching secondary services during their daily routines.
Also, results of the local survey using the day recognition method in Ostrava and Olomouc, 2014 [82], confirmed longer walking distances. Based on the shape of the cumulative relative frequency graph (Figure 1), common seniors’ walking distances reach up to 700 m, while maximal distances reach up to 1200 m.
One of the most important factors for accessibility-based indices is the selection of destinations. WS investigates accessibility of the following amenities: grocery, restaurants, shopping, coffee, banks, parks, schools, bookstores, and entertainment [83]. These targets should correspond well to general public interests, but not to those of specific groups such as youth or the elderly. Generally, the purposes and destinations of mobility depend on the category of people in question and are based on factors such as age, economic status, and cultural/geographical differences (e.g., the most visited destinations in Saudi Arabia are mosques [84]).
Weighting of targets enables the distinction of different target importance in mobility patterns and represents an essential requirement in the application of a gravity-based approach. WS defines equal weights for most categories, except for grocery stores (sum of weights 3), restaurants/bars (sum of weights 3), and shopping and coffee shops (sum of weights 2).
The majority of network-based indicators include a distance-decay effect to emphasize the role of close targets and express the diminished propensity to walk with growing distance. Various DDF are proposed for walking modelling. The original WS uses a polynomial DDF that gives full score or near full score for amenities that are within 0.25 miles of the origin. After this, scores decrease smoothly with distance. At a distance of 1 mile, amenities receive only about 12% of the score they would have had if they were right next to the origin. After 1 mile, scores decrease less quickly with greater distance, until they reach 1.5 miles, after which they do not count towards the final score [83]. Various modifications and simplifications of DDFs for the WS calculation have been applied. e.g., Reyer et al. [28] simplified the calculation to a series of distance bands. Similarly [25], used a set of point values based on [85].
Some authors [61,86] consider a cumulative Gaussian function to have the best fit for walking:
W i j = e t i j 2 / β ,
where tij stands for travel time and the coefficient β is the only adjustable parameter. The function’s main characteristic is that it quickly decreases when time travel is close to the maximum availability of minutes that people require [87].
The Gaussian DDF was adapted for the elderly in [88]. The β coefficient was set to 180 for people aged between 65 and 69, 160 for those between 70 and 74 and 140 for those aged 75 and over in order to best represent the mobility attitudes of different elderly age categories according to outcomes in the scientific literature [89].

4. Materials and Methods

Two indicators were selected to contrast the two main approaches in objective measurement of walkability—WAI and WS. WAI represents a typical statistical-based indicator while WS is a popular representative of network-based accessibility indicators which is widely used in the USA, Canada, Australia and elsewhere. Because each indicator defines its spatial units a different way, we used a square grid of 500 m as an origin with a circular buffer around each origin. Using the most similar spatial units for assessment and applying the same settings where applicable, we assured consistency in the evaluation of the two indicators. We also applied different buffers modelling different maximal acceptable walking distances. Using only grid of 500 m may be a subject of discussion. Only one regular scheme of buffers was explored due to limitations of this study. A walkability assessment for other grid distances would substantially extend the study and represents an opportunity for a further cross-validation study. Also, the influence of the position of the starting point for assessment of both indicators should be analysed, but the anticipated impact is not high.
To evaluate the impact of walkability assessment, the number of residents in each spatial unit (circle buffer) is aggregated using the number of residents from census 2011 referenced with address points. More detailed demographic data for each address point is not available in Czechia due to privacy protection.
The indicators were evaluated in Ostrava and Hradec Kralove (Figure 2), two middle-sized cities and regional capitals in Czechia. Hradec Kralove (population 100,000) is a typical old central European city with an old city core, and which was developed mainly after the decline of fortification in the 19th century. Ostrava (population 290,000) consists of an agglomeration of relatively closed communities (urban blocks) separated by crop fields, forests, and industrial parks as a result of short but intensive industrial development and administrative union of originally independent municipalities.

4.1. WAI

WAI aggregates four indicators: the connectivity index (CONN), which measures the density of intersections of walkable roads, Shannon’s entropy index (ENT), which quantifies the heterogeneity of land uses within an area, the floor area ratio (FAR) index, which evaluates the intensity of shopping opportunities as a ratio of floor area and available commercial land use, and the household density index (HDENS), which is related to residential land use. The required input data is demonstrated in Figure 3.
WAI is typically evaluated using geographical zones such as administrative units, frequently due to the unavailability of any other form of appropriate statistical data. For this study, WAI was calculated inside a circular buffer around each grid point (centroid) to improve the comparison with WS. This way, all spatial units for WAI have the same size and shape. This solution also eliminates some of the disadvantages of the WAI calculation for administrative units.
According to the review of recommended search radii and walkable distance, the following radii were selected: 400 m (approx. 5 min walking distance and maximal distance for primary services for handicapped elderly), 800 m (maximal distance for secondary services for the elderly), 1200 m (maximal distance for standard population [48]) and 2414 m (equivalent of 1.5 miles, and standard search radius for WS).
Calculation of WAI was facilitated by the ArcGIS toolbox developed at Palacky University [90]. The toolbox consists of 5 tools: Connectivity index (connect.py), Entropy (Shannon) index (entropy.py), FAR (far.py), Household density index (hdens.py) and Walkability index (wai.py). The tools were created using python programming language version 2.5.1, and ArcGIS Desktop software version 9.3.1. Though the tools were programmed in an older version of ArcGIS, they can be run in ArcGIS Desktop 10. When calculating the walkability index for usual administrative units, no modification of the scripts is required, however, in the proposed overlapping zones, some modifications to the scripts and index calculations are needed. We have developed a new version of this tool [91] which solves the several issues described in the following paragraph.
The tools create temporary files (intermediate results) that are saved in the ESRI shapefile format. This format, however, is inappropriate for complex overlay operations, therefore it is necessary to redirect the storage of temporary files to the file geodatabase. Furthermore, the Connectivity index tool uses the SpatialJoin method within which a cardinality type must be changed from ONE TO ONE to JOIN ONE TO MANY. For FAR and Household density indices, it is necessary to eliminate the problematic ratios of the areas of interest to the size of the buffer area. If the ratio is less than 1%, the index values are set to 0. Concerning FAR, instead of using actual floor space, which is unknown (difficult to assess in a field survey with a limited offer of commercial products), the size of the buildings is based on their blueprints and is used as the nearest approximation available. Such approximation was accepted in [28,90] and appears to be appropriate in European countries.
All four sub-indices need a land use layer containing typology such as Living (L), Commercial (C) or Water (W) as an input. Other categories do not necessarily have to coincide with the authors’ specifications (eight land use categories), but the one-letter designation for single-use areas and the n-letter designation for n land uses should be followed. The Urban Atlas 2018 database containing a total of 21 land use types was used. Areas defined as “Urban Fabric” were classified as Living areas, “Industrial, commercial, public, military and private units” as Commercial, and “Water bodies” as Water. The Urban Atlas covers the largest urban agglomerations in the Czech Republic (including Ostrava and Hradec Kralove), therefore it represents a suitable unified data source for comparison of localities. Aggregation of different non-residential areas together made it impossible to better specify commercial area. Currently, no available data source (e.g., Urban atlas, or Corine Land Cover) contains specific commercial polygons (area). This simplification has an impact on FAR assessment where the area of commercial land use is the denominator. The total effect is small because the final index FAR is standardised using the Z-score.

4.2. Walk Score

WS is calculated by mapping out the walking distance to amenities in the 9 important daily life amenity categories for each given origin. In amenity categories where depth of choice is important, multiple amenities in that category are counted. Categories are also weighted according to their importance [83]. After normalization, the address may receive a penalty for having poor pedestrian friendliness metrics, such as long blocks or low intersection density.
WS was calculated for the comparable spatial units using the selected radii for network searching of requested destinations and a buffer for the assessment of connectivity.
A new application was developed for WS assessment available at [91]. The application was created using python programming language version 3.9. It is based on open-source python libraries such as NetworkX, Pandana, Geopandas, Shapely and momepy and is available on github as a jupyter notebook file. The network distance calculations are based heavily on the Pandana python package that uses contraction hierarchies to calculate super-fast travel accessibility metrics and shortest paths [92]. OSM street network data, centroids and amenities’ locations are required as inputs into the application in the form of spatial layers (format shapefile) (Figure 3). OSM is preferred due to its availability and frequent usage but it requires careful checking and pre-processing. Checking and corrections of the fclass attribute assure selection of appropriate paths. The highway attribute was completed or adjusted. Connectivity testing enabled the discovery of isolated parts of networks (islands) which had to be properly connected to other parts of the network. To support this task we used a connected_components function in the networkx library [93]. This is implemented in the script for the WS calculation. It identifies the largest component of the connected network and then uses it further in the calculation. Thus, the user must ensure that the network is as well connected but no longer has to deal with islands or small unconnected sections of the network. Usually, some parts of the network have to be additionally vectorized.
Values of multiple parameters can be adjusted such as maximum walking distance, walking speed, Gaussian DDF β coefficient and amenity weights.
The core processes of this application include the creation of a pedestrian network and calculation of walking distances (shortest routes) to various nearest amenities from every centroid location within a given locality. The pedestrian network is a data model resembling a network graph (edges and nodes) weighted by linear distance. The shortest walking distances are translated into walking times, and amenities’ weights and the Gaussian DDF are applied. Afterwards, the base score of the centroids is determined and normalized to a score from 0 to 100.
This original WS methodology introduces two pedestrian friendliness metrics: intersection density and average block length. After the base score is calculated, the pedestrian friendliness metrics penalize grid locations for having long blocks or low intersection density by lowering the base WS [83]. Shorter blocks mean more intersections, and, therefore, shorter travel distances and a greater number of routes between locations. Several communities have adopted maximum block length standards for new developments [94] usually ranging from 300 to 600 feet. Average block length values above 120 m (400 feet) obtain a penalty due to low connectivity. Under European conditions, where old city areas are equipped with intricate networks of lanes and released (sub)urbanization with almost no closed city blocks, there are difficulties in establishing building blocks and calculating this parameter. Therefore, in this study, we approximated the average block length using the average length of street segments between crossings.
To improve the list of destinations, Point of Interest (POI) from Open Street Map (OSM) is extended using selected countrywide registers, such as the register of healthcare facilities, and destinations selected from the consolidated data base.
WS was assessed for usual conditions (“adults”), referred to as Standard WS, mainly to compare results with WAI. The flexibility of WS and a newly prepared software application also enabled the preparation of a modification suitable for seniors, referred to as a Walk Score for elderly.

4.3. Walk Score for Elderly

The assessment of walkability for seniors should take into account the specific requirements and abilities of this group. It should comprise mainly of a selection of appropriate destinations and different weighting, decreasing maximal walkable distance, and decreased walking speed.
For this study, seniors’ destinations were selected according to anticipated preferences discovered in the review and local survey.
While previous studies usually considered a wide range of important services for the elderly (e.g., food store, pharmacy, doctor, bank, post office, bus or tram stop, church, cemetery, hairdresser/barber, library, and green areas in [11]), Czech studies show a different pattern giving more preference to shopping and less to church and various other citizens’ services [95]. The most important targets according to a wide survey conducted in regional capitals 10 years ago are: small shopping, parks, large shopping, employment, relatives and friends, and general practicians [10]. The local survey in Ostrava and Olomouc in 2014 found similar destinations, but the frequency of visits was slightly different (Table 1). The weights were derived from questionnaires asking for the destinations of seniors’ mobility and their frequency of visiting. For each destination type, the average number of visits per month was enumerated and standardized. Due to local and temporal closeness, the resulting weighting was applied to the assessment of WS for elderly, despite the smaller scope of the survey. The countrywide weightings were used in the sensitivity analysis.
Not all destinations can be utilized for network searching. Employment (workplace), family, gardens, and cottages are places of generally unknown location. In the case of a church or cemetery, it is believed that such types of destinations in cities are subjects of membership in a community, or they are strictly influenced by people’s individual roots. Therefore, such locations cannot be properly estimated by preferred distance, and a gravity-based approach is no longer relevant.
Finally, only destinations with frequency records from both surveys were selected: retail, hypermarket, cultural facilities (entertainment), healthcare (doctor) and parks.
WS requires setting an appropriate walking speed and DDF. For the elderly modification of WS, we applied values recommended by [26]—average gait speed for seniors at 0.7 m/s and β coefficient at 153 corresponding to the commonly recommended walking distance of 800 m. These values are a subject of discussion due to the variability of seniors’ capabilities and preferences. Similar uncertainties arise with the weight settings for different destinations. The influence of these parameters was tested in a sensitivity analysis.

5. Results

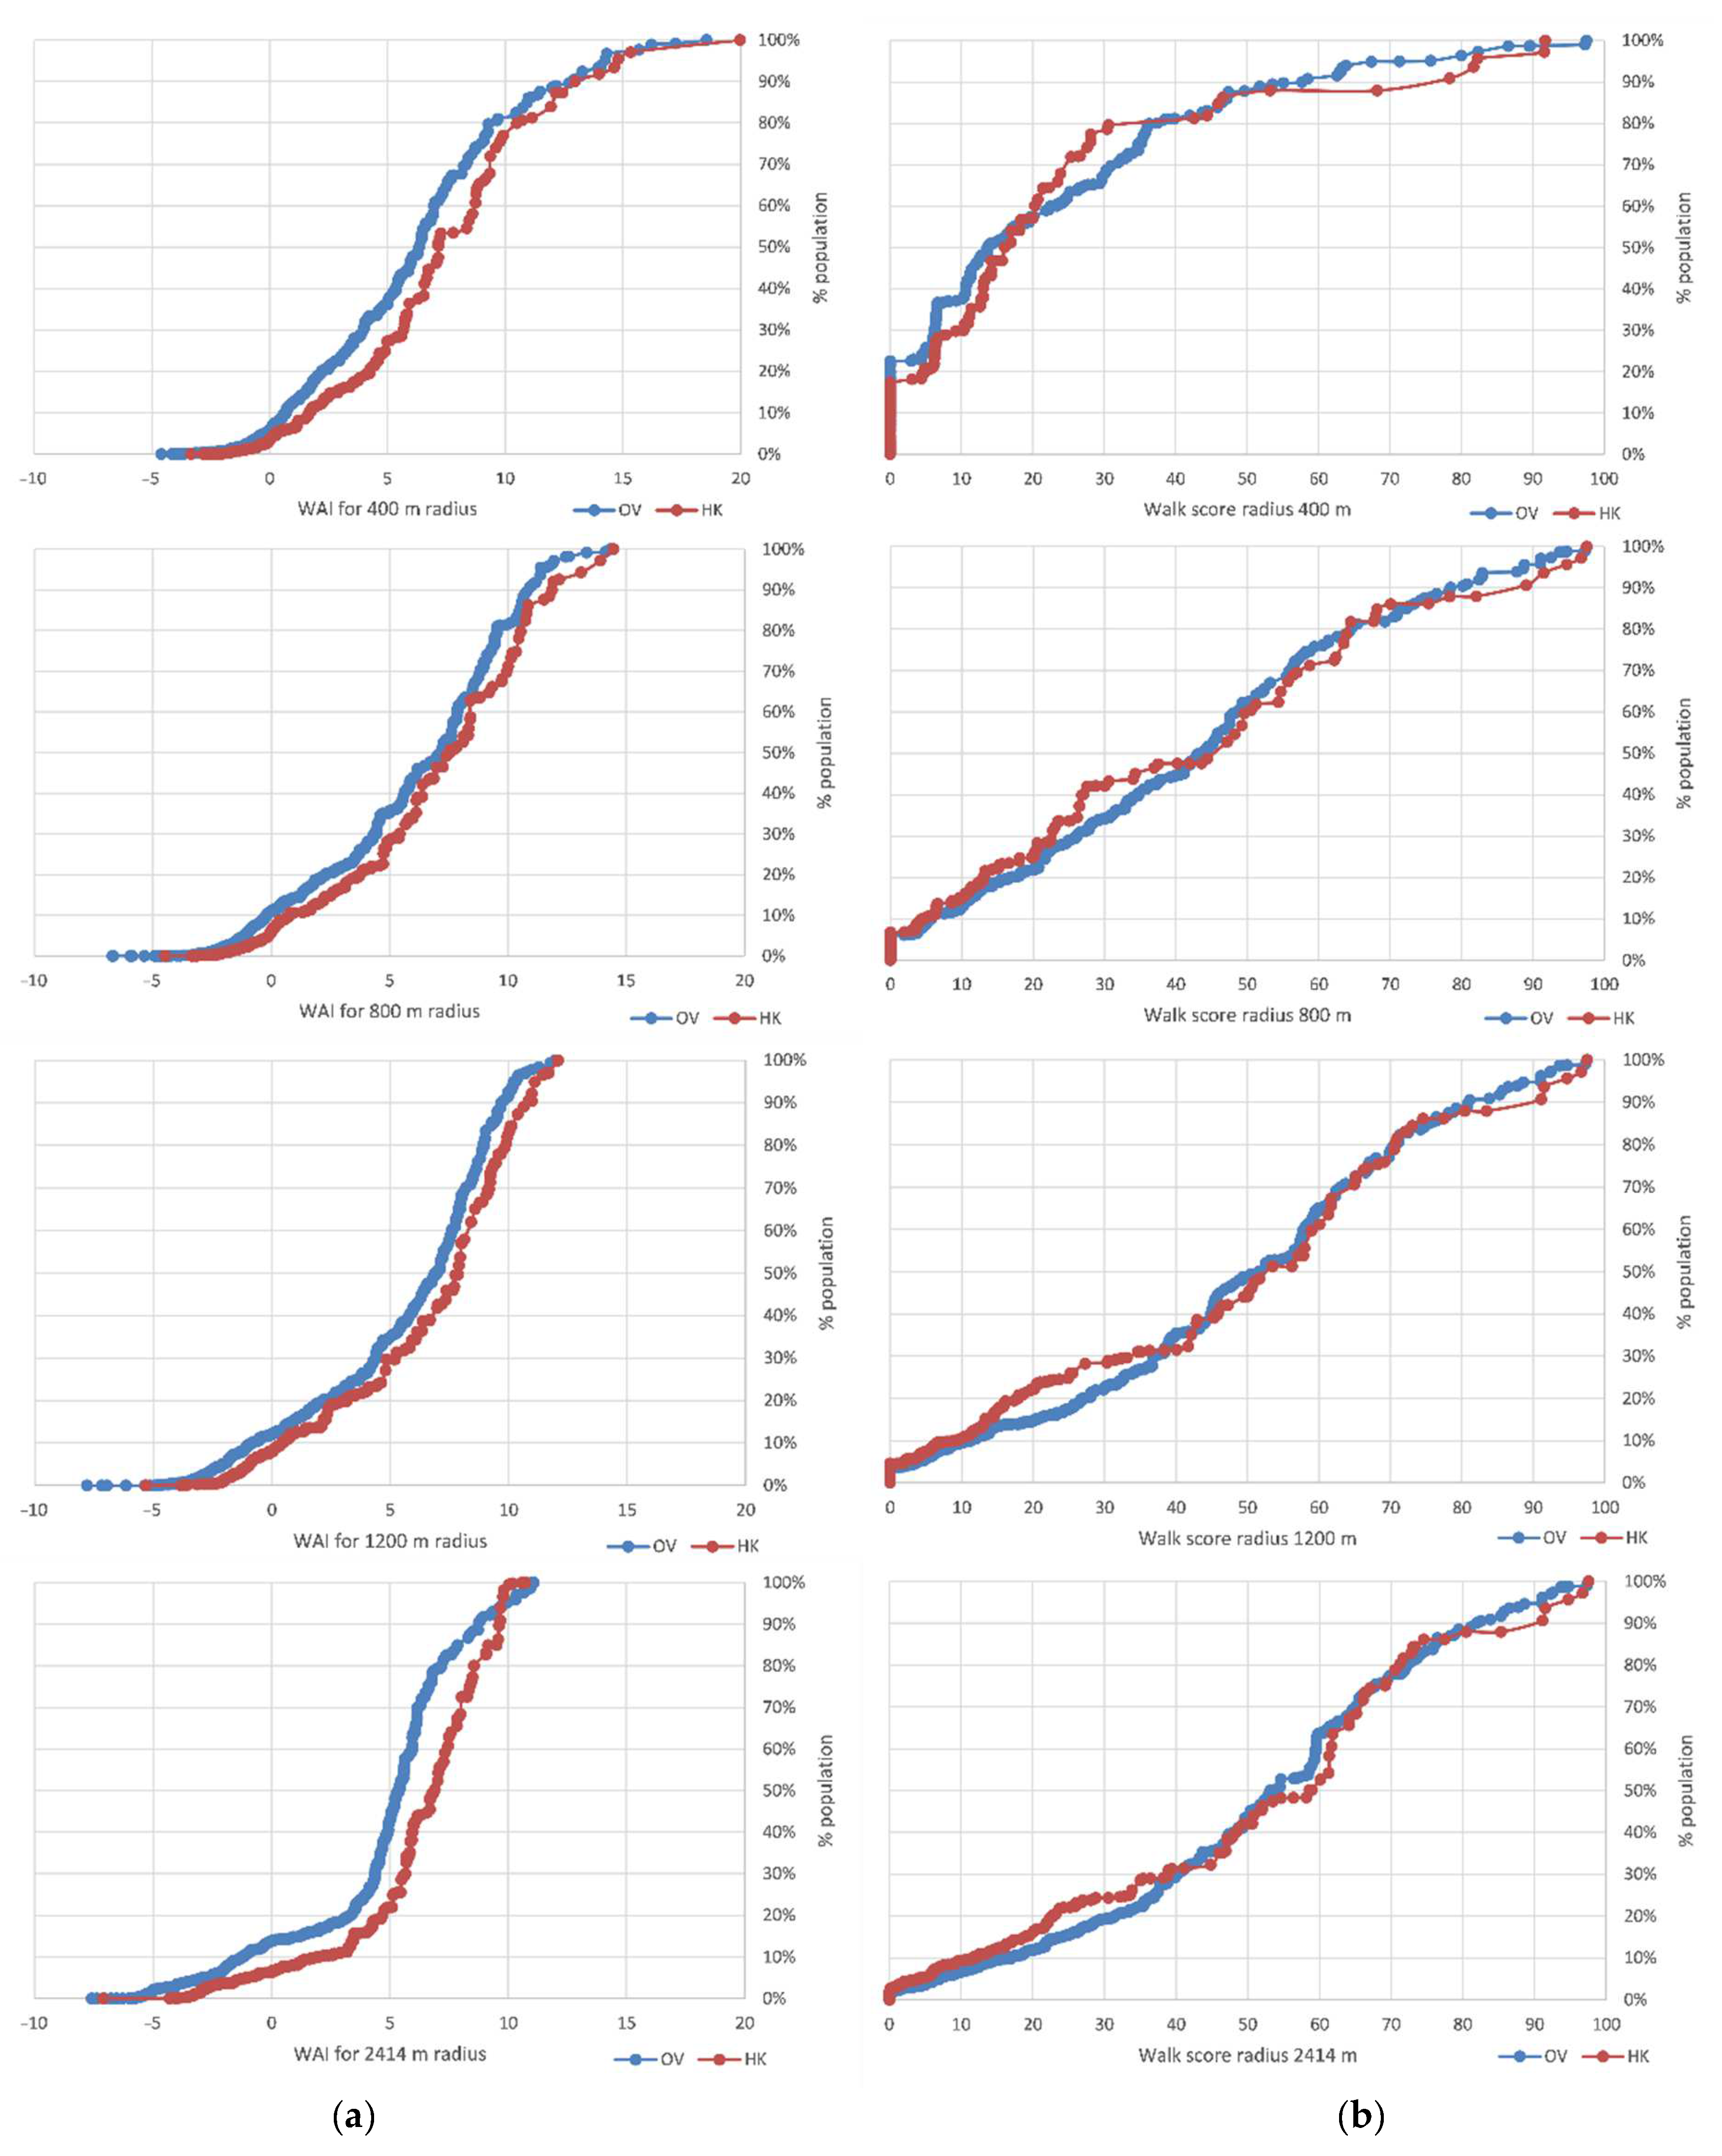
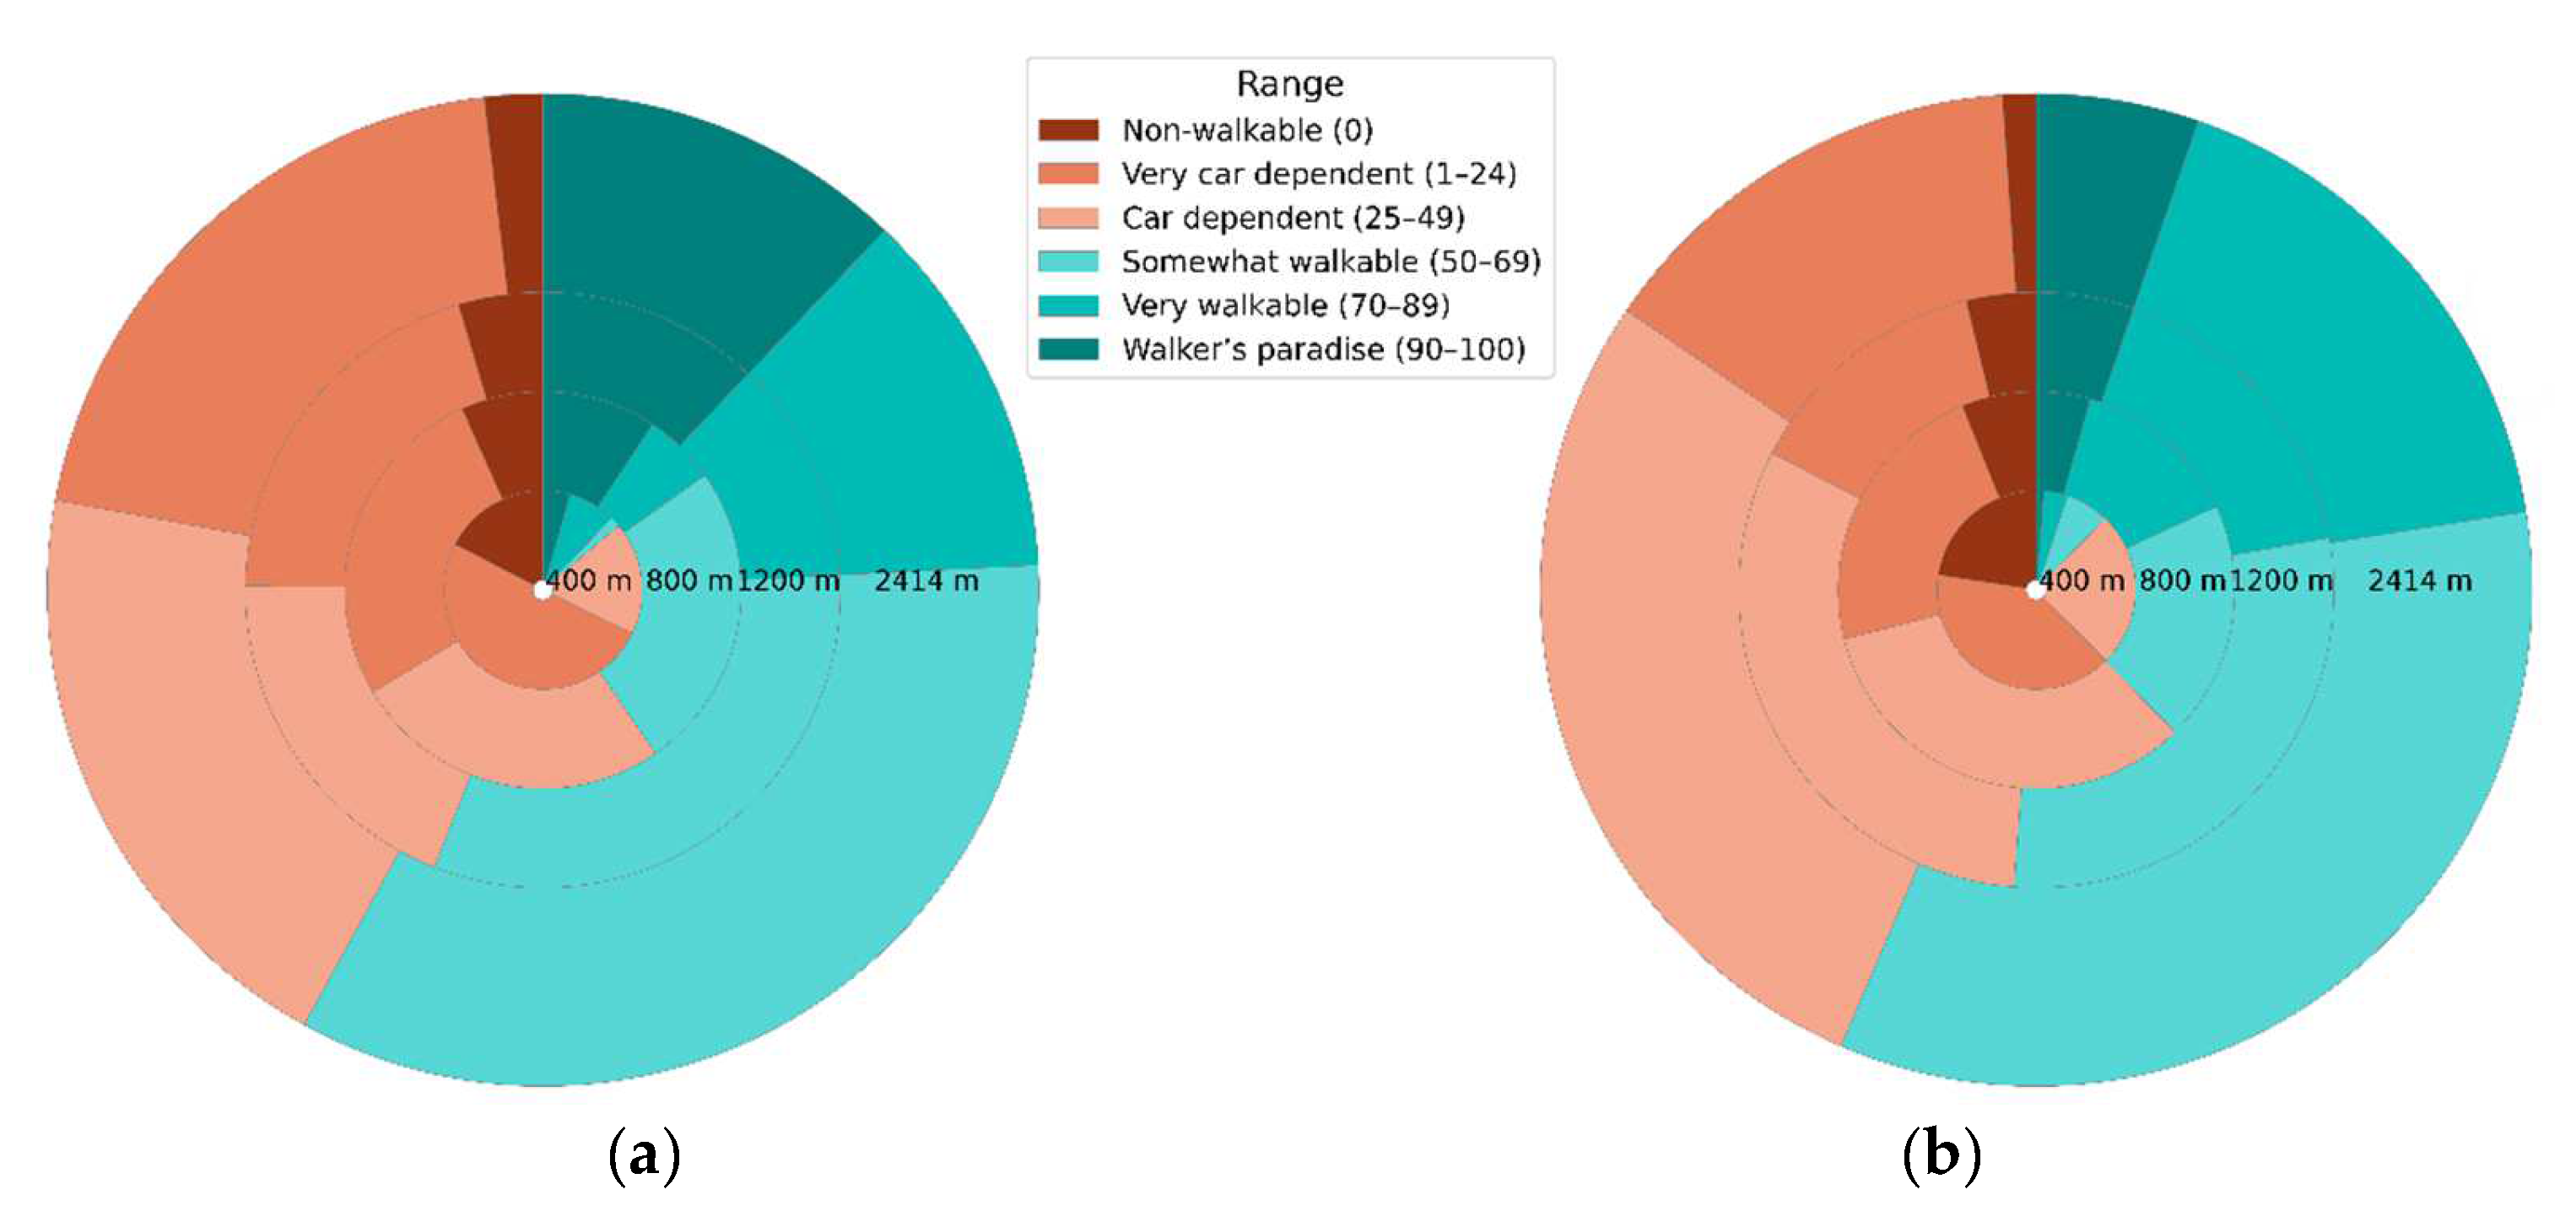
5.1. Comparison of WAI and Standard WS for Equivalent Spatial Units

The results of WAI (Figure 4) show a strong smoothing effect for radii larger than 800 m suppressing local spatial variability and creating continuous surface of resulting values. A 400 m radius provides a local assessment of walking conditions within 0.5 km2 (double that of the square) and the circle fully exceeds the scope of the reference square. The strong differences and rapid changes of values in short distances (strong gradients) may well document a heterogeneity of local conditions. The assessment is negatively influenced by our limited ability to properly evaluate local statistical indicators such as FAR or CONN, which are influenced by random local urban configuration. It also concerns the internal variability of the spatial unit, thus the change of the central point of a buffer will generate some differences. An 800 m radius may provide a balanced solution preserving the local pattern and suppressing random deviations at the local level. Large radii (1200 and 2414 m) offer better assessment of conditions for common (“adult”) walking for people without mobility constraints. Large overlapping of neighbour buffers causes great sharing of the same conditions in surrounding spatial units and is reflected in the intensive smoothing.
When comparing Ostrava and Hradec Kralove, the different characters of the cities are clearly visible. The analysis of Ostrava originated as an agglomeration of relatively independent municipalities where three main settlements forming three green eyes in the map surrounded by small satellite villages signalled by small higher walkability islands portrayed mainly on maps for small radii. Meanwhile, Hradec Kralove shows typical concentric urbanisation around the old city nucleus. Naturally, however, its development was not perfectly symmetrical, but reflects the position of natural areas (e.g., forests in the SE) as well as infrastructural corridors towards the SW, NW, and E (Figure 5, source: Czech Office for Surveying, Mapping and Cadastre, COSMC).
It is interesting to note where the classification of WAI is more stable and where some intervention should efficiently improve walkability. The changes of WAI due to extension of the search radius from 400 m to 2414 m are evaluated using the slope of WAI regression lines for each cell (hereafter local trends) (Figure 6).
Different local trends of WAI can be seen in the maps. The main settlements of the cities are stable and do not change classification of WAI with extension of searching radii. Steeply declining cells indicate places where countryside and isolated areas show higher local walkability, and, during radius extension, the walkability goes down. Contrarily, locations on the border of urbanised areas display worse local walkability, and if they are situated in a gap between dense urbanised areas, an extension of the radii causes a steep increase in walkability.
Concerning standard WS, results (Figure 7) show disadvantages to using short walking distances. Uneven and relatively sparse spatial distribution of evaluated destinations with combinations of short walking distances resulted in walk-unfriendly pictures of the investigated cities. A 400 m walking distance is too short to reach targets, and only settlement cores and some isolated places can be assessed as moderately, or well walkable. It is necessary to note, that for such small distances, any network error would deteriorate the final score. An 800 m walking distance discovers good walking conditions for settlements’ cores with steep surrounding gradients where good walking conditions quickly switch to a “zero” walkability. This phenomenon is more recognizable in Ostrava, linked with the forced urbanisation in its industrial history where a massive new settlement was quickly built on agricultural land and the current dense settlement is surrounded by crop fields and forests with very limited possibilities for walking. Smoother gradients can be found in in Hradec Kralove where long-term natural urban development generated more friendly walking conditions with moderate spatial changes of walkability. A 1200 m walking distance produces more continuous walkable areas covering practically all main settlements. For the maximal radius, the majority of the cities’ areas are somewhat walkable, although at a very modest level indicating a strong car dependency. Only 7.5% and 11.9% of units in Ostrava and Hradec Kralove, respectively, are evaluated as “non-walkable”. Even the forest in the SE of Hradec Kralove is partly walkable. It is necessary to note that results in the given places are a subject of internal variability and a small shift of the starting point may cause local differences in the evaluation.
General trends can be assessed using average values of both walkability indices. The average decile of WAI declines with extension of the radius in both cities, while WS grows (Figure 8). The smoothing effect coupled with a growing radius will level out the WAI classification because large buffers include less urbanized areas with low evaluations. On the other hand, WS with a larger radii reaches more destinations and continues to grow.
The distribution of population according to walkability is described by cumulative distribution functions in Figure 9. A general effect of increasing population in walkable places with extension of radii is well documented for both indicators. A small radius (400 m) for WAI indicates only a small portion of the population with low WAI and the rest of the population obtains various values of WAI without strong preference. At the largest radius, 20% of the population suffer from very low WAI conditions while the other 80% is almost evenly distributed with higher values of WAI. The graphs confirm that the population distribution of WAI with a growing radius quickly degrades into 2 groups—those living in a poorly walkable environment (mainly on the city periphery) and those in a well walkable environment (in all highly urbanised areas) which is not realistic nor useful. The WS curve documents that a short radius (400 m) causes a high share of the population to possess a low WS and a very limited share of the population enjoys a satisfactory level of WS. However, the situation changes at 800 m, where the curve shows even distribution of WS values across the population: large radii quickly improve walkability and deliver a score above 50 to half the population.
WAI values are difficult to compare due to standardisation within each city and each searching radii and the fact that the sum of their z-scores are evaluated by quantiles. Despite this issue, we estimated a good walkability above the 9.28 threshold estimated as the 95-percentile from all WAI values (Table 2). For WS, we adopted the evaluation scheme of Reyer et al. [28].
Evaluation of WAI distribution related to buffer size confirms a strong smoothing effect for large unit sizes above approx. 1000 m. The largest shares of units and population in highly walkable areas are reached at 800 m: approx. 26% of the population in Ostrava, and 35% in Hradec Kralove. These values rapidly decline to 8% and 15%, resp., for buffers with a 2414 m diameter.
In the case of WS (Table 3 and Table 4), the share of fully non-walkable units should first be analysed. Almost 62% of centroids, both in Ostrava and Hradec Kralove, within a 400 m radius found no target, theoretically impacting 23% and 17%, resp., of the population. This share gradually decreases with growing search radius and at the standard 1.5 miles reaches 8% and 12%, resp., of units, and 1.1% and 1.9%, resp., of the population.
Units with rich walking conditions in close radii rarely occur. Only 12.2% and 13.8% of people with a walking radius of 400 m in Ostrava and Hradec Kralove, resp., can be satisfied with walking conditions in their surroundings (WS above 50); all others are car dependent (Figure 10). This share jumps with a search radius of 800 m reaching 38% and 40%, resp., then shows a lesser increase to 51% and 56%, resp., for 1200 m, and finally 56.5% and 58%, resp., for 2414 m. This means that even for people with normal walking capacity, more than 40% of inhabitants live in locations which are classified by Walk Score as locations where residents are car or PT dependent.
A correlation between WAI and WS show a satisfactory level of correspondence with a good index of determination ranging between 0.4 and 0.7 (Figure 11), reaching the highest values for 800–1200 m.
However, the distribution shows a diverse evaluation of WAI and WS. A close relationship between these indicators is reached only with higher values of WAI, especially in the case of Hradec Kralove. Ostrava is more heterogeneous which is reflected in lower R2 and higher diversity of situations. Extremely heterogeneous conditions can be seen for the largest radius where five partly separated clusters can be distinguished (Figure 12).
cl.3—high WAI and high WS. The best walkability conditions are confirmed by both indicators. This occurs only in two main dense settlements.
cl.4—high WAI and lower WS. Here high values of WAI originate from high CONN and FAR parameters. While the environment in Ostrava-south is walkable, accessibility of destinations is not satisfactory showing lower WS compared to other urban nuclei.
cl.1—very low WAI with increased WS. Small and almost rural villages where WAI is decreased by large surrounding crop fields while accessibility of basic local targets is satisfactory.
cl.2—middle WAI with high WS. Minor settlement nuclei with city-like urbanisation with some surrounding restrictions (in our case forests and an industrial zone). WAI is increased due to HDENS, but other parameters (namely CONN) remain in the background. High WS shows full availability of local targets.
cl.5—high WAI and low WS. Areas typically situated in a gap of dense urbanisation or on the border of it. While the environment encourages walking, the real accessibility of requested destinations is very low. These areas suffer from an unsatisfactory supply of civil amenities.
Meanwhile, conditions in Hradec Kralove are much simpler, with only two basic situations arising: divergent WAI with low WS, and proportionally growing WAI and WS.

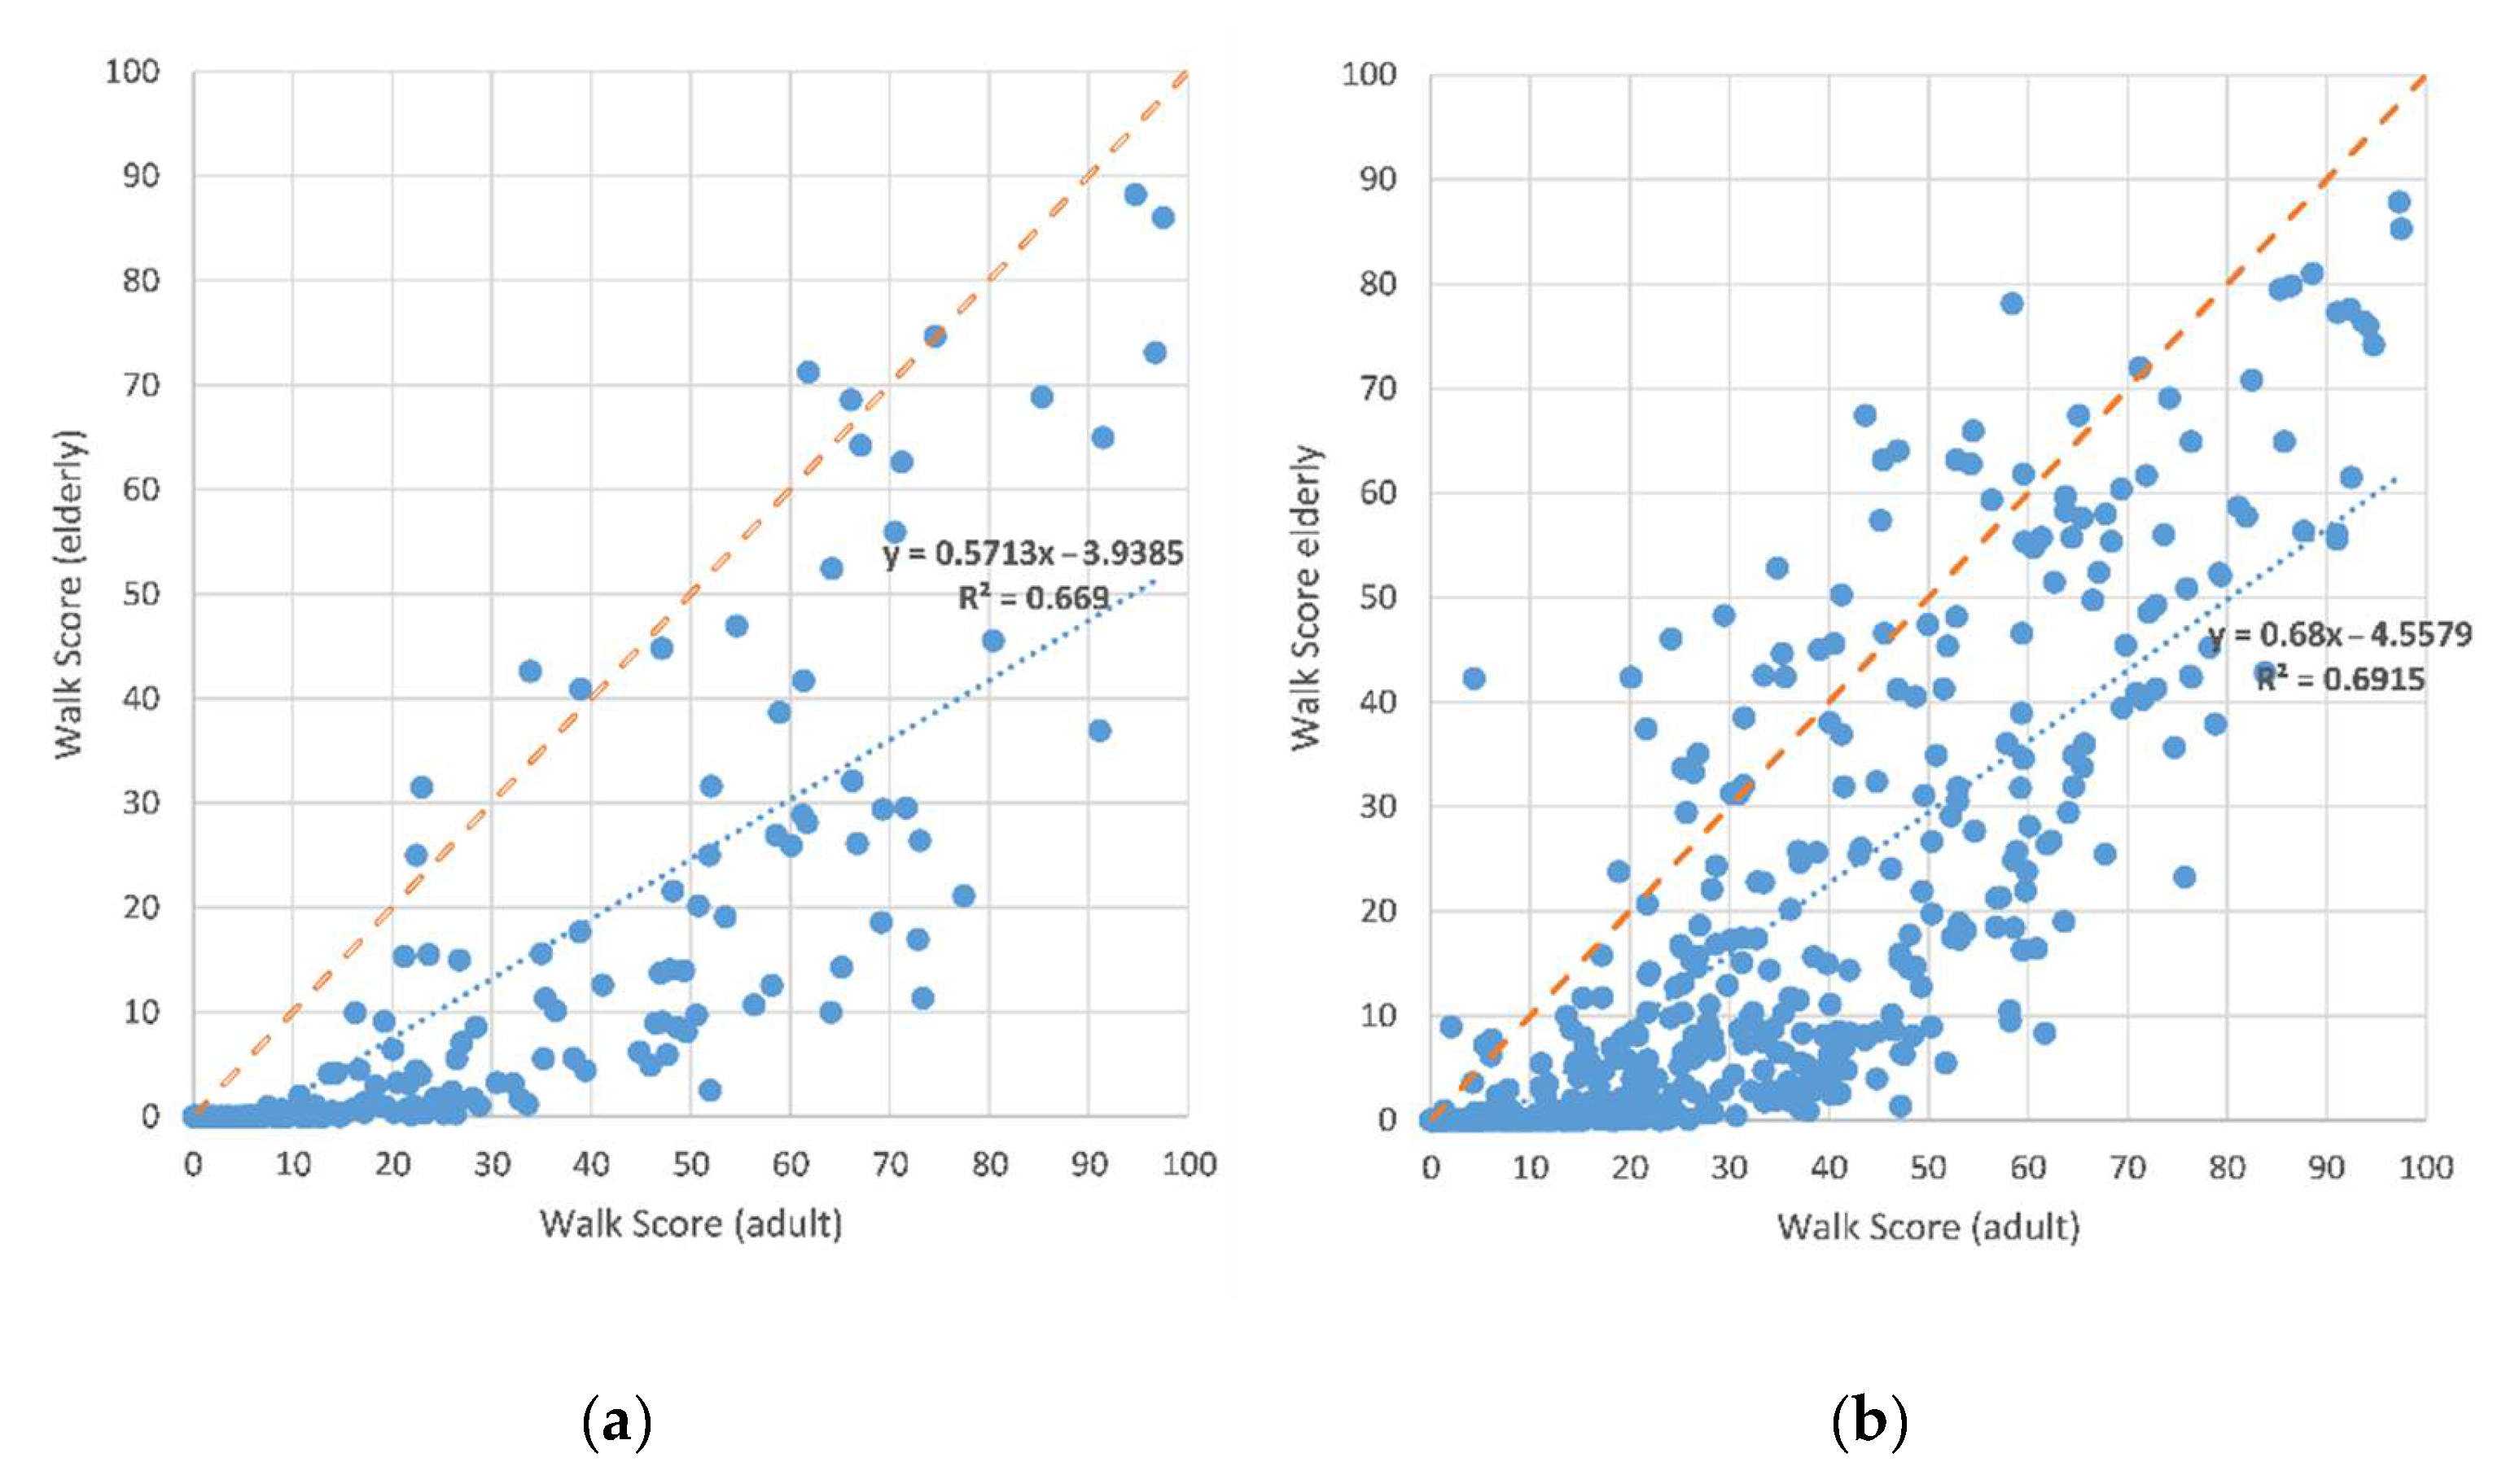
5.2. Comparison between Standard WS and WS for the Elderly

WS for elderly was evaluated using the baseline settings from testing. The example here shows the evaluation for an 800 m radius (Figure 13). If we compare the results with Figure 7, the pattern reflecting the main urbanised settlements remains, but these areas are substantially eroded; the total area with high WS is smaller and internally much more diverse.
Changes between standard WS and WS for elderly measured with the standardised WS values were evaluated. Proportional changes are not appropriate in this case due to their exaggerated % of small WS values. The radius according to standard WS is 2414 m whereas the radius for seniors is set shorter at 800 m.
As expected, the overall change of WS from adult to elderly is negative due to the reduction in walking distance, steeper DDF, and different set of targets. 50% of units report a decline of WS between 1 and 21 percentage points. Medians in both cities are similar: −9.85 and −8.21 in Ostrava and Hradec Kralove, resp., showing less change in Hradec Kralove.
One third of spatial units (Figure 14) do not change significantly in WS classification: 31% in Ostrava and 35% in Hradec Kralove, but this represents only 10% and 15%, resp., of the population. 31% and 33% of units show moderate decrease, and strong decreases can be found namely in highly populated areas. A large drop of WS (above 15) was recorded in 20% and 17% of units, resp. (33% and 25% of the population), but the distribution of such places is different. In Ostrava, the largest WS decreases are often found on borders of dense settlement where shorter walking distance for elderly significantly limits the accessibility of destinations. Different case is units where internal barriers (rivers, railway stations etc.) limit short accessibility and cause a significant drop in walkability. In such locations, any improvement of close walkability is difficult. However, in Hradec Kralove, significant drops in WS do not accompany the border of dense settlements, likely due to more continuous urban development. The major groups of cells with dramatic decrease in WS for elderly are situated in the city centre. These cells typically contain large institutional complexes such as a hospital or university.
Improvement of walkability for the elderly seldom occurs, as expected, though in Ostrava, sparse isolated locations typically represent countryside-like settlement with individual housing and good local shopping opportunities.
The correlation between the two types of WS (Figure 15) is relatively high—R2 0.669 (Hradec Kralove) and 0.691 (Ostrava). As expected, more “non-walkable” spatial units are indicated for elderly WS and have fewer occurrences in Ostrava than in Hradec Kralove (15.5% and 24.2%, resp.). Their elimination will increase R2 and the slope of the regression lines.

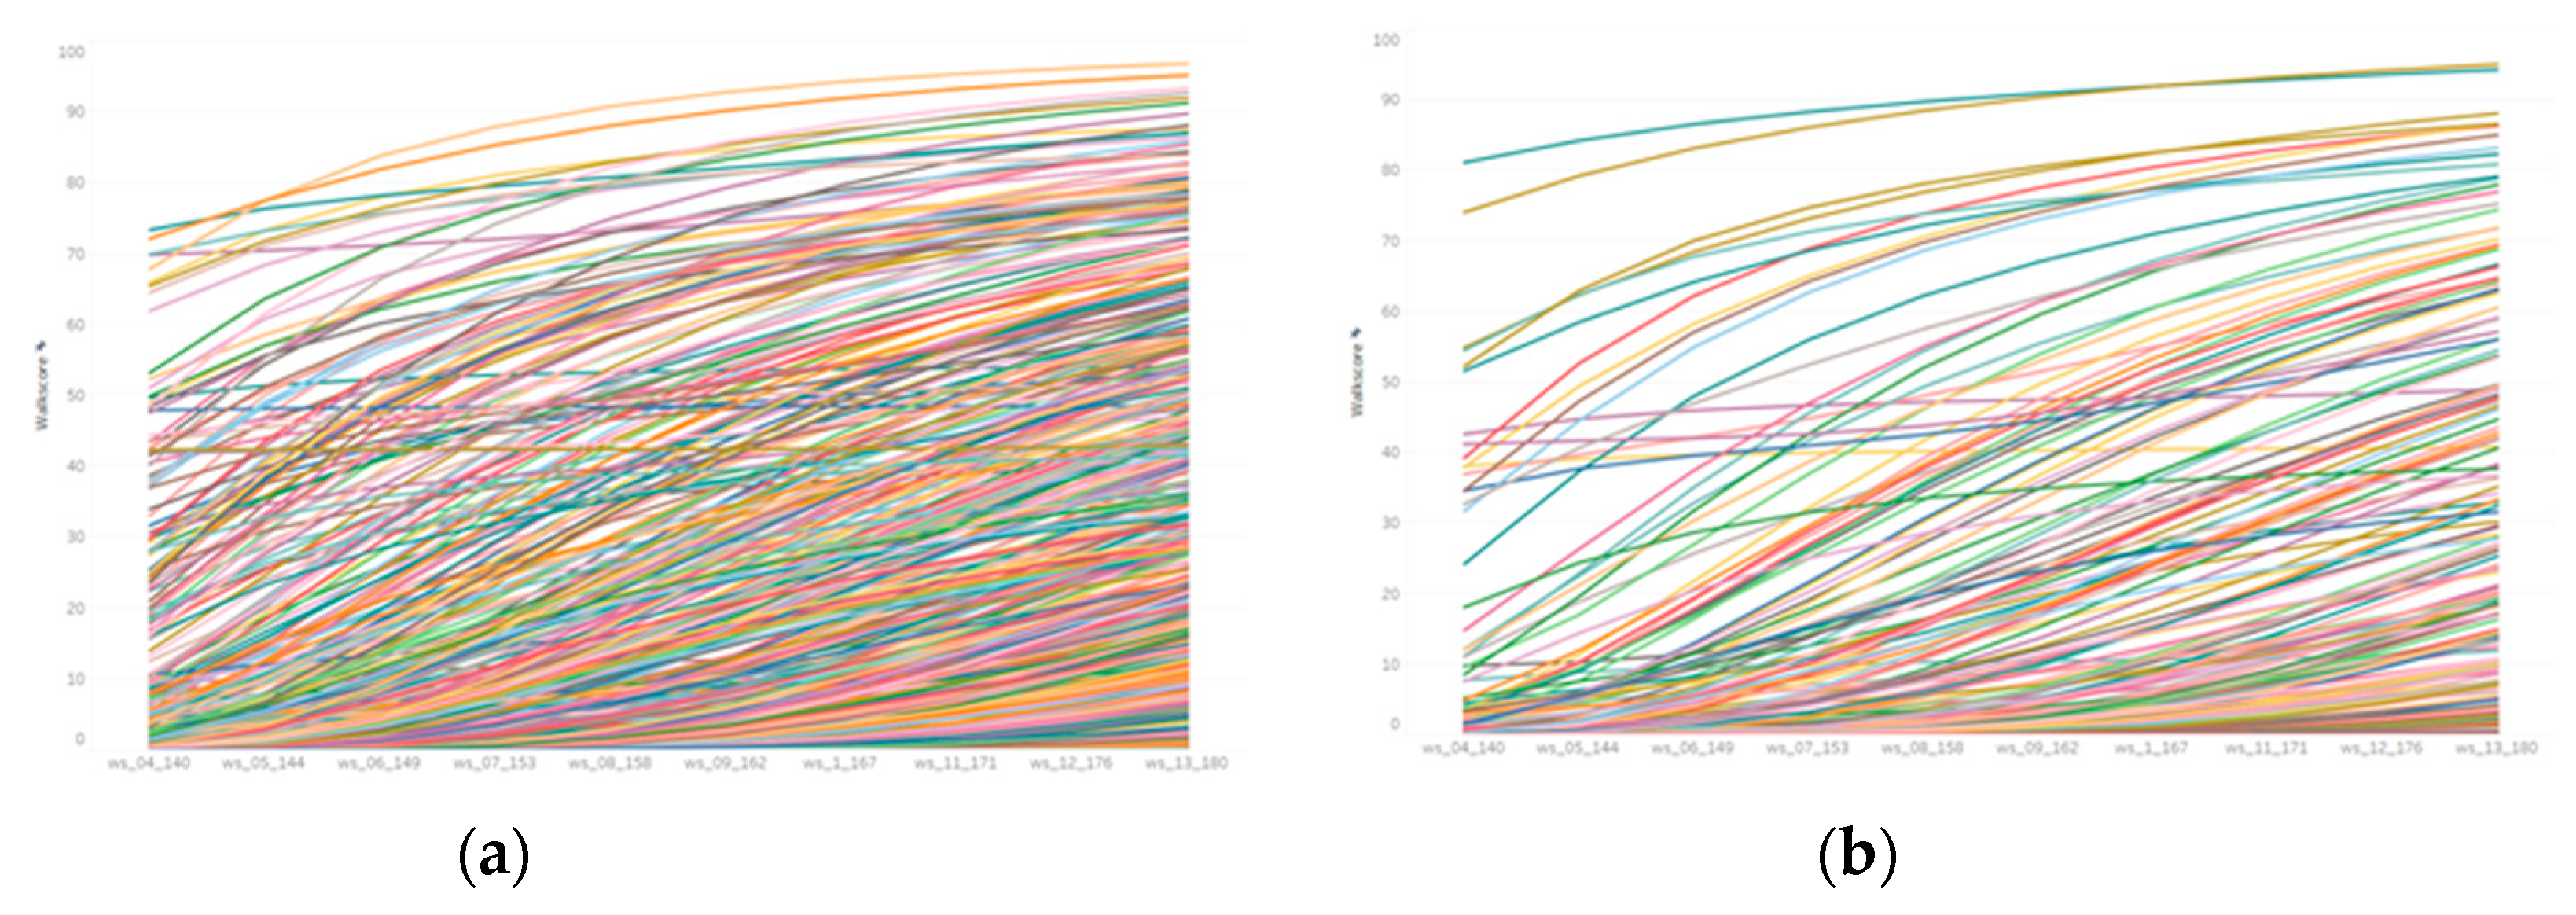
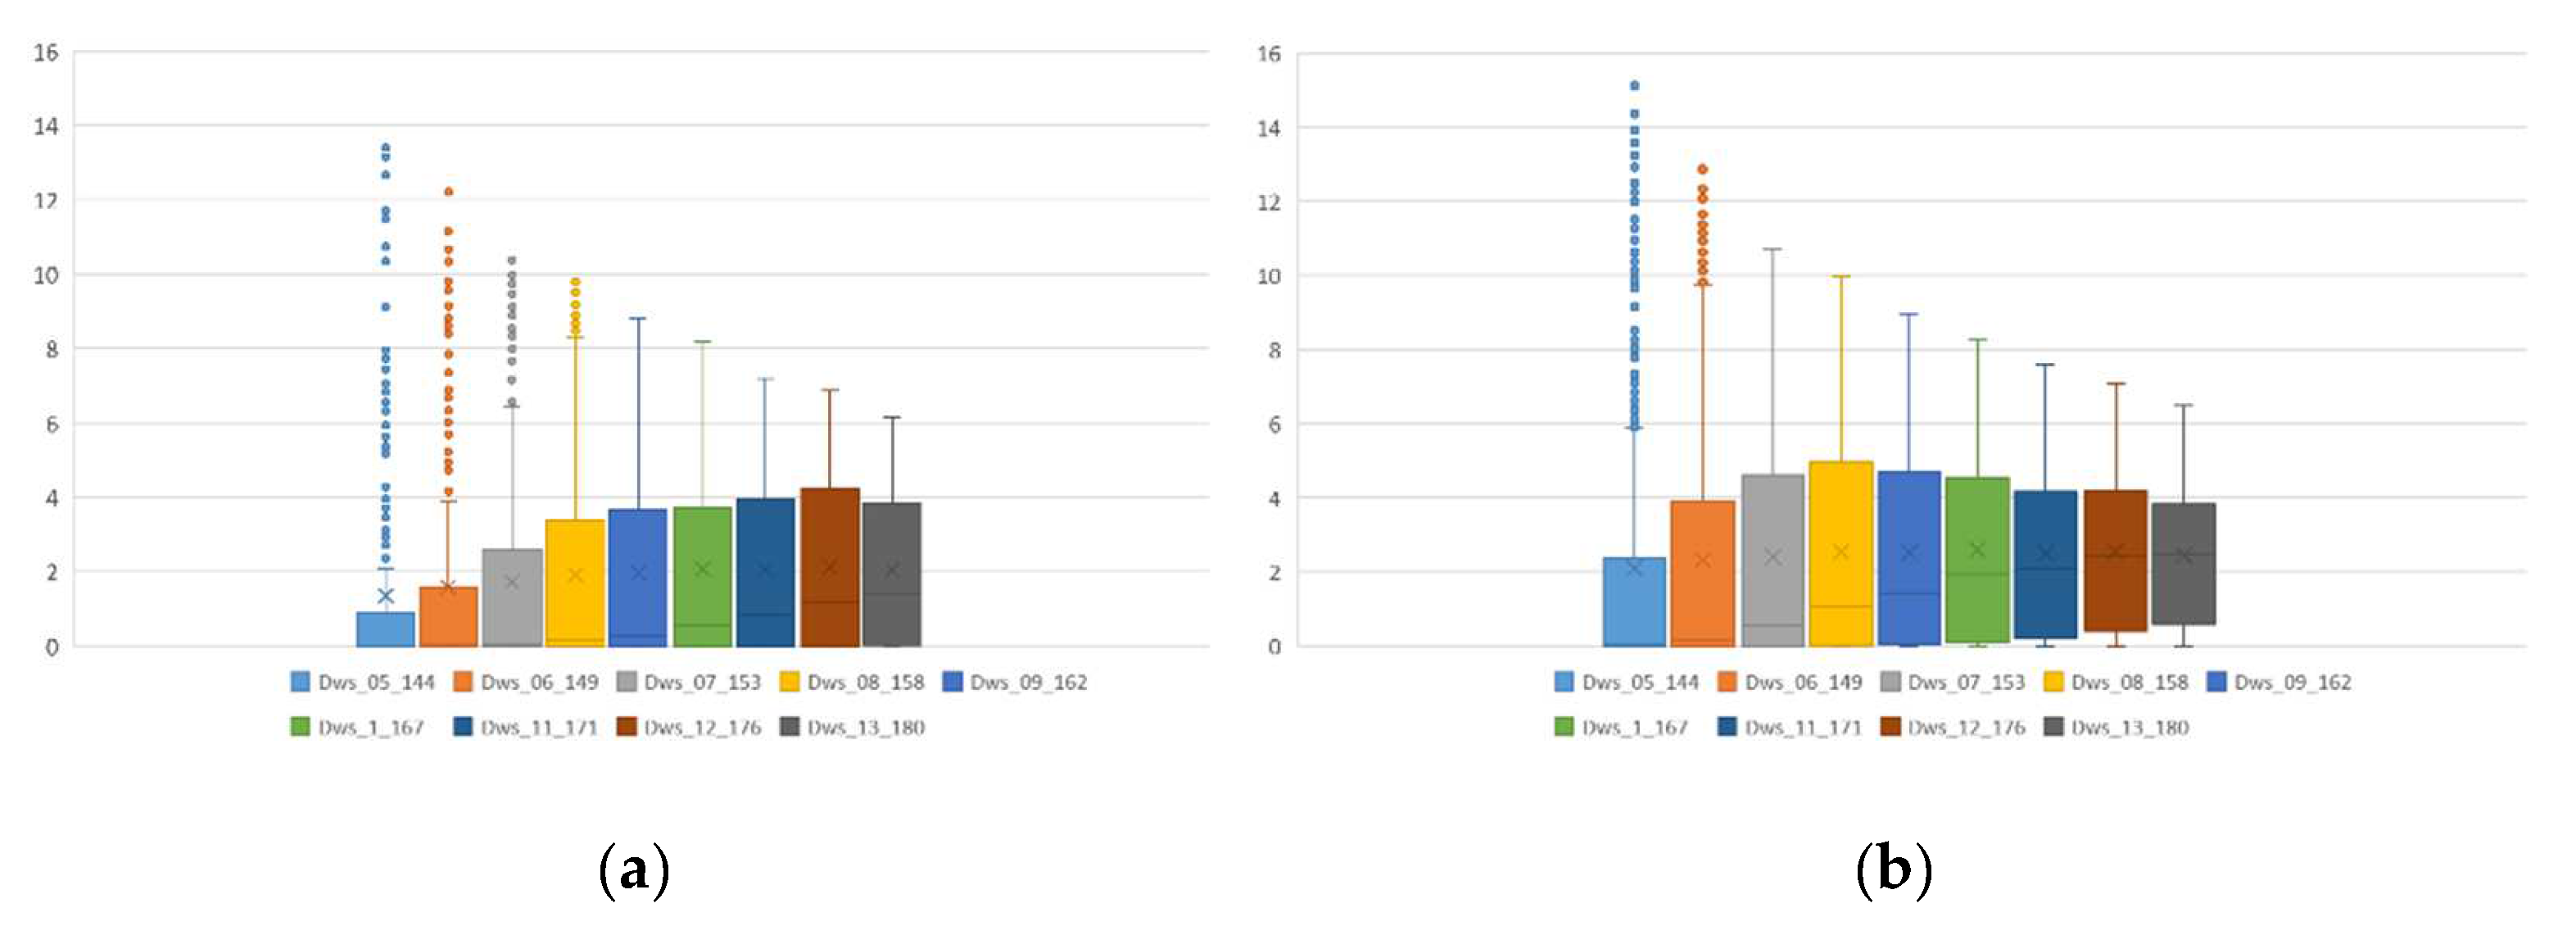
5.3. Sensitivity Analysis of WS for Elderly

As mentioned above, different findings and opinions can be found for which parameters are important for walkability assessment. Local conditions and cultural and transport habits are different in different locations, and individual physical and mental capabilities, health, attitudes, and behaviour are even more diverse. Under such uncertain conditions, it is a good idea to provide a sensitivity analysis to uncover the real impacts of different settings and which parameters have major impacts on the final WS.
The sensitivity analysis was based on one-at-a-time approach (OAP) [96] where one parameter is moved sequentially, keeping others at their baseline values, then the parameter is returned to its baseline value and the next parameter is then moved. The following modifications were tested:
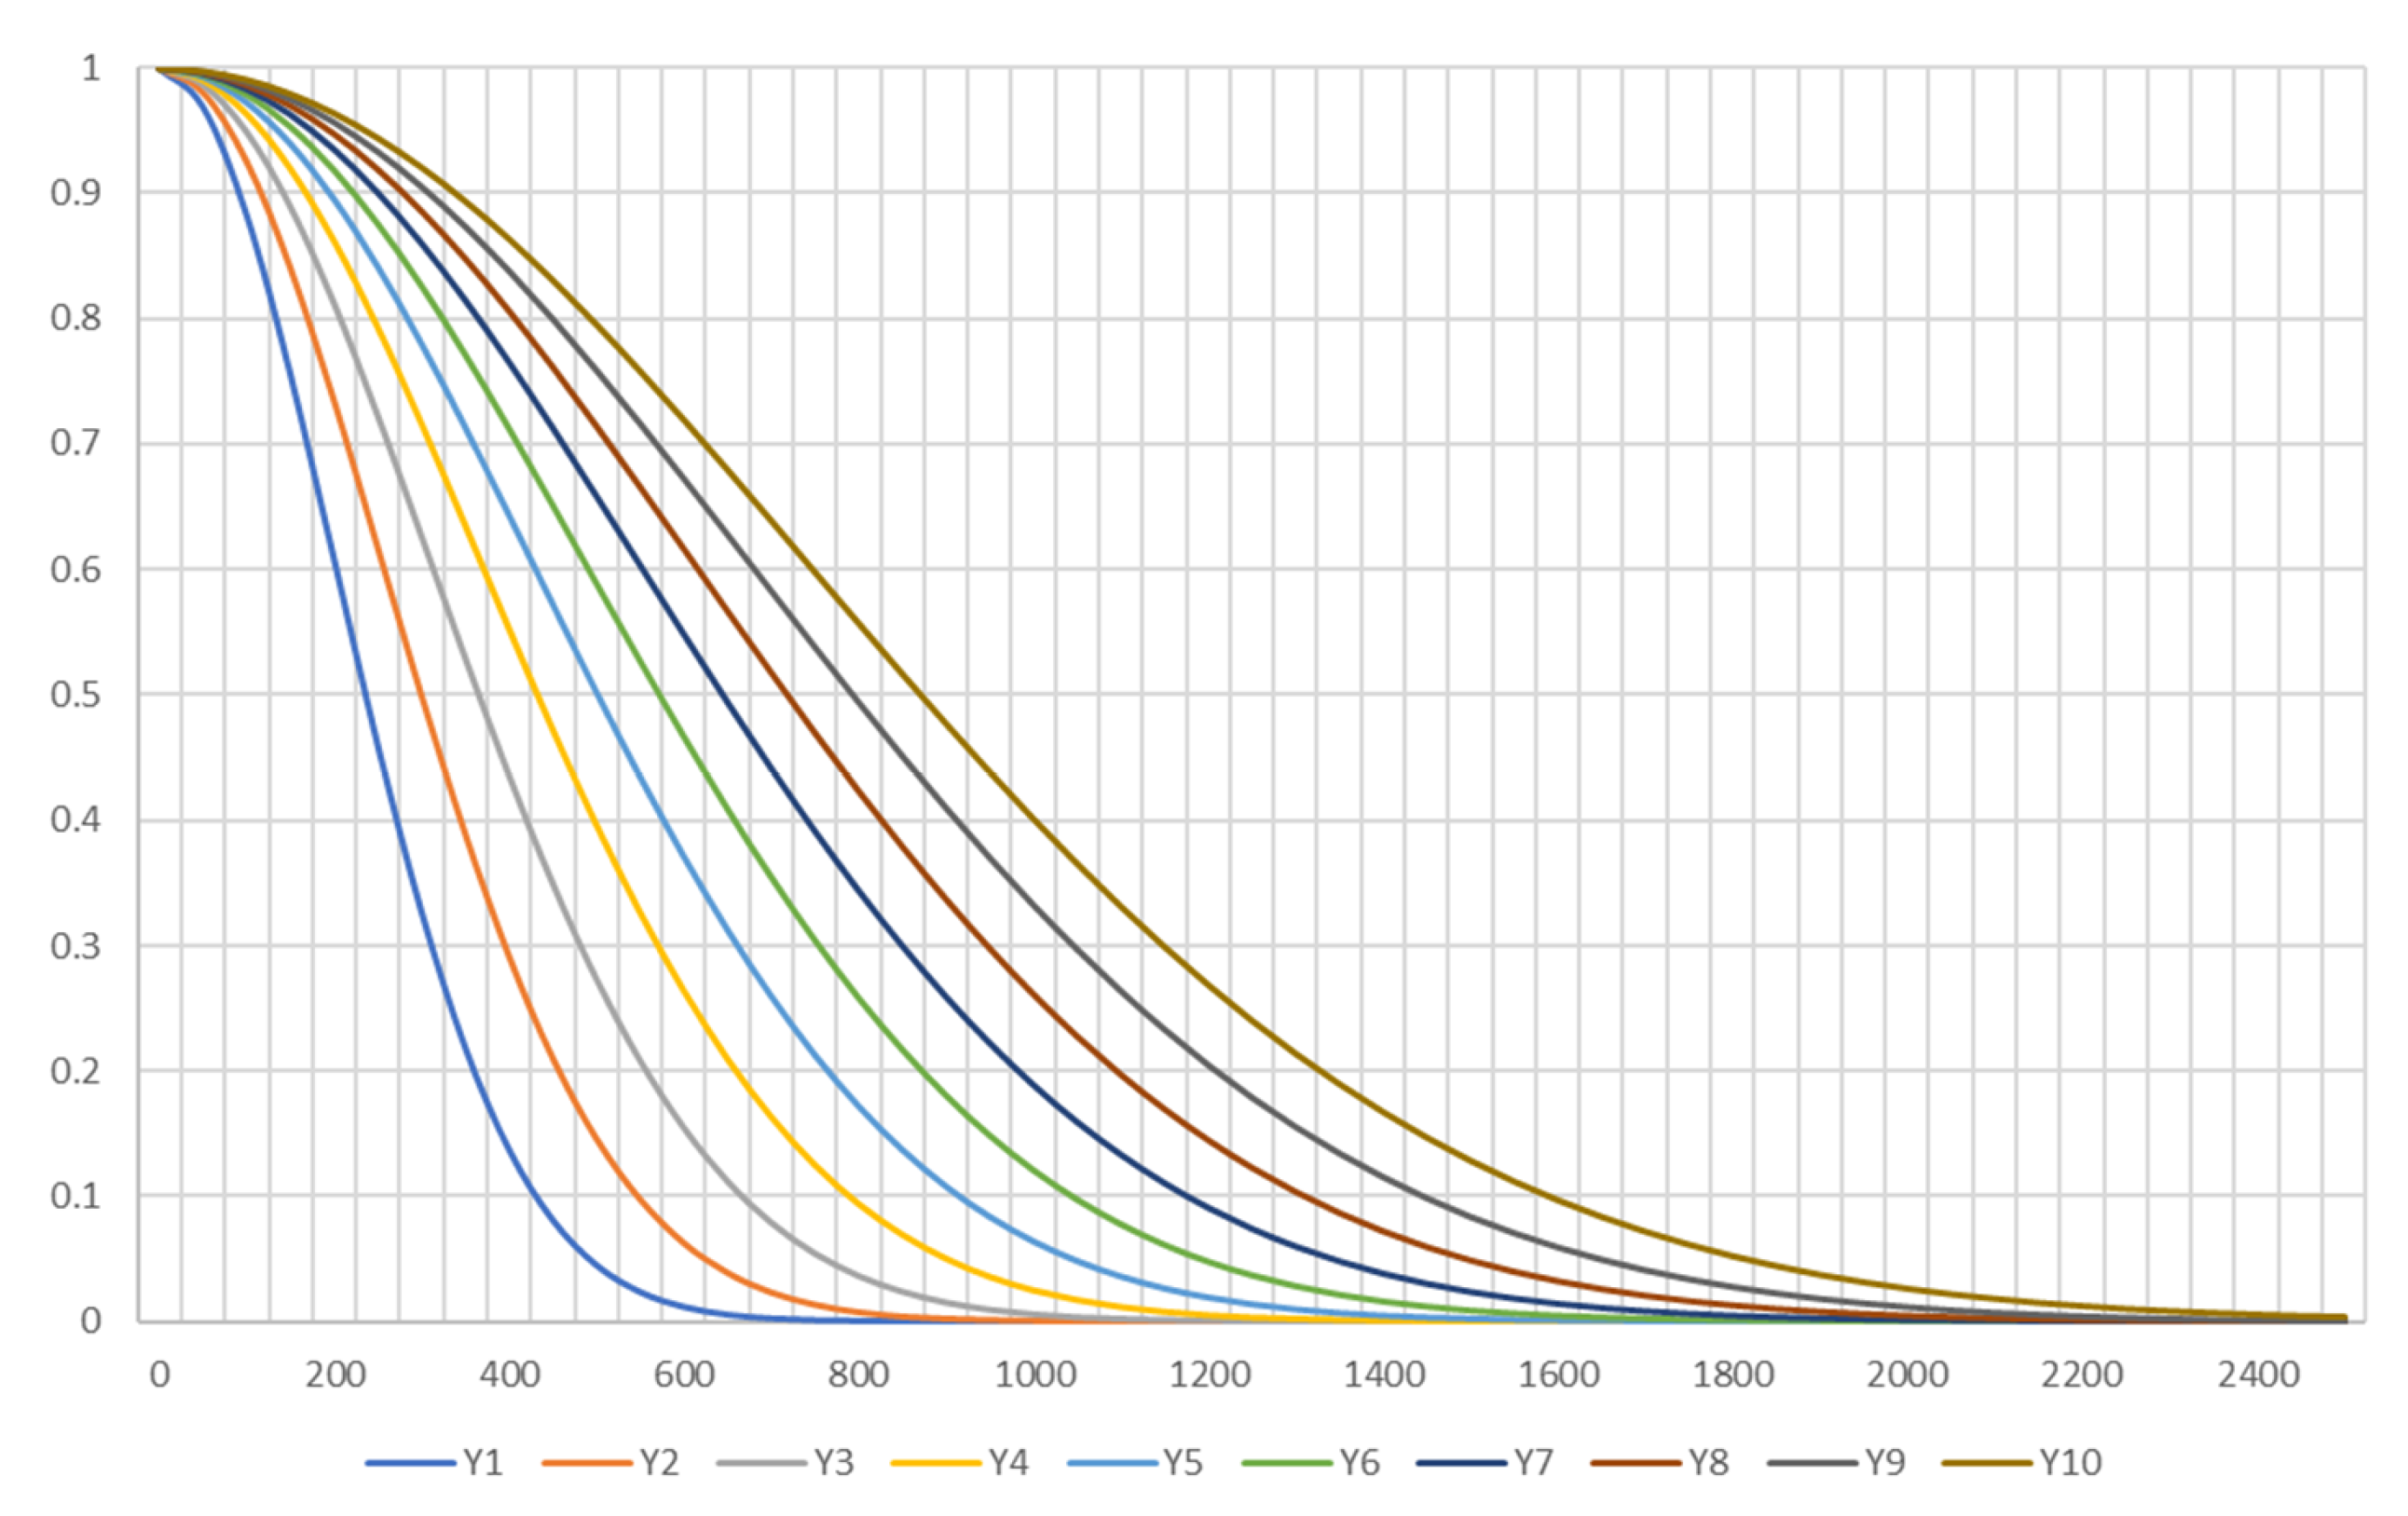
  • Changing DDF shape and walking speed.
The DDF is modelled by the cumulative Gaussian function modified by the β parameter. This parameter influences the steepness of the curve as well as the anticipated walking distance. e.g., β = 140 provides almost zero Gaussian value in 17 min, which can be transformed to a walkable distance of 408 m using the slow gait speed of 0.4 m/s. The opposite end of the testing spectrum uses β = 180 extending the walking time up to 30 min and, correspondingly, the walking distance to 2400 m using a maximal expected gait speed of 1.3 m/s.
We decided to jointly modify both parameters, because both are bound by the physical capabilities of the elderly; lower gait speed usually directly corresponds to smaller walkable distance. Gait speed was modified in the range of 0.4 to 1.3 m/s based on the review. The β parameter was set in the range of 140 to 180 according to [88]. It corresponds well to the model of expected maximal walking distances in the range of 400 to 1600 m (Figure 16). Both ranges were divided into 10 steps for testing.
2.
Changing weights for each type of destination.
As discussed, we used five categories of destination for the elderly. For each type of destination, ten different weights were set between two options based on reported visit frequencies in the two surveys. These 50 weighting variants and 10 β and gait speed variants were used to calculate WS for the maximal buffer of 2414 m.
To evaluate the impacts of modifications, the change of elderly WS for each step and each spatial unit was calculated. Due to the high number of inhabited cells in Ostrava (621) and Hradec Kralove (252), it is difficult to show all results. The evolution of WS values for all cells for modification of gait speed and β coefficient is demonstrated in Figure 17. All weights and their influence on WS for seniors can be found at [97].
Neither testing of different distances between evaluated points (grid size) for elderly WS nor different placement of these points were provided due to the high number of tested parameter combinations. Such a situation could be solved using random simulations, however this is beyond the current calculation capability. It is expected that changes invoked by small differences in placement would have a minor effect on the overall elderly WS assessment.
Changes are summarised in Table 5 where mean, 3rd quartile and 95-percentile are listed. This simple form of sensitivity analysis shows that the impacts of weight modifications within the expected range is quite small. Based on the comparison of different types of destinations, a major impact is found for changes in the speed-β component where the average change of WS for one step is approx. 2 and 95-percentile reaches 7.7. A significantly smaller impact is found for park (0.5 mean and 2.5 for 95-percentile), followed by retail (0.4 and 2.1, resp.). Weights for hypermarket, doctor and entertainment destinations influence the WS on a small scale. e.g., each step in hypermarket weights indicates only a 0.02 value change of WS and 0.09 for 95-percentile. The results are in line with previous findings that distance often overshadows other factors [58].
Zero values in 3rd quartile indicate the lack of available destinations for walking. The different influences on one category of destinations points out the differences between cities due to shortages of required targets and their uneven spatial distribution.
The changes in WS for each testing step show that not all steps have the same impact. Usually, the first 2–3 steps deviate from others providing smaller or larger impact. As you can see, for the dominant speed-β factor, the first three steps indicate the highest variability, but changes are significantly lower for later steps where the change in WS is stabilized around 3 (Ostrava) and 4 (Hradec Kralove) (Figure 18).
Although sensitivity analysis shows the dominant influences of gait speed and beta coefficient are reflected in suitable walkable distance, and a minor effect of weight settings for destinations, users have to consider the real conditions, needs and behavior of specific groups of persons for such settings. Systems with an open setting of weights are recommended.

6. Discussion

Based on comparison of the main indices, several authors have evaluated WAI as the best performing measure for urban walking conditions which successfully captures the variations of urban form [28,48]. Some weaknesses of this index can be seen in its generalisation of land-use classes for the land-use mix, as measured by Shannon’s entropy index [28], difficulties with calculation [19], selection of only objective variables [65], impossibility of result comparison for different cities (not standardised for overall assessment), and the MAUP problem [98]. We applied the calculation for uniform spatial units to eliminate the problem of heterogeneity in size and shape of the spatial units. A circle buffer was applied to establish equivalent units for both WAI and WS assessment.
Appropriate implementation of WAI requires some adaptation and approximation. It is highly recommended to exclude spatial units where the area of interest is less than 1% than the size of the unit. We also applied the approximation recommended by Reyer et al. [28] to substitute FAR with the areal size of commercial buildings.
WS is criticised for its applicability when data sources are sparse and highly generalised [28]. Additionally, it does not take into account differences in trip purpose [61], where only one DDF is applied. To combat these issues, a new application was developed using OSM, Pandada library for searching shortest trips, and the cumulative Gaussian function instead of the polynomial DDF. Due to difficulties in assessing block length in Czech urban conditions, we approximated using the average street segment length. The application enables the adjustment of maximum walking distance, walking speed, Gaussian DDF β coefficient and amenity weights.
Some authors criticize the unclear weighting system for WS [42]. Zhang et al. [25] modified weights to adapt them to rapidly urbanizing Chinese city conditions. They added commercial complexes with a weight of 3 since they are the main venue for shopping and recreation. The weights for school and park entrances were both increased from 1 to 1.5, reflecting their higher importance for the public in Shenzhen and China as a whole. Engels and Liu [99] tested three variants of weight settings for bus stops, parks, recreation facilities, grocery shops and EMS stations, but the selection of weights was arbitrary. Results of our OAP sensitivity analysis indicate that retail and parks represent the largest influence on WS for elderly, however, the weight settings are less important than other parameters such as walkable distance.
In our assessment, we used cumulative Gaussian function for distance-decay effect modelling. Some scholars recommend other functions, e.g., Tiran et al. [61] tested a normalised power-exponential function, Box-Cox’s function, Tanner’s function, and Richards’ function. They found the latter to be the best for modelling purposes, but this function utilises six parameters, which complicates the settings. Horak et al. [82] tested a set of regression functions for different travel modes including walking: exponential, power, Weibull, gamma, lognormal, and Box–Cox. Discussion on the behaviour and testing of these functions can be found in, [100,101,102]. They found the best fit was reached using the Weibull function [103] in the majority of analysed cases. Nevertheless, due to the low influence of weighting, the cumulative Gaussian function can be considered an appropriate and simple solution.
We tested four different radii—400, 800, 1200 and 2414 m, which corresponds to the preferred distances tested by other scholars. Mukhtar et al. [72] calculated indicators for 3 different network radii using 400 m, 800 m, or 1600 m network distances. Lefebvre-Ropars and Morency [48] tested six different search radii (200, 400, 800, 1200, 1600 and 2000 m) using straight-line distances. They concluded that medium-sized search radii (between 400 m and 1200 m) seem to offer a better fit, but also commented that changing search radii has a marginal impact on the precision of mode choice prediction where the largest improvement in model accuracy barely exceeds 2%. In our study, we demonstrated that adjusting the walking distance has a major impact on the outputs. Small buffers for WAI enable the evaluation of local conditions, however, they are demanding on appropriate data sources.
Our results show that the usefulness of WAI quickly degrades with extension of the circle radius. Radii above 800 m cover large areas and therefore provide only general assessments; values are more stable, but they do not provide sufficient spatial detail.
Cities with highly diverse urbanisation and uneven distribution of amenities (e.g., Ostrava) are more sensitive to spatial unit settings. Extension of the spatial unit size causes WAI to drop in isolated suburban settlements (villages) and on peripheries of large dense urban settlements.
Contrarily, WS requires large walking distances to be transformed into corresponding network search radii. Shorter distances are sensitive to errors in destination locations and in road or pedestrian network construction.
One walking distance may not be sufficient when studying large areas as scholars report different reasonable walking distances, mainly for elderly or students. Furthermore, studies are usually focused on urban conditions, namely city centres. This limitation should be taken into account for analysis conducted outside city centres. In the countryside, longer walking distances are more realistic (even for elderly). Using the regular distribution of evaluated points (buffers) is not enough to fully explore local conditions. Results depend on selection of this point and some small shift in its location will generate a slightly different assessment. A Walk Score modification for elderly was developed. The modification is based on selection of different destinations, adaptation of gait speed, walkable distance and β coefficient. Seniors require a different set of destinations than employee and have different purposes for walking trips. Based on the current local research outputs, we selected retail, hypermarket, doctor, park, and entertainment as desired destinations because only these types of targets can be localised and correspond to city conditions. For rural conditions, some destinations should be modified, e.g., the role of park is minimised, however, the majority of destinations are the same for standard WS and rural WS [104,105,106].
WS for elderly shows a significant correlation (p = 0.01) with standard WS in the evaluated cities (R2 0.67 and 0.69) but differences are apparent and the assessment of walking conditions for elderly could not be directly derived from standard WS. As expected, the highly walkable area is smaller and much more diverse for elderly than for adults. Approximately 1/3 of spatial units with 10–15% of the population report the same values. Strong declines in WS for elderly occur in some 20% of units, representing 25–33% of the population. The remaining area shows only moderate declines where differences in walking conditions are negligible.
The sensitivity analysis discovers that the changes of weights for destinations (in the expected range of values) have a low influence on the final WS; it is more important to set appropriate gait speed and β coefficient which influence real accessibility of destinations.

7. Conclusions

Improvement of urban walking conditions has numerous positive effects including supporting a healthy lifestyle and personal well-being, decreasing environmental pollution, and increasing business benefits. Walking as moderate physical activity, a means of self-resilience, and a natural mediator of social contacts is essential for many seniors. Modifications and adaptations of the urban environment to be more friendly towards the needs and wishes of senior pedestrians substantially improves the inclusiveness of our cities.
Objective indicators of walkability contribute to analysis of the urban environment and help to uncover local walking issues and take appropriate measures to improve living conditions. Many indicators have been developed and are often validated by results of local questionnaire surveys. Less is known, however, about their spatial behaviour, how to set important parameters and which impacts can be expected for various uncertainties included in such models.
To evaluate the spatial pattern of objective-based indicators, two popular indices were selected—WAI [64] representing statistical-based indicators, and WS which applies an accessibility-based approach. Both indicators were evaluated in adequate spatial units (buffers with radii from 400 m to 2414 m) in two Czech cities. This enabled comparison of the results and exploration of the pattern of these indices. The impact of different buffers placement was not examined. A new software tool was developed for the calculation of Walk Score using OSM data and freely available network services. To better address requirements for the elderly, a new variant of WS was designed and enumerated. This tool is available at [91]. The standard DDF for WS was substituted by a cumulative Gaussian function with different settings of β coefficient influencing the steepness and range of the function according to recommended walkable distances. Different gait speed and variable settings of targets and their weights enabled the adaptation of WS to local conditions and personal needs. A sensitivity analysis discovered the major influences of gait speed and the β coefficient on the walkability assessment.
The assessment of WS for both cities indicates that approx. 40% of inhabitants are likely car dependent due to unsatisfactory walking conditions.
A joint analysis of comparable WAI and WS assessments shows different spatial pattern for each index where WAI performs better with smaller radii (up to approx. 800 m) while for WS a larger radius is favourable (>800 m). These findings are partly in line with previous studies where radii of 400–600 m [19,26,51,80] are usually preferred.
For people constrained to short walking distances, the results of adapted WS for elderly may be not relevant. A substitution of unavailable usual targets by those available, e.g., parks or “no target” walking such as a walking loop around one’s residence can be expected. In such cases, environmental-based indicators such as WAI should perform better for walkability assessment. This limitation should also be taken into account for mixed indicators where the network-based components may be underestimated as a result of the combination of unavailable usual targets and short walking distances.
The comparison of standard WS and WS for the elderly confirms an expected overall decrease in walkability, but with unexpected intensity. Approximately 1/3 of locations, representing 10–15% of the population, do not show a change in WS, therefore the conditions for “standard walking” and “elderly walking” are assessed as the same. A large drop in WS for the elderly is recorded in approximately 20% of the inhabited area in Ostrava and 17% of the inhabited area of Hradec Kralove, representing 33% of the population in Ostrava and 25% of the population in Hradec Kralove. A specific pattern was recognised in Ostrava where these locations surround dense settlement units or occur in places with internal geographical barriers.
Concerning limitations of the current study, only a regular grid of buffers with 500 m distance was studied and influences of different placements were not evaluated. The introduced WS for the elderly represents a simple adaptation of WS and further improvement is envisaged. Obviously, there are many simplification issues which occur from generalisation of seniors’ capabilities, interests and needs. Additionally, destinations and propensity to walk are not stable for each person or group, but change over time (e.g., due to seasonal changes or trends influenced by aging). Further limitations can be seen in the OAP approach and mesoscale representation of urban environments.
An OAP approach used for sensitivity analysis provides a simple solution where, e.g., multicollinearity issues for weighting of destinations are not considered. More advanced analysis with Monte Carlo simulations and variance-based methods should bring deeper understanding of relationships in the weighting system.
The current assessment is based on a simple graph representation of streets. Elderly people require more detailed evaluation of pedestrian conditions (moving from mezo- to micro-scale). Instead of street net, pedestrian net usage on real sidewalks should be constructed utilising parameters influencing propensity to walk such as width of the pavement, the surface, slope, traffic, obstacles, and resting places. Inspiration may be found in proposals of new indices for elderly dealing with such urban tissue details such as a multifactor Walkability Index for Elderly Health (WIEH) [19]. Such approaches are quite demanding on data sources and frequently require data integration and supplementation from different sources including field surveys (see Supplementary Materials).

Supplementary Materials

The following supporting information can be downloaded at: https://www.mdpi.com/article/10.3390/ijgi11050279/s1, datafigure9.CSV, datafigure11.CSV.

Author Contributions

Conceptualization, Jiri Horak and Pavel Kukuliac; data curation, Lucie Orlikova and Ondrej Kolodziej; formal analysis, Petra Maresova; methodology, Jiri Horak and Pavel Kukuliac; software, Pavel Kukuliac; validation, Jiří Horák; visualization, Lucie Orlikova and Ondrej Kolodziej; writing—original draft, Jiri Horak and Pavel Kukuliac; writing—review & editing, Petra Maresova. All authors have read and agreed to the published version of the manuscript.

Funding

This research was funded by the Czech Science Foundation, grant number 21-22276S “Accessibility modelling for seniors, perception of accessibility and determinants of their spatial mobility”.

Institutional Review Board Statement

Not applicable.

Conflicts of Interest

The authors declare no conflict of interest. The funders had no role in the design of the study; in the collection, analyses, or interpretation of data.

References

  1. Wendel-Vos, W.; Droomers, M.; Kremers, S.; Brug, J.; Van Lenthe, F. Potential environmental determinants of physical activity in adults: A systematic review. Obes. Rev. 2007, 8, 425–440. [Google Scholar] [CrossRef] [PubMed]
  2. Mathers, C.D.; Stevenson, C.E.; Vos, E.T.; Begg, S.J. The Australian Burden of Disease Study: Measuring the loss of health from diseases, injuries and risk factors. Med. J. Aust. 2000, 172, 592–596. [Google Scholar] [CrossRef] [PubMed]
  3. Yen, I.H.; Anderson, L.A. Built Environment and Mobility of Older Adults: Important Policy and Practice Efforts. J. Am. Geriatr. Soc. 2012, 60, 951–956. [Google Scholar] [CrossRef] [PubMed] [Green Version]
  4. Kenyon, A.; Pearce, J. The socio-spatial distribution of walkable environments in urban Scotland: A case study from Glasgow and Edinburgh. SSM Popul. Health 2019, 9, 100461. [Google Scholar] [CrossRef] [PubMed]
  5. Riva, M.; Gauvin, L.; Apparicio, P.; Brodeur, J.-M. Disentangling the relative influence of built and socioeconomic environments on walking: The contribution of areas homogenous along exposures of interest. Soc. Sci. Med. 2009, 69, 1296–1305. [Google Scholar] [CrossRef] [Green Version]
  6. Hawkes, T.D.; Siu, K.-C.; Silsupadol, P.; Woollacott, M.H. Why does older adults’ balance become less stable when walking and performing a secondary task? Examination of attentional switching abilities. Gait Posture 2012, 35, 159–163. [Google Scholar] [CrossRef] [Green Version]
  7. Webber, M.S.C.; Porter, M.M.; Menec, V.H. Mobility in Older Adults: A Comprehensive Framework. Gerontologist 2010, 50, 443–450. [Google Scholar] [CrossRef] [Green Version]
  8. Burlando, C.; Cusano, I. Growing Old and Keep Mobile in Italy. Active Ageing and the Importance of Urban Mobility Planning Strategies. Tema J. Land Use Mobil. Environ. 2018, 2, 43–52. [Google Scholar] [CrossRef]
  9. Peace, S.M.; Kellaher, L.A.; Holland, C. Environment and Identity in Later Life; Open University Press: Maidenhead, UK; New York, NY, USA, 2006. [Google Scholar]
  10. Vidovićová, L. Stáří ve Městě, Město v Životě Seniorů. Sociologické Nakladatelstvi (SLON); Masarykova Univerzita: Praha, Czech Republic; Brno, Czech Republic, 2013. [Google Scholar]
  11. Marcellini, F.; Principi, A.; Ciarrocchi, S.; Mollenkopf, H.; Tacken, M.; Ruoppila, I.; Szeman, Z. Mobility Aspects of Older People in Europe: Main Findings of the European Project “Mobilate”. Eur. J. Ageing 2004, 1, 45–53. [Google Scholar]
  12. Ramezani, S.; Laatikainen, T.; Hasanzadeh, K.; Kyttä, M. Shopping trip mode choice of older adults: An application of activity space and hybrid choice models in understanding the effects of built environment and personal goals. Transportation 2019, 48, 505–536. [Google Scholar] [CrossRef] [Green Version]
  13. Verbrugge, L.M.; Jette, A. The disablement process. Soc. Sci. Med. 1994, 38, 1–14. [Google Scholar] [CrossRef] [Green Version]
  14. Vidovićová, L.; Gregorová, E. Nová města a staří lidé. Sociální Studia Soc. Stud. 2010, 7, 81–93. [Google Scholar] [CrossRef] [Green Version]
  15. Haustein, S. Mobility behavior of the elderly: An attitude-based segmentation approach for a heterogeneous target group. Transportation 2011, 39, 1079–1103. [Google Scholar] [CrossRef]
  16. Naumann, L.P.; Vazire, S.; Rentfrow, P.J.; Gosling, S. Personality Judgments Based on Physical Appearance. Pers. Soc. Psychol. Bull. 2009, 35, 1661–1671. [Google Scholar] [CrossRef]
  17. Wang, J.; Cao, X. Exploring built environment correlates of walking distance of transit egress in the Twin Cities. J. Transp. Geogr. 2017, 64, 132–138. [Google Scholar] [CrossRef]
  18. Stehlíková, J.; Řezník, T. An accessible Brno city centre for people with impaired mobility. J. Maps 2018, 14, 81–87. [Google Scholar] [CrossRef] [Green Version]
  19. Alves, F.; Cruz, S.; Ribeiro, A.; Silva, A.B.; Martins, J.; Cunha, I. Walkability Index for Elderly Health: A Proposal. Sustainability 2020, 12, 7360. [Google Scholar] [CrossRef]
  20. Feng, L.; Shi, Z.; Xie, J.; Ma, B.; Chen, X. Enhancer of polycomb maintains germline activity and genome integrity in Drosophila testis. Cell Death Differ. 2018, 25, 1486–1502. [Google Scholar] [CrossRef]
  21. Meşhur, H.F.A. Evaluation of Urban Spaces from the Perspective of Universal Design Principles: The Case of Konya/Turkey. TeMA J. Land Use Mobil. Environ. 2016, 9, 191–208. [Google Scholar]
  22. Elsawahli, H.; Ahmad, F.; Ali, A.S. New urbanism design principles and young elderly active lifestyle: An analysis of TTDI neighbourhood in Kuala Lumpur, Malaysia. Urban Des. Int. 2013, 19, 249–258. [Google Scholar] [CrossRef]
  23. Wu, H.-C.; Tseng, M.-H. Evaluating Disparities in Elderly Community Care Resources: Using a Geographic Accessibility and Inequality Index. Int. J. Environ. Res. Public Health 2018, 15, 1353. [Google Scholar] [CrossRef] [Green Version]
  24. Van Cauwenberg, J.; De Bourdeaudhuij, I.; De Meester, F.; Van Dyck, D.; Salmon, J.; Clarys, P.; Deforche, B. Relationship between the physical environment and physical activity in older adults: A systematic review. Health Place 2011, 17, 458–469. [Google Scholar] [CrossRef] [PubMed]
  25. Zhang, J.; Tan, P.Y.; Zeng, H.; Zhang, Y. Walkability Assessment in a Rapidly Urbanizing City and Its Relationship with Residential Estate Value. Sustainability 2019, 11, 2205. [Google Scholar] [CrossRef] [Green Version]
  26. Gaglione, F.; Gargiulo, C.; Zucaro, F. Elders’ quality of life. A method to optimize pedestrian accessibility to urban services. Tema J. Land Use Mobil. Environ. 2019, 3, 295–312. [Google Scholar] [CrossRef]
  27. Gharaveis, A. A systematic framework for understanding environmental design influences on physical activity in the elderly population. Facilities 2020, 38, 625–649. [Google Scholar] [CrossRef]
  28. Reyer, M.; Fina, S.; Siedentop, S.; Schlicht, W. Walkability is Only Part of the Story: Walking for Transportation in Stuttgart, Germany. Int. J. Environ. Res. Public Health 2014, 11, 5849–5865. [Google Scholar] [CrossRef] [PubMed]
  29. Riggs, W.; Sethi, S.A. Multimodal travel behaviour, walkability indices, and social mobility: How neighbourhood walkability, income and household characteristics guide walking, biking & transit decisions. Local Environ. 2020, 25, 57–68. [Google Scholar] [CrossRef]
  30. Ewing, R.; Cervero, R. Travel and the Built Environment: A meta-analysis. J. Am. Plan. Assoc. 2010, 76, 265–294. [Google Scholar] [CrossRef]
  31. Heath, G.W.; Brownson, R.C.; Kruger, J.; Miles, R.; Powell, K.E.; Ramsey, L.T. The Effectiveness of Urban Design and Land Use and Transport Policies and Practices to Increase Physical Activity: A Systematic Review. J. Phys. Act. Health 2006, 3, S55–S76. [Google Scholar] [CrossRef]
  32. Saelens, B.E.; Sallis, J.F.; Frank, L.D. Environmental correlates of walking and cycling: Findings from the transportation, urban design, and planning literatures. Ann. Behav. Med. 2003, 25, 80–91. [Google Scholar] [CrossRef]
  33. Hanson, S.; Berkowitz, B.A.; Ainsworth, B.E.; Blair, S.N.; Cervero, R.B.; Chen, D.D.T.; Crane, R.; Fullilove, M.T.; Giuliano, G.; Lawton, T.K.; et al. Does the Built Environment Influence Physical Activity? Transportation Research Board: Washington, DC, USA, 2005. [Google Scholar]
  34. Cerin, E.; Saelens, B.E.; Sallis, J.F.; Frank, L.D. Neighborhood Environment Walkability Scale: Validity and Development of a Short Form. Med. Sci. Sports Exerc. 2006, 38, 1682–1691. [Google Scholar] [CrossRef] [PubMed] [Green Version]
  35. Arentze, T.T.; Timmermans, H.H. Social Networks, Social Interactions, and Activity-Travel Behavior: A Framework for Microsimulation. Environ. Plan. B Plan. Des. 2008, 35, 1012–1027. [Google Scholar] [CrossRef]
  36. Frochen, S.; Ailshire, J.; Rodnyansky, S. Residential Care in Los Angeles: Evaluating the spatial distribution of facilities and neighbourhood access to care among older adults. Local Environ. 2019, 24, 274–288. [Google Scholar] [CrossRef] [PubMed]
  37. Padeiro, M. Geographical accessibility to community pharmacies by the elderly in metropolitan Lisbon. Res. Soc. Adm. Pharm. 2018, 14, 653–662. [Google Scholar] [CrossRef] [PubMed]
  38. Bruns, C.R.; Chamberlain, B. The influence of landmarks and urban form on cognitive maps using virtual reality. Landsc. Urban Plan. 2019, 189, 296–306. [Google Scholar] [CrossRef] [Green Version]
  39. Filomena, G.; Manley, E.; Verstegen, J.A. Perception of urban subdivisions in pedestrian movement simulation. PLoS ONE 2020, 15, e0244099. [Google Scholar] [CrossRef]
  40. Pafka, E.; Dovey, K. Permeability and interface catchment: Measuring and mapping walkable access. J. Urban. Int. Res. Placemaking Urban Sustain. 2016, 10, 150–162. [Google Scholar] [CrossRef]
  41. Horton, F.E.; Reynolds, D.R. Effects of Urban Spatial Structure on Individual Behavior. Econ. Geogr. 1971, 47, 36. [Google Scholar] [CrossRef]
  42. Deng, C.; Dong, X.; Wang, H.; Lin, W.; Wen, H.; Frazier, J.; Ho, H.C.; Holmes, L. A Data-Driven Framework for Walkability Measurement with Open Data: A Case Study of Triple Cities, New York. ISPRS Int. J. Geo-Inf. 2020, 9, 36. [Google Scholar] [CrossRef] [Green Version]
  43. Bielik, M.; König, R.; Schneider, S.; Varoudis, T. Measuring the Impact of Street Network Configuration on the Accessibility to People and Walking Attractors. Netw. Spat. Econ. 2018, 18, 657–676. [Google Scholar] [CrossRef]
  44. Dovey, K.; Pafka, E. What is walkability? The urban DMA. Urban Stud. 2019, 57, 93–108. [Google Scholar] [CrossRef]
  45. Moura, F.; Cambra, P.; Gonçalves, A.B. Measuring walkability for distinct pedestrian groups with a participatory assessment method: A case study in Lisbon. Landsc. Urban Plan. 2017, 157, 282–296. [Google Scholar] [CrossRef]
  46. Vale, D.S.; Saraiva, M.; Pereira, M. Active accessibility: A review of operational measures of walking and cycling accessibility. J. Transp. Land Use 2015, 9, 209–235. [Google Scholar] [CrossRef]
  47. Kim, E.J.; Kim, Y.-J. A Reliability Check of Walkability Indices in Seoul, Korea. Sustainability 2019, 12, 176. [Google Scholar] [CrossRef] [Green Version]
  48. Lefebvre-Ropars, G.; Morency, C. Walkability: Which Measure to Choose, Where to Measure It, and How? Transp. Res. Rec. J. Transp. Res. Board 2018, 2672, 139–150. [Google Scholar] [CrossRef]
  49. Mooney, S.J.; Hurvitz, P.M.; Moudon, A.V.; Zhou, C.; Dalmat, R.; Saelens, B.E. Residential neighborhood features associated with objectively measured walking near home: Revisiting walkability using the Automatic Context Measurement Tool (ACMT). Health Place 2020, 63, 102332. [Google Scholar] [CrossRef]
  50. Shashank, A.; Schuurman, N. Unpacking walkability indices and their inherent assumptions. Health Place 2018, 55, 145–154. [Google Scholar] [CrossRef]
  51. Leão, A.L.F.; Urbano, M.R. Street connectivity and walking: An empirical study in Londrina-PR. Semin. Ciências Exatas Tecnológicas 2020, 41, 31–42. [Google Scholar] [CrossRef]
  52. Cervero, R.; Kockelman, K. Travel demand and the 3Ds: Density, diversity, and design. Transp. Res. Part D Transp. Environ. 1997, 2, 199–219. [Google Scholar] [CrossRef]
  53. Wong, B.Y.-M.; Faulkner, G.; Buliung, R. GIS measured environmental correlates of active school transport: A systematic review of 14 studies. Int. J. Behav. Nutr. Phys. Act. 2011, 8, 39. [Google Scholar] [CrossRef] [Green Version]
  54. Zhang, W.; Lu, D.; Zhao, Y.; Luo, X.; Yin, J. Incorporating polycentric development and neighborhood life-circle planning for reducing driving in Beijing: Nonlinear and threshold analysis. Cities 2021, 121, 103488. [Google Scholar] [CrossRef]
  55. Al Shammas, T.; Escobar, F. Comfort and Time-Based Walkability Index Design: A GIS-Based Proposal. Int. J. Environ. Res. Public Health 2019, 16, 2850. [Google Scholar] [CrossRef] [PubMed] [Green Version]
  56. Zhu, X.; Lee, C. Walkability and Safety Around Elementary Schools: Economic and Ethnic Disparities. Am. J. Prev. Med. 2008, 34, 282–290. [Google Scholar] [CrossRef] [PubMed]
  57. Golan, Y.; Wilkinson, N.; Henderson, J.M.; Weverka, A. Gendered walkability: Building a daytime walkability index for women. J. Transp. Land Use 2019, 12, 501–526. [Google Scholar] [CrossRef]
  58. Lee, S.; Lee, C.; Nam, J.W.; Abbey-Lambertz, M.; Mendoza, J.A. School walkability index: Application of environmental audit tool and GIS. J. Transp. Health 2020, 18, 100880. [Google Scholar] [CrossRef] [PubMed]
  59. Hajna, S.; Dasgupta, K.; Halparin, M.; Ross, N.A. Neighborhood Walkability. Am. J. Prev. Med. 2013, 44, e55–e59. [Google Scholar] [CrossRef]
  60. Lin, L.; Moudon, A.V. Objective versus subjective measures of the built environment, which are most effective in capturing associations with walking? Health Place 2009, 16, 339–348. [Google Scholar] [CrossRef]
  61. Tiran, J.; Lakner, M.; Drobne, S. Modelling walking accessibility: A case study of Ljubljana, Slovenia. Morav. Geogr. Rep. 2019, 27, 194–206. [Google Scholar] [CrossRef] [Green Version]
  62. Handy, S. Is accessibility an idea whose time has finally come? Transp. Res. Part D Transp. Environ. 2020, 83, 102319. [Google Scholar] [CrossRef]
  63. Zhang, W.; Zhao, Y.; Cao, X.; Lu, D.; Chai, Y. Nonlinear effect of accessibility on car ownership in Beijing: Pedestrian-scale neighborhood planning. Transp. Res. Part D Transp. Environ. 2020, 86, 102445. [Google Scholar] [CrossRef]
  64. Frank, L.D.; Sallis, J.F.; Saelens, B.E.; Leary, L.; Cain, K.; Conway, T.L.; Hess, P.M. The development of a walkability index: Application to the Neighborhood Quality of Life Study. Br. J. Sports Med. 2010, 44, 924–933. [Google Scholar] [CrossRef] [PubMed]
  65. Arellana, J.; Saltarín, M.; Larrañaga, A.M.; Alvarez, V.; Henao, C.A. Urban walkability considering pedestrians’ perceptions of the built environment: A 10-year review and a case study in a Medium-sized city in Latin America. Transp. Rev. 2020, 40, 183–203. [Google Scholar] [CrossRef]
  66. Kim, E.J.; Kim, J.; Kim, H. Does Environmental Walkability Matter? The Role of Walkable Environment in Active Commuting. Int. J. Environ. Res. Public Health 2020, 17, 1261. [Google Scholar] [CrossRef] [PubMed] [Green Version]
  67. Watson, K.B.; Whitfield, G.P.; Thomas, J.V.; Berrigan, D.; Fulton, J.E.; Carlson, S.A. Associations between the National Walkability Index and walking among US Adults—National Health Interview Survey, 2015. Prev. Med. 2020, 137, 106122. [Google Scholar] [CrossRef] [PubMed]
  68. Find Apartments for Rent and Rentals-Get Your Walk Score. Available online: http://walkscore.com (accessed on 24 April 2022).
  69. Buck, C.; Pohlabeln, H.; Huybrechts, I.; De Bourdeaudhuij, I.; Pitsiladis, Y.; Reisch, L.; Pigeot, I. Development and application of a moveability index to quantify possibilities for physical activity in the built environment of children. Health Place 2011, 17, 1191–1201. [Google Scholar] [CrossRef]
  70. Singleton, P.; Muhs, C.; Schneider, R.; Clifton, K. Predicting Walking Trips: The Pedestrian Index of the Environment (PIE). In Proceedings of the Pro Walk/Pro Bike/Pro Place Conference, Pittsburgh, PA, USA, 11–18 September 2014. [Google Scholar]
  71. Witten, K.; Pearce, J.; Day, P. Neighbourhood Destination Accessibility Index: A GIS Tool for Measuring Infrastructure Support for Neighbourhood Physical Activity. Environ. Plan. A Econ. Space 2011, 43, 205–223. [Google Scholar] [CrossRef]
  72. Mukhtar, M.; Guillette, D.; Lapos, N.; Fitzpatrick, S.; Jaros, R. An Objective Walkability Index for Public Health and Planning in Peel Region, Ontario, Canada. Prev. Chronic Dis. 2019, 16, 180469. [Google Scholar] [CrossRef]
  73. Clifton, K.J.; Singleton, P.; Muhs, C.D.; Schneider, R.J. Representing pedestrian activity in travel demand models: Framework and application. J. Transp. Geogr. 2016, 52, 111–122. [Google Scholar] [CrossRef]
  74. ILS-Monitoring Stadtregionen. Available online: https://ils-stadtregionen.de/ (accessed on 24 April 2022).
  75. Lawhon, L.L. Neighborhood Unit. In Encyclopedia of Quality of Life and Well-Being Research; Springer: Dordrecht, The Netherlands, 2014; pp. 4335–4337. [Google Scholar]
  76. Hirsch, J.A.; Moore, K.A.; Evenson, K.R.; Rodriguez, D.A.; Roux, A.V.D. Walk Score® and Transit Score® and Walking in the Multi-Ethnic Study of Atherosclerosis. Am. J. Prev. Med. 2013, 45, 158–166. [Google Scholar] [CrossRef] [Green Version]
  77. Chudyk, A.M.; Winters, M.; Moniruzzaman, M.D.; Ashe, M.C.; Gould, J.S.; McKay, H. Destinations matter: The association between where older adults live and their travel behavior. J. Transp. Health 2014, 2, 50–57. [Google Scholar] [CrossRef] [Green Version]
  78. Chiu, M.; Shah, B.R.; Maclagan, L.C.; Rezai, M.-R.; Austin, P.C.; Tu, J. v Walk Score® and the Prevalence of Utilitarian Walking and Obesity among Ontario Adults: A Cross-Sectional Study. Health Rep. 2015, 26, 3–10. [Google Scholar] [PubMed]
  79. Kuzmyak, J.R.; Baber, C.; Savory, D. Use of Walk Opportunities Index to Quantify Local Accessibility. Transp. Res. Rec. J. Transp. Res. Board 2006, 1977, 145–153. [Google Scholar] [CrossRef]
  80. Chen, Y.; Bouferguene, A.; Li, H.; Liu, H.; Shen, Y.; Al-Hussein, M. Spatial gaps in urban public transport supply and demand from the perspective of sustainability. J. Clean. Prod. 2018, 195, 1237–1248. [Google Scholar] [CrossRef]
  81. Burton, E.; Mitchell, L. Inclusive Urban Design: Streets for Life; Routledge: Oxford, UK, 2006; ISBN 978-0750664585. [Google Scholar]
  82. Horák, J.; Burian, J.; Ivan, I.; Zajíčková, L.; Tesla, J.; Voženílek, V.; Fojtík, D.; Inspektor, T.; Rypka, M. Prostorové Simulační Modelování Dopravní Dostupnosti; Česká Geografická Společnost: Praha, Czech Republic, 2019; ISBN 978-80-907728-0-9. [Google Scholar]
  83. Walk Score Methodology Walk Score. 2011. Available online: http://pubs.cedeus.cl/omeka/files/original/b6fa690993d59007784a7a26804d42be.pdf (accessed on 24 April 2022).
  84. AlShareef, F.; Aljoufie, M. Identification of the Proper Criteria Set for Neighborhood Walkability Using the Fuzzy Analytic Hierarchy Process Model: A Case Study in Jeddah, Saudi Arabia. Sustainability 2020, 12, 9286. [Google Scholar] [CrossRef]
  85. Carr, L.J.; Dunsiger, S.I.; Marcus, B.H. Validation of Walk Score for estimating access to walkable amenities. Br. J. Sports Med. 2011, 45, 1144–1148. [Google Scholar] [CrossRef] [PubMed]
  86. Vale, D.S.; Pereira, M. The influence of the impedance function on gravity-based pedestrian accessibility measures: A comparative analysis. Environ. Plan. B Urban Anal. City Sci. 2016, 44, 740–763. [Google Scholar] [CrossRef]
  87. Kwan, M.-P. Space-Time and Integral Measures of Individual Accessibility: A Comparative Analysis Using a Point-based Framework. Geogr. Anal. 2010, 30, 191–216. [Google Scholar] [CrossRef]
  88. Guida, C.; Carpentieri, G. Quality of life in the urban environment and primary health services for the elderly during the Covid-19 pandemic: An application to the city of Milan (Italy). Cities 2020, 110, 103038. [Google Scholar] [CrossRef]
  89. Bauer, J.; Groneberg, D.A. Measuring Spatial Accessibility of Health Care Providers–Introduction of a Variable Distance Decay Function within the Floating Catchment Area (FCA) Method. PLoS ONE 2016, 11, e0159148. [Google Scholar] [CrossRef] [Green Version]
  90. Dobešová, Z.; Křivka, T. Walkability Index in the Urban Planning: A Case Study in Olomouc City. In Advances in Spatial Planning; InTech: London, UK, 2012. [Google Scholar]
  91. PavelKVSB/Walkscore-WAI-Walkability: Adaptation of the Walkscore Methodology in the European Environment-Two Versions were Implemented: Classic Walkscore and Walkscore for the Elderly. WAI Adaptation for Overlapping Input Regions. Available online: https://github.com/PavelKVSB/Walkscore-WAI-walkability.git (accessed on 24 April 2022).
  92. Foti, F.; Waddell, P.; Luxen, D. A Generalized Computational Framework for Accessibility: From the Pedestrian to the Metropolitan Scale. In Proceedings of the 4th TRB Conference on Innovations in Travel Modeling, Tampa, FL, USA, 30 April–2 May 2012; pp. 1–14. [Google Scholar]
  93. Connected_Components—NetworkX 2.8 Documentation. Available online: https://networkx.org/documentation/stable/reference/algorithms/generated/networkx.algorithms.components.connected_components.html (accessed on 24 April 2022).
  94. Handy, S.; Paterson, R.G.; Butler, K. Planning for Street Connectivity: Getting from Here to There; American Planning Association: Chicago, IL, USA, 2003; ISBN 1-884829-86-4. [Google Scholar]
  95. Spilková, J. “Tell Me Where You Shop, and I Will Tell You Who You Are”: Czech Shopper Profiles According to Traditional, Large-Scale and Alternative Retail Options. Morav. Geogr. Rep. 2018, 26, 186–198. [Google Scholar] [CrossRef] [Green Version]
  96. Murphy, J.M.; Sexton, D.M.H.; Barnett, D.N.; Jones, G.S.; Webb, M.J.; Collins, M.; Stainforth, D. Quantification of modelling uncertainties in a large ensemble of climate change simulations. Nature 2004, 430, 768–772. [Google Scholar] [CrossRef] [PubMed]
  97. Grafy_zpracovani_walkscore by GIS VSB. Available online: https://public.tableau.com/app/profile/gis.vsb/viz/grafy_zpracovani_walkscore/WALKSCORE (accessed on 24 April 2022).
  98. Openshaw, S. Unit Problem Modifiable Areal Catmog-Concepts and Techniques in Modern Geography; Geo Books: Norwich, UK, 1983; ISBN 0-86094-134-5. [Google Scholar]
  99. Engels, B.; Liu, G.-J. Social exclusion, location and transport disadvantage amongst non-driving seniors in a Melbourne municipality, Australia. J. Transp. Geogr. 2011, 19, 984–996. [Google Scholar] [CrossRef]
  100. Olsson, M. Functional regions in gravity models and accessibility measures. Morav. Geogr. Rep. 2016, 24, 60–70. [Google Scholar] [CrossRef] [Green Version]
  101. Halás, M.; Klapka, P. Spatial influence of regional centres of Slovakia: Analysis based on the distance-decay function. Rendiconti Lince 2015, 26, 169–185. [Google Scholar] [CrossRef]
  102. Martinez, L.; Viegas, J.M. A new approach to modelling distance-decay functions for accessibility assessment in transport studies. J. Transp. Geogr. 2013, 26, 87–96. [Google Scholar] [CrossRef]
  103. Rinne, H. The Weibull Distribution; Chapman and Hall/CRC: London, UK, 2008; ISBN 9781420087444. [Google Scholar]
  104. Ahern, A.; Hine, J. Rural transport–Valuing the mobility of older people. Res. Transp. Econ. 2012, 34, 27–34. [Google Scholar] [CrossRef]
  105. Titheridge, H.; Achuthan, K.; Mackett, R.L.; Solomon, J. Assessing the extent of transport social exclusion among the elderly. J. Transp. Land Use 2009, 2, 31–48. [Google Scholar] [CrossRef] [Green Version]
  106. Plazinić, B.R.; Jović, J. Mobility and transport potential of elderly in differently accessible rural areas. J. Transp. Geogr. 2018, 68, 169–180. [Google Scholar] [CrossRef]
Figure 1. Cumulative relative frequency of walking distances in Ostrava and Olomouc, 2014.
Ijgi 11 00279 g001
Figure 2. Location of evaluated cities.
Ijgi 11 00279 g002
Figure 3. Main input data required for calculation of WAI and WS.
Ijgi 11 00279 g003
Figure 4. WAI for different buffers in Hradec Kralove (left) and Ostrava (right).
Ijgi 11 00279 g004
Figure 5. Land use in Hradec Kralove and Ostrava (Data50, COSMC 2021).
Ijgi 11 00279 g005
Figure 6. Local development of WAI from 400 m to 2414 m for Hradec Kralove and Ostrava.
Ijgi 11 00279 g006
Figure 7. Standard WS for different buffers in Hradec Kralove (left) and Ostrava (right).
Ijgi 11 00279 g007
Figure 8. Average changes of WAI (a) and WS (b) for different buffers in cities.
Ijgi 11 00279 g008
Figure 9. Distribution function of population for different buffer sizes according to WAI (a) and WS (b) walkability.
Ijgi 11 00279 g009
Figure 10. Distribution of population according to WS for different search radii in Hradec Kralove (a) and Ostrava (b).
Ijgi 11 00279 g010
Figure 11. Correlation between WAI and standard WS (Hradec Kralove (a) and Ostrava (b)).
Ijgi 11 00279 g011
Figure 12. Outliers in WAI—WS relationship and their location in Ostrava.
Ijgi 11 00279 g012
Figure 13. WS for elderly (800 m radius, Hradec Kralove (a), Ostrava (b)).
Ijgi 11 00279 g013
Figure 14. Differences between WS for the elderly and standard WS (HK (a), Ostrava (b)).
Ijgi 11 00279 g014
Figure 15. Relationship between standard WS and WS for elderly (HK (a), Ostrava (b)).
Ijgi 11 00279 g015
Figure 16. Distance-decay functions for 10 tested combinations of β and walking speed.
Ijgi 11 00279 g016
Figure 17. Evolution of WS for the elderly with gait speed and β modifications (Ostrava (a) and Hradec Kralove (b)).
Ijgi 11 00279 g017
Figure 18. Ranges of WS change for 9 steps in speed-β modifications (Hradec Kralove (a) and Ostrava (b)).
Ijgi 11 00279 g018
Table 1. Average number of visits per month for elderly.
Horak et al. (2019)Vidovićová et al. (2013)
Visits per MonthVisits per Month
Retail7.0511.94
Hypermarket4.971.95
Employment1.944.13
Healthcare1.841.26
Cultural facilities1.390.88
Office0.61
Sport facilities0.51
Cemetery0.170.70
Family0.143.56
Park0.085.75
Garden0.063.61
Cottage0.03
Church0.020.33
Table 2. Distribution of WAI for different search radii in Ostrava (OV) and Hradec Kralove (HK).
CityRangeShare of Units (%)Share of Population (%)
400 m800 m1200 m2414 m400 m800 m1200 m2414 m
OVHigh walkability (≥9.28)4.55.54.41.822.125.615.37.9
OVLow walkability (<9.28)95.594.595.698.277.974.484.792.1
HKHigh walkability (≥9.28)6.78.39.15.633.535.326.615.0
HKLow walkability (<9.28)93.391.790.994.466.564.773.485.0
Table 3. Distribution of WS for different search radii in Ostrava.
RangeShare of Units (%)Share of Population (%)
400 m800 m1200 m2414 m400 m800 m1200 m2414 m
Non-walkable (0)61.837.125.87.522.66.13.81.1
Very car dependent (1–24)26.735.537.152.539.822.913.614.4
Car dependent (25–49)8.216.822.423.425.533.331.428.1
Somewhat walkable (50–69)1.95.99.010.67.119.629.034.0
Very walkable (70–89)1.13.24.24.53.913.716.917.2
Walker’s paradise (90–100)0.31.41.61.61.24.45.35.3
Table 4. Distribution of WS for different search radii in Hradec Kralove.
RangeShare of Units (%)Share of Population (%)
400 m800 m1200 m2414 m400 m800 m1200 m2414 m
Non-walkable (0)61.542.128.211.917.46.74.61.9
Very car dependent (1–24)31.038.546.057.950.426.920.220.2
Car dependent (25–49)4.89.111.114.318.426.019.319.9
Somewhat walkable (50–69)0.86.78.79.91.725.231.833.8
Very walkable (70–89)1.22.04.04.07.75.912.112.1
Walker’s paradise (90–100)0.81.62.02.04.49.312.112.1
Table 5. Impact of one step modification of weights to changes in WS for elderly.
FactorValuesStepCityWalk Score Change for 1 Step
Mean3rd Quartile95-Percentile
speed0.5–1.30.1HK1.8633.2637.291
β144–1804.5
speed0.5–1.30.1OV2.4364.2587.742
β144–1804.5
retail7–120.55HK0.2530.1111.509
OV0.4020.4312.102
hypermarket1–50.44HK0.0190.0000.090
OV0.0170.0000.068
entertainment0.8–1.40.07HK0.0080.0000.043
OV0.0100.0000.058
doctor1–20.11HK0.0330.0120.208
OV0.0390.0340.216
park0.1–60.66HK0.4670.5752.468
OV0.2630.1211.555
Publisher’s Note: MDPI stays neutral with regard to jurisdictional claims in published maps and institutional affiliations.

