
Towards a Core Set of Landscape Metrics of Urban Land Use in Wuhan, China


Abstract
:1. Introduction
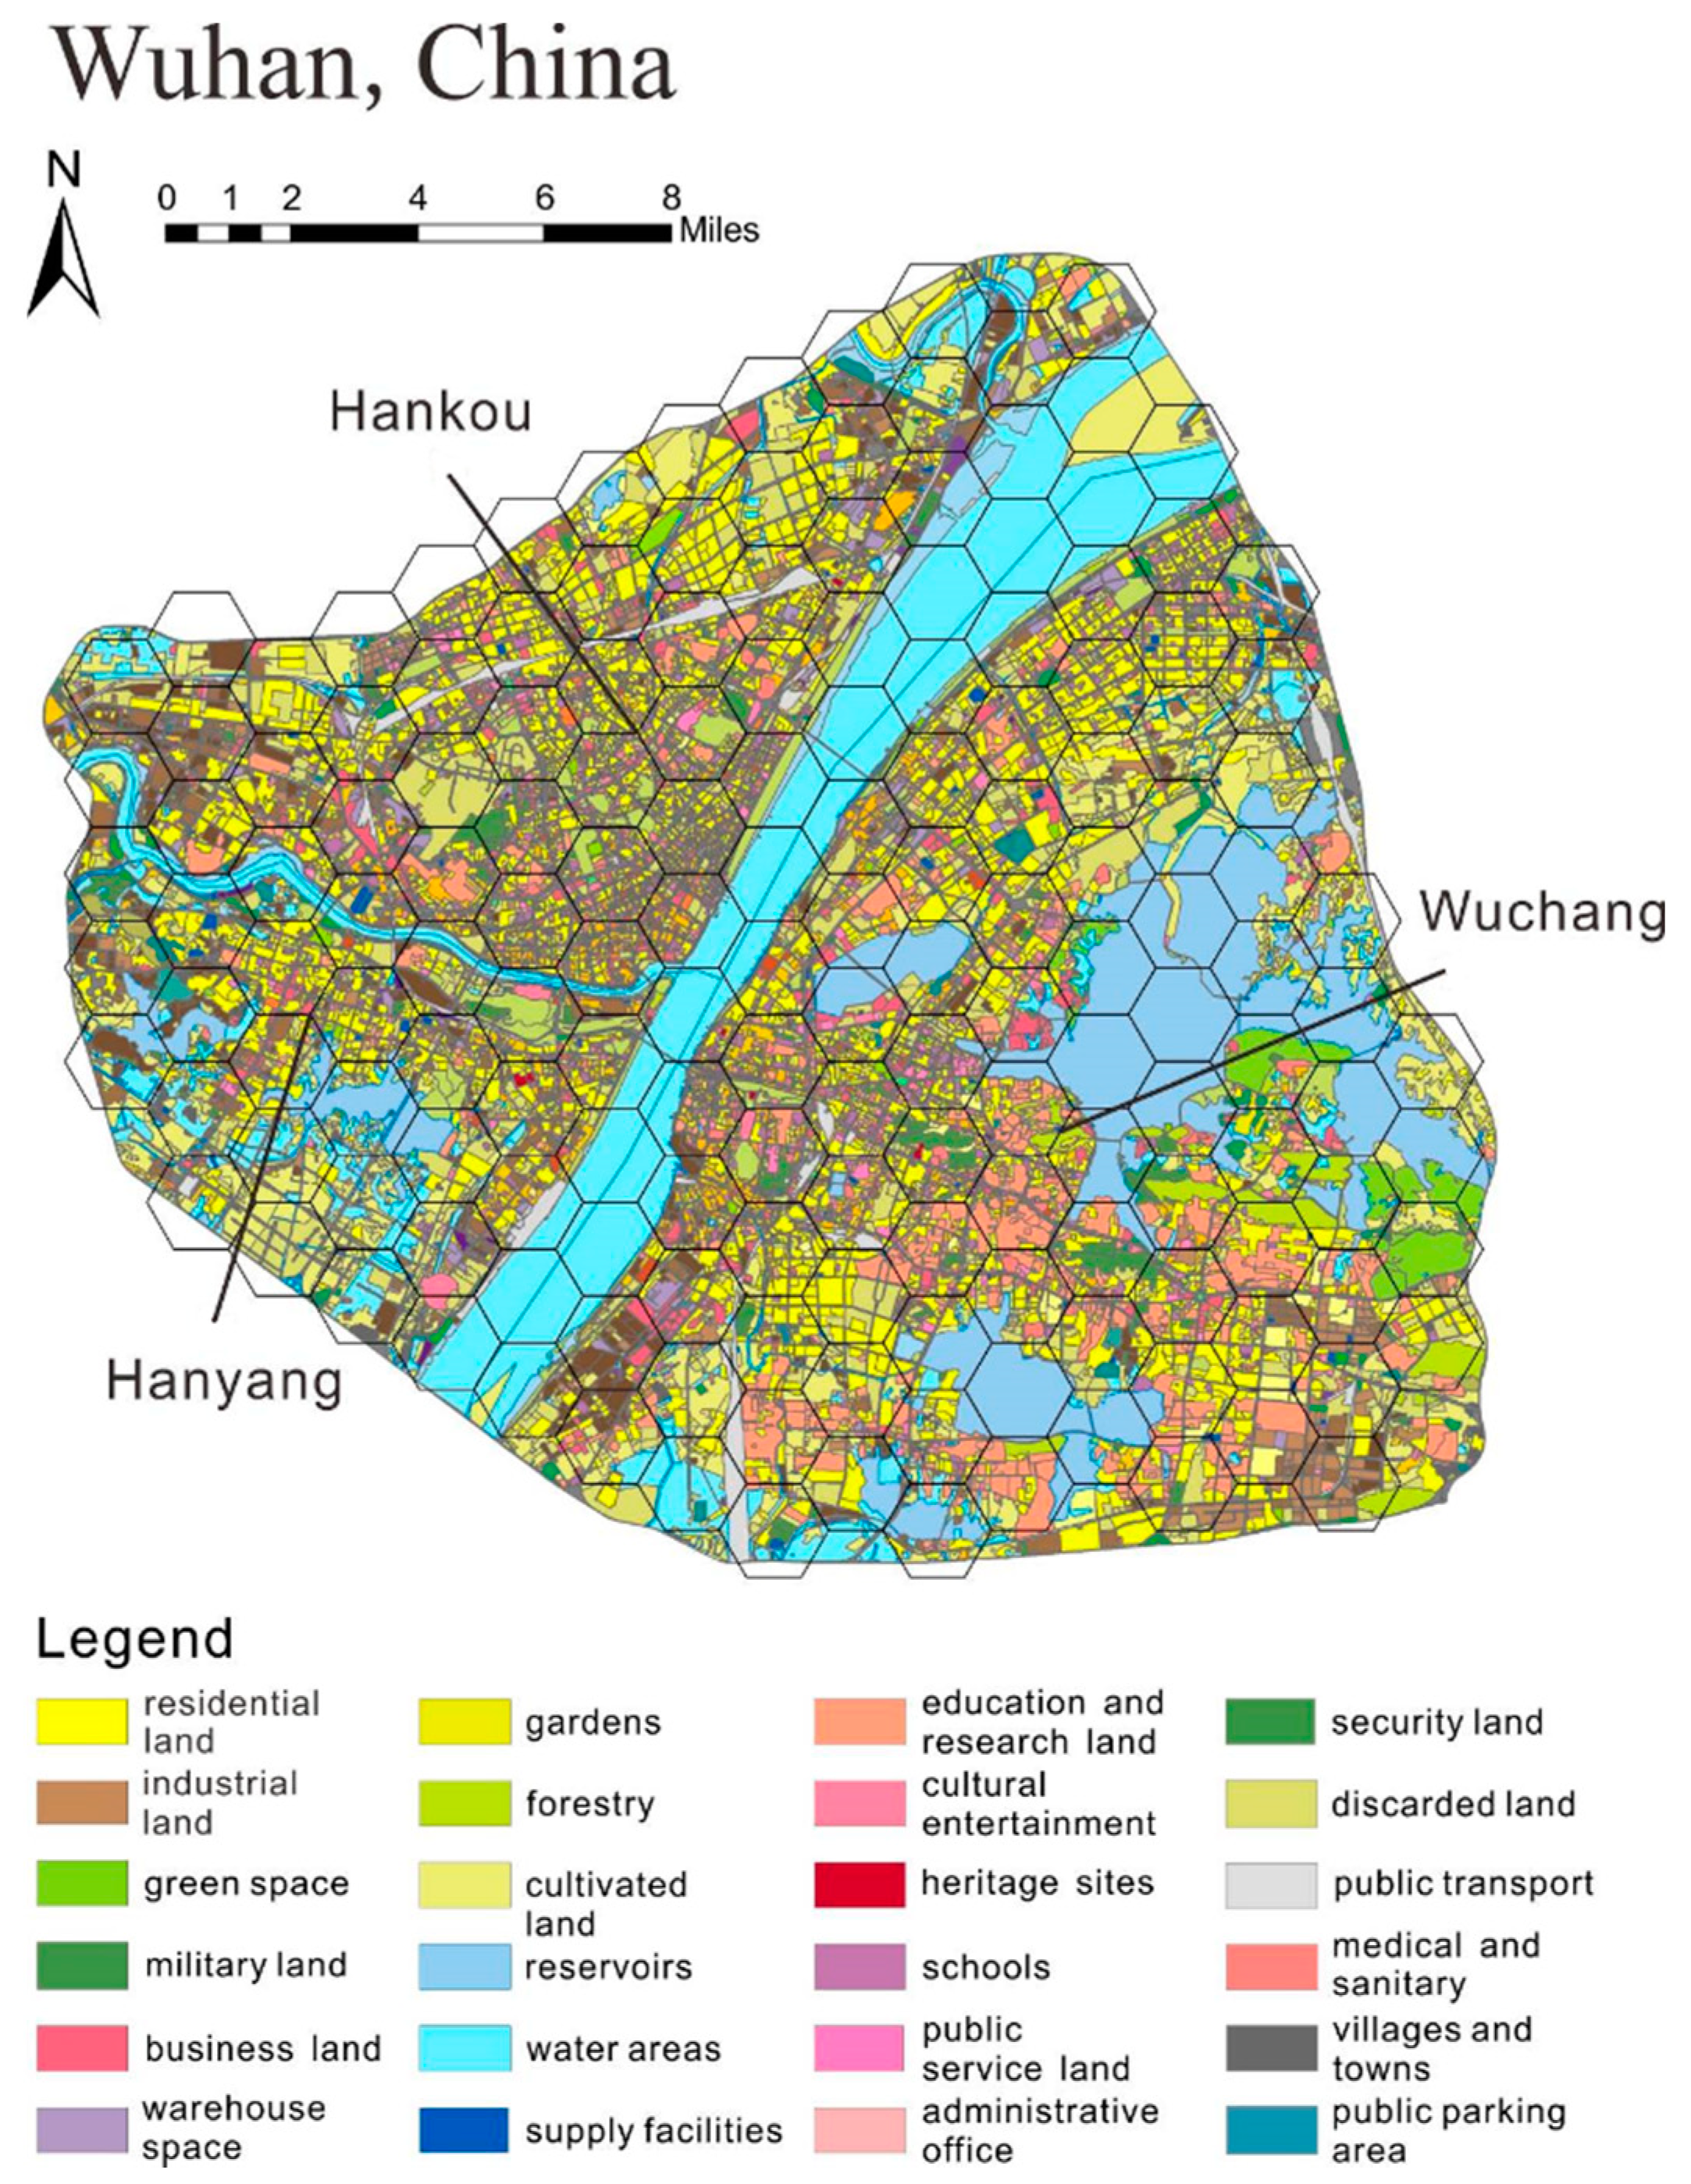
2. Study Area
3. Method
3.1. Data Pre-Processing
3.2. Semantic Similarity
3.3. Metric Calculation
3.4. Exploratory Analysis
4. Result and Discussion
4.1. Core Set of Metrics
4.1.1. Intra-Group Correlation Analysis
4.1.2. Selection among Highly Correlated Metrics
4.1.3. Selection of the Representative Metrics in Each Group
4.1.4. Overall Analysis
- (1)
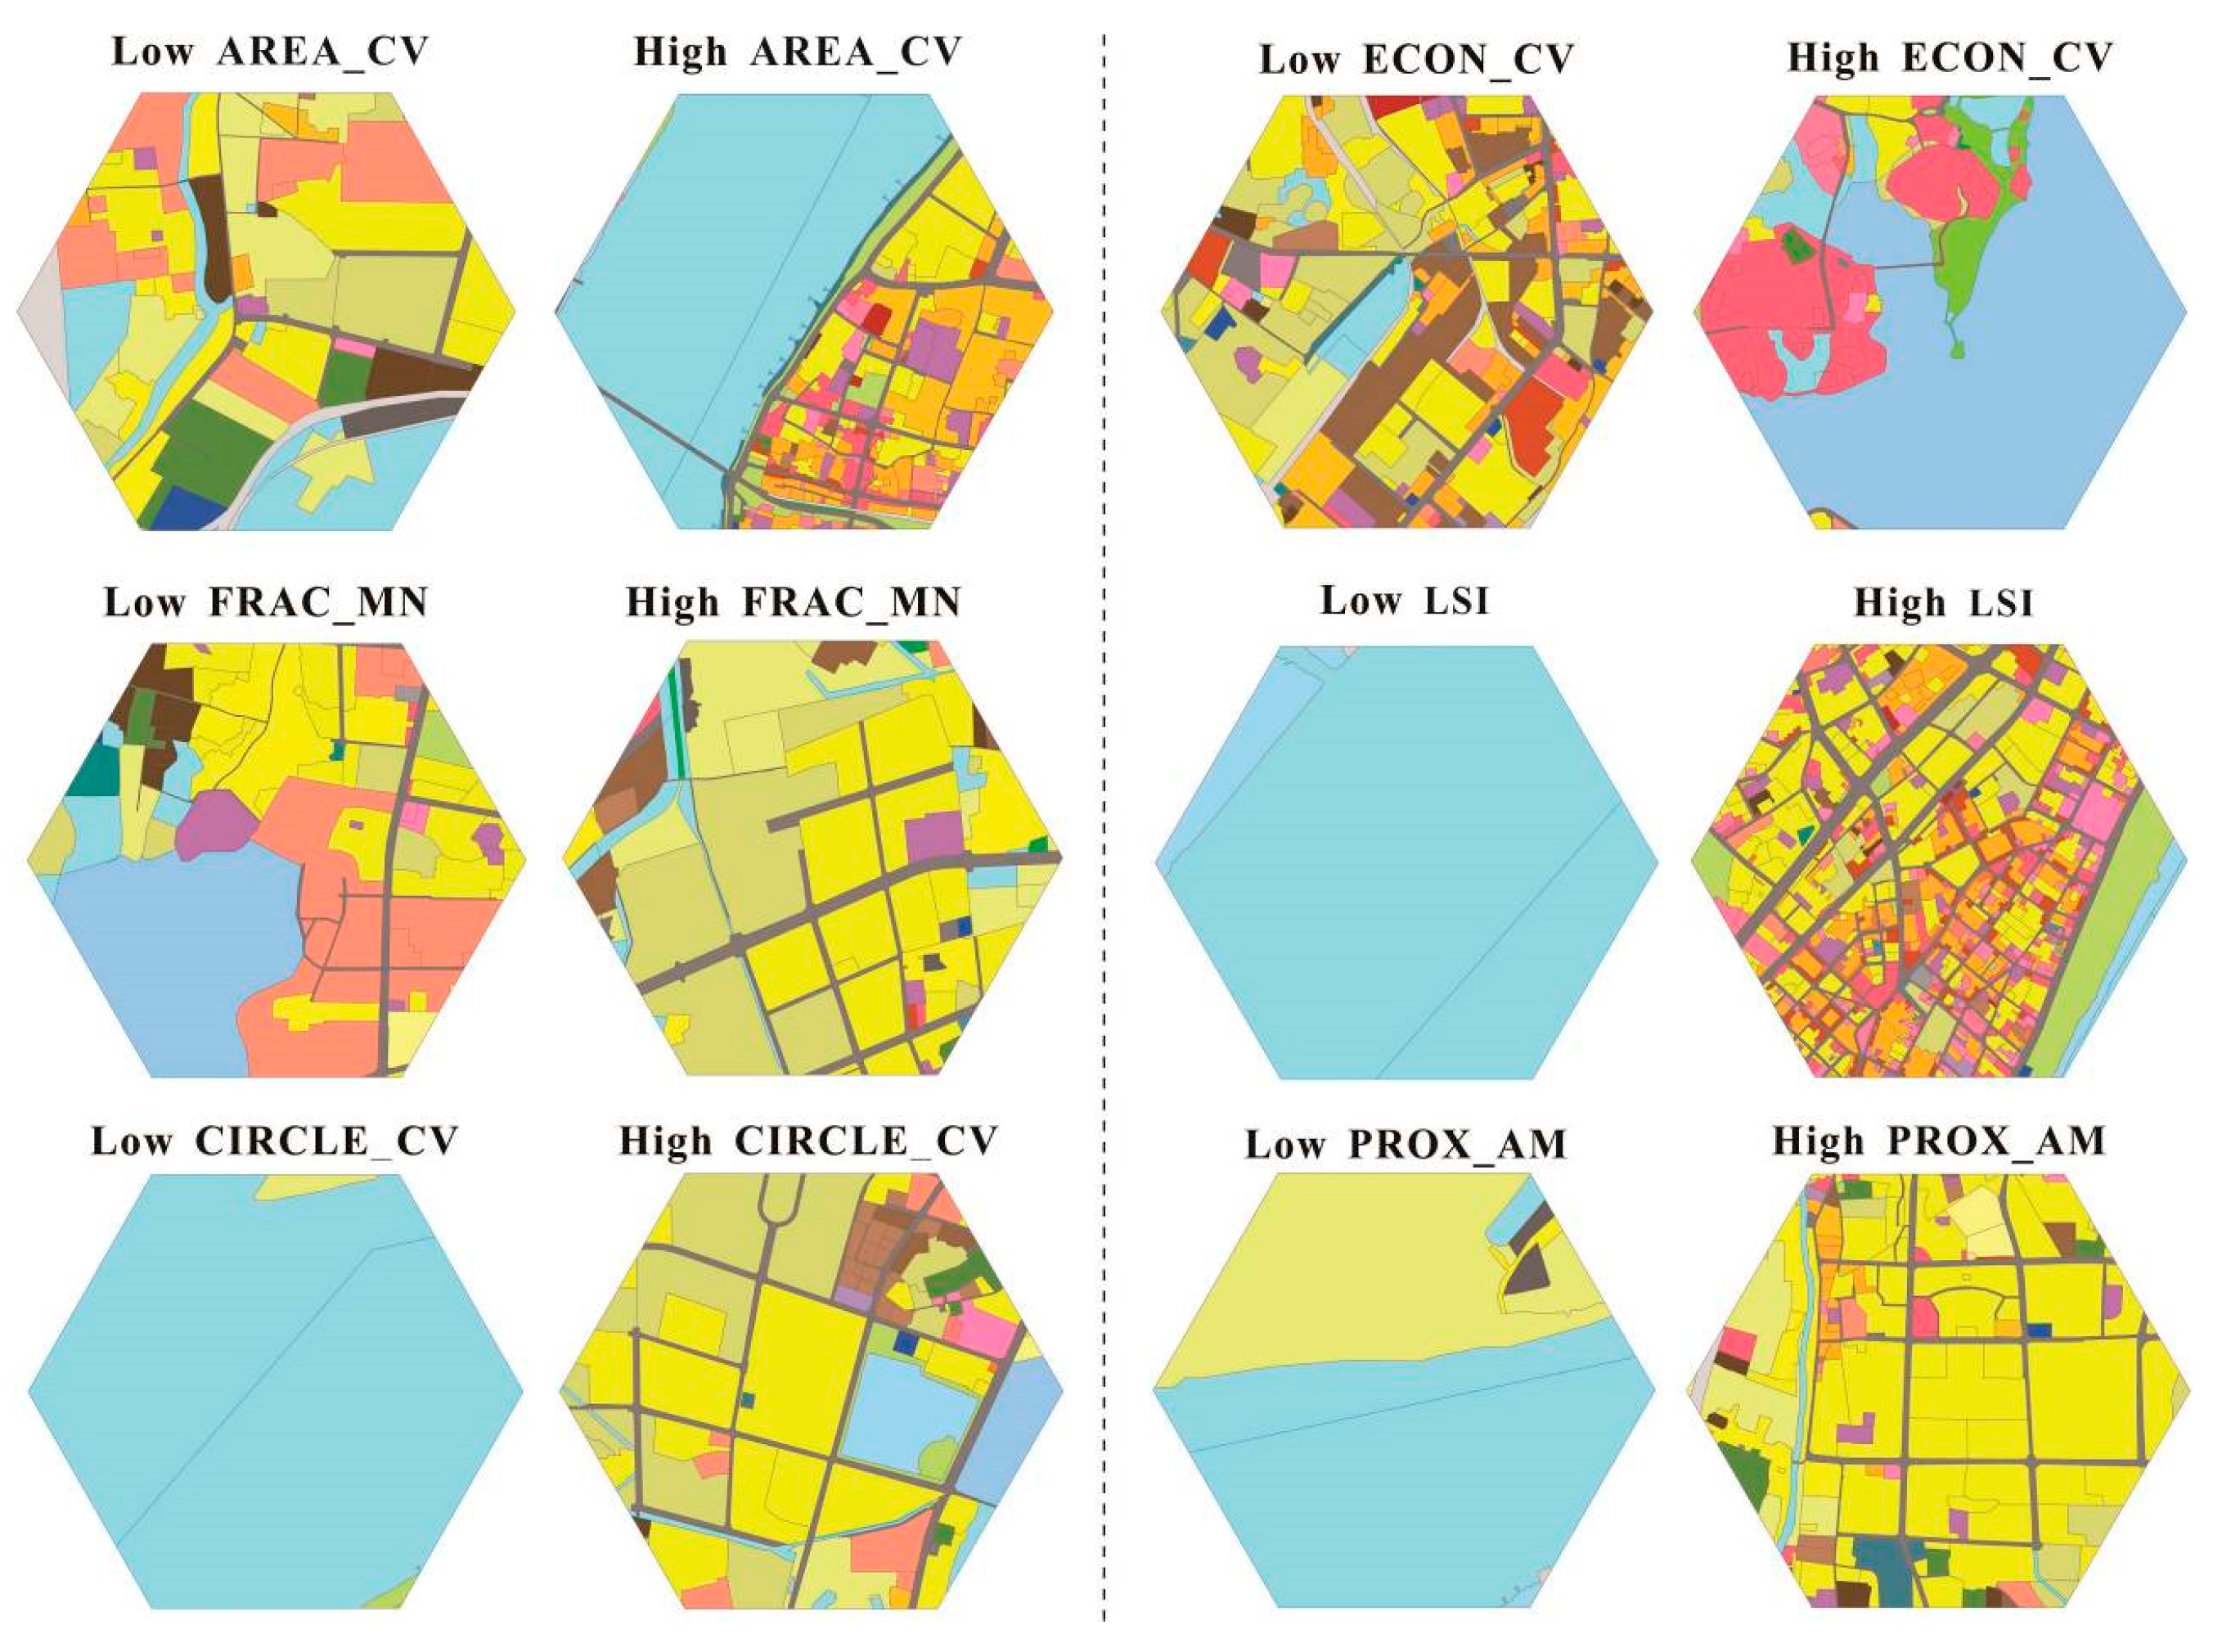
- Overall shape and diversity, which describes the shape and type diversity of the landscape. It exhibits a high positive loading on the LSI, FRAC_AM and diversity metrics (i.e., PR and MSIEI). LSI measures the ratio of the total edge length to the total area of a landscape and is the overall shape index of the landscape. FRAC_AM measures the mean shape complexity weighted by the patch size, and indicates whether a patch has a regular, simple shape or an irregular, complex shape [2]. The diversity metric measures the richness (PR) and evenness (MSIEI) of the patch types in landscapes.
- (2)
- Mean proximity, which quantifies the spatial context of a patch in relation to its neighbors of the same type [2]. It exhibits a high positive loading on the PROX_AM. The PROX metrics measure the proximity degree of the center patch to other patches of the same type within a certain range. In contrast, the SIMI metrics measure the proximity degree of the center patch to all of the types of patches. The PROX metrics more specifically reflect the background characteristics of the patch in a landscape [2].
- (3)
- Overall area variation, which describes the variance of the patch area and reflects the overall difference in the patch sizes of the landscape. It exhibits a high positive loading on the AREA_CV, coefficient of variation of patch area.
- (4)
- Fragmentation variation, which describes the variance of patch types’ disaggregation. It exhibits a high positive loading on the ECON_CV. The ECON metrics measure the edge contrast of patches. A high degree of variance in the ECON metrics indicate a high edge contrast difference in the corresponding landscape, suggesting that the landscape is highly fragmented.
- (5)
- Elongation variation, which describes the variances of convolution and narrowness. It exhibits a high positive loading on the CIRCLE_CV, which measures the differences in shape among the patches. The CIRCLE metrics use the ratio of the patch area to the circumcircle area to indirectly measure the shape elongation of patches. The CIRCLE metrics reflect the differences among the patch shapes of the landscape.
- (6)
- Mean shape complexity, which describes the mean shape complexity of the landscape based on mean fractal dimension. It exhibits a high positive loading on the FRAC_MN, which is similar to FRAC_AM but without the area-weighted calculation. The fact that the first and the fifth factors both describe the shape characteristics of patches suggests that patch shape is an important spatial attribute of urban land use.
4.2. Typical Patterns Indicated by Core Metrics
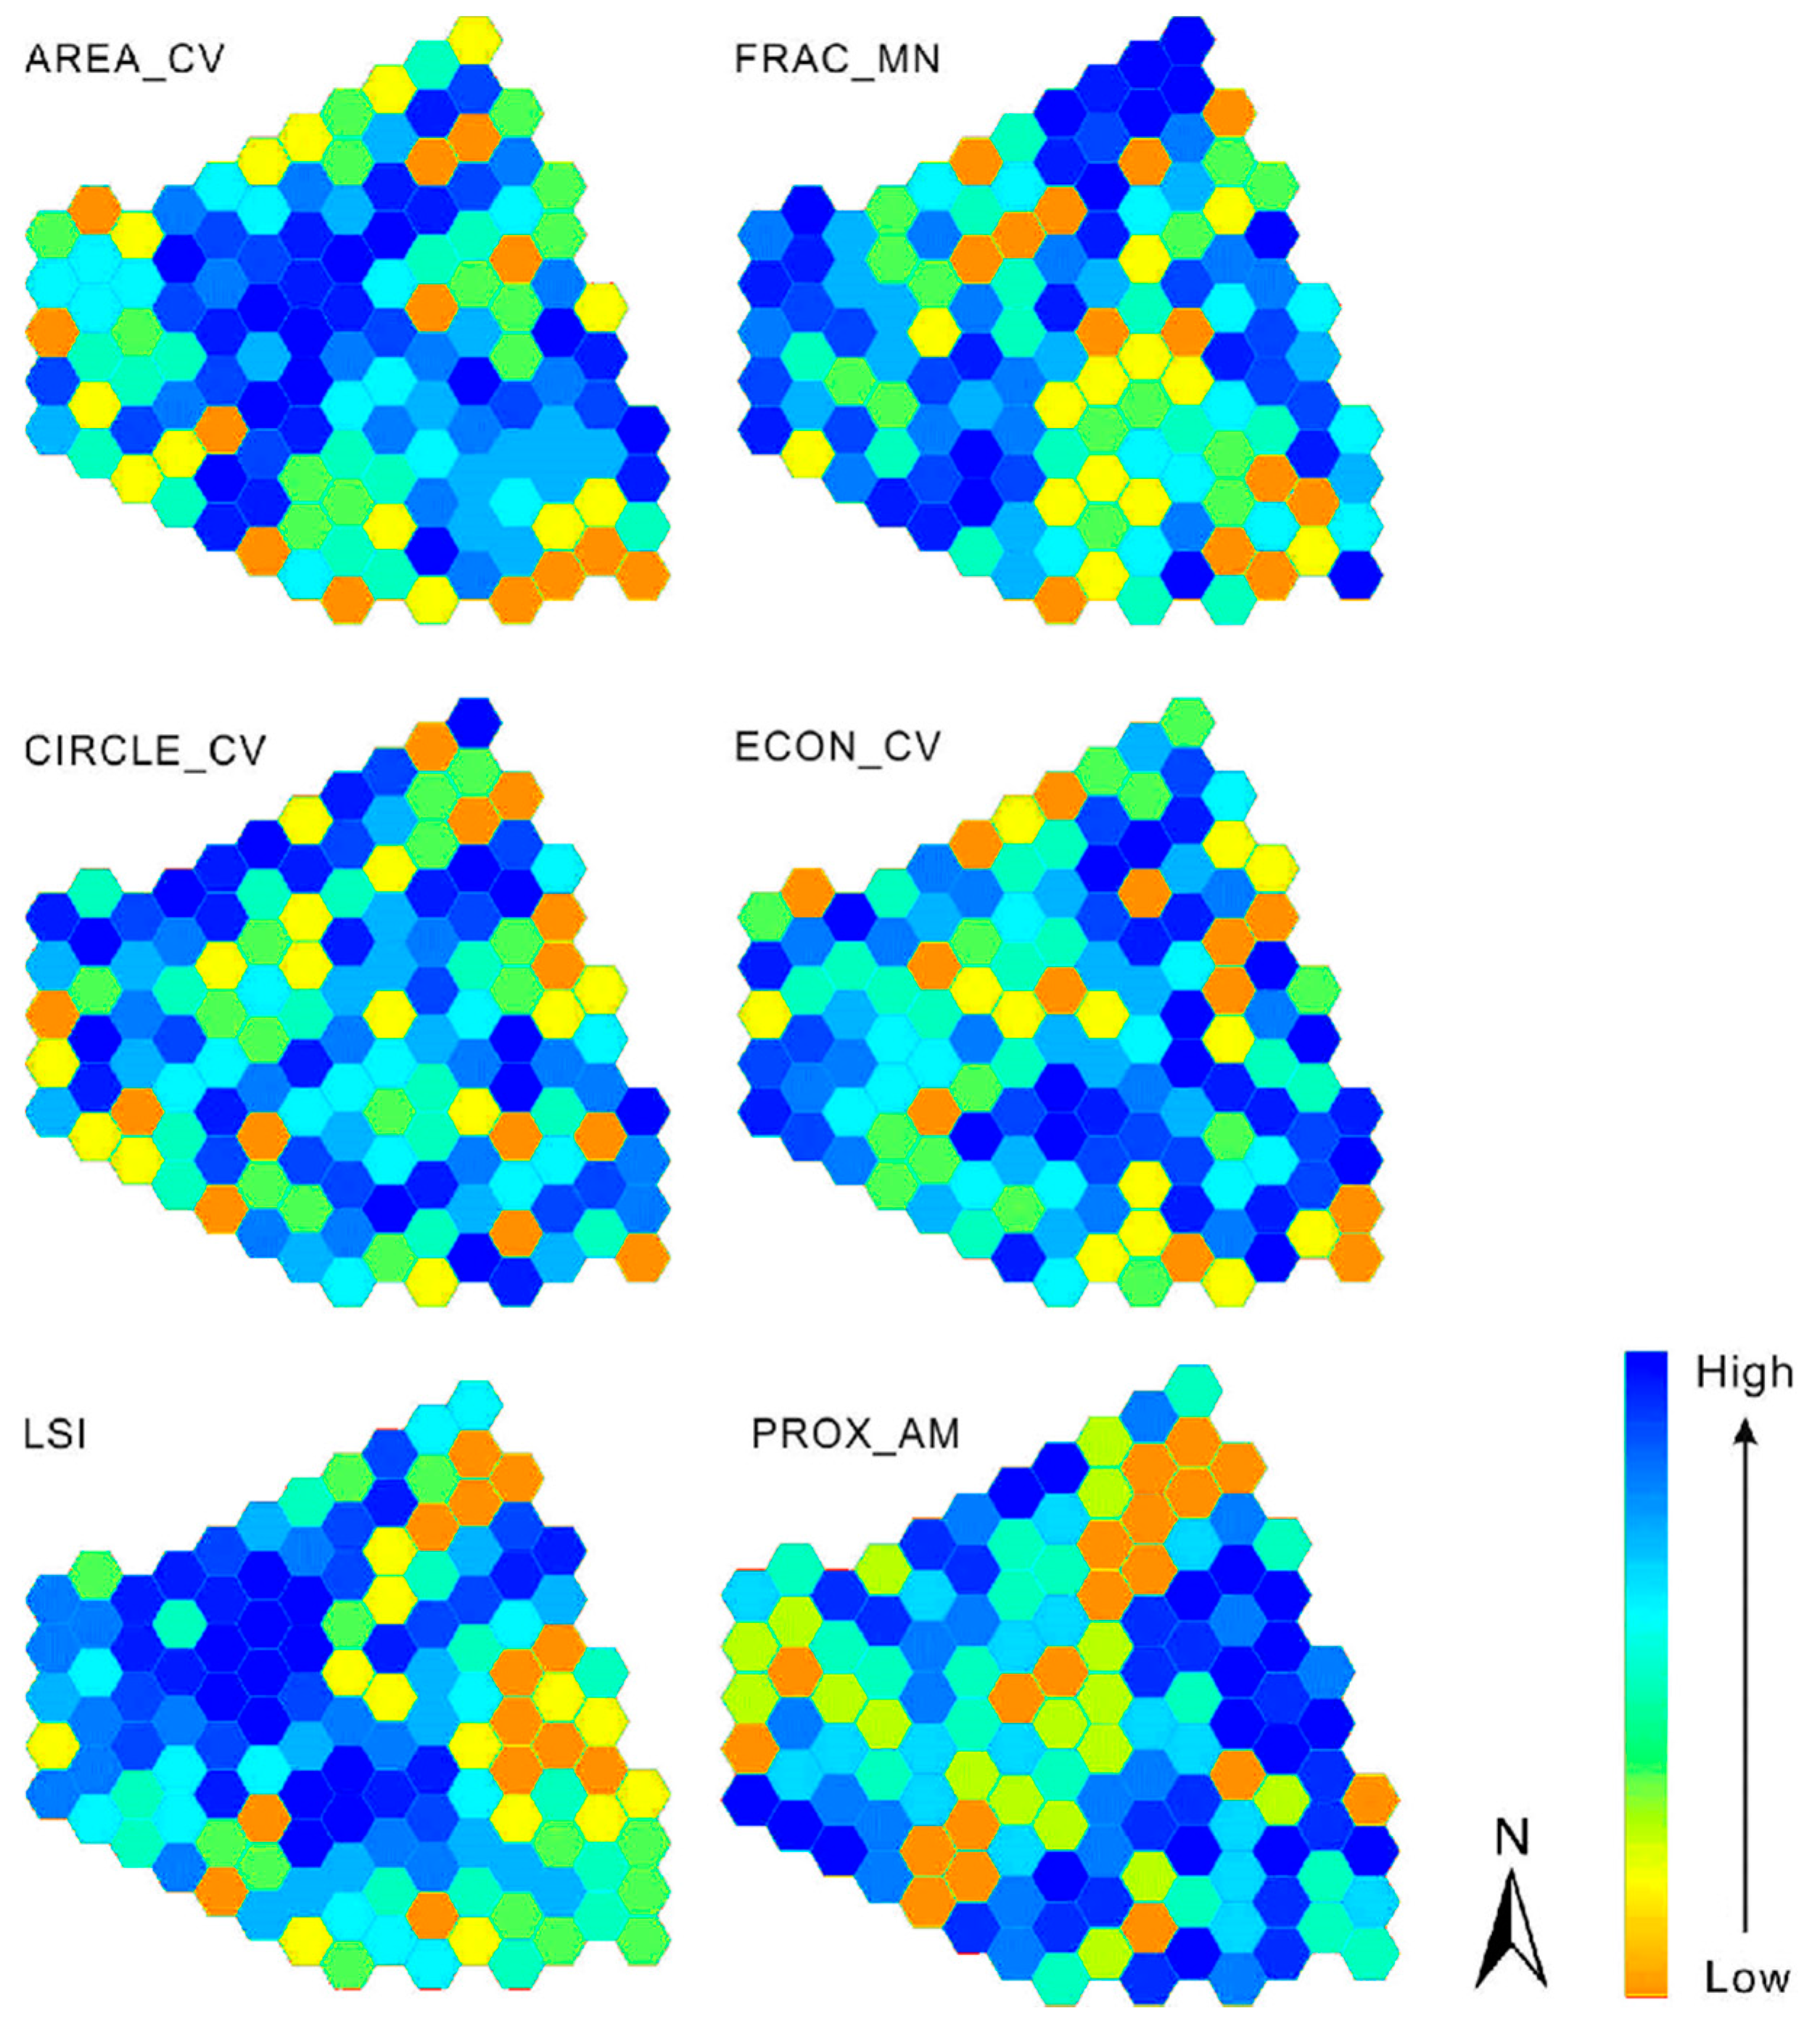
4.3. Spatial Distribution of Core Metrics
4.4. Discussion
5. Conclusions
Author Contributions
Funding
Institutional Review Board Statement
Informed Consent Statement
Data Availability Statement
Conflicts of Interest
Appendix A

| Acronym | Metric Name |
|---|---|
| Area and Edge | |
| LPI | Largest Patch index |
| ED | Edge Density |
| AREA_MN | Mean Patch Size |
| AREA_AM | Area-weighted Mean Patch Size |
| AREA_CV | Patch Size Coefficient of Variation |
| Shape | |
| PAFRAC | Perimeter-Area Fractal Dimension |
| PARA_MN | Mean Perimeter-area Ratio |
| PARA_AM | Area-weighted Mean Perimeter-Area Ratio |
| PARA_CV | Perimeter-area Ratio Coefficient of Variation |
| SHAPE_MN | Mean Shape Index |
| SHAPE_AM | Area-weighted Mean Shape Index |
| SHAPE_CV | Shape index Coefficient of Variation |
| FRAC_MN | Mean Fractal Dimension |
| FRAC_AM | Area-weighted Mean Fractal Dimension |
| FRAC_CV | Fractal Dimension Coefficient of Variation |
| CIRCLE_MN | Mean Related Circumscribing Circle |
| CIRCLE_AM | Area-weighted Mean Related Circumscribing Circle |
| CIRCLE_CV | Related Circumscribing Circle Coefficient of Variation |
| Contrast | |
| CWED | Contrast-weighted Edge Density |
| TECI | Total Edge Contrast Index |
| ECON_MN | Mean Edge Contrast Index distribution |
| ECON_AM | Area-weighted Mean Edge Contrast Index distribution |
| ECON_CV | Edge Contrast Index Distribution Coefficient of Variation |
| Aggregation | |
| IJI | Interspersion and Juxtaposition Index |
| LSI | Landscape Shape Index |
| PD | Patch Density |
| ENN_MN | Mean Euclidean Nearest Neighbor Distance |
| ENN_AM | Area-Weighted Mean Euclidean Nearest Neighbor Distance |
| ENN_CV | Euclidean Nearest Neighbor Distance Coefficient of Variation |
| PROX_MN | Mean Proximity Index Distribution |
| PROX_AM | Area-Weighted Mean Proximity Index Distribution |
| PROX_CV | Proximity Index Distribution Coefficient of Variation |
| SIMI_MN | Mean Similarity Index Distribution |
| SIMI_AM | Area-Weighted Mean Similarity Index Distribution |
| SIMI_CV | Similarity Index Distribution Coefficient of Variation |
| Diversity | |
| PR | Patch Richness |
| PRD | Patch Richness Density |
| RPR | Relative Patch Richness |
| SHDI | Shannon’s Diversity Index |
| SHEI | Shannon’s Evenness Index |
| SIDI | Simpson’s Diversity Index |
| SIEI | Simpson’s Evenness Index |
| MSIDI | Modified Simpson’s Diversity Index |
| MSIEI | Modified Simpson’s Evenness Index |
| Metrics | AREA_MN | AREA_CV | PARA_CV | SHAPE_MN | FRAC_MN | FRAC_AM | CIRCLE_CV | TECI | ECON_CV | LSI | ENN_CV | PROX_AM | PROX_CV | PRD | SIDI |
|---|---|---|---|---|---|---|---|---|---|---|---|---|---|---|---|
| AREA_MN | — | ||||||||||||||
| AREA_CV | −0.089 | — | |||||||||||||
| PARA_CV | −0.182 | −0.079 | — | ||||||||||||
| SHAPE_MN | 0.459 | −0.077 | 0.007 | — | |||||||||||
| FRAC_MN | 0.243 | 0.091 | −0.047 | 0.738 | — | ||||||||||
| FRAC_AM | −0.692 | 0.150 | 0.086 | −0.231 | −0.045 | — | |||||||||
| CIRCLE_CV | −0.202 | −0.056 | −0.046 | −0.039 | −0.019 | −0.038 | — | ||||||||
| TECI | −0.076 | −0.177 | −0.037 | 0.084 | 0.060 | 0.265 | 0.153 | — | |||||||
| ECON_CV | 0.038 | 0.132 | −0.238 | −0.224 | −0.096 | 0.174 | 0.004 | 0.111 | — | ||||||
| LSI | −0.963 | −0.051 | 0.167 | −0.372 | −0.196 | 0.751 | 0.174 | 0.155 | −0.003 | — | |||||
| ENN_CV | −0.539 | 0.089 | 0.077 | −0.169 | −0.114 | 0.433 | −0.048 | 0.176 | 0.097 | 0.511 | — | ||||
| PROX_AM | −0.026 | −0.256 | 0.102 | −0.006 | −0.140 | 0.061 | 0.100 | 0.253 | 0.008 | 0.068 | 0.282 | — | |||
| PROX_CV | 0.632 | 0.017 | −0.103 | 0.252 | 0.173 | −0.531 | −0.087 | −0.207 | −0.026 | −0.633 | −0.569 | −0.375 | — | ||
| PRD | −0.799 | 0.064 | 0.129 | −0.303 | −0.100 | 0.544 | 0.300 | 0.047 | −0.126 | 0.778 | 0.233 | −0.215 | −0.392 | — | |
| SIDI | −0.588 | −0.312 | 0.100 | −0.218 | −0.117 | 0.464 | 0.093 | 0.259 | −0.121 | 0.646 | 0.195 | −0.247 | −0.248 | 0.661 | — |
References
- Turner, M.G. The Effect of Pattern on Process. Annu. Rev. Ecol. Syst. 1989, 20, 171–197. [Google Scholar] [CrossRef]
- FRAGSTATS 4.2: Spatial Pattern Analysis Program for Categorical and Continuous Maps; University of Massachusetts: Amherst, MA, USA, 2015.
- Zhou, M.; Tan, S.; Zhang, L. Influences of Different Land Use Spatial Control Schemes on Farmland Conversion and Urban Development. PLoS ONE 2015, 10, e0125008. [Google Scholar] [CrossRef] [PubMed]
- Jaafari, S.; Sakieh, Y.; Shabani, A.A.; Danehkar, A.; Nazarisamani, A. Landscape Change Assessment of Reservation Areas Using Remote Sensing and Landscape Metrics (Case Study: Jajroud Reservation, Iran). Environ. Dev. Sustain. 2016, 18, 1701–1717. [Google Scholar] [CrossRef]
- Su, S.; Jiang, Z.; Zhang, Q.; Zhang, Y. Transformation of Agricultural Landscapes under Rapid Urbanization: A Threat to Sustainability in Hang-Jia-Hu Region, China. Appl. Geogr. 2011, 31, 439–449. [Google Scholar] [CrossRef]
- Fränti, P. Using Hough Transform for Context-Based Image Compression in Hybrid Raster/Vector Applications. J. Electron. Imaging 2002, 11, 236. [Google Scholar] [CrossRef]
- Molenaar, M. (Ed.) The Role of Topological and Hierarchical Spatial Object Models in Database Generalization. In Methods for the Generalization of Geo-Databases; Publications on geodesy; Netherlands Geodetic Commission: Delft, The Netherlands, 1996; pp. 13–36. ISBN 978-90-6132-258-0. [Google Scholar]
- Yang, X.; Liu, Z. Quantifying Landscape Pattern and Its Change in an Estuarine Watershed Using Satellite Imagery and Landscape Metrics. Int. J. Remote Sens. 2005, 26, 5297–5323. [Google Scholar] [CrossRef]
- Schindler, S.; Poirazidis, K.; Wrbka, T. Towards a Core Set of Landscape Metrics for Biodiversity Assessments: A Case Study from Dadia National Park, Greece. Ecol. Indic. 2008, 8, 502–514. [Google Scholar] [CrossRef]
- Schindler, S.; von Wehrden, H.; Poirazidis, K.; Hochachka, W.M.; Wrbka, T.; Kati, V. Performance of Methods to Select Landscape Metrics for Modelling Species Richness. Ecol. Model. 2015, 295, 107–112. [Google Scholar] [CrossRef]
- Williams, J.C.; ReVelle, C.S.; Levin, S.A. Spatial Attributes and Reserve Design Models: A Review. Environ. Model. Assess. 2005, 10, 163–181. [Google Scholar] [CrossRef]
- Wu, J.; Shen, W.; Sun, W.; Tueller, P.T. Empirical Pattern of the Effects of Changing Scale on Landscape Metrics. Landsc. Ecol. 2002, 17, 761–782. [Google Scholar] [CrossRef]
- Wu, J.G. Effects of Changing Scale on Landscape Pattern Analysis: Scaling Relations. Landsc. Ecol. 2004, 19, 125–138. [Google Scholar] [CrossRef]
- Schindler, S.; von Wehrden, H.; Poirazidis, K.; Wrbka, T.; Kati, V. Multiscale Performance of Landscape Metrics as Indicators of Species Richness of Plants, Insects and Vertebrates. Ecol. Indic. 2013, 31, 41–48. [Google Scholar] [CrossRef]
- Dormann, C.F.; Elith, J.; Bacher, S.; Buchmann, C.; Carl, G.; Carré, G.; Marquéz, J.R.G.; Gruber, B.; Lafourcade, B.; Leitão, P.J.; et al. Collinearity: A Review of Methods to Deal with It and a Simulation Study Evaluating Their Performance. Ecography 2013, 36, 27–46. [Google Scholar] [CrossRef]
- Hochachka, W.M.; Caruana, R.; Fink, D.; Munson, A.; Riedewald, M.; Sorokina, D.; Kelling, S. Data-Mining Discovery of Pattern and Process in Ecological Systems. J. Wildl. Manag. 2007, 71, 2427. [Google Scholar] [CrossRef]
- Riitters, K.H.; O’Neill, R.V.; Hunsaker, C.T.; Wickham, J.D.; Yankee, D.H.; Timmins, S.P.; Jones, K.B.; Jackson, B.L. A Factor Analysis of Landscape Pattern and Structure Metrics. Landsc. Ecol. 1995, 10, 23–39. [Google Scholar] [CrossRef]
- Griffith, J.A.; Martinko, E.A.; Price, K.P. Landscape Structure Analysis of Kansas at Three Scales. Landsc. Urban Plan. 2000, 52, 45–61. [Google Scholar] [CrossRef]
- Schindler, S. Dadia National Park, Greece—An Integrated Study on Landscape, Biodiversity, Raptor Populations and Conservation Management. Ph.D. Thesis, University of Vienna, Vienna, Austria, 2010. [Google Scholar]
- Liu, Y.; Molenaar, M.; Kraak, M.J. Semantic Similarity Evaluation Model in Categorical Database Generalisation. In Proceedings of the International Archives of Photogrammetry and Remote Sensing, Ottawa, ON, Canada, 9–12 July 2002; National Resources Canada: Ottawa, ON, Canada, 2002. Part 4 Commission 4. Volume 34, pp. 279–285. [Google Scholar]
- Patch Analyst and Patch Grid; Centre for Northern Forest Ecosystem Research: Thunder Bay, ON, Canada, 2012.
- Yu, M.; Huang, Y.; Cheng, X.; Tian, J. An ArcMap Plug-in for Calculating Landscape Metrics of Vector Data. Ecol. Inform. 2019, 50, 207–219. [Google Scholar] [CrossRef]
- Mishra, S.K. Construction of an Index by Maximization of the Sum of Its Absolute Correlation Coefficients with the Constituent Variables; Social Science Research Network: Rochester, NY, USA, 2007. [Google Scholar]
- Krummel, J.R.; Gardner, R.H.; Sugihara, G.; O’Neill, R.V.; Coleman, P.R. Landscape Patterns in a Disturbed Environment. Oikos 1987, 48, 321–324. [Google Scholar] [CrossRef] [Green Version]
- Yue, T.-X.; Ma, S.-N.; Wu, S.-X.; Zhan, J.-Y. Comparative Analyses of the Scaling Diversity Index and Its Applicability. Int. J. Remote Sens. 2007, 28, 1611–1623. [Google Scholar] [CrossRef]
| Correlated Metrics Excluded from Intra-Group Analysis | Variance Explained | Selected Metrics for Overall Analysis | ∑|r| | Ratio |
|---|---|---|---|---|
| Area and Edge | ||||
| AREA_AM, ED | 96.376% | AREA_MN, AREA_CV | 1.287 | 0.749 |
| LPI, ED | 95.736% | AREA_AM, AREA_CV | 1.340 | 0.714 |
| AREA_AM, AREA_MN | 63.786% | LPI, ED, AREA_CV | 1.342 | 0.475 |
| LPI, AREA_MN | 60.948% | AREA_AM, ED, AREA_CV | 1.384 | 0.440 |
| Aggregation | ||||
| PD, PROX_MN | 81.914% | LSI, PROX_AM, PROX_CV, ENN_CV | 14.530 | 0.057 |
| LSI, PROX_MN | 80.534% | ENN_AM, ENN_CV, PROX_AM, SIMI_CV | 14.282 | 0.056 |
| PD, PROX_AM | 81.737% | LSI, PROX_MN, PROX_CV, ENN_CV | 14.803 | 0.055 |
| LSI, PROX_AM | 80.346% | ENN_AM, ENN_CV, PROX_MN, SIMI_CV | 14.748 | 0.054 |
| Diversity | ||||
| PRD, SIDI, MSIDI, SIEI | 79.771% | PR, MSIEI | 0.437 | 1.825 |
| PRD, SIDI, MSIDI, MSIEI | 84.651% | PR, SIEI | 0.578 | 1.465 |
| PR, SIDI, MSIDI, MSIEI | 85.017% | PRD, SIEI | 0.588 | 1.446 |
| PRD, SIDI, SIEI, MSIEI | 87.295% | PR, MSIDI | 0.650 | 1.343 |
| PR, SIDI, SIEI, MSIEI | 87.656% | PRD, MSIDI | 0.657 | 1.334 |
| PRD, MSIDI, SIEI, MSIEI | 86.468% | PR, SIDI | 0.650 | 1.330 |
| PR, MSIDI, SIEI, MSIEI | 86.798% | PRD, SIDI | 0.657 | 1.321 |
| PR, SIDI, MSIDI, SIEI | 80.361% | PRD, MSIEI | 0.453 | 1.236 |
| Correlated Metrics Excluded from Intra-Group Analysis | Variance Explained | Selected Metrics for Overall Analysis | ∑|r| | Ratio |
|---|---|---|---|---|
| Overall | ||||
| AREAMN | 75.184% | AREACV, FRAC_MN, CIRCLE_CV, ECON_CV, LSI, PROX_AM | 17.637 | 0.043 |
| LSI | 74.675% | AREA_MN, AREA_CV, FRAC_MN, CIRCLE_CV, ECON_CV, PROX_AM | 17.671 | 0.042 |
| Metrics | Group | Factor 1 | Factor 2 | Factor 3 | Factor 4 | Factor 5 | Factor 6 |
|---|---|---|---|---|---|---|---|
| Eigenvalue | 3.998 | 1.718 | 1.384 | 1.297 | 1.122 | 1.006 | |
| Percent of variance explained | 28.56 | 12.27 | 9.888 | 9.267 | 8.011 | 7.189 | |
| Percent of cumulative variance explained | 28.56 | 40.83 | 50.718 | 59.984 | 67.996 | 75.184 | |
| AREA_CV | Area and Edge | 0.912 | |||||
| PARA_CV | Shape | 0.460 | 0.544 | ||||
| SHAPE_MN | Shape | −0.316 | 0.327 | 0.532 | 0.455 | ||
| FRAC_MN | Shape | 0.844 | |||||
| FRAC_AM | Shape | 0.874 | |||||
| CIRCLE_CV | Shape | 0.899 | |||||
| TECI | Contrast | 0.486 | 0.544 | 0.315 | |||
| ECON_CV | Contrast | −0.838 | |||||
| LSI | Aggregation | 0.916 | |||||
| PROX_AM | Aggregation | 0.781 | |||||
| PROX_CV | Aggregation | −0.415 | −0.456 | ||||
| ENN_CV | Aggregation | 0.661 | 0.426 | ||||
| PR | Diversity | 0.799 | 0.349 | ||||
| MSIEI | Diversity | 0.786 | −0.468 | ||||
Publisher’s Note: MDPI stays neutral with regard to jurisdictional claims in published maps and institutional affiliations. |
© 2022 by the authors. Licensee MDPI, Basel, Switzerland. This article is an open access article distributed under the terms and conditions of the Creative Commons Attribution (CC BY) license (https://creativecommons.org/licenses/by/4.0/).
Share and Cite
Shao, S.; Yu, M.; Huang, Y.; Wang, Y.; Tian, J.; Ren, C. Towards a Core Set of Landscape Metrics of Urban Land Use in Wuhan, China. ISPRS Int. J. Geo-Inf. 2022, 11, 281. https://doi.org/10.3390/ijgi11050281
Shao S, Yu M, Huang Y, Wang Y, Tian J, Ren C. Towards a Core Set of Landscape Metrics of Urban Land Use in Wuhan, China. ISPRS International Journal of Geo-Information. 2022; 11(5):281. https://doi.org/10.3390/ijgi11050281
Chicago/Turabian StyleShao, Shiwei, Mengting Yu, Yimin Huang, Yiheng Wang, Jing Tian, and Chang Ren. 2022. "Towards a Core Set of Landscape Metrics of Urban Land Use in Wuhan, China" ISPRS International Journal of Geo-Information 11, no. 5: 281. https://doi.org/10.3390/ijgi11050281
APA StyleShao, S., Yu, M., Huang, Y., Wang, Y., Tian, J., & Ren, C. (2022). Towards a Core Set of Landscape Metrics of Urban Land Use in Wuhan, China. ISPRS International Journal of Geo-Information, 11(5), 281. https://doi.org/10.3390/ijgi11050281