Abstract
Protecting residents’ health and improving equality are important goals of the United Nations Sustainable Development Goals. The recent outbreak of COVID-19 has placed a heavy burden on the medical systems of many countries and been disastrous for the low-income population of the world, which has further increased economic, health, and lifelong inequality in society. One way to improve the population’s health is to equalize basic medical services. A scientific evaluation of the status quo or the equalization of basic medical services (EBMS) is the basic prerequisite and an important basis for realizing the equitable allocation of medical resources. Traditional evaluation methods ignore the spatial characteristics of medical services, mostly using the indicator of equal weight evaluation, which restricts the objectivity of the evaluation results. Given this, this research proposes a set of EBMS evaluation methods from a spatial perspective and takes the Xinjiang Uygur Autonomous Region of China (Xinjiang) as an example for studying the status quo of EBMS. This study puts forward a set of EBMS evaluation methods from a geospatial perspective and makes full use of spatial analysis and information theory techniques to construct a two-level evaluation indicator that takes into account the spatial characteristics of EBMS. The entropy weight method and the Technique for Order Preference by Similarity to an Ideal Solution (TOPSIS) method have been used to reveal the current status quo of EBMS in Xinjiang to objectively reflect the differences in EBMS. When using the entropy and TOPSIS methods, the evaluation is always based on the data so that the results can more objectively reveal the medical resources available to the residents. Therefore, the government can realize a reasonable allocation of medical resources.
1. Introduction
The United Nations Sustainable Development Goals (SDGs) consist of 17 development goals to guide global development work from 2015 to 2030, which include ensuring a healthy lifestyle, promoting good health and well-being of people of all ages, and reducing inequality within and between countries. This is an important element in achieving SDGs. Access to basic medical services is one of the basic rights of citizens. Realizing the scientific and reasonable allocation of medical resources and maximizing their utility cost-effectively is an important goal of the public health and planning departments [1,2]. The EBMS is based on John Rawls’stheory of equity and justice, which refers to the fair and convenient access of all citizens to roughly equal basic medical services after removing the ability to pay factor, with the core of promoting equal opportunities and focusing on guaranteeing people’s access to fair basic medical services [3]. Therefore, scientific and objective evaluation of the equalization of basic medical services in various regions is an important basis for realizing the reasonable allocation of medical resources and achieving the equalization of basic medical services.
In addition, with the improvement of the level of social and economic development and the impact of sudden epidemics, people’s demand for medical and health services has continued to increase. During the COVID-19 pandemic, countries experienced varying degrees of utilization and availability of basic medical services [4,5]. Not only was medical equipment (e.g., ventilators) unevenly distributed, but basic health services (e.g., immunization) were also disrupted [6,7,8]. These disruptions have led other researchers to associate the lack of services with higher mortality rates among low-income groups [9,10,11]. In addition, China’s experience in fighting the epidemic also shows that the syndromic surveillance of fever, cough and other symptoms by primary medical institutions can effectively warn the community of COVID infection, especially in areas where nucleic acid testing laboratories are scarce [12,13]. These medical resource allocation problems have become barriers to achieving the SDGs [14,15,16]. It generates a situation in which healthcare resources such as diagnostic kits, drugs, and basic healthcare infrastructure were in shortage throughout the period, along with the negative impact on the socioeconomic system [16,17]. It is necessary to objectively evaluate the equalization of basic medical services in each region, and scientifically guide the allocation of government medical resources to ensure the robustness of the medical system in response to emergencies, so that everyone can have equal medical access opportunities. This is the foundation to ensure people’s basic health rights in response to the COVID pandemic [17,18].
1.1. Social Science
The social medicine field has long paid attention to the level of medical deployment and its influencing factors [17]. Related research evaluates the equalization of basic medical services by analyzing statistical data such as the number of hospitals, medical staff, hospital scale, etc. For example, R. Marten, D. McIntyre, et al. use life expectancy, maternal mortality ratio, under-five mortality rate, the prevalence of HIV in adults aged 15–49 years, physicians’ density, and other indicators to evaluate the progress of Brazil, Russia, India, China, and South Africa in EBMS [19]. R. Miao, X. Xiang, et al. use DEMATEL and information entropy to quantify the degree of mutual influence between system indicators and the differences in medical market performance, respectively, to obtain the objective index weight [20]. G. Yang, Y. Xue, et al. use the system generalized method of moments (SYS-GMM), mediation effect, and linkage effect to investigate the relationship among social organization participation, government governance, and the equalization of basic public services from 2007 to 2017 in China. The equalization level of basic public services in China is evaluated by analyzing the participation of social organizations and government governance behaviors in different periods, including research on the equalization of medical services [21]. H. Liu selected nine sample provinces in China by stratified random sampling, and their current situation of basic medical services’ equalization was evaluated by the TOPSIS method and the rank sum ratio (RSR) method. The equalization of basic medical services was evaluated by measures and dimensions of universal health coverage (including economic affordability, service availability, service attainability, and system effectiveness) proposed by the World Health Organization (WHO) [22]. From the perspective of studying the behavioral model of families’ use of health services, Anderson studied the relationship family characteristics and health service use, which is expected to facilitate the development of a more equitable distribution of health care consumption. Grossman also studied this from the perspective of health demand models [23,24].
1.2. Health Geography
The health/medical geography field has done many wonderful researches, such as the spatial organization of medical services or facilities, the relationship between the spatial distribution of medical services and people’s needs, etc. [25,26]. Furthermore, research allocation methods have been applied to health geography problems to establish the fundamental theoretical issues of whether the distribution of resources affects health outcomes [27,28,29,30,31], coverage of medical facilities, minimum travel time (distance), cost-effectiveness, etc. are the basis of geographic allocation studies [3,32,33]. Daisuke Shinjo, Toshiharu Aramaki, et al. examined the geographical distribution of healthcare resources, healthcare service provision, and interregional patient flow in Japan, to improve Japan’s healthcare policy [34]. Hong Wu, Xingbo Rong, et al. explored the impact of opening high-speed rails on the allocation level of urban medical resources and concluded that opening high-speed rails has significantly increased the allocation level of medical resources in the city [35]. Nael Aoun, Hirotaka Matsuda, et al. studied the relationship between travel time to a health center and variations in height for children less than five years of age in eastern Rwanda, and concluded that there was a significant and negative association between height-for-age z-scores and travel time to the health center [36]. In addition, some scholars focused on studying the accessibility of medical and health services in geographical space and examined the level of medical construction through analysis of accessibility, thereby reflecting the equalization of urban basic medical services [37,38,39,40,41,42,43,44,45,46]. The research of all medical service facilities considers many factors such as the hospital‘s grade, capacity, and facilities level [47]. Accessibility, as a key indicator to measure the spatial layout of public service facilities, can indeed effectively evaluate the spatial allocation of medical resources and services [27]. In the research on the influencing factors of healthcare utilization behavior in the social medicine field, the accessibility of medical facilities is mainly abstracted as Euclidean distance, and less consideration is given to the spatial structure of the urban or rural environment.
1.3. Current Limitations of Approaches
However, accessibility can only evaluate a part of the EBMS, such as the convenience of citizens’ access to medical services, which focuses on transportation accessibility and the spatial distribution of medical facilities [37,38,40,41]. The EBMS emphasizes that all citizens have access to roughly equal basic medical services in a fair and accessible manner. It requires consideration of factors including the number of people and their age structure, the scale, service radius, convenience (spatial layout) of medical institutions, etc. [48]. Therefore, accessibility cannot be a complete substitute for EBMS.
For the research of evaluation methods, some scholars use the factor analysis method, TOPSIS method, rank sum ratio method, and grey relational analysis method to calculate the degree of equalization of basic medical services [22]. After analyzing the literature, many scholars have different considerations of the indicator weight in the evaluation method. Some of them use the equal weight method to calculate, or use the analytic hierarchy process and expert experience method to weight the indicator, which has a certain impact on the objectivity of the evaluation result [49].
In general, many studies on the evaluation of the equalization of basic medical services are too one-sided, either lacking a spatial perspective or focusing too much on spatial relationships, without integrating the spatial as well as the quantitative features of medical resources.
1.4. Our Contribution
Compared with previous studies, this article fully considers the advantages and limitations of the research results on the equalization of basic medical services in social science and medical geography, constructs a two-level indicator evaluation system for the equalization of basic medical services from a spatial perspective, overlaying analyses the precise spatial distribution, service radius, and scale of medical institutions with the spatial distribution of residential areas and population (instead of only computing aggregates for regions), to comprehensively reflect the allocation level of medical institutions and the convenience of medical treatment for residents. This research is innovative in the perspective of analysis theory, using the entropy weight method and the TOPSIS method in information theory and statistics to ensure the objectivity of the equalization evaluation of basic medical services.
This article takes the Xinjiang Uygur Autonomous Region (hereafter referred to as Xinjiang), China as the empirical research object, and calculates and quantifies the level of equalization of basic medical services in each prefecture-level administrative region within Xinjiang. The results will provide a scientific reference and theoretical basis for guiding the government’s medical service allocation decisions and realizing the equalization of basic medical services throughout the autonomous region.
2. Study Area and Methods
2.1. Study Area
The choice of the Xinjiang Uyghur Autonomous Region as the study area is based on the following considerations: Firstly, Xinjiang is the largest province in China, and the area of it exceeds that of Alaska. The settlements in the province are very far apart, most of which are located in river valleys and oasis, separated by deserts and Gobi, which places high demands on the rationalization of medical resources. Secondly, Xinjiang is an economically underdeveloped region in China, and the level of medical services in this region lags behind other regions of China. Achieving the goal of equalization of basic medical services has become a huge challenge. Thirdly, Xinjiang is expected to become an important economic growth area in Central Asia. Promoting the equalization of basic medical services in Xinjiang will become an important part of achieving SDGs. Therefore, there is an urgent need to understand the disparity in the level of equalization of basic medical services among the various prefecture-level regions in Xinjiang, and in this way, the corresponding policy adjustments can be made in the 14th (2021–2025) Five-Year Plan for Basic Public Services in Xinjiang. In summary, the study area is defined as the 14 prefecture-level administrative regions (regions, autonomous prefectures, and prefecture-level cities) in Xinjiang. The 14 prefecture-level administrative regions involved in the study are shown in Figure 1.
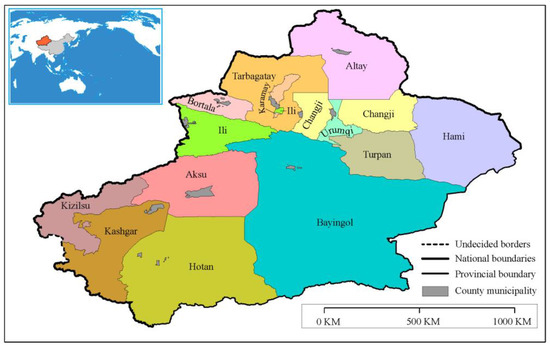
Figure 1.
Location of the study area: Xinjiang. Data Resource: modified from Gaode Map, https://lbs.amap.com, accessed on 9 March 2022.
2.2. Data Preprocessing
The study adopted the data of geo-information and sectors on the study area, such as surface coverage classification data, geographic factor data, population data, hospital data at all levels, health care worker data, health risk population data, and road network data. Among them, the geographic information data are derived from the Xinjiang Oasis Regional Geographical Conditions Monitoring Project (The Xinjiang Oasis Regional Geographical Conditions Monitoring Project collects the surface coverage and geographical elements of Xinjiang at two to three-year intervals, covering all the surface nature and human geographical elements such as hospitals, residential areas, roads, administrative divisions, etc. The average spatial resolution of the images is 1 m), population data, medical staff data, and health risk population data from Xinjiang Statistical Yearbook. The data sources are shown in Table 1.

Table 1.
Data adopted inventory.
According to the Xinjiang Statistical Yearbook 2019, the medical care in each prefecture-level region in Xinjiang is counted (See Table A1 in Appendix A for details). According to the “Hospital Hierarchical Management Standard of China”, research counts hospitals’ data of Grade I, II, and III (The Grade I hospital is a local hospital that provides medical, prevention, rehabilitation and health care services directly to the community. The Grade II hospital is a regional hospital that provides medical and health services across several counties and is a regional medical technology center. The Grade III hospital is a hospital that provides medical and health services across cities and is a medical technology center with comprehensive medical, teaching and scientific research capabilities).
Before starting the statistical analysis of EBMS, we must spatially distribute the population data and health risk population data for the calculation and evaluation of EBMS indicators. In this study, the population and health risk population were spatially processed by the pycnophylactic dasymetric mapping method using the Monte Carlo simulation (CITE). This is a stochastic method that can be combined with GIS to discretize population data onto a raster of 1 km*1 km size (or other grid sizes) [50]. Since the size of the raster is the same, the probability of assigning the data to a particular raster is calculated as follows according to the basic principles of probability statistics.
The number of people assigned to a particular raster is:
where is the weight of the -th land use type in the -th density zone; is the total population; is the number of people in the raster. The method has been studied in depth in the literature [51,52,53]. Compared with the point-based interpolation method [54,55], the simple surface domain weighting method [56,57], the modified surface domain weighting method [50], and the maximization retention method (pycnophylactic) [58], this pycnophylactic dasymetric mapping method using CITE introduces urban land use, which is highly correlated with urban population distribution as the weight for the discretization of population data, and can discretize the population to rasters of different resolutions as needed, and for which the total population before and after discretization remains unchanged. It can meet the needs of urban micro-modeling for spatial change analysis of population [59].
The population, health risk population after spatialization is shown in Figure 2 (The enlarged version is shown in Appendix B Figure A1, Figure A2 and Figure A3). The scales of the Xinjiang regional map in this article (Figure 2 and Figure 9) are 1:5,500,000.
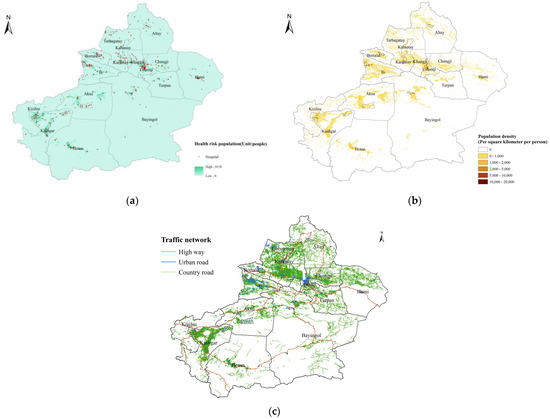
Figure 2.
Spatial distributions of population, health risk population, and hospitals: (a) spatial distribution of health risk population and hospitals; (b) spatial distribution of population; (c) Xinjiang Oasis Regional Geographical Conditions Monitoring road network data.
2.3. Method
The methods used in this research consist of the development of evaluation indicators, the entropy weight method, and the TOPSIS method.
The evaluation indicator system of equalization of basic medical service was constructed first, then the weights of each indicator of the entropy were adopted, and finally, the TOPSIS method was used to evaluate the level of basic medical service in each region.
2.3.1. Design of Comprehensive Evaluation Indicator System
- (1)
- Development of Evaluation Indicators
This study identifies two classes of indicators to characterize the equalization of basic medical services: the allocation level of medical institution and the convenience of medical treatment. The allocation level of medical institution refers to the allocation of medical institutions in a region in terms of grade, number, spatial distribution, population coverage, number of medical and nursing staff, etc. It is mainly used to reflect the fairness of medical resource allocation. The convenience of medical treatment refers to the time residents would have to travel to access medical services. The study distinguishes between different levels of healthcare facilities, correlates healthcare facilities with health-risk populations, and adds indicators that show how well healthcare facilities match the population they serve. Taking into account the results of the study on the equalization of basic health services in the field of medicine and healthcare, indicators such as the ratio of health care staff to the population covered and the average number of hospital beds have been added, which is one of the most important parameters in the calculation of accessibility and is therefore not presented separately. In addition, considering the spatial structure of urban traffic, this paper adopts path distance to measure the coverage of residential areas and populations by healthcare providers.
The research designed the evaluation indicator system which included 2 first-grade indicators (allocation level of medical institution, convenience of medical treatment) and 13 s-grade indicators. The allocation level of medical institution layer includes 11 indicators. The convenience of medical care is expressed in terms of accessibility and distance to the nearest medical path. Accessibility is the number of available hospital beds per capita within the travel radius of residential area, reflecting the ease of access to medical institutions [60]; proximity reflects the spatial layout of medical institutions. The system of indicators for the equalization of basic medical services is shown in Table 2.

Table 2.
Evaluation Indicator System for Equalization of Basic Medical Services.
The hospital service radius is determined by the residents’ willingness to travel. In life, the first and most frequent choice of residents is with hospitals near their communities, of which the largest number are Grade I hospitals [61]. Grade I hospitals are generally built around communities and administrative villages, including community hospitals, township hospitals, village health clinics, and others. In the case of hospitals in the vicinity of residential communities, residents generally get services within a walking distance. The relationship between travel time and path distance using the ArcGIS traffic network analysis tool based on some researches [62,63,64] is shown in Table 3. The walking speed is set at 80 m/min (4.8 km/h), and the average drive speed (including peak periods) can be calculated based on the road type. For example, highway 80 km/h, national highway 60 km/h, provincial highway 60 km/h, municipal road 40 km/h, county road 40 km/h, and village road 20 km/h.

Table 3.
The service radius (time and path distance) based on hospital size.
Therefore, the study set the radius of the residential areas served by the Grade I medical institutions involved in the indicator at 1.2 km, the radius of the residential areas served by Grade II hospitals at 6 km, and 24 km for those served by Grade III hospitals. The radius is 3.8 km for the medical institutions provided by administrative villages,.
- (2)
- The indicator value calculation
Statistical methods and spatial analysis methods are mainly used for the calculation of indicator values,. Spatial analysis methods include overlay, buffer zone, and traffic network analysis. The calculation methods for each indicator are shown in Table 4.

Table 4.
Equalization evaluation indicators and calculation method of basic medical service.
The accessibility indicators are calculated using a two-step floating catchment area (2SFCA), originally proposed by Radke J. and Mu L., an improvement compared with the earlier floating catchment method in terms of the considerations of both supply and demand [43]. In fact, 2SFCA is a spatial accessibility measure based on the idea of opportunity accumulation, using the principle of quantifying the facilities or resources accessible to residents within a set threshold range: the greater the number, the better the accessibility [44,65,66]. Therefore, the results can be used to evaluate the appropriateness of the allocation of services in a certain area [43,44,45]. Specific steps are as follows:
First, taking hospital j as the center, determine the time or distance threshold, search for all the residential points (residential area geographic centroids) k that fall within the search radius, and calculate the supply-demand ratio, as shown in Equation (1).
is the supply-to-demand ratio of health service at the location area is the size of supply at , expressed in hospital beds’ number; is the size of demand at point expressed in population; is the cost of access to health services between points k and j, usually expressed in terms of distance or time (distance used in this study, which is the average of the nearest distances that residents have to travel to reach a health point); is the search radius.
Second, centered on resident point , searching for all medical points j that fall within the search radius and add up the services provided by all medical points to get the accessibility at the resident point . (Equation (2))
is the accessibility of health service at point ; is the time cost of access to health services between points i and j. The equation can be used to express the accessibility of health care providers of administrative regions after transformation, see Equation (3)
Indicator is the accessibility of medical institutions in the prefecture-level region, is the product of the average number of hospitals covered within the service radius of each residential plot or administrative village and the average number of hospital beds, and is the average plot population size (per 10,000 people).
2.3.2. The Entropy Method
Entropy was first introduced by German physicist Crawus in thermodynamics, which was later applied to information theory, indicating uncertainty of things or issues. In information theory, information is a measure of the degree of order of a system and entropy is a measure of the disorder degree of a system, both equal in absolute value and opposite in sign [67]. In this study, the entropy weighting method is used to calculate the indicator weights for the equalization of basic medical services in each prefecture-level region, that is using the information given by the indicator matrix to calculate the indicator weights. The calculation steps are as follows:
Step 1: Establish a multi-attribute decision matrix A. Assuming that there are evaluation indicators (basic medical service equalization evaluation indicators), evaluation objects (basic medical service equalization situation in Xinjiang prefecture-level regions), and a multi-attribute decision matrix X made up of raw data:
Step 2: Establish the normalized decision matrix B. The second step requires that the decision matrix of step 1 be normalized. The procedure for normalization is outlined in Equation (5). To eliminate the influence of the different dimensions of each indicator on the equalization of basic medical service, it is necessary to normalize the decision matrix of step 1 as Equation (5) shown and get the normative decision matrix B. represents the contribution of the th prefecture-level region under the th indicator.
Step 3: Calculate the entropy of the th indicator, reflecting the degree of variability of indicator .
where , m is the number of prefecture-level regions, therefore, the value of is between 0 and 1. From Equation (7), it is clear that converges to 1 when the values of a certain indicator converge across prefecture-level regions. When is equal to 1, which means that indicator is the same for all prefecture-level regions, the indicator can then be excluded from the evaluation indicators. It can therefore be seen that the weighting factor of the indicator is determined by the size of the difference between the indicators for the equalization of basic medical services in all prefecture-level regions. Therefore, the (see Equation (8)) can be defined and introduced to represent the degree of consistency of the contribution of indicator to the equalization of basic medical services in each region, which can also be interpreted as the degree of diversification [68].
Step 4: Calculate the weight of each indicator
When is 0, the th indicator can be excluded from the evaluation indicators, the weight of this indicator is 0, which means the condition is the same for all prefecture-level regions, therefore, as an indicator, it is meaningless for the evaluation.
2.3.3. The TOPSIS Method
The conceptual framework for the TOPSIS methodology was developed by Hwang and Yoon [69]. TOPSIS ranks the evaluation objects by sorting them based on their proximity to an idealized target. The procedure is as follows:
Step 1: The performance matrix set up in Equation (4) is normalized using Equation (10).
Step 2: Combined with indicator weight , establish the weighted normalized matrix :
Step 3: According to the normalized matrix, use Equations (12) and (13) to determine the ideal best solution (extreme performance on each indicator) and ideal worst solution (reverse extreme performance on each indicator) [70].
is the maximum value of indicator , and is the minimum.
Step 4: For the basic medical service situation of prefecture No., Equations (14) and (15) can be used to calculate the Euclidean distances of with the ideal best solution and the ideal worst solution. Equation (16) can give the basic medical service situation composite indicator of region No..
The value of is between 0 and 1, and the smaller the , the smaller the distance between the primary care equalization situation in the area and the idealized best solution, and, therefore, the larger the ; conversely, the smaller the , the smaller the distance between the primary care equalization situation in the area and the idealized worst solution, and consequently, the smaller the .
3. Results
We calculated the value of each indicator according to the constructed evaluation indicator system of equalization of basic medical services, the weight of each indicator, and finally used the TOPSIS method to analyze the equalization of basic medical services in each area in Xinjiang.
3.1. Result of Indicator Value Analysis
3.1.1. Allocation Level of Medical Institution
According to the basic medical service equalization indicator design in Table 2, this research sets various medical institutions as the center and uses buffer analysis to calculate the coverage of residential areas, coverage of administrative villages, population and health risk populations within the service radius of hospitals in various administrative regions of Xinjiang. The indicator values of the allocation level of medical institution are obtained in Table A2. Figure 3 shows the histograms of indicator values for the allocation level of medical institutions in various prefecture-level regions.
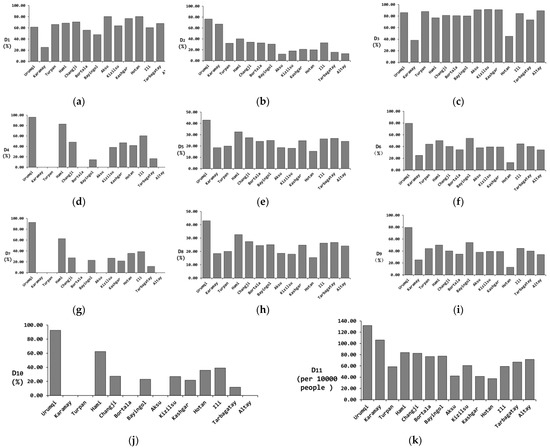
Figure 3.
Histogram of indicator values for the allocation level of medical institutions in Xinjiang. (a) Indicator D1, (b) Indicator D2, (c) Indicator D3, (d) Indicator D4, (e) Indicator D5, (f) Indicator D6, (g) Indicator D7, (h) Indicator D8, (i) Indicator D9, (j) Indicator D10, (k) Indicator D11.
In Xinjiang, the average coverage of residential areas within the hospital’s service radius is 68.41%. The prefecture-level administrative regions with higher coverage are Aksu, Hotan, and Kashgar, with coverage between 76.86% and 80.36%. The average coverage of administrative villages within the hospital’s service radius is 27.31%. The prefecture-level administrative regions with higher coverage are Urumqi and Karamay, with coverage rates of 76.49% and 67.91%, respectively. The average coverage of residential areas within the service radius of Grade II hospitals is 84.78%. The prefecture-level administrative regions with higher coverage are Urumqi, Aksu, Kizilsu, and Kashgar, with coverage between 90.91–91.86%. The average coverage rate of residential areas within the service radius of Grade III hospitals is 61.86%. The prefecture-level administrative regions with higher coverage rates are Urumqi and Hami, with respective coverage rates of 97.18% and 82.99%.
The average population coverage rate within the service radius of prefecture-level administrative district hospitals is 27.08%. The prefecture-level administrative districts with higher coverage rates are Urumqi and Hami, with coverage rates of 54.71% and 32.52%, respectively. The average population coverage rate within the service radius of Grade Ⅱ hospitals is 43.70%. The prefecture-level administrative districts with higher coverage rates are Urumqi and Karamay, with coverage rates of 81% and 60.62% respectively. The average population coverage rate within the service radius of Grade Ⅲ hospitals is 31.42%. The prefecture-level administrative region with the highest coverage rate is Urumqi, with a coverage rate of 92.62%.
The average coverage rate of people with health risks within the hospital service radius is 26.89%. The prefecture-level administrative regions with relatively high coverage rates are Urumqi and Hami, with coverage rates of 54.66% and 32.57%. The average coverage rate of people with health risks within the service radius of Grade Ⅱ hospitals is 43.31%. The prefecture-level administrative regions with higher coverage rates are Urumqi and Karamay, with coverage rates of 80.96% and 60.74% respectively. The average coverage rate of people with health risks within the service radius of Grade Ⅲ hospitals is 31.06%. The administrative regions with higher coverage rates are Urumqi and Hami, with coverage rates of 92.58% and 62.36% respectively.
3.1.2. Convenience of Medical Treatment
In the research, we take residential areas and administrative villages as centers to calculate the number of medical institutions available for residents within the travel radius of residential areas and administrative villages as well as the distance between nearby medical treatments, by using buffer zone analysis and traffic network analysis. The accessibility of medical institutions in each statistical unit can be calculated according to Equation (3). The parameter values for calculating accessibility refer to Table A3 in Appendix A, and the indicator values of medical convenience refer to Table A4, including accessibility and nearest medical transportation distance, as shown in Figure 4.

Figure 4.
The indicators of the convenience of medical treatment in the districts of Xinjiang, (a) Indicator D12; (b) Indicator D13.
The average accessibility value of residents to medical institutions is 0.26 in Xinjiang. Urumqi, Changji, Hami, and Karamay have the best accessibility, with an accessibility value between 0.25 and 1.42. On the contrary, the poorest accessibility appears in Bayingol, Altay, and Kizilsu, with an accessibility value between 0.05 and 0.07.
The average travel distance for the nearest medical treatments in all districts of Xinjiang is 2.01 km. Among them, Urumqi, Changji, Bayingol, Kashgar, Hotan, and Yili have shorter medical distances, ranging from 1.06 to 1.87 km.
3.2. Indicator Weight Calculation
According to Equations (4)–(9), the weights of the equalization indicator of basic medical services in each district of Xinjiang can be calculated, referring to the indicator data of Table A2 and Table A4.
The decision matrix (Table 5) is constructed according to Equations (4) and (5). Then according to Equations (7)–(9), ,, and, are calculated respectively as shown in Table 6, in which .

Table 5.
Standardized decision matrix.

Table 6.
Calculation results.
Table 6 shows that the indicator weights of D1–D13 are 0.6%, 6.2%, 0.5%, 18.8%, 2.1%, 2.4%, 20%, 2.1%, 2.4%, 20%, 2.3%, 19.7%, and 3.2%. Figure 5 shows the comparison of values.
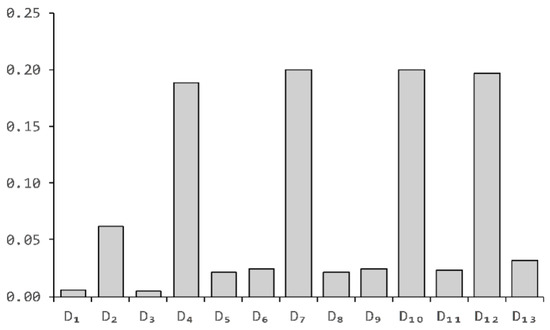
Figure 5.
Histogram of the weight of each indicator.
The information entropy of the indicators D1 and D3 are 0.995 and 0.996 respectively, which are close to 1, indicating that those indicators have the lowest degree of variation, reflecting that Xinjiang medical institutions and Grade Ⅱ hospitals have very nearly the same coverage of urban residential areas, which means that urban residents have almost equal access to services on those indicators. The information entropy of indicators D5, D6, D8, D9, D11, and D13 is between 0.971 and 0.98, and the degree of indicator variation is small, reflecting that medical institutions have nearly the same coverage of population, risk groups, and medical staff, and basically achieve equal service on those indicators.
The entropy value of the four indicators D4, D7, D10, and D12 in the equalization indicator system of Xinjiang basic medical services is between 0.814 and 0.825, with the largest utility value, the largest amount of information reflected, and the largest weight. Analyzing the reasons, the three indicators D4, D7, and D10 are directly related to Grade III hospitals. The consistency of the indicator data is low, and the data varies greatly. The average variance of the indicator data is 28.02 (the average variance of the remaining indicators is 11.5). At the same time, the indicator data has a high degree of dispersion and indicator variability, indicating that Grade III hospitals are the core factor affecting the equalization of basic medical services, and the distribution is the most uneven. Therefore, the number of Grade III hospitals and their coverage are the most important factors affecting the equalization of basic medical services in various prefecture-level regions, which means whether residents have the same opportunity to receive higher-level medical treatment services.
Indicator D12 indicates the accessibility of medical institutions in various regions, and comprehensively reflects the rationalization of the spatial layout of medical institutions. It can be seen from Figure 6 that 42% of the accessibility of medical institutions in various regions of Xinjiang is concentrated in the interval [0.05, 0.15], and 35% is concentrated in the interval [0.15, 0.25]. Except for Urumqi, the distribution of medical institutions in other regions is uneven, the overall convenience indicator for medical treatment fluctuates greatly (from 0.07 to1.42), and the spatial layout is unreasonable, which greatly affects the residents’ opportunity for equal medical services.
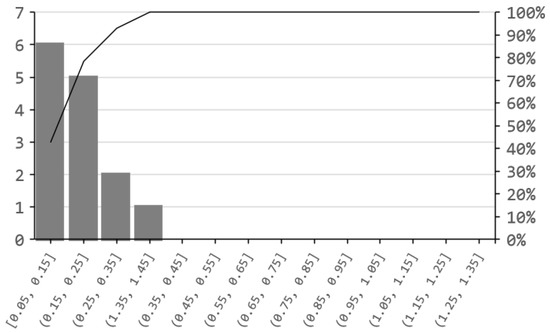
Figure 6.
D12 indicator frequency distribution diagram.
3.3. TOPSIS
We standardize the basic medical service equalization indicators according to Equations (10) and (11) in each region and obtain the weighted standardized indicator matrix (shown in Table A5) after getting calculated weight values. It can be seen from Table A5 that we get the optimal solution and the worst solution for each indicator in each region, as shown in Table 7. After obtaining and , we respectively calculate the Euclidean distance between the medical service equalization indicator in each region and the ideal best solution () and the ideal worst solution() of each indicator by using Equations (14) and (15). According to Equation (16), the equalization indicator of basic medical services() in various regions is calculated, which reflects the Euclidean distance between the equalization level of medical services in various regions and the ideal state. The greater the -value, the shorter the distance between the equalization level of medical services in the region and the optimal solution, and the farther the distance from the inferior solution, the higher the level. The level of equalization of medical services in various regions is shown in Table 8. The comparison of , and in each region is shown in Figure 7.

Table 7.
and values of various indicators.

Table 8.
Basic medical service equalization scores in various regions.
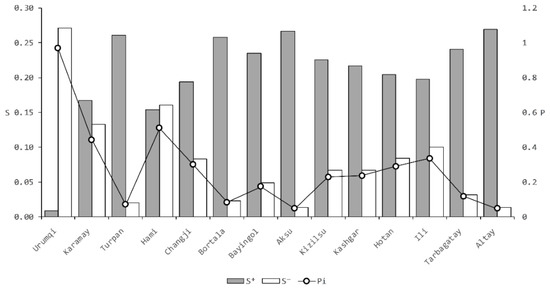
Figure 7.
Comparison of , and.
3.4. Regional Statistics on the Level of Equalization of Basic Medical Services
Standard deviation is often used in probability statistics as a measure of the degree of the statistical distribution of data. It can reflect the degree of dispersion of a dataset and it has the same units as the data within the group. In the medical field, the standard deviation is commonly used to measure the range or level of medical reference values [71]. The ideal result of the EBMS level is that each prefecture-level region has approximately the same value (mean close to 1 and standard deviation close to 0) in our study. Given that the standard deviation can be understood as a kind of average distance from the sample data to the mean, the study uses the standard deviation of values as a statistical interval to classify EBMS level classes for each region from large to small. Moreover, in the subsequent more in-depth study of the effect of index changes on the level of EBMS, when the effect of each 1-unit increases in the index on the level of EBMS is not significant, it can also be considered to convert it to an increase of one standard deviation for the study. After calculation, the standard deviation of is about 0.2. The distribution interval and frequency of are shown in Figure 8.
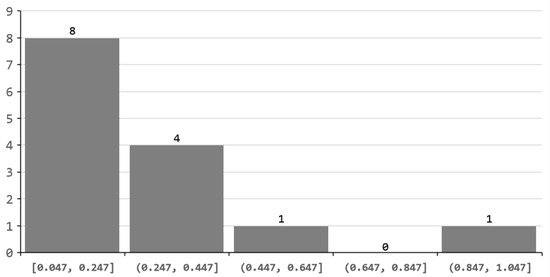
Figure 8.
Interval statistical histogram of.
It can be concluded from Table 8 and Figure 8, the research divides Xinjiang’s basic medical service equalization level into four levels according to the distribution interval of values in each region. Level I is Urumqi. Level II is Hami. Level III has four prefecture-level regions: Hotan, Changji, Ili, and Karamay. Level IV has eight prefecture-level regions: Altay, Aksu, Turpan, Bortala, Tarbagatay, Bayingol, Kizilsu, and Kashgar.
At the same time, the use of GIS technology to perform regional spatial processing of , and in each region can more intuitively reveal the spatial distribution of basic medical services in each region, as shown in Figure 9, the enlarged version is shown in Appendix B Figure A4.
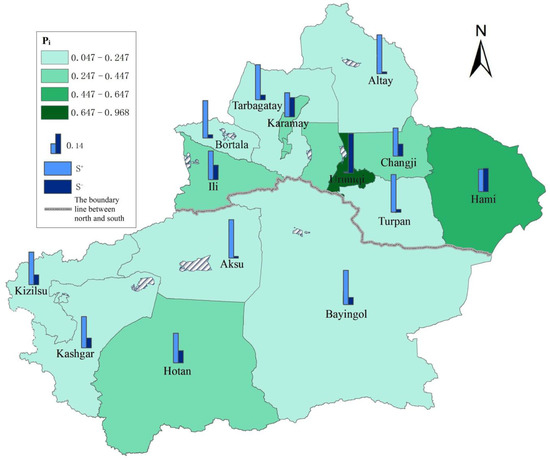
Figure 9.
Spatial distribution of , and.
Analysis of Figure 9 shows that 57.1% of regions (prefecture-level regions) of Xinjiang are at level IV of equalization of basic medical services, 28.6% are at level III, and only 14.3% are at level I and II.
4. Discussion and Conclusions
This research designed the EBMS’ evaluation indicator system which included 2 first-grade indicators (allocation level of medical institution, convenience of medical treatment) and 12 second-grade indicators under the spatial perspective, and uses the entropy method and the TOPSIS evaluation model to calculate the current spatial distribution and level of EBMS in Xinjiang.
In contrast to the numerical evaluation method in medical resource analysis [72,73], this paper proposes an EBMS evaluation method from a spatial perspective, taking into account the advantages of medical geography spatial accessibility [1,74]. The level of medical institutions can be analyzed by fusion analysis of their precise spatial distribution, scale, the number of medical staff, and other data with residential area distribution, population density, and medical needs, to comprehensively reflect the allocation level of medical institutions and the convenience of residents for medical treatment from a spatial perspective. This can reflect the equal opportunities for residents to access basic medical and health services. Given the reliability of the research methodology, the main conclusions obtained in this paper are as follows:
(1) The higher EBMS indices in Urumqi and Hami indicate that the spatial distribution of medical institutions in the region is more reasonable than in other prefecture-level regions. It also has higher coverage, better accessibility, and more convenient access to basic medical services for residents, and a stronger ability to respond to public health emergencies. The government can therefore appropriately reduce the later planning investment. Conversely, lower EBMS indices in Altay and the other seven cities indicate that medical institutions are poor in spatial distribution, accessibility, coverage, and convenience. From this result, the main reason for low EBMS is the insufficient coverage of Grade Ⅲ hospitals. The large area of the jurisdiction and the dispersed population distribution have resulted in low EBMS in eight cities, including Altay.
(2) The research found that the EBMS level is low in most prefecture-level regions of Xinjiang, and the distribution of basic medical service resources is extremely uneven between prefecture-level regions in Xinjiang.
(3) The EBMS level in the northern part of Xinjiang is significantly higher than that in the south. There were also obvious differences between prefecture-level cities within them.
Therefore, the ability to deal with large-scale emergencies (such as COVID-19) is limited. Only a few areas have essentially achieved equalization of medical services.
This paper suggests that:
(1) For the follow-up investment, the government should fully integrate the residents’ spatial distribution characteristics and medical needs, rationally plan the layout of medical institutions and medical resources investment, and further enhance the equality and convenience of residents’ medical treatment opportunities.
(2) Urumqi and Hami have a better level of EBMS. The government should therefore focus on directing public health service resources to remote mountainous areas and rural groups to narrow the urban-rural gap in medical and health services. At the same time, medical and health service facilities should be reasonably laid out to avoid the crowding-out effect of population gathering on medical and health services as much as possible.
(3) For prefecture-level regions other than Urumqi and Hami where the EBMS is weak, the government should gradually increase the intensity of public health investment, accelerate the urbanization process, and give full play to the role of population gathering and public health investment in promoting the equalization of medical and health services.
It seems that the above recommendations are measures to improve the level of regional EBMS. We will further argue for their reliability in a follow-up study. In addition, we also clearly recognize the limitation that the evaluation methods proposed in this paper (e.g., ) can only reflect the ranking and disparity of the level of EBMS in each region, and cannot indicate the severity of inequality. In our subsequent work, we will monitor the changes in EBMS levels within the prefecture-level region in Xinjiang annually, by using the results of the long time series monitoring and the Atkinson index or the Gini Coefficient to study the inequality for each [75], to better guide the government to perform its medical resource redistribution function.
Author Contributions
Liang Zhan and Chune Li conceived and designed the experiments; Xuejia Sang performed the experiments; Jun Ma and Nana Li contributed analysis tools; Liang Zhan and Xuejia Sang analyzed the data and wrote the paper. All authors have read and agreed to the published version of the manuscript.
Funding
This research was sponsored by the Natural Science Foundation of Xinjiang Uygur Autonomous Region (Research on the measurement and evaluation of equalization of basic medical services based on spatial perspective, 2022D01B179), and the Geographical Conditions Monitoring in Xinjiang Oasis Region (No. 2018lzqujc001).
Institutional Review Board Statement
Not applicable.
Informed Consent Statement
Informed consent was obtained from all subjects involved in the study.
Data Availability Statement
All data are reported in this paper.
Conflicts of Interest
The authors declare no conflict of interest.
Appendix A

Table A1.
Basic medical conditions of all districts in Xinjiang.
Table A1.
Basic medical conditions of all districts in Xinjiang.
| Statistical Unit | Medical Institutions | Grade II Hospitals | Grade III Hospitals | Number of Sickbeds per 10,000 People | Medical Staff | Health Risk Population |
|---|---|---|---|---|---|---|
| Urumqi | 1773 | 31 | 28 | 145 | 35,185 | 676,988 |
| Karamay | 77 | 4 | 1 | 69 | 3140 | 87,975 |
| Turpan | 433 | 9 | 1 | 62 | 3829 | 164,998 |
| Hami | 447 | 7 | 1 | 57 | 5175 | 137,786 |
| Changji | 1244 | 24 | 2 | 69 | 11,652 | 348,327 |
| Bortala | 462 | 8 | 0 | 54 | 3793 | 111,495 |
| Bayingol | 1011 | 20 | 3 | 77 | 10,828 | 312,154 |
| Aksu | 1485 | 17 | 0 | 57 | 10,689 | 663,449 |
| Kizilsu | 352 | 7 | 1 | 64 | 3619 | 170,796 |
| Kashgar | 3190 | 28 | 2 | 58 | 18,640 | 1,240,992 |
| Hotan | 1728 | 8 | 3 | 69 | 8439 | 616,029 |
| Ili | 1454 | 26 | 4 | 54 | 17,836 | 677,179 |
| Tarbagatay | 1132 | 19 | 1 | 59 | 7032 | 306,071 |
| Altay | 695 | 11 | 0 | 53 | 4845 | 159,854 |

Table A2.
The coverage of residential areas, administrative villages, population, health risk population, and the proportion of medical staff within the service radius of medical institutions in various administrative regions of Xinjiang.
Table A2.
The coverage of residential areas, administrative villages, population, health risk population, and the proportion of medical staff within the service radius of medical institutions in various administrative regions of Xinjiang.
| Statistical Unit | |||||||||||
|---|---|---|---|---|---|---|---|---|---|---|---|
| Urumqi | 73.78 | 76.49 | 91.86 | 97.18 | 54.71 | 81 | 92.62 | 54.66 | 80.96 | 92.58 | 131.82 |
| Karamay | 42.64 | 67.91 | 76.14 | 62.94 | 27.2 | 60.62 | 56.09 | 27.25 | 60.74 | 55.9 | 106.15 |
| Turpan | 66.16 | 32.08 | 87.88 | 0 | 19.97 | 44.11 | 0 | 20.03 | 44.22 | 0 | 58.63 |
| Hami | 68.4 | 40.08 | 77.08 | 82.99 | 32.52 | 50.03 | 62.55 | 32.57 | 49.99 | 62.36 | 83.89 |
| Changji | 70.76 | 34.04 | 81.2 | 48.3 | 27.36 | 40.16 | 27.29 | 27.34 | 40.13 | 27.32 | 82.49 |
| Bortala | 56 | 32.67 | 80.67 | 0 | 24.12 | 34.62 | 0 | 24.34 | 34.86 | 0 | 76.8 |
| Bayingol | 47.92 | 30.4 | 80.21 | 14.58 | 24.95 | 54.1 | 22.95 | 25.01 | 54.17 | 22.92 | 77.41 |
| Aksu | 80.36 | 12 | 91.07 | 0 | 18.61 | 37.99 | 0 | 18.65 | 38.03 | 0 | 42.24 |
| Kizilsu | 63.83 | 17.99 | 91.49 | 38.3 | 18.02 | 39.36 | 26.88 | 17.93 | 39.41 | 26.95 | 60.68 |
| Kashgar | 76.86 | 20.91 | 90.91 | 47.11 | 24.73 | 39.3 | 21.6 | 24.69 | 39.33 | 21.64 | 41.53 |
| Hotan | 80.22 | 19.97 | 45.05 | 41.76 | 15.38 | 12.85 | 35.74 | 15.39 | 12.85 | 35.67 | 37.37 |
| Ili | 60.35 | 32.81 | 84.57 | 60.35 | 26.32 | 44.63 | 38.85 | 26.24 | 44.62 | 38.95 | 59.27 |
| Tarbagatay | 67.84 | 15.58 | 73.47 | 16.43 | 26.74 | 40.13 | 11.71 | 26.66 | 40.1 | 11.72 | 66.88 |
| Altay | 67.86 | 12.91 | 89.29 | 0 | 24.17 | 34.36 | 0 | 24.01 | 34.26 | 0 | 71.69 |

Table A3.
Parameters for calculating the accessibility of medical institutions in Xinjiang.
Table A3.
Parameters for calculating the accessibility of medical institutions in Xinjiang.
| Statistical Unit | Average Number of Hospitals within the Residential Areas‘ Service Radius (1200 m) | Average Number of Hospitals within the Administrative Village Service Radius (3800 m) | Number of Residential Areas | Number of Administrative Villages | Population (10,000 People) |
|---|---|---|---|---|---|
| Urumqi | 3.16 | 5.58 | 1473 | 1021 | 222.26 |
| Karamay | 0.71 | 2.72 | 197 | 134 | 30.77 |
| Turpan | 2.35 | 1.65 | 198 | 240 | 63.34 |
| Hami | 1.85 | 3.66 | 290 | 247 | 55.94 |
| Changji | 2.27 | 3.18 | 623 | 642 | 139.37 |
| Bortala | 2.13 | 2.07 | 150 | 300 | 47.85 |
| Bayingol | 0.76 | 0.96 | 97 | 601 | 124.21 |
| Aksu | 2.71 | 0.77 | 149 | 1250 | 256.17 |
| Kizilsu | 1.06 | 0.53 | 47 | 289 | 62.45 |
| Kashgar | 3.11 | 1.96 | 282 | 2604 | 463.38 |
| Hotan | 2.27 | 1.27 | 91 | 1517 | 253.06 |
| Ili | 1.44 | 3.63 | 543 | 894 | 293.06 |
| Tarbagatay | 1.26 | 0.55 | 522 | 918 | 99.25 |
| Altay | 0.96 | 0.25 | 76 | 609 | 65.95 |

Table A4.
Indicator of equalization of basic medical services and convenience of medical treatment in all districts.
Table A4.
Indicator of equalization of basic medical services and convenience of medical treatment in all districts.
| Region\Indicator | Accessibility | Distance of Nearest Medical Treatment |
|---|---|---|
| Urumqi | 1.42 | 1.87 |
| Karamay | 0.25 | 2.62 |
| Turpan | 0.17 | 3.14 |
| Hami | 0.3 | 2.05 |
| Changji | 0.34 | 1.84 |
| Bortala | 0.21 | 2.43 |
| Bayingol | 0.07 | 1.82 |
| Aksu | 0.11 | 4.02 |
| Kizilsu | 0.05 | 2.77 |
| Kashgar | 0.18 | 1.06 |
| Hotan | 0.16 | 1.07 |
| Ili | 0.13 | 1.87 |
| Tarbagatay | 0.15 | 2.25 |
| Altay | 0.07 | 4.53 |

Table A5.
Weighted normalized TOPSIS table.
Table A5.
Weighted normalized TOPSIS table.
| Indicator\Regions | D1 | D2 | D3 | D4 | D5 | D6 | D7 | D8 | D9 | D10 | D11 | D12 | D13 |
|---|---|---|---|---|---|---|---|---|---|---|---|---|---|
| Urumqi | 0.0018 | 0.0344 | 0.0015 | 0.1018 | 0.0111 | 0.0112 | 0.1278 | 0.0111 | 0.0112 | 0.1278 | 0.0108 | 0.1777 | 0.0062 |
| Karamay | 0.0010 | 0.0305 | 0.0012 | 0.0660 | 0.0055 | 0.0084 | 0.0774 | 0.0055 | 0.0084 | 0.0772 | 0.0087 | 0.0313 | 0.0087 |
| Turpan | 0.0016 | 0.0144 | 0.0014 | 0.0000 | 0.0041 | 0.0061 | 0.0000 | 0.0041 | 0.0061 | 0.0000 | 0.0048 | 0.0213 | 0.0105 |
| Hami | 0.0016 | 0.0180 | 0.0013 | 0.0870 | 0.0066 | 0.0069 | 0.0863 | 0.0066 | 0.0069 | 0.0861 | 0.0068 | 0.0375 | 0.0068 |
| Changji | 0.0017 | 0.0153 | 0.0013 | 0.0506 | 0.0056 | 0.0056 | 0.0376 | 0.0056 | 0.0056 | 0.0377 | 0.0067 | 0.0425 | 0.0061 |
| Bortala | 0.0013 | 0.0147 | 0.0013 | 0.0000 | 0.0049 | 0.0048 | 0.0000 | 0.0050 | 0.0048 | 0.0000 | 0.0063 | 0.0263 | 0.0081 |
| Bayingol | 0.0012 | 0.0137 | 0.0013 | 0.0153 | 0.0051 | 0.0075 | 0.0317 | 0.0051 | 0.0075 | 0.0316 | 0.0063 | 0.0088 | 0.0061 |
| Aksu | 0.0019 | 0.0054 | 0.0015 | 0.0000 | 0.0038 | 0.0053 | 0.0000 | 0.0038 | 0.0053 | 0.0000 | 0.0034 | 0.0138 | 0.0134 |
| Kizilsu | 0.0015 | 0.0081 | 0.0015 | 0.0401 | 0.0037 | 0.0055 | 0.0371 | 0.0036 | 0.0055 | 0.0372 | 0.0049 | 0.0063 | 0.0092 |
| Kashgar | 0.0018 | 0.0094 | 0.0015 | 0.0494 | 0.0050 | 0.0055 | 0.0298 | 0.0050 | 0.0055 | 0.0299 | 0.0034 | 0.0225 | 0.0035 |
| Hotan | 0.0019 | 0.0090 | 0.0007 | 0.0438 | 0.0031 | 0.0018 | 0.0493 | 0.0031 | 0.0018 | 0.0493 | 0.0030 | 0.0200 | 0.0036 |
| Ili | 0.0014 | 0.0147 | 0.0014 | 0.0632 | 0.0054 | 0.0062 | 0.0536 | 0.0053 | 0.0062 | 0.0538 | 0.0048 | 0.0163 | 0.0062 |
| Tarbagatay | 0.0016 | 0.0070 | 0.0012 | 0.0172 | 0.0054 | 0.0056 | 0.0162 | 0.0054 | 0.0056 | 0.0162 | 0.0055 | 0.0188 | 0.0075 |
| Altay | 0.0016 | 0.0058 | 0.0014 | 0.0000 | 0.0049 | 0.0048 | 0.0000 | 0.0049 | 0.0048 | 0.0000 | 0.0058 | 0.0088 | 0.0151 |
Appendix B
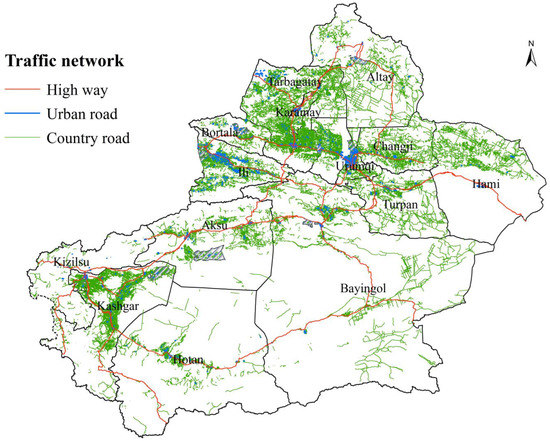
Figure A1.
Xinjiang Oasis Regional Geographical Conditions Monitoring data: road network data.
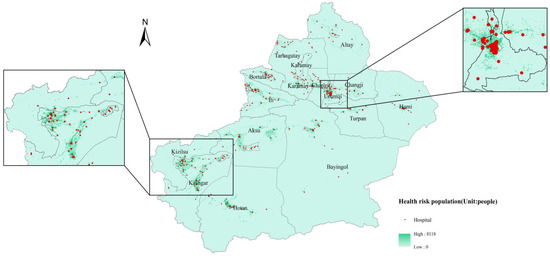
Figure A2.
Spatial distributions of population, health risk population, and hospitals: spatial distribution of health risk population and hospitals.
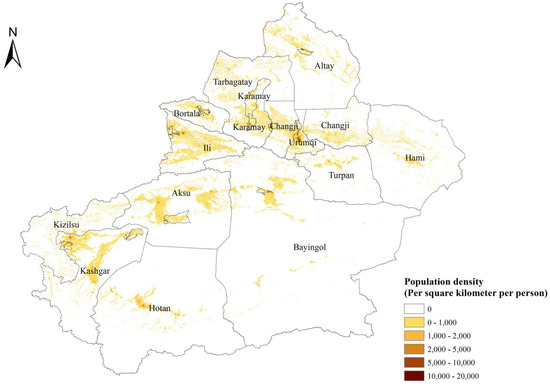
Figure A3.
Spatial distributions of population.
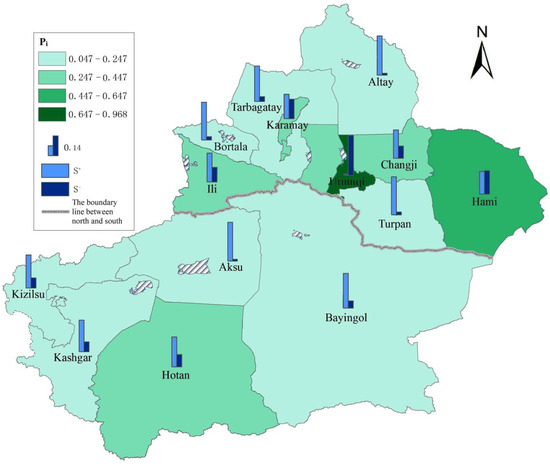
Figure A4.
Spatial distribution of , and.
References
- Yang, D.H.; Goerge, R.; Mullner, R. Comparing GIS-Based Methods of Measuring Spatial Accessibility to Health Services. J. Med. Syst. 2006, 30, 23–32. [Google Scholar] [CrossRef] [PubMed]
- Meihong, L. Research on the Equalization of Basic Medical Services in China. Doctoral Dissertation, Capital Normal University, Beijing, China, 2011. [Google Scholar]
- Guindo, L.A.; Wagner, M.; Baltussen, R.; Rindress, D.; Janine van Til3, P.K.; Goetghebeur, M.M. From efficacy to equity: Literature review of decision criteria for resource allocation and healthcare decisionmaking. Cost Eff. Resour Alloc. 2012, 10, 9. [Google Scholar] [CrossRef] [PubMed]
- WHO. Pulse Survey on Continuity of Essential Health Services during the COVID-19 Pandemic. Available online: https://www.who.int/publications/i/item/WHO-2019-nCoV-EHS_continuity-survey-2020.1 (accessed on 27 August 2020).
- Ferranna, M.; Cadarette, D.; Bloom, D.E. COVID-19 Vaccine Allocation: Modeling Health Outcomes and Equity Implications of Alternative Strategies. Engineering 2021, 7, 924–935. [Google Scholar] [CrossRef] [PubMed]
- Ahmad, K.; Erqou, S.; Shah, N.; Nazir, U.; Morrison, A.R.; Choudhary, G.; Wu, W.-C. Association of poor housing conditions with COVID-19 incidence and mortality across US counties. PLoS ONE 2020, 15, 13. [Google Scholar] [CrossRef] [PubMed]
- Finch, W.H.; Finch, M.E.H. Poverty and Covid-19 Rates of Incidence and Deaths in the United States During the First 10 Weeks of the Pandemic. Front. Sociol. 2020, 5, 47. [Google Scholar] [CrossRef]
- Woo, B.; Jun, J. COVID-19 Racial Discrimination and Depressive Symptoms among Asians Americans: Does Communication about the Incident Matter? J. Immigr. Minor. Health 2022, 24, 78–85. [Google Scholar] [CrossRef]
- Mahendradhata, Y.; Andayani, N.; Hasri, E.T.; Arifi, M.D.; Siahaan, R.G.M.; Solikha, D.A.; Ali, P.B. The Capacity of the Indonesian Healthcare System to Respond to COVID-19. Front. Public Health 2021, 9, 887. [Google Scholar] [CrossRef]
- Wu, Z.; McGoogan, J.M. Characteristics of and Important Lessons From the Coronavirus Disease 2019 (COVID-19) Outbreak in China Summary of a Report of 72 314 Cases From the Chinese Center for Disease Control and Prevention. JAMA J. Am. Med. Assoc. 2020, 323, 1239–1242. [Google Scholar] [CrossRef]
- Wang, Y.; Yang, J.; Ma, H.; Dong, X.; Xie, G.; Ye, S.; Du, J. Application of telemedicine in the COVID-19 epidemic: An analysis of Gansu Province in China. PLoS ONE 2021, 16, e0249872. [Google Scholar] [CrossRef]
- Yang, T.-C.; Kim, S.; Zhao, Y.; EmilyChoi, S.-W. Examining spatial inequality in COVID-19 positivity rates across New York City ZIP codes. Health Place 2021, 69, 102574. [Google Scholar] [CrossRef]
- Qian, X.; Qiu, S.; Zhang, G. The impact of COVID-19 on housing price Evidence from China. Financ. Res. Lett. 2021, 2021, 101944. [Google Scholar] [CrossRef] [PubMed]
- Lai, L.; Wittbold, K.A.; Dadabhoy, F.Z.; Sato, R.; Landman, A.B.; Schwamm, L.H.; He, S.; Patel, R.; Wei, N.; Zuccotti, G.; et al. Digital triage: Novel strategies for population health management in response to the COVID-19 pandemic. Healthcare (Amst) 2020, 8, 100493. [Google Scholar] [CrossRef] [PubMed]
- Beckett, C.D.; Zadvinskis, I.M.; Dean, J.; Iseler, J.; Powell, J.M. An Integrative Review of Team Nursing and Delegation: Implications for Nurse Staffing during COVID- 19. Worldviews Evid.-Based Nurs. 2021, 18, 251–260. [Google Scholar] [CrossRef] [PubMed]
- Nicola, M.; Alsafi, Z.; Sohrabi, C.; Kerwan, A.; Al-Jabir, A.; Iosifidis, C.; Agha, M.; Agha, R. The socio-economic implications of the coronavirus pandemic (COVID-19): A review. Int. J. Surg. 2020, 78, 185–193. [Google Scholar] [CrossRef]
- Mishra, A.; Basumallick, S.; Lu, A.; Chiu, H.; Shah, M.A.; Shukla, Y.; Tiwari, A. The healthier healthcare management models for COVID-19. J Infect Public Health 2021, 14, 927–937. [Google Scholar] [CrossRef]
- Khoja, T.A.M.; Qidwai, W.; Rawaf, S.; Alnaser, F.A.; Nanji, K.; Khoja, A.; Kurashi, N.Y.A.; Saad, N.E.S.; Halasa, W.; Farahat, T.M.; et al. Primary Health Care in Pandemics: Barriers, Challenges and Opportunities. World Fam. Med. 2021, 19, 6–11. [Google Scholar] [CrossRef]
- Marten, R.; McIntyre, D.; Travassos, C.; Shishkin, S.; Longde, W.; Reddy, S.; Vega, J. An assessment of progress towards universal health coverage in Brazil, Russia, India, China, and South Africa (BRICS). Lancet 2014, 384, 2164–2171. [Google Scholar] [CrossRef]
- Miao, R.; Xiang, X.; Wu, Q.; Jiang, Z. Evaluation method of medical service system based on DEMATEL and the information entropy: A case study of hypertension diagnosis and treatment in China. PLoS ONE 2020, 15, e0243832. [Google Scholar] [CrossRef]
- Yang, G.; Xue, Y.; Ma, Y. Social Organization Participation, Government Governance and the Equalization of Basic Public Services: Evidence from China. Int. J. Envron. Res. Public Health 2019, 16, 2996. [Google Scholar] [CrossRef]
- Liu, H.; Tang, S. Current Situation of the Equalization of Basic Medical Services in China: Based on TOPSIS Method and Rank Sum Ratio Method. Chin. Gen. Pract. 2016, 19, 3078–3081. [Google Scholar] [CrossRef]
- Kehrer, B.H.; Andersen, R.; Glaser, W.A. A Behavioral Model of Families’ Use of Health Services. J. Hum. Resour. 1972, 7, 125. [Google Scholar] [CrossRef]
- Grossman, M. On the Concept of Health Capital and the Demand for Health. J. Political Econ. 1972, 80, 223–255. [Google Scholar] [CrossRef]
- Johnston, R.; Gregory, D.; Smith, D. The Dictionary of Human Geography, 3rd ed.; Blacwell: Oxford, UK, 2004. [Google Scholar]
- Wiles, J. Culture/Place/Health. New Zealand Geogr. 2002, 58, 79. [Google Scholar] [CrossRef]
- Horev, T.; Pesis-Katz, I.; Mukamel, D.B. Trends in geographic disparities in allocation of health care resources in the US. Health Policy 2004, 68, 223–232. [Google Scholar] [CrossRef] [PubMed]
- Pan, J.; Shallcross, D. Geographic distribution of hospital beds throughout China: A county-level econometric analysis. Int. J. Equity Health 2016, 15, 179. [Google Scholar] [CrossRef] [PubMed]
- Tandi, T.E.; Cho, Y.; Akam, A.J.; Afoh, C.O.; Ryu, S.H.; Choi, M.S.; Kim, K.; Choi, J.W. Cameroon public health sector: Shortage and inequalities in geographic distribution of health personnel. Int. J. Equity Health 2015, 14, 43. [Google Scholar] [CrossRef]
- Barr, B.; Bambra, C.; Whitehead, M. The impact of NHS resource allocation policy on health inequalities in England 2001-11: Longitudinal ecological study. BMJ 2014, 348, g3231. [Google Scholar] [CrossRef]
- Anselmi, L.; Lagarde, M.; Hanson, K. Going beyond horizontal equity: An analysis of health expenditure allocation across geographic areas in Mozambique. Soc. Sci. Med. 2015, 130, 216–224. [Google Scholar] [CrossRef]
- Ensor, T.; Cooper, S. Overcoming barriers to health service access: Influencing the demand side. Health Policy Plan 2004, 19, 69–79. [Google Scholar] [CrossRef]
- Rutherford, M.E.; Mulholland, K.; Hill, P.C. How access to health care relates to under-five mortality in sub-Saharan Africa: Systematic review. Trop Med. Int. Health 2010, 15, 508–519. [Google Scholar] [CrossRef]
- Shinjo, D.; Aramaki, T. Geographic distribution of healthcare resources, healthcare service provision, and patient flow in Japan: A cross sectional study. Soc. Sci. Med. 2012, 75, 1954–1963. [Google Scholar] [CrossRef] [PubMed]
- Wu, H.; Rong, X.; Zhao, M. Do High-Speed Rails Improve the Allocation Level of Medical Resources? Front. Sustain. Cities 2022, 4, 68. [Google Scholar] [CrossRef]
- Aoun, N.; Matsuda, H.; Sekiyama, M. Geographical accessibility to healthcare and malnutrition in Rwanda. Soc. Sci. Med. 2015, 130, 135–145. [Google Scholar] [CrossRef]
- Wensheng, Z.; Huaxiong, J.; Hongru, A.I.; Jing, L.; Xiaofang, W. Analysis of regional inequalities of basic medical resources supply in China. Geogr. Res. 2015, 34, 2049–2060. [Google Scholar] [CrossRef]
- Pulver, A.; Wei, R. Optimizing the spatial location of medical drones. Appl. Geogr. 2018, 90, 9–16. [Google Scholar] [CrossRef]
- Delen, D.; Erraguntla, M.; Mayer, R.J.; Wu, C.-N. Better management of blood supply-chain with GIS-based analytics. Ann. Oper. Res. 2011, 185, 181–193. [Google Scholar] [CrossRef]
- Nasrabadi, A.M.; Najafi, M.; Zolfagharinia, H. Considering short-term and long-term uncertainties in location and capacity planning of public healthcare facilities. Eur. J. Oper. Res. 2020, 281, 152–173. [Google Scholar] [CrossRef]
- Ahmadi-Javid, A.; Seyedi, P.; Syam, S.S. A survey of healthcare facility location. Comput. Oper. Res. 2017, 79, 223–263. [Google Scholar] [CrossRef]
- Li, F.U.; Yong, W.; Biao, Z.; Yong, M.; Min, G. Spatial Accessibility of Medical Facilities in Beibei District based on Modified Two-step Floating Catchment Area Method. J. Geo-Inf. Sci. 2019, 21, 1565–1575. [Google Scholar] [CrossRef]
- John, R.; Lan, M. Spatial Decompositions, Modeling and Mapping Service Regions to Predict Access to Social Programs. Geogr. Inf. Sci. 2000, 6, 105–112. [Google Scholar] [CrossRef]
- Wang, F.; Luo, W. Assessing spatial and nonspatial factors for healthcare access: Towards an integrated approach to defining health professional shortage areas. Health Place 2005, 11, 131–146. [Google Scholar] [CrossRef] [PubMed]
- Wenyu, D.; Yinghui, X.; Zhouling, H.U.; Qingming, Z. Rural Emergency Shelter Accessibility Using Gaussian Based 2-step Floating Catchment Area Method. J. Geo-Inf. Sci. 2018, 20, 1412–1421. [Google Scholar] [CrossRef]
- Wang, F. From 2SFCA to i2SFCA: Integration, derivation and validation. Int. J. Geogr. Inf. Sci. 2021, 35, 628–638. [Google Scholar] [CrossRef] [PubMed]
- Zhou, L.; Wang, S.; Xu, Z. A Multi-factor Spatial Optimization Approach for Emergency Medical Facilities in Beijing. ISPRS Int. J. Geo-Inf. 2020, 9, 361. [Google Scholar] [CrossRef]
- Commission, N.D.A.R. Notice on the Issuance of the 14th Five-Year Plan for Public Services. Available online: https://www.ndrc.gov.cn/xxgk/zcfb/ghwb/202201/t20220110_1311622.html?code=&state=123 (accessed on 1 October 2022).
- Yang, F.; Yang, D. The measurement of basic public services quality and the analysis of their differences among prefectures: A case of Xinjiang. J. Arid Land Resour. Environ. 2014, 5, 37–42. [Google Scholar] [CrossRef]
- Li, D.; Peng, M. Transformation Between Urban Spatial Information Irregular Grid and Regular Grid. Geomat. Inf. Sci. Wuhan Univ. 2007, 32, 95–99. [Google Scholar] [CrossRef]
- Zhengdong, H. Data Integration for Urban Transport Planning. Doctoral Dissertation, Utrecht University, Utrecht, The Netherlands, 2003. [Google Scholar]
- Spiekermann, K.; Wegener, M. Freedom from the Tyranny of Zones Towards New GIS-Based Spatial Models; Fotheringham, A.S., Wegener, M., Eds.; Taylor & Francis: London, UK, 2000. [Google Scholar]
- Wegener, M. New spatial planning models. Int. J. Appl. Earth Obs. Geoinf. 2001, 3, 224–237. [Google Scholar] [CrossRef]
- Okabe, A.; Sadahiro, Y. Variation in count data transferred from a set of irregular zones to a set of regular zones through the point-in-polygon method. Int. J. Geogr. Inf. Sci. 2001, 11, 93–106. [Google Scholar] [CrossRef]
- Lam, N.S.-N. Spatial Interpolation Methods: A Review. Am. Cartogr. 1983, 10, 129–150. [Google Scholar] [CrossRef]
- Goodchild, M.F.; Lam, N.S.-N. Areal Interpolation: A Variant of the Traditional Spatial Problem. Geo-processing 1980, 1, 297–312. [Google Scholar]
- Flowerdew, R.; Green, M. Areal Interpolation and Types of Data; Stewart Fotheringham, A., Rogerson, P.A., Eds.; Taylor & Francis: London, UK, 1994. [Google Scholar]
- Tobler, W.R. Smooth Pycnophylactic Interpolation for Geographical Regions. J. Am. Stat. Assoc. 1979, 74, 519–530. [Google Scholar] [CrossRef]
- Gregory, I.N. The accuracy of areal interpolation techniques: Standardizing 19th and 20th-century census data to allow long-term comparisons. Comput. Environ. Urban Syst. 2002, 26, 293–314. [Google Scholar] [CrossRef]
- McGrail, M.R.; Humphreys, J.S. Measuring spatial accessibility to primary care in rural areas: Improving the effectiveness of the two-step floating catchment area method. Appl. Geogr. 2009, 29, 533–541. [Google Scholar] [CrossRef]
- Wen, Z.; Lili, X.; Xiaolin, Z. Research in Spatial Pattern of Accessibility to Community Service Facilities and Spatial Deprivation of Low Income Community in Nanjing. Hum. Geogr. 2017, 32, 73–79. [Google Scholar] [CrossRef]
- Yintao, L.; De, W. Walkability Measuring in America and Its Enlightenment. Urban Plan. Int. 2012, 27, 10–15. [Google Scholar] [CrossRef]
- Wang, H.; Huang, J.; Li, Y.; Yan, X.; Xu, W. Evaluating and mapping the walking accessibility, bus availability and car dependence in urban space: A case study of Xiamen, China. Acta Geogr. Sin. 2013, 68, 477–490. [Google Scholar] [CrossRef][Green Version]
- Lovett, A.; Haynes, R.; Sünnenberg, G.; Galeb, S. Car travel time and accessibility by bus to general practitioner services:a study using patient registers and GIS. Soc. Sci. Med. 2002, 55, 97–111. [Google Scholar] [CrossRef]
- Siegel, M.; Koller, D.; Vogt, V.; Sundmacher, L. Developing a composite index of spatial accessibility across different health care sectors: A German example. Health Policy 2016, 120, 205–212. [Google Scholar] [CrossRef]
- Luo, W. Using a GIS-based floating catchment method to assess areas with shortage of physicians. Health Place 2004, 10, 1–11. [Google Scholar] [CrossRef]
- Chukwumaobi, O.; Akinlabi, E.T.; Njoku, H.O. Selection of phase change material for Improved performance of Trombe wall systems using the entropy weight and TOPSIS methodology. Energy Build. 2020, 217, 109967. [Google Scholar] [CrossRef]
- Zhihong, Z.; Yi, Y.; Jingnan, S. Entropy method for determination of weight of evaluating indicators in fuzzy synthetic evaluation for water quality assessment. J. Environ. Sci. 2006, 18, 1020–1023. [Google Scholar] [CrossRef]
- Hwang, C.L.; Yoon, K. Multiple Attribute Decision Making: Methods and Applications A State-of-the-Art Survey; Springer: Berlin/Heidelberg, Germany, 1994; p. XI, 269. [Google Scholar] [CrossRef]
- Chen, P. Effects of normalization on the entropy-based TOPSIS method. Expert Syst. Appl. 2019, 136, 33–41. [Google Scholar] [CrossRef]
- Mody, P.; Joshi, P.H.; Khera, A.; Ayers, C.R.; Rohatgi, A. Beyond Coronary Calcification, Family History, and C-Reactive Protein. J. Am. Coll. Cardiol. 2016, 67, 2480–2487. [Google Scholar] [CrossRef] [PubMed]
- Liu, J.; Wu, J.; Zhu, B.; Mao, Y. Evaluation Study on Equalization of Basic Medical and Health Services in China. Value Health 2015, 18, A553. [Google Scholar] [CrossRef][Green Version]
- Yu, Y.; Tao, L.; Yang, T. Construction of evaluation index system for equalization of basic public health services. J. Cent. South Univ. (Med. Sci.) 2014, 39, 511–516. [Google Scholar] [CrossRef]
- Oppong, J.R.; Hodgson, M.J. Spatial Accessibility to Health Care Facilities in Suhum District, Ghana. Prof. Geogr. 2010, 46, 199–209. [Google Scholar] [CrossRef]
- Cowell, F. Measuring Inequality, 3rd ed.; Oxford University Press: Oxford, UK, 2011. [Google Scholar] [CrossRef]
Publisher’s Note: MDPI stays neutral with regard to jurisdictional claims in published maps and institutional affiliations. |
© 2022 by the authors. Licensee MDPI, Basel, Switzerland. This article is an open access article distributed under the terms and conditions of the Creative Commons Attribution (CC BY) license (https://creativecommons.org/licenses/by/4.0/).