Article

VGI and Satellite Imagery Integration for Crisis Mapping of Flood Events

by
Alberto Vavassori
1,*,
Daniela Carrion
1,
Benito Zaragozi
2 and
Federica Migliaccio
1
1
Department of Civil and Environmental Engineering, Politecnico di Milano, Piazza Leonardo da Vinci 32, 20133 Milano, Italy
2
Departament de Geografia, Universitat Rovira i Virgili, C/Joanot Martorell, 43480 Vilaseca, Spain
*
Author to whom correspondence should be addressed.
ISPRS Int. J. Geo-Inf. 2022, 11(12), 611; https://doi.org/10.3390/ijgi11120611
Submission received: 1 October 2022 / Revised: 29 November 2022 / Accepted: 5 December 2022 / Published: 6 December 2022

Abstract

:
Timely mapping of flooded areas is critical to several emergency management tasks including response and recovery activities. In fact, flood crisis maps embed key information for an effective response to the natural disaster by delineating its spatial extent and impact. Crisis mapping is usually carried out by leveraging data provided by satellite or airborne optical and radar sensors. However, the processing of these kinds of data demands experienced visual interpretation in order to achieve reliable results. Furthermore, the availability of in situ observations is crucial for the production and validation of crisis maps. In this context, a frontier challenge consists in the use of Volunteered Geographic Information (VGI) as a complementary in situ data source. This paper proposes a procedure for flood mapping that integrates VGI and optical satellite imagery while requiring limited user intervention. The procedure relies on the classification of multispectral images by exploiting VGI for the semi-automatic selection of training samples. The workflow has been tested with photographs and videos shared on social media (Twitter, Flickr, and YouTube) during two flood events and classification consistency with reference products shows promising results (with Overall Accuracy ranging from 87% to 93%). Considering the limitations of social media-sourced photos, the use of QField is proposed as a dedicated application to collect metadata needed for the image classification. The research results show that the integration of high-quality VGI data and semi-automatic data processing can be beneficial for crisis map production and validation, supporting crisis management with up-to-date maps.

1. Introduction

1.1. Background

Flood events yearly affect millions of people worldwide, with severe impacts on human life, infrastructures, and economies [1]. Flood management requires timely and reliable information on the spatial extent, impact, and evolution of the event. In this context, the production of crisis maps is pivotal to an insightful understanding of the crisis event [2]. In fact, crisis maps provide crucial information to crisis managers by outlining the spatial extent of the affected area and its temporal evolution (delineation map) as well as the impact of the crisis event in terms of damage grade (grading map) [3]. This type of information is disseminated by dedicated research projects and operational services, such as the Copernicus Emergency Management Service (EMS), which provide geo-information in support to response, recovery, and disaster risk reduction activities [4,5].
Flood crisis mapping relies on data provided by a wide range of space and airborne instruments as well as ground sensors, each one providing different spatial and radiometric resolution, timeliness, and performance [6,7]. Given the quick dynamics and the adverse atmospheric conditions characterizing the occurrence of flood events, the choice of the platform and sensor to be employed for flood detection and mapping is crucial for achieving a truthful and accurate result. In this framework, satellite and airborne Synthetic-Aperture Radar (SAR) imagery is largely leveraged for rapid mapping, given the ability of microwave signals to penetrate clouds and light rain and therefore acquire data regardless of the illumination and atmospheric conditions [8]. Nonetheless, the double-bounce and shadow effects due to the presence of buildings and the frequently inadequate spatial resolution of radar sensors are responsible for their reduced performance in the detection of flood water in highly urbanized areas [8,9]. In addition, most SAR image-processing techniques, including visual interpretation, image histogram thresholding, classification, and change detection algorithms, require expert knowledge in SAR imagery manipulation. For all these reasons, post-processing of images based on visual interpretation is critical for improving flood mapping accuracy [7], while it is difficult to achieve fully automatic detection approaches.
Based on the above considerations, optical sensors, provided that cloud free images are available, may be employed in conjunction with or in place of radar sensors to generate flood delineation maps [10]. In addition, optical sensors are the main source of information for the production of grading maps, since the visual interpretation of optical imagery is crucial to perform damage grade estimation [2]. Furthermore, in case of rapidly vanishing cloud cover over the flooded areas, optical multispectral imagery may be useful for mapping the inundation extent with a more straightforward processing workflow. In this case, water detection is carried out by taking advantage of supervised classification algorithms as well as water-relevant spectral indexes, namely the Normalized Difference Water Index (NDWI), Red and Short-Wave Infra-Red (RSWIR), and Green and Short-Wave Infra-Red (GSWIR) [11,12].
Despite the advantages of optical imagery processing, in situ observations remain essential for collecting suitable training samples as well as validating the resulting delineation map with ground truth. On-ground observations provide detailed data which could not be retrieved from traditional data sources such as satellite and airborne sensors. However, the collection of this kind of information may be time- and resource-demanding while possibly not being adequate to achieve sufficient space-time coverage. In recent years, Volunteered Geographic Information (VGI) has emerged in scientific applications for crisis mapping [13]. Social media, user-generated content, and crowdsourced georeferenced data have proved to be valuable data sources for all the activities connected with crisis management—including crisis mapping—as they provide space-time resolved information coming directly from the affected areas with unequalled timeliness and availability. Nevertheless, problems related to the large number of data, data quality, georeferencing, and bias toward severe events raise questions about the reliability of this kind of information [14].
The integration of VGI with more traditional data sources for flood mapping has been tackled in the literature. In [15] Landsat data, the Digital Terrain Model (DTM) and river gauge data were used to derive a statistical model for flooded area probability. In this study, the integration of VGI, including photos, videos, and Google news, into the model significantly improved the result. The study presented in [16] proposed the use of accurate LiDAR (Light Detection and Ranging) derived DEM together with VGI retrieved from the social platform Flickr to estimate the inundation extent and depth. Similar approaches were proposed in [17], with the integration of social media posts with DTM to obtain an estimate of the water surface extent across the flooded area, in [18] with the use of water gauge measurements, DTM, and tweets for producing a flood possibility map, and in [19] which tested the integration of satellite imagery, Flickr posts, and topographic data to derive a Bayesian statistical model of the flood extent.
More recently, several machine and deep learning techniques have been tested aiming at extracting relevant information from social media platforms as well as integrating heterogeneous data for the production of flood delineation maps. In [20] a pre-trained convolutional neural network was employed to extract relevant images from Twitter with the aim of generating a map of the estimated flood extent and severity. In [21] remote sensing data and the textual and spatial information extracted from Twitter posts were used to construct a flooded area measurement proxy, exploiting a trained model. A deep neural network approach was proposed in [22] to detect submerged stop signs in photos taken from flooded roads, in order to estimate floodwater depth. In [23] insights were provided into the use of Twitter posts and images as complementary data to remote sensing imagery, using state-of-the-art deep learning methods to perform data fusion. This study proved that social media posts may support the photointerpretation and processing of satellite imagery, also providing additional information, including local emergency situations, disaster impact, and damage reports.

1.2. Problem Definition

Taking into account the literature summarized in the previous Section, the purpose of the present study is to investigate the use of optical multispectral satellite imagery and VGI in order to produce flood delineation maps through a semi-automatic procedure. The proposed workflow takes advantage of geo-located photographs collected by volunteers to build floodwater training samples to be used for satellite imagery classification.
Training samples are selected by leveraging the technical parameters of the camera lens used to take the photographs and few additional information specified by the volunteer (see Figure 1). Specifically, the parameters needed to define the Regions of Interest (ROIs)—defining the training sample geometry—include the position of the point where the photograph is taken, the camera orientation with respect to the North direction, some technical parameters of the camera lens, and the minimum ( d m i n ) and maximum ( d m a x ) distance of the flooded area from the user position.
The technical parameters needed to calculate the view angle ( α ) according to Equation (1) are the focal length ( f ) and the sensor horizontal dimension ( l ):
α = 2 arctan ( l 2 f ) .
The procedure was tested on two case studies, namely the Southern United Kingdom (UK) flood event (February 2014) and the Hurricane Florence-induced flood on the United States (US) East Coast (September 2018). The workflow for the ROI construction was tested by exploiting photographs and videos shared on social media during the flood occurrence. Experiments were run using posts extracted from Flickr, Twitter, and YouTube—three social media platforms dedicated to the sharing of photographs and videos. Since the posts were not directly shared to contribute to the crisis mapping, a time-consuming pre-processing step was carried out with the aim of extracting only relevant posts as well as retrieving the missing geo-locations, orientation, and technical parameters of the camera lens. The minimum and maximum distances of the flooding were defined with the support of a base map in a Geographic Information System (GIS) environment.
This pre-processing stage may be significantly reduced provided that the photographs are collected by volunteers following well-defined instructions. For this reason, in this paper we propose a collaborative collection of training samples with the use of a dedicated mobile app allowing for the straightforward collection and sharing of geo-referenced data. Several mobile apps and software frameworks are available to perform data collection in the field. In this study, the possible implementation of the crowdsourcing activity by means of QField was investigated. QField is a user-friendly free and open-source application designed to collect geospatial data on the field and easily communicate with QGIS.
The next Sections of this paper are structured as follows. In Section 2 the case studies are presented, providing insights into the methods employed for the data processing and the achieved results. In Section 3 the prototype implementation of the proposed procedure with QField is described. Finally, in Section 4 the conclusions and future directions of this work are reported.

2. Case Studies: Production of Delineation Maps for Two Flood Events

2.1. Study Areas Definition

As explained in Section 1.2, the procedure proposed in this work was tested on two case studies, namely two past flood events induced by quite different meteorological and atmospheric conditions.
The first case study focuses on the UK floods that occurred between December 2013 and February 2014. Floods were caused by a protracted sequence of Atlantic depressions resulting in a series of intense storms, an extreme storm surge, and heavy and persistent rainfall. As a result, January 2014 was the rainiest (January) month since 1766 [24]. The most critical floodings were experienced in early February 2014 across Southern England, especially along the River Severn (between Worcester and Gloucester) and the River Thames (Oxfordshire, Berkshire, and Surrey). Severe and persistent flooding involved the Somerset Levels (including the urban centre of Bridgwater), which lies entirely below sea level [24].
The second case study regards the impact of Hurricane Florence on the US East Coast in September 2018. Florence made landfall as Category 1 hurricane—according to the Saffir–Simpson scale [25,26]—on 14 September at 11:15 Coordinated Universal Time (UTC), inducing strong wind gusts as well as widespread flooding across the North and South Carolinas owing to the consequent storm surge and intense rainfall [27]. Total rainfall amounts reached a peak value of 913 mm in Elizabethtown (North Carolina) and the storm surge height exceeded 3 m above ground level in the Wilmington area (North Carolina) [27].
The choice of the study areas was essentially led by the availability of cloud-free optical satellite imagery and relevant posts for the construction of training samples, as will be discussed in the following. Accordingly, the former case study focused on the urban areas of Bridgwater (Somerset, UK) and Worcester (Worcestershire, UK) (see Figure 2a), whereas for the latter case study the cities of Lumberton and Wilmington (North Carolina, US) were selected (see Figure 2b).

2.2. Dataset Description

The dataset used for flood mapping consists of a collection of social media posts, a single cloud-free satellite acquisition for each study area, and reference flood maps to assess classification quality as described in the following sub-Sections.

2.2.1. Social Media Posts

Social media posts were extracted from the platforms Flickr (https://www.flickr.com/, accessed on 1 October 2022), Twitter (https://twitter.com/, accessed on 1 October 2022), and YouTube (https://www.youtube.com/, accessed on 1 October 2022) within the E2mC (Evolution of Emergency Copernicus Service) project [28]. Data pre-processing was performed in the frame of E2mC by applying semantic, space-time, and image-analysis algorithms to extract useful information for crisis mapping. Specifically, missing post-geo-locations were assigned with the CIME algorithm by analysing the post itself and its content (including comments, hashtags, likes, and shares) [29]. Moreover, an automatic relevance post filtering was performed aiming to discard duplicates and retain only images with relevant content [30].
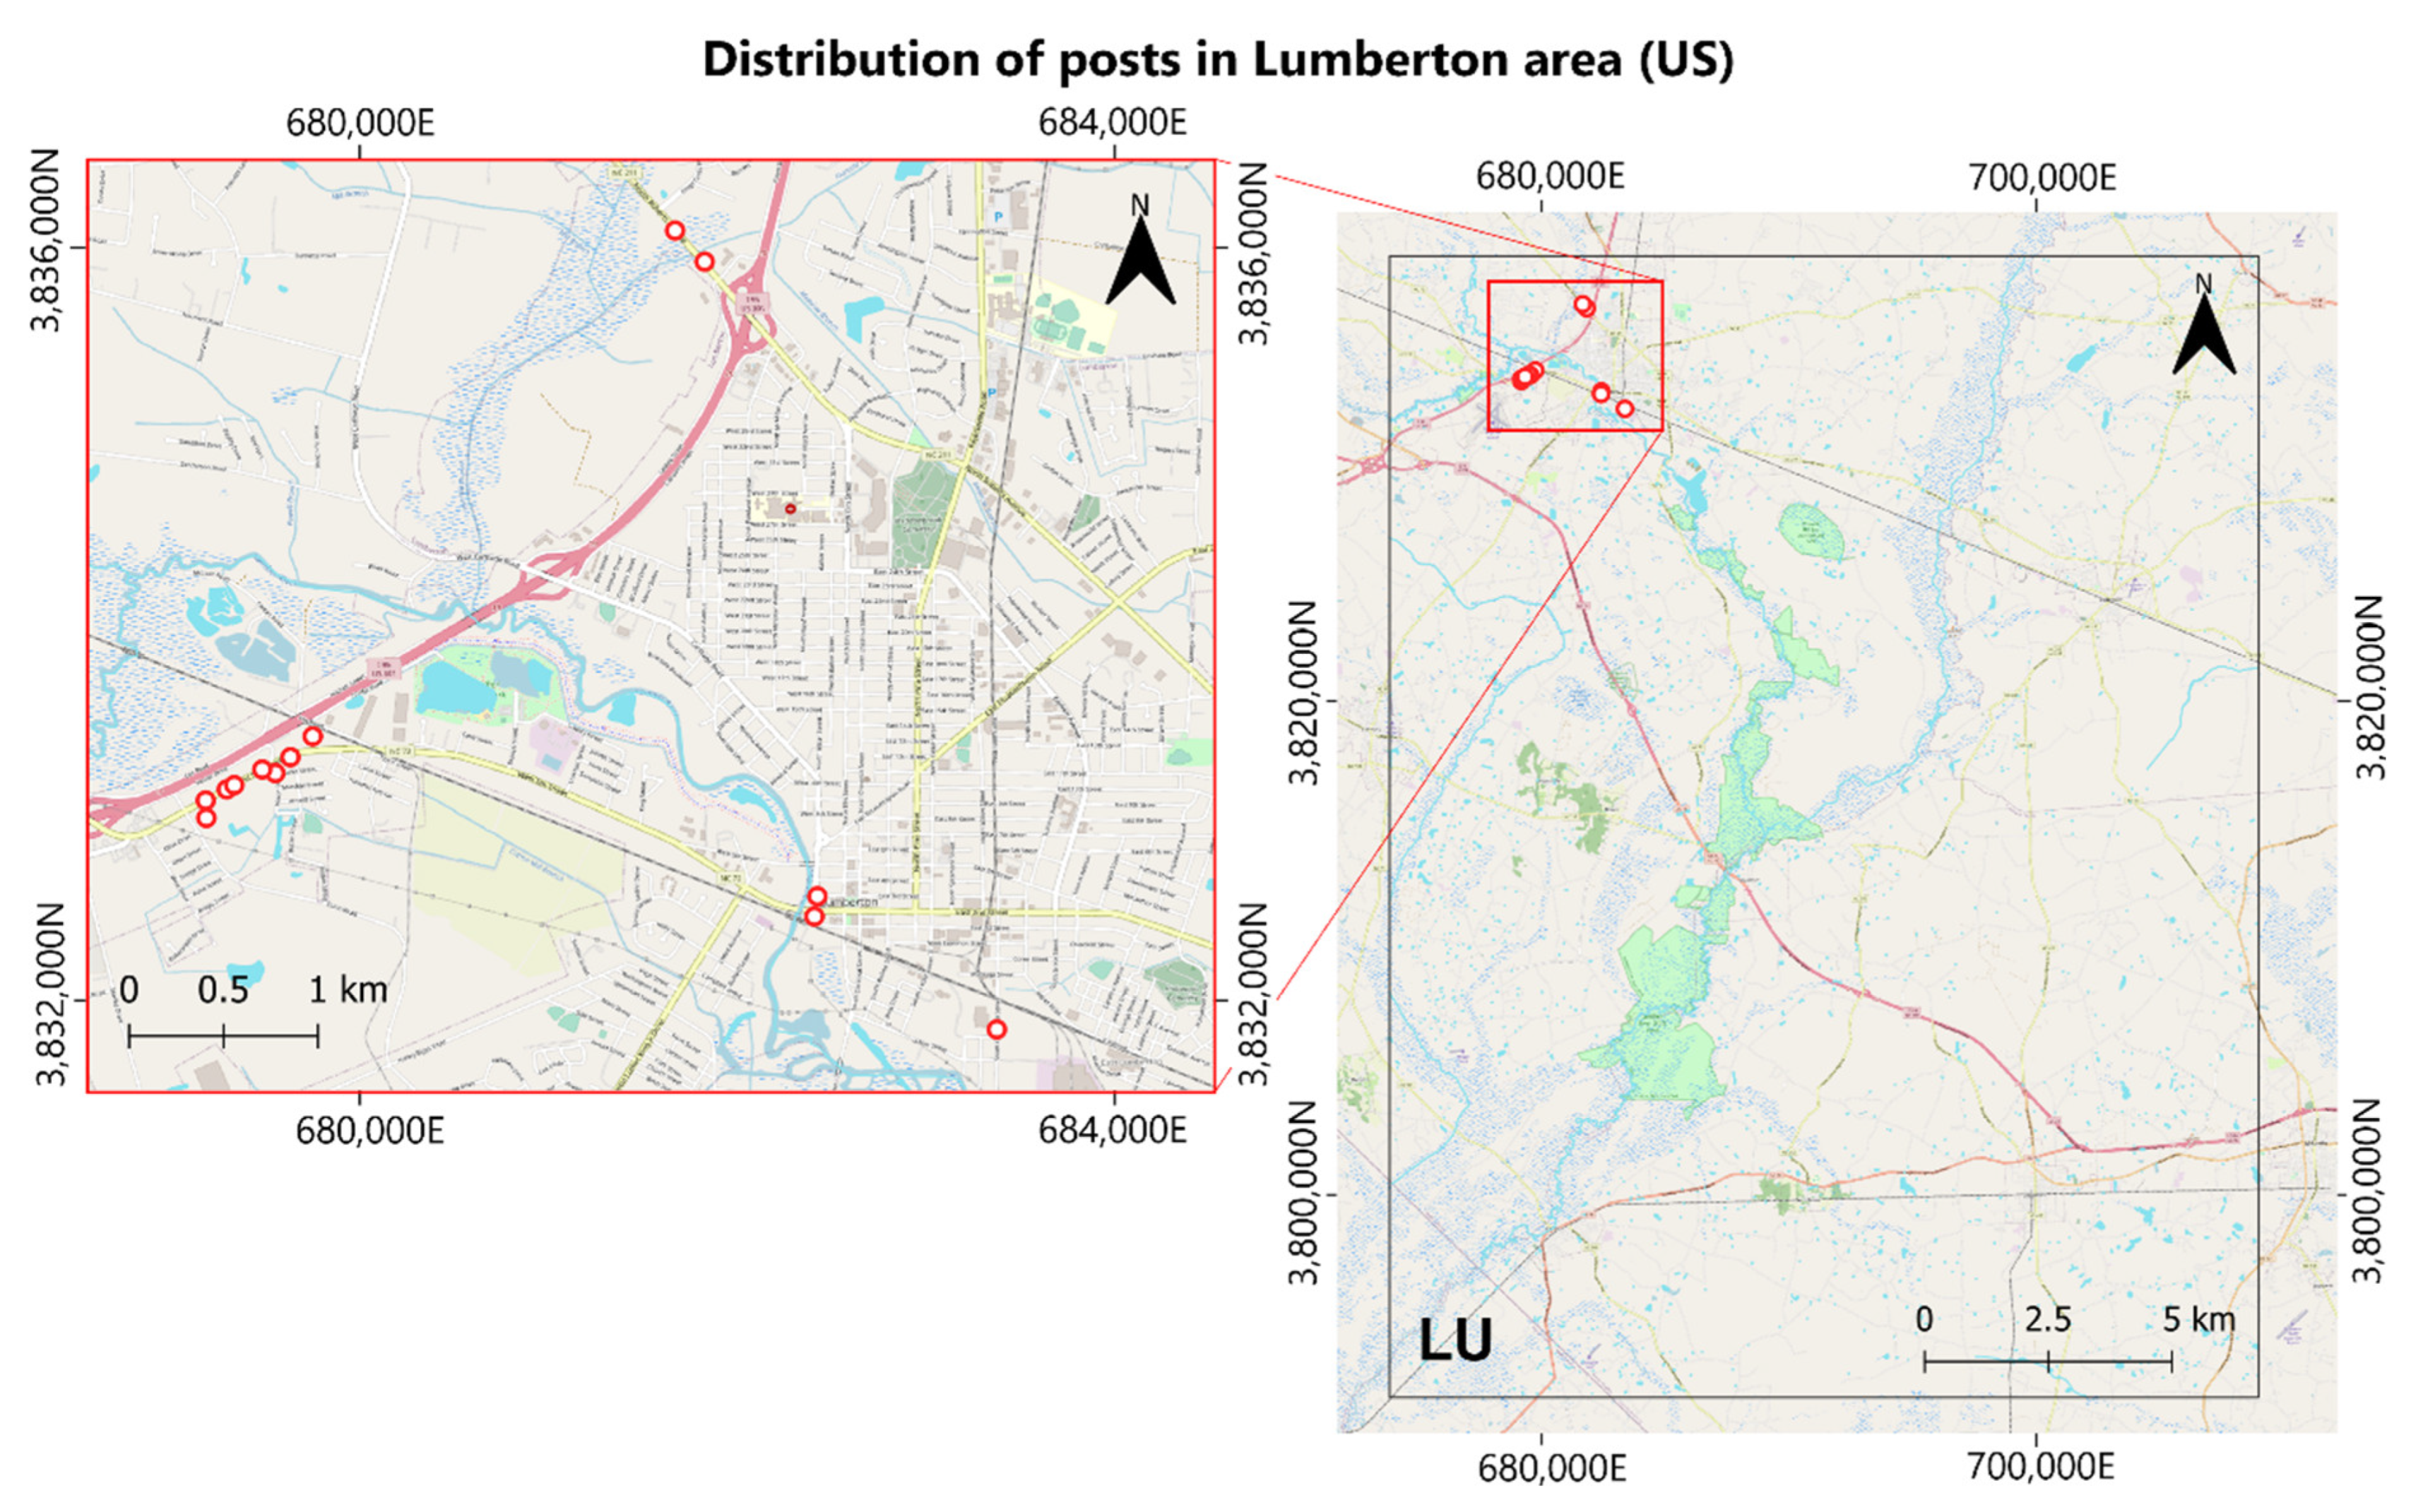
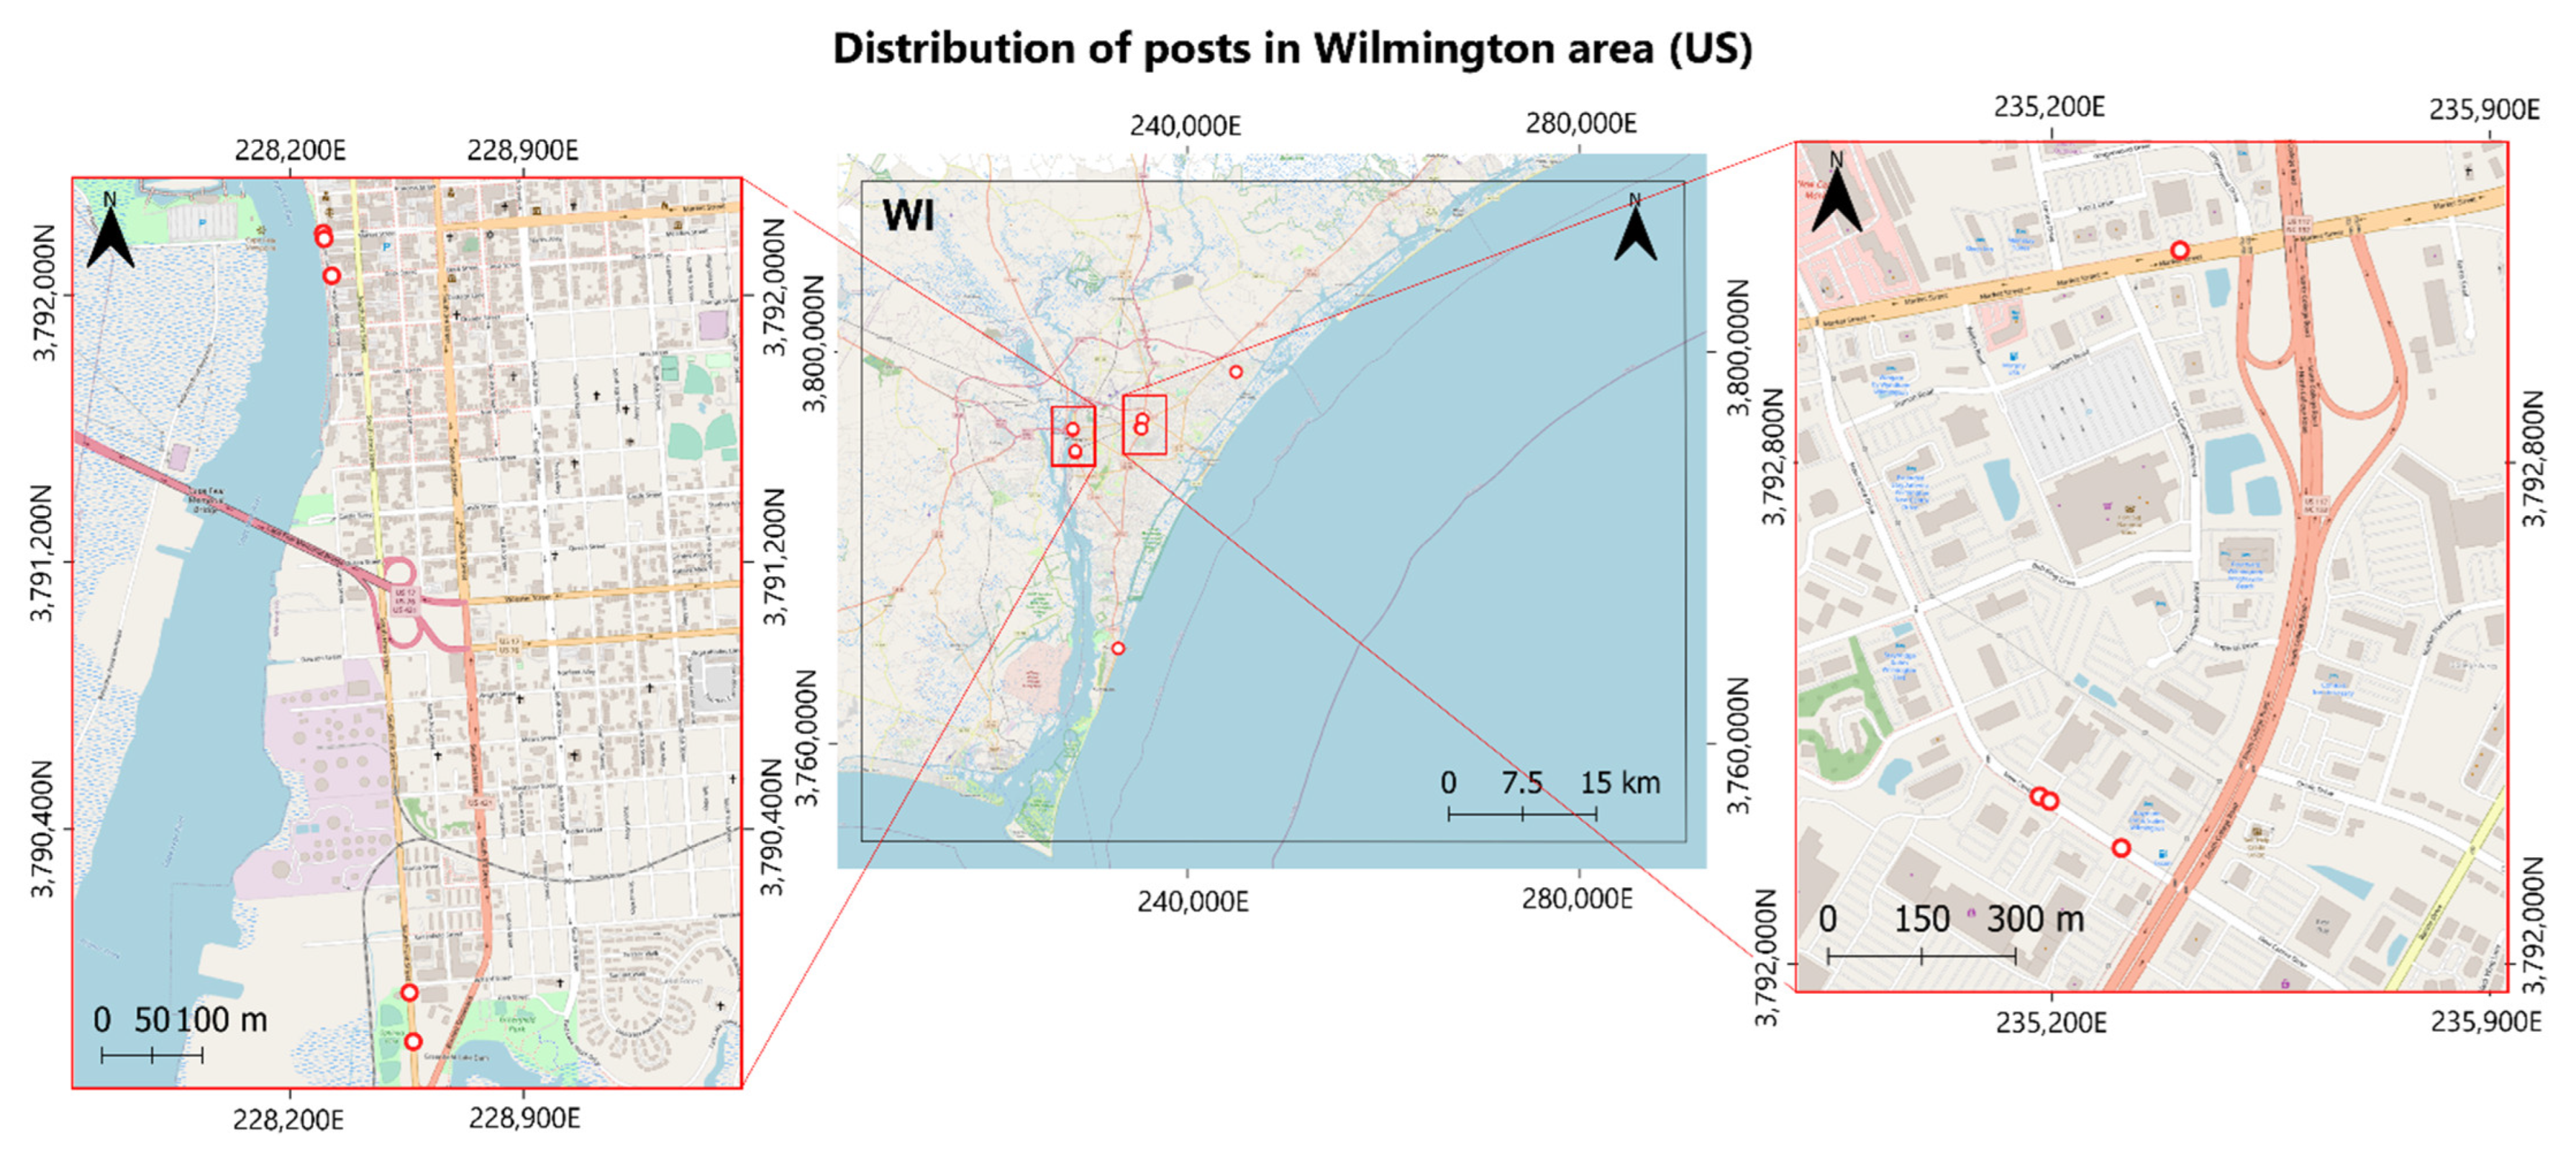
For the UK case study, the geo-localization was reconstructed for 513 of the initial 849 posts shared across the UK between 10 and 11 February 2014. However, only the posts shared within the two study areas and containing relevant photographs for flood detection with accurate geo-localization were considered, resulting in a total number of 13 Flickr posts. The spatial distribution of the posts used to build the training samples for the UK case study is reported in Figure 3. As explained in Section 2.2.2, the two study areas fall within the same (Landsat-7) satellite image; therefore, all posts were used to classify a single image. Similarly, for the US case study only a small number of posts could be employed. From the initial dataset of 5304 posts distributed across the US, only 695 georeferenced posts were labelled as relevant. Considering only the posts with reliable geo-localization shared within the study areas, a total number of 11 Tweets shared between 14 and 17 September 2018 were used for the area of Wilmington, and 13 frames—extracted from six YouTube videos shared between 18 and 20 September 2018—for the area of Lumberton. The spatial distribution of the relevant posts employed to create the training samples are represented in Figure 4 (Lumberton area) and Figure 5 (Wilmington area).
Despite the initial number of social media data being quite large, only a limited number of posts could be exploited for the reconstruction of the training samples, after filtering out posts not relevant or without good geo-location. This limitation might affect the quality of the obtained flood delineation maps. For this reason, in Section 3, the use of a dedicated application to acquire VGI is suggested.

2.2.2. Satellite Imagery

Satellite images were retrieved from the GloVis (Global Visualization Viewer) (https://glovis.usgs.gov/, accessed on 1 October 2022). Satellite missions and single acquisitions were selected by considering social media data availability and cloud cover percentage. Specifically, the acquisition date of satellite images should be as close as possible to that of social media posts. Moreover, cloud coverage should be as limited as possible (<10%). Given these restrictions, a single Landsat-7 image acquired on 16 February 2014 was used for Bridgwater and Worcester (UK). Two Sentinel-2 images acquired on 18 September 2019 were selected for Wilmington and Lumberton (US). The datasets used to produce flood delineation maps for each study area are summarized in Table 1.

2.2.3. Reference Flood Maps

Additional data were collected and used to check the quality of the final maps for each case study. A thorough accuracy assessment of crisis maps should be carried out with up-to-date data acquired on the field that can be considered a good approximation of the ground truth. Social media-sourced photographs could have also been used for the validation process. However, in this work the limited number of available relevant posts was solely used to train the classifier and produce the delineation maps.
For this reason, reference datasets had to be collected to perform what can be considered a consistency assessment of the obtained flood maps with respect to reference products. A remark is in order: using reference datasets for the result assessment does not strictly amount to an accuracy evaluation [31]. However, for the purposes of checking the flood maps obtained by the proposed procedure, the reference datasets can be considered a proxy of the ground truth, thereby allowing one to define accuracy measures from the confusion matrix.
To guarantee a proper quality assessment, the reference map should meet two conditions: (i) it should be as close as possible in time to the map being tested; (ii) it should also contain more detailed and, possibly, more accurate information about the flood extent. Given these conditions, reference maps obtained from radar satellite imagery were collected. The reference datasets are summarized in Table 2.
For the UK case studies, maps were extracted from the Historic Flood Map of the UK Environment Agency [32]. For the study areas of Bridgwater and Worcester, radar images refer to 16 and 11 February 2014, respectively.
For the US case studies, the map inter-comparison was performed only for the Lumberton study area, for reasons which will be explained in Section 2.4. In this case, the reference map was retrieved through the HASARD service of the European Space Agency (ESA) [33], which provides flood maps by applying a change detection algorithm on radar image pairs. For the case study, a pre-event radar image of 7 September 2018 and a post-event radar image of 19 September 2018 were selected. Accordingly, the reference map shows the flood extent of 19 September 2018.

2.3. Data Processing

With the datasets described in the previous Section, flood delineation maps were produced for each case study and study area. In the following sub-Sections, the methodology exploited to build the training samples, to process and classify the satellite images, and to assess the classification consistency with respect to the reference products will be presented. The workflow is summarized in Figure 6.

2.3.1. Reconstruction of the Training Samples

The reconstruction of the training samples was carried out by exploiting as VGI the posts retrieved from social media. The parameters needed to define a single ROI were deduced a posteriori, since the posts were not explicitly shared to be used for this application.
Specifically, the user position was ascertained from the post geographic coordinates; however it was further improved by identifying recognizable elements in the photographs (e.g., a church, a restaurant, a crossroad) and using Google Street View to retrieve the corresponding geo-location. The camera orientation was deduced using the same methodology. The minimum and maximum distance of the flooded area from the user were computed in QGIS with a visual interpretation of the satellite image. Finally, the camera lens technical parameters used to compute the view angle amplitude were only available within the EXIF file of the Flickr posts. For the Twitter and YouTube posts, the characteristics of an iPhone 6—namely 4.15 mm for the focal length and 4.8 mm × 3.6 mm for the sensor dimensions—were chosen to compute the view angle.
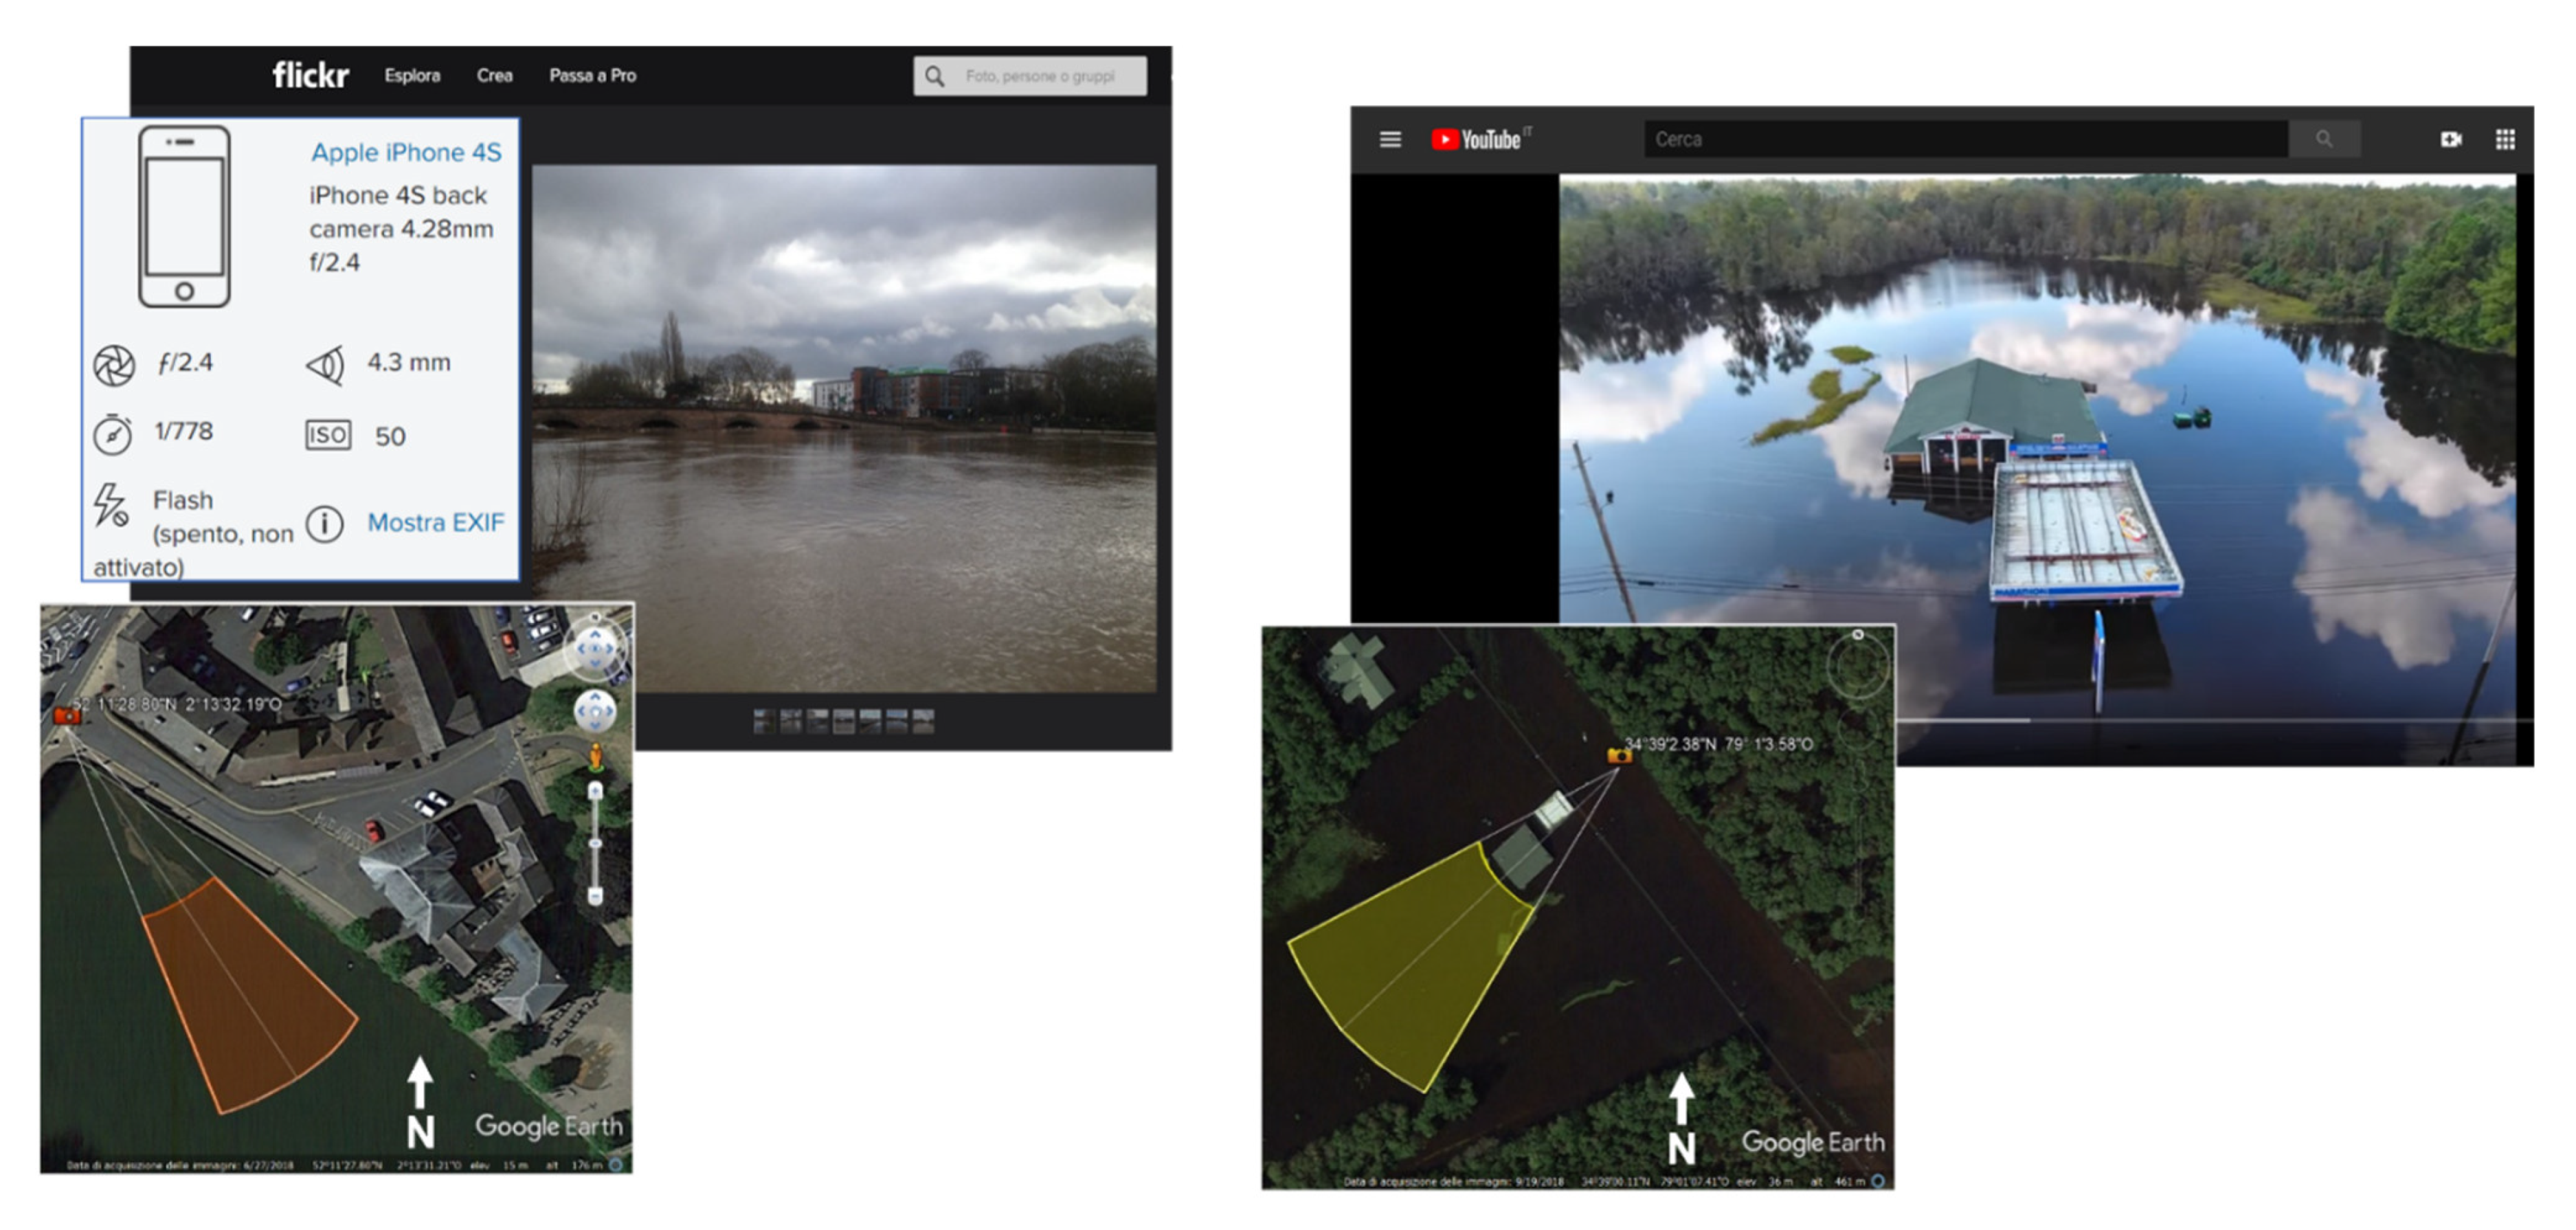
Two examples of ROIs constructed starting from relevant posts are shown in Figure 7. Posts are extracted from Flickr and YouTube and refer to the Worcester and Lumberton case studies, respectively.

2.3.2. Satellite Images Processing and Classification

In order to perform satellite image classification, a pre-processing stage needs to be carried out to convert band pixels to their real reflectance values. Specific processing for each satellite imagery was performed as described below.
Landsat-7: the Level 1GT product used in this study provides images with radiometric, geometric, and precision corrections. The Level-1 image is presented in Digital Numbers (DNs) units, which can be easily rescaled to Top of Atmosphere (ToA) reflectance. With an atmospheric correction algorithm, surface reflectance values can be derived. Such pre-processing was carried out through the Semi-Automatic Classification Plugin for QGIS [34]. A further correction was needed to fill data gaps in the Landsat-7 acquisition due to the scan line corrector failure that occurred in June 2003 [35]. For this purpose, the Geospatial Data Abstraction Library (GDAL) tool Fill nodata, available in QGIS, was exploited to fill missing values through the interpolation of neighbouring pixel values [36]. This manipulation might slightly affect the result reliability; however, no other optical and free image with the characteristics reported in Section 2.2.2 was available for this case study.
Sentinel-2: the Level 1C imagery used in this study is ortho-corrected and with pixel bands provided in ToA reflectance. The atmospheric correction needs to be performed to derive surface reflectance values. As for Landsat-7, pre-processing was performed in QGIS with the Semi-Automatic Classification Plugin.
With the pre-processed satellite images, the N D W I index was computed; it can be used to effectively distinguish water bodies from vegetation and urban areas. N D W I is defined as [37,38]:
N D W I = ρ G ρ N I R ρ G + ρ N I R ,
where ρ G and ρ N I R are the true reflectance values in the green and Near InfraRed (NIR) bands, respectively. Band 2 of Landsat-7 and band 3 of Sentinel-2 were used to compute ρ G , band 4 of Landsat-7 and band 8 of Sentinel-2 for ρ N I R .
A supervised, physically based classification was carried out using training areas defined and digitized in QGIS with the information provided by social media posts. The classifier adopted for this work was the Spectral Angle Mapper (SAM) algorithm, which classifies each pixel based on the angular distance of its spectral signature with respect to a reference spectral signature [39]. SAM was chosen for several reasons. Firstly, it is a fast and relatively robust algorithm. It is not sensitive to illumination differences due to topography effects and light conditions. Secondly, it can be easily exploited to perform single-class classifications as in the case of this work, provided that a proper threshold angular distance is defined. In this case, the best angular threshold was set case by case by recursively comparing the classification result with the NDWI map and based on a visual interpretation of the satellite image. SAM classification was carried out through the Semi-Automatic Plugin in QGIS.

2.3.3. Classification Post-Processing

A two-step post-processing was performed to obtain the final flood delineation maps: (i) a post-classification filtering was applied aiming at smoothing the noisy result provided by the classification algorithm; in particular, the classification sieve filter, available within the Semi-Automatic Classification Plugin, was chosen for removing isolated pixels; (ii) permanent water bodies in the areas of interest were removed from the classification result in order to single out the flooded areas.

2.3.4. Classification Quality Assessment

The quality assessment with respect to the reference products was carried out according to the procedure described in the following. A regular squared grid was generated across the region of interest and a random point location within each grid cell was selected. In order to best represent the “floodwater” class—which typically covers a limited portion of the study area (i.e., <10%)—in the quality assessment workflow, a finer nested grid was built in the areas with major floodwater coverage. The comparison between the resulting flood map and the reference map was performed for the pixels corresponding to the selected point locations. This sampling procedure guarantees systematic coverage of the whole study area as well as statistical validity to the analysis.
Common statistical measures were calculated from the confusion matrix, including Overall Accuracy (OA), User Accuracy (UA), and Producer Accuracy (PA).

2.4. Results

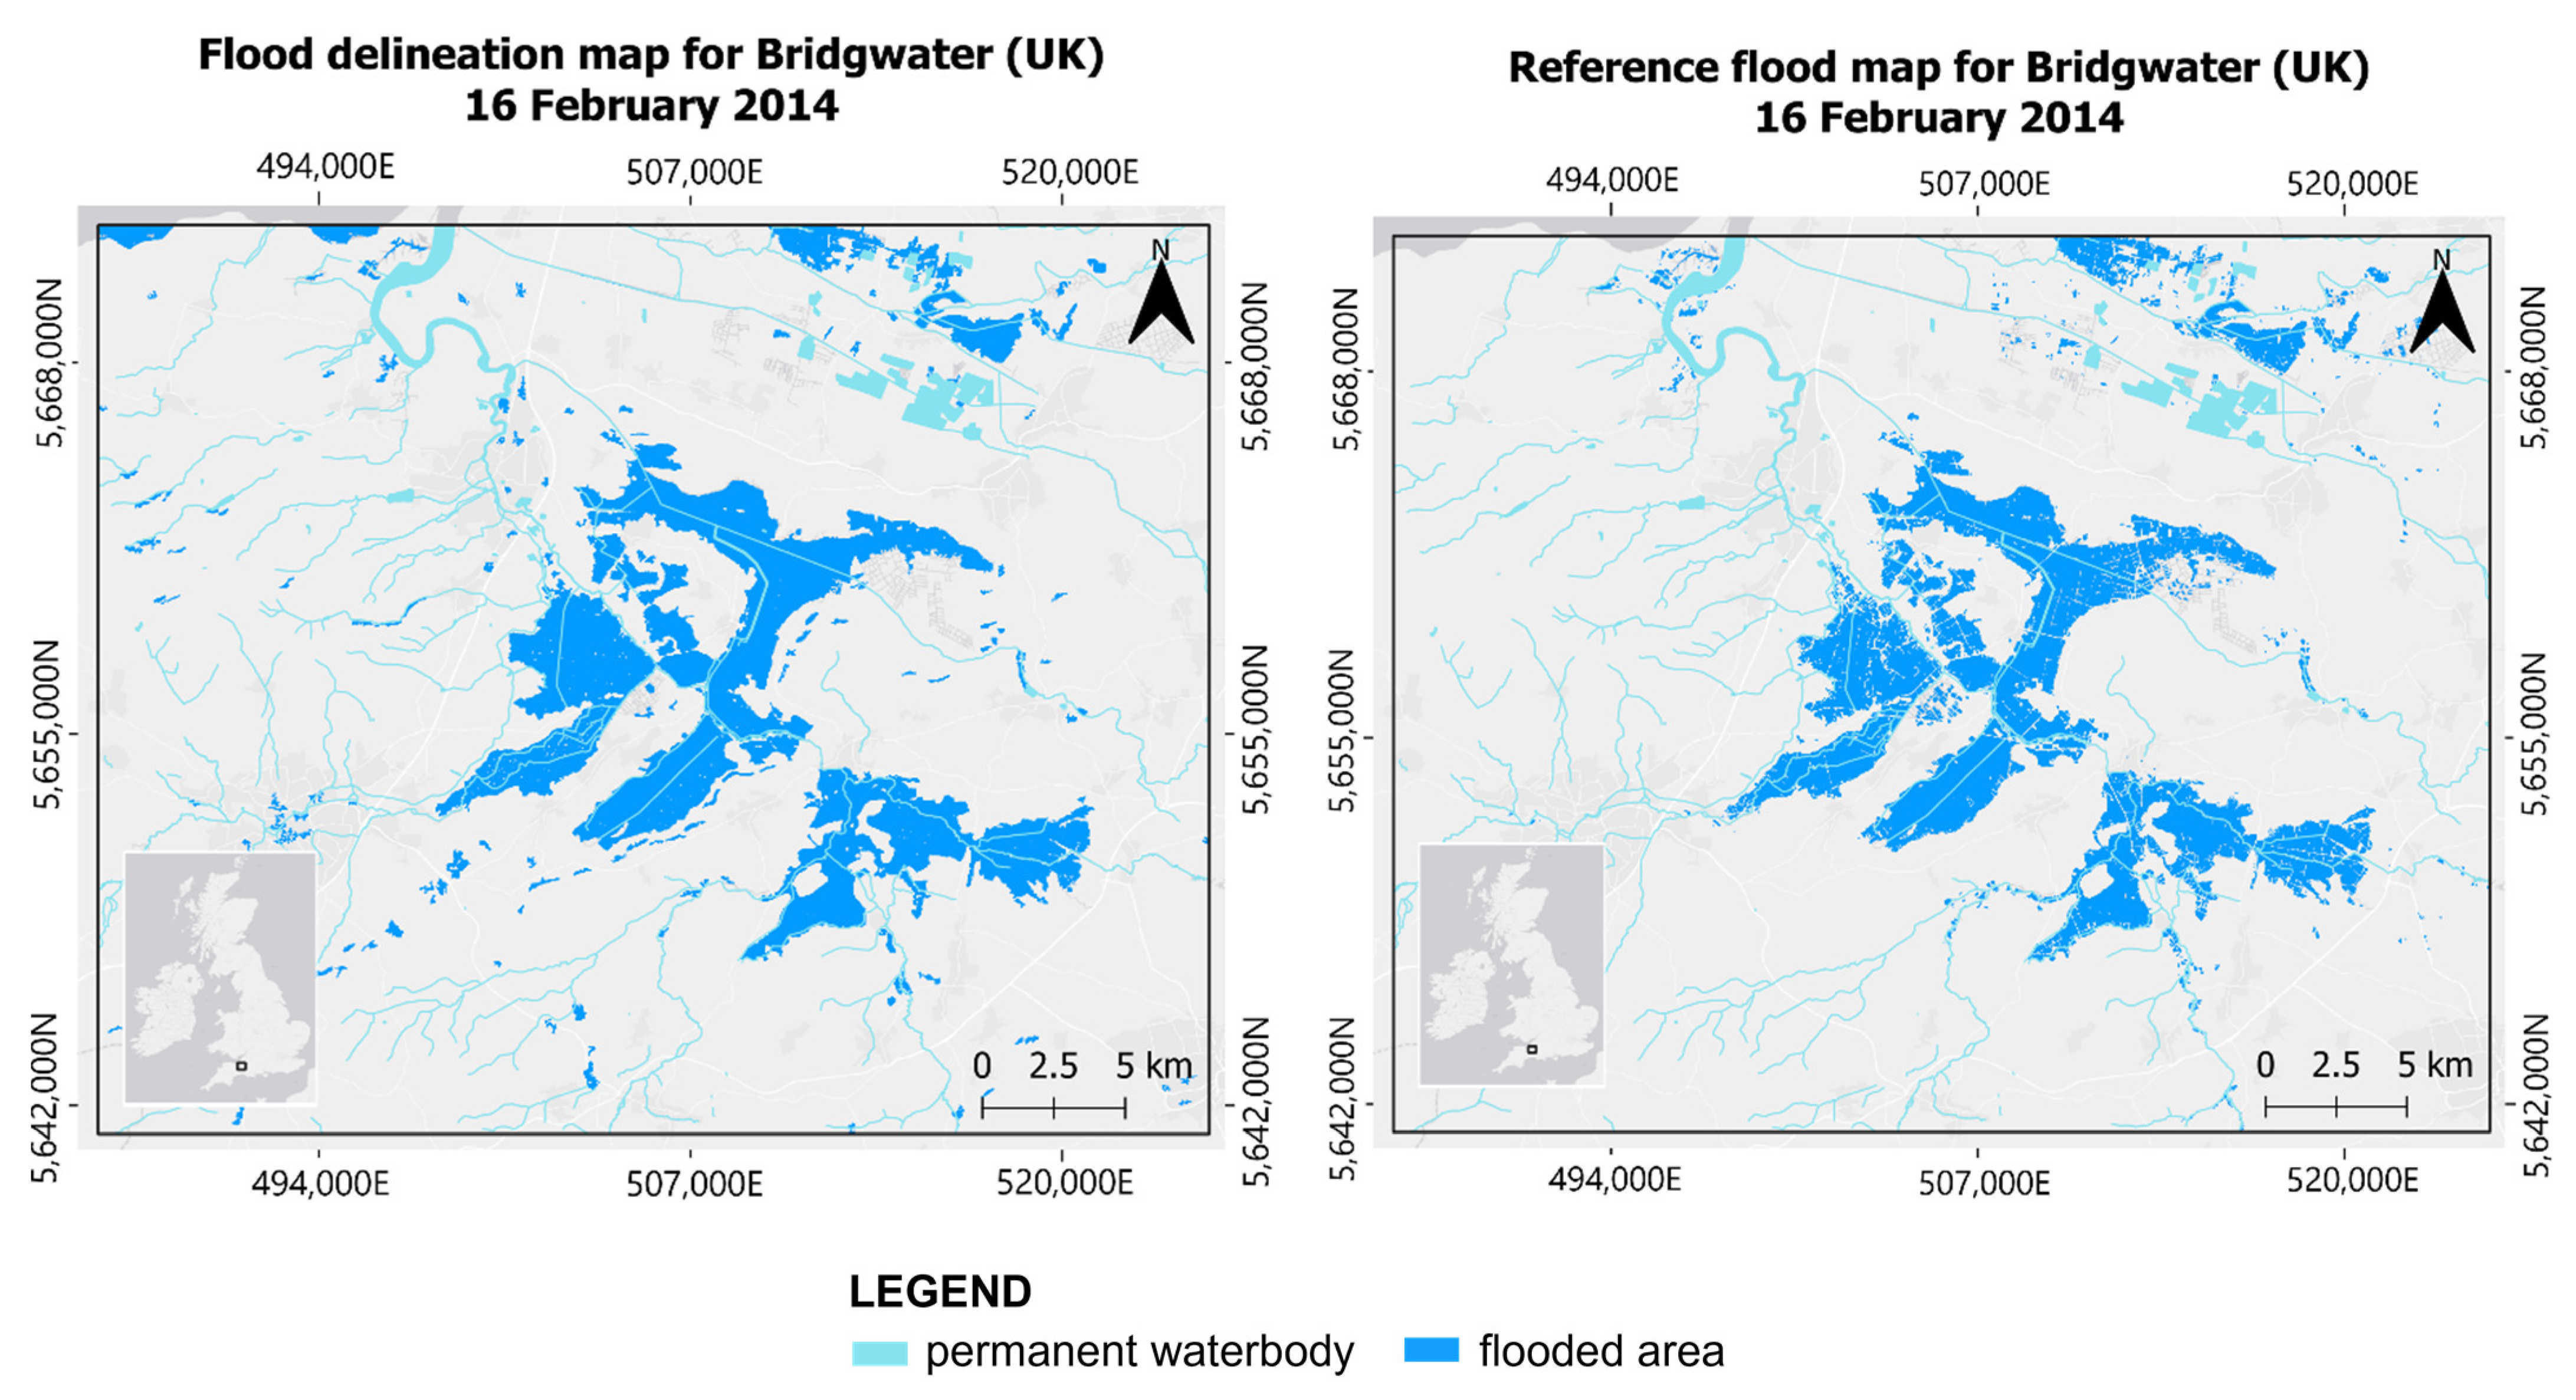
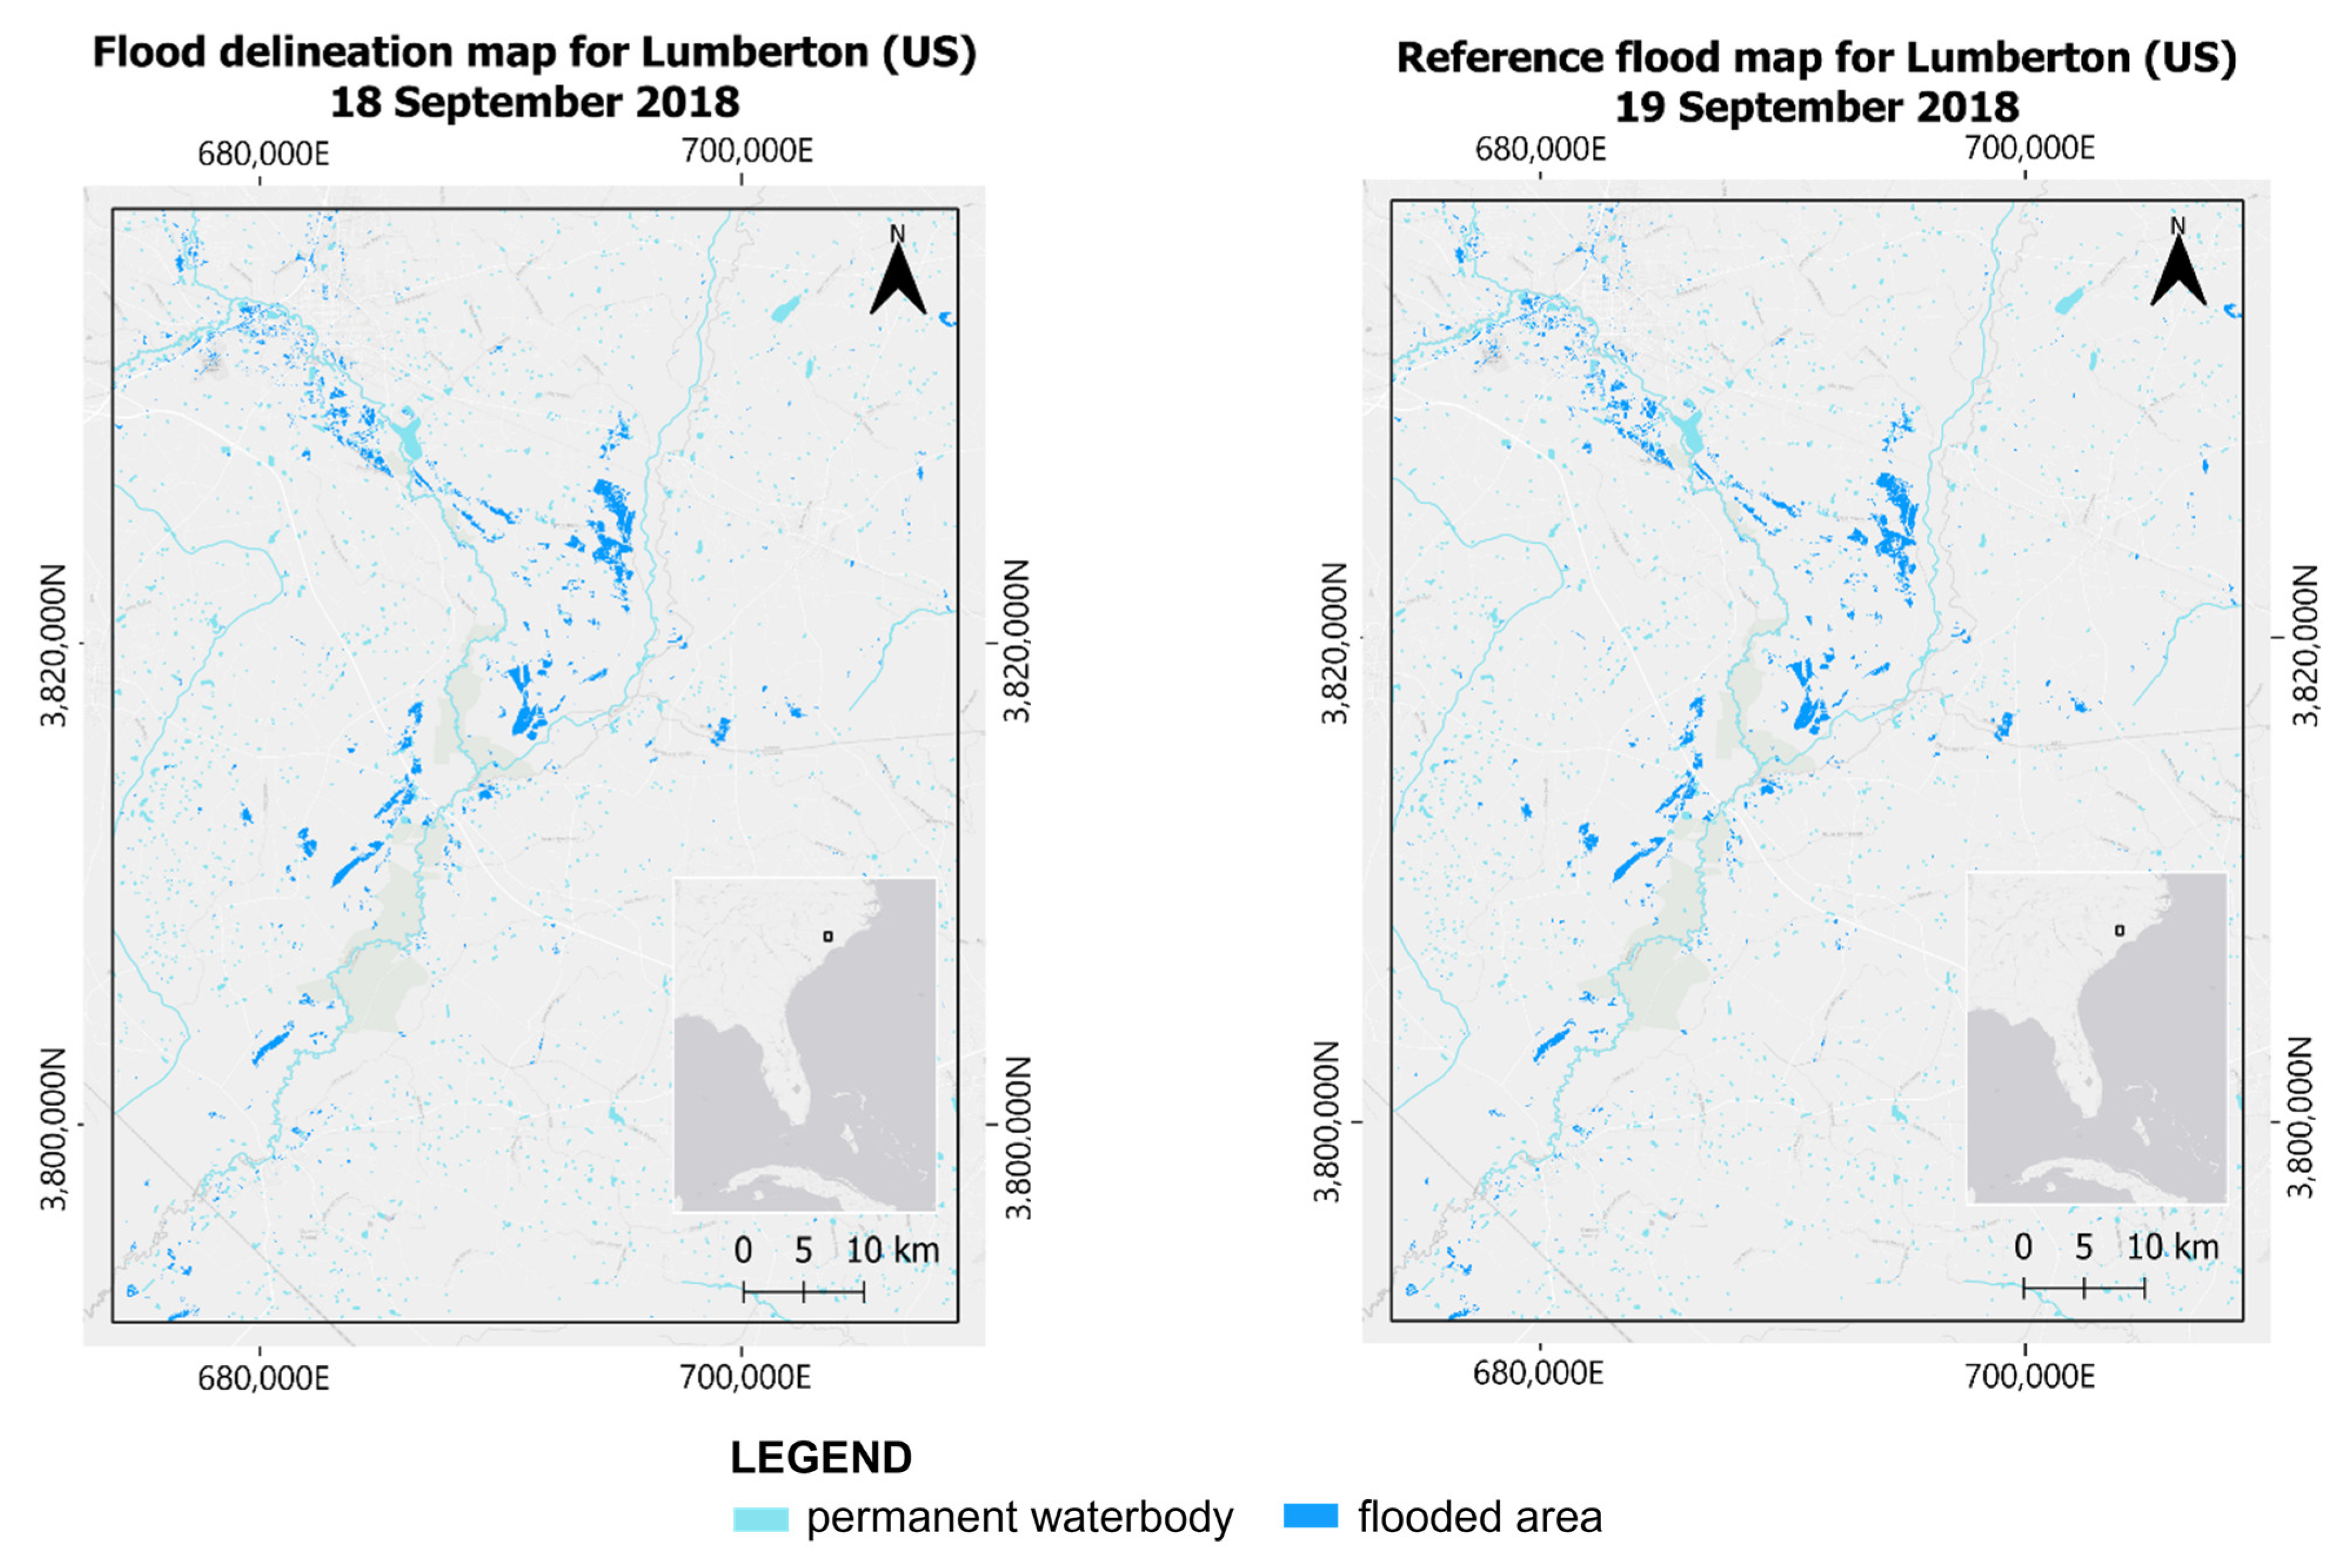
The obtained flood delineation maps and the reference flood maps for the UK case studies are shown in Figure 8 and Figure 9, while those obtained for the US case studies are reported in Figure 10 and Figure 11. Table 3 summarizes the OA for each flood map as well as the UA and PA for the two classes “flooded” and “non-flooded”.
Delineation maps for the areas of Bridgwater and Worcester were obtained from the classification of a single Landsat-7 image by setting an optimal value of 16° for the angular threshold of the SAM algorithm. Therefore, flood maps for the UK case study refer to the same date, namely 16 February 2014.
The best results in terms of consistency were achieved for the Bridgwater study area (see Figure 8). Specifically, OA resulted ~93%, and high values of UA and PA (i.e., higher than 93%) were obtained for both classes, with the exception of the class “flooded” UA which resulted ~83%. The good outcomes registered for this study area can be mostly attributed to the contemporaneity of the two satellite images used to compute the flood delineation map and the reference map. Moreover, the flooded area largely covers the countryside, which makes flood detection easier for the classification algorithm. The slightly lower values registered for the study area of Worcester (see Figure 9)—with an OA of 87%—can be attributed to two main reasons.
Firstly, the classification algorithm exhibited worse performance in distinguishing the urban area from floodwater; this may be due to the poor spectral separability of the two classes, which suggested the use of an ancillary built-up dataset to discard the misclassified pixels and improve classification consistency. Secondly, the reference map provided by the UK Environment Agency refers to 11 February 2014, i.e., five days before the date of acquisition of the Landsat-7 image. Despite these shortcomings, satisfactory consistency values were obtained (higher than 82% except for the “flooded” class UA which equals 71%). A possible improvement in the classification consistency might be achieved by exploiting a reference map contemporary to the resulting map; however, no such data were available. The maps used to evaluate the result consistency for the UK case studies can be considered a good reference, since they were obtained from the processing of SAR imagery along with ancillary datasets and accurate post-processing activities.
For the US case studies, a reliable flood delineation map was obtained only for the Lumberton study area (see Figure 10) by applying the SAM classification algorithm with an angular threshold of 15°. The high value of OA, which was ~93%, is primarily due to the very limited extension of the flooded areas across the area of interest (~1%), which resulted in very high performance for the “non-flooded” class despite the relatively low values of UA and PA for the “flooded” class (69% and 67%, respectively). However, the HASARD map considered as a reference was obtained by a fully automatic classification algorithm without any quality check and post-processing. Furthermore, the visual interpretation of the Sentinel-2 image pointed out a questionable performance of the HASARD change detection algorithm for this case study. This suggests the limited accuracy of the reference map to be the primary reason for the low values of the classification consistency.
For the Wilmington case study, flooding was mainly caused by the hurricane-induced extreme storm surge. The posts used to select the training samples were collected between 14 and 17 September 2018 while the Sentinel-2 image was acquired on 18 September 2018, i.e., when the storm surge-induced flooding was over. Accordingly, the selected training samples were not representative of the floodwater within the Sentinel-2 image and a misclassified delineation map was obtained. The obtained flood delineation map and the permanent waterbodies are represented in Figure 11. For these reasons, the quality check was not carried out for this study area.

3. Proposal of a Collaborative Collection of Training Samples with QField

The results described in the previous Section show that the use of social mediasourced VGI could be effective for the selection of training samples that are needed for satellite imagery classification. However, there are numerous limitations to consider that could compromise an effective application of such methodology for crisis mapping purposes. Among other limitations, it is worth mentioning that the use of data derived from social media requires a time- and resource-demanding pre-processing stage that can be incompatible with the timeliness requirements of crisis mapping. Pre-processing activities include data quality control, georeferencing, and recovery of missing geo-metadata. In addition, in recent years more and more obstacles have been placed on the use of these kinds of data in research projects [40]. For these reasons, the generation of customized in situ data for this type of study would provide several benefits. Currently, there are accessible tools, both commercial and free software, for capturing data in the field using custom forms. In this way, in many cases it will not be necessary to develop custom tools from scratch. In fact, some of the available mobile applications enable the user to capture different types of spatial data, to upload different base maps, and to work collaboratively, with or without an Internet connection. Applications such as Survey 123, Mapit Spatial, QField, MerginMaps, Open Data Kit (ODK), Locus GIS, and Geopaparazzi, among others, are specifically designed to be easily employed by users without a solid GIS knowledge or experience. These types of applications have already been exploited in, e.g., archaeological studies [41,42], management of heritage assets and infrastructure [43,44,45], cataloguing of agricultural spaces [46], and environmental issues [47,48]. Examples of their use in studies on natural risks, such as landslides [49,50], earthquakes [51] and floods [52,53], were presented in the literature as well.
Among the mentioned tools, those belonging to the same QGIS ecosystem (namely, QField and MerginMaps) are more convenient for the purposes of the present study, since QGIS is proposed as a software application dedicated to the semi-automatic processing and classification of satellite imagery. QField and MerginMaps offer similar features, yet have minor differences. Specifically, QField is in principle a more mature application (about 500,000 downloads in the Google Play market, compared to 50,000-plus for MerginMaps). On the other hand, MerginMaps already has a version for iOS devices, while the iOS version of QField is still under development. After carrying out a requirements analysis, QField [54] was considered adequate in this case since it encompasses the highest priority needs of the proposed methodology and is currently better known by the GIS user community.
Specifically, QField meets most of the project requirements, as listed below.
  • It allows offline data collection. Users may work in variable conditions and their contribution can be exploited even with poor Internet connection, which is often the case during emergency situations. In fact, it supports server data storage either through an open hosted service or installation on a cloud service (QField Cloud). In addition, the dedicated QFieldSync Plugin is designed to work on the same project on desktop (QGIS desktop) and on the field (QField application), allowing for an easy synchronization, access, and analysis of the collected data.
  • It is a Free and Open Source Software (FOSS), which enables users to carry out custom developments, if necessary. The community of developers provides an extensive documentation with clear, simple and free guidelines for users with different levels of GIS knowledge.
  • It can be executed on different mobile platforms. It currently works on Android, but the iOS version is being tested. Collaborators are not required to master all the tool capabilities; they simply need to install the application, register on the web platform, and access it to fill out a short web form.
  • It enables spatial data visualization. Users should be able to check via a map if the location service is working properly, and they can exploit the services to acquire the metadata needed for the satellite image processing.
  • It allows users to capture geographic features (points, lines, and polygons) associated with photographs. QField relies on the Open Camera app for this purpose, since this application enables the registration of all the available geographic metadata in the EXIF metadata of the photographs, including the address of the camera when taking the photograph, which is essential for the proposed methodology.
  • Finally, it allows users to work in a multi-user environment.
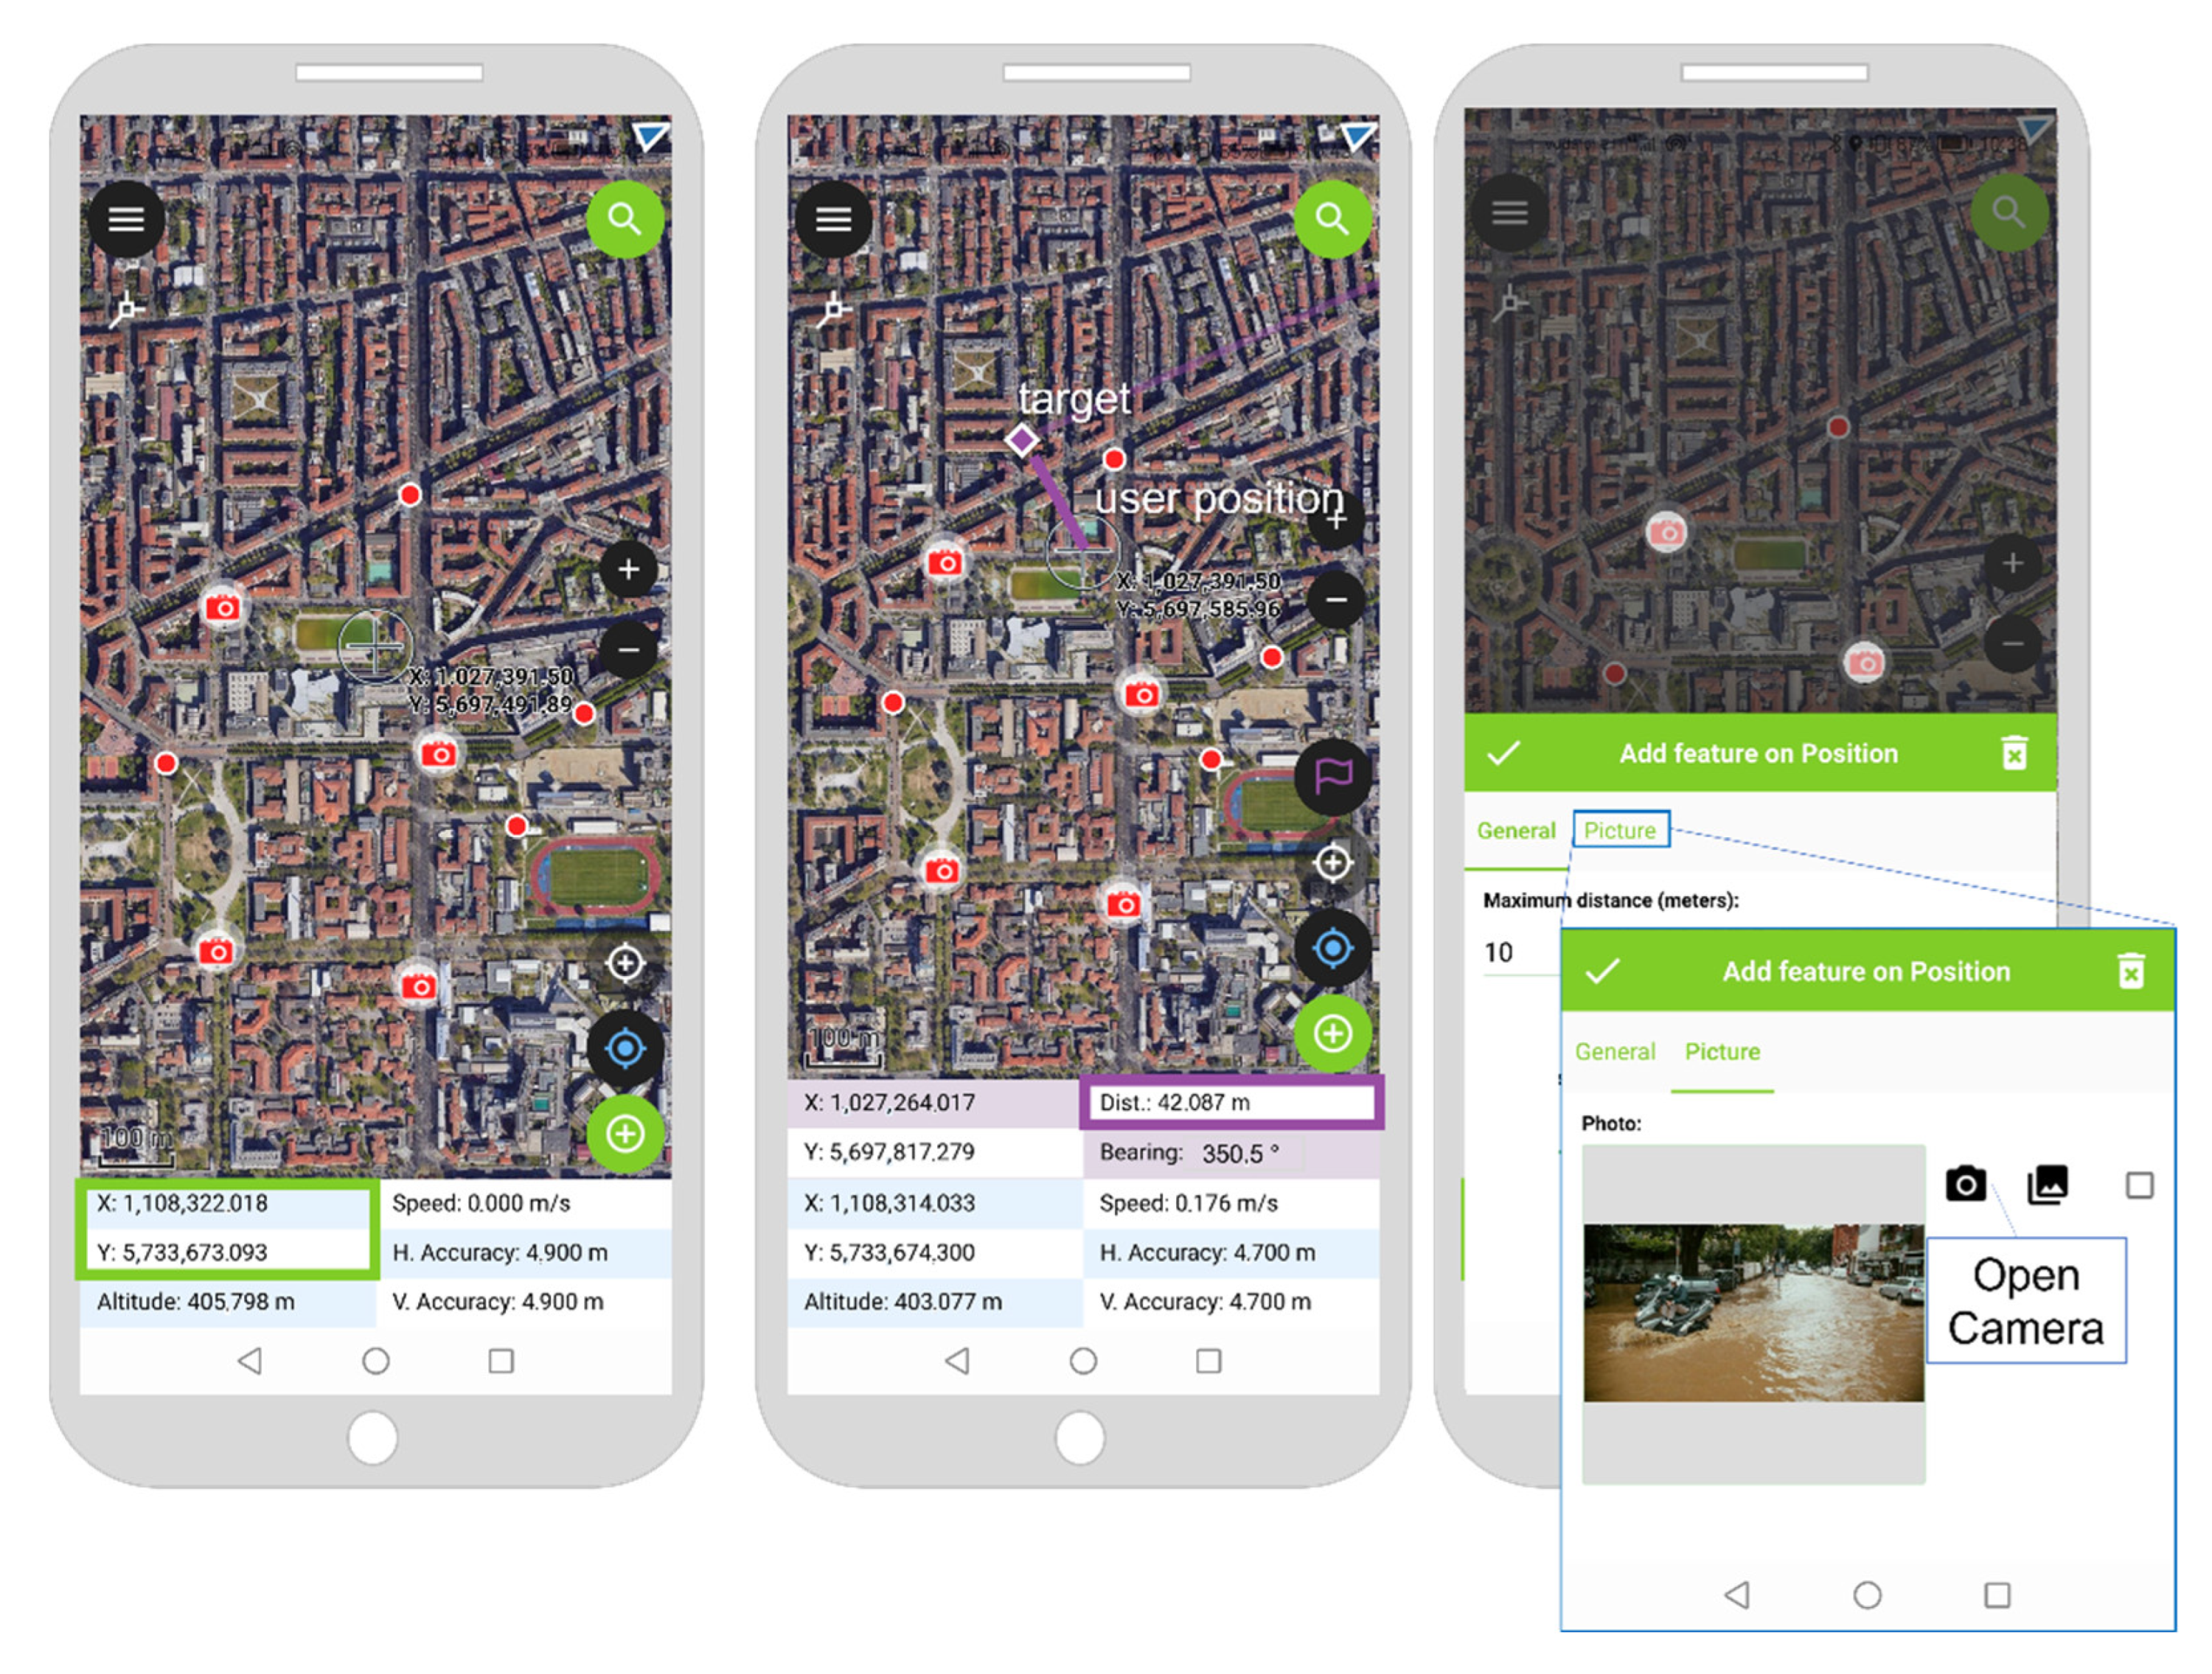
A prototype QGIS-QField project is shown in Figure 12 and Figure 13. To guarantee an easy implementation of the proposed workflow, the prototype project should have the following two components and characteristics. Firstly, a user-friendly satellite image as a background map. Secondly, a single GeoPackage point layer with a properly designed attribute table dedicated to data collection and storage. Field properties and constraints should be defined and set in the Attribute form, in order to avoid typos and the insertion of inconsistent values.
Specifically, the following fields should be included and properly defined in the layer Attribute form (see Figure 12):
  • fid (integer type), which is a unique value identifying a single user contribution;
  • date and time of acquisition (datetime type), which is a crucial piece of information whenever data are collected by several volunteers in different days and time hours;
  • photograph relative path (string type), which is automatically identified by the app as soon as the photograph is taken with OpenCamera;
  • maximum distance of the flooded area (real type), which must be entered by the user.
QField provides a simple measuring tool to support the operator in defining the maximum distance of the flooding, once he has recognised his position on the flooding extent on the basemap. The distance value is displayed onto the interface (see Figure 13); accordingly, the user is supposed to insert that value in the attribute table.
Furthermore, pictures are supposed to be taken exploiting the Open Camera application—as recommended in the QField documentation—while the geo-localization service must be enabled. In fact, despite the possibility to use the default camera app, Open Camera provides several geo-metadata—including user position and compass direction—which are directly stored in the photograph EXIF header.

4. Discussion and Conclusions

In this paper, a procedure integrating VGI and optical satellite imagery for the production of flood crisis maps was presented. The proposed workflow relies on the application of a supervised classification algorithm applied to multispectral imagery, exploiting VGI as a valuable in situ data source for the selection of suitable floodwater training samples. VGI data are meant to be collected through a collaborative crowdsourcing activity by volunteers equipped with a dedicated mobile application. Specifically, the information needed to define the geometry of a single floodwater training sample consists of a photograph and a set of metadata including the user position, the camera orientation, some technical parameters of the specific camera lens, and the minimum and maximum distance of the operator from the flooding. The distance values must be specified by the user, while all other parameters may be automatically retrieved by exploiting the functionalities of the mobile device where the application is installed. The classified image is then post-processed with ancillary datasets according to a standard and well-defined workflow in order to obtain the final flood delineation map.
Owing to the impossibility of setting up and carrying out a collaborative crowdsourcing activity within a real flood event in the frame of the present work, the proposed procedure was tested using a particular type of VGI, namely photographs and video frames that were spontaneously shared on Flickr, Twitter, and YouTube during two past flood events (namely the 2014 UK flood event and the 2018 Hurricane Florence-induced US flood event). The parameters needed to select training samples were reconstructed a posteriori, by means of support tools such as Google Street View and based on the photograph content visual interpretation. Results in terms of delineation map quality assessment based on reference products point out a good performance of the procedure in the detection of the floodwater extent. However, the use of pictures spontaneously posted on social media required a relevant pre-processing filtering phase, which was very time-consuming and largely reduced the amount of usable information; this process can be incompatible with the timeliness requirements of crisis mapping.
On the other hand, the proposed use of a dedicated application, and the involvement of operators who purposely collect data for crisis mapping, with clear guidelines, can significantly reduce the pre-processing phase. For this reason, the use of the well-known QField mobile application for the collection of training samples was investigated. QField turned out to be a valuable tool, thanks to the possibility to customize the attributes to be acquired, and to share the project in the Cloud and with QGIS desktop application. In this work, the QField application has been considered at prototype level, without intervening in the source code. A valuable improvement of the procedure will be represented by a further customization, improving its user friendliness and contributing to guiding and reducing the user intervention—for example, implementing the automatic entry of the values of the maximum distance.
Regarding the practical implementation of the proposed data collection for emergency mapping support, it will be relevant to plan how to involve possible contributors, who could be present in the area of interest as residents or as emergency responders, obviously warning them that for no reasons related to the data collection they must put themselves in danger or interfere with the emergency response operations.
The proposed methodology foresees the use of optical satellite imagery in order to perform image classification with the VGI collected data with a semi-automated approach. It is relevant to underline that the building of the training sample is not the only application of the acquired VGI data. With the same technique they can be used to build test samples for crisis map validation. Provided that the number of collected data is large enough, they could be split into two subsets to be used either for training or for testing the delineation map production. In case of unavailability of optical images, VGI data can be used to support the photointerpretation and thresholding phase of the SAR image processing or they can be used as test data for the flood delineation map.

Author Contributions

Conceptualization, Daniela Carrion, Alberto Vavassori, Benito Zaragozi and Federica Migliaccio; methodology, Alberto Vavassori, Daniela Carrion, Benito Zaragozi and Federica Migliaccio; investigation, Alberto Vavassori and Benito Zaragozi; writing—original draft preparation, Alberto Vavassori and Benito Zaragozi; writing—review & editing, Daniela Carrion and Federica Migliaccio; visualization, Alberto Vavassori and Benito Zaragozi; supervision, Daniela Carrion and Federica Migliaccio; validation, Daniela Carrion. All authors have read and agreed to the published version of the manuscript.

Funding

This research received no external funding.

Data Availability Statement

No new data were created or analyzed in this study. Data sharing is not applicable to this article.

Acknowledgments

The authors would like to thank Barbara Pernici (DEIB, Politecnico di Milano and E2mC project) for providing the social media data and Katarina Spasenovic, PhD candidate (DICA, Politecnico di Milano), for contributing to the pre-processing of the social media data.

Conflicts of Interest

The authors declare no conflict of interest.

References

  1. CRED. 2021 Disasters in Numbers. Available online: https://cred.be/sites/default/files/2021_EMDAT_report.pdf (accessed on 19 September 2022).
  2. Ajmar, A.; Boccardo, P.; Disabato, F.; Tonolo, F.G. Rapid Mapping: Geomatics role and research opportunities. Rend. Fis. Acc. Lincei 2015, 26 (Suppl. S1), 63–73. [Google Scholar] [CrossRef] [Green Version]
  3. International Working Group on Satellite-Based Emergency Mapping. Emergency Mapping Guidelines—December 2015 Version. Available online: https://www.un-spider.org/sites/default/files/IWG_SEM_EmergencyMappingGuidelines_v1_Final.pdf (accessed on 26 September 2022).
  4. Copernicus Emergency Management Service. Available online: https://emergency.copernicus.eu/ (accessed on 26 September 2022).
  5. Copernicus Rapid Mapping Products Portfolio. Available online: https://emergency.copernicus.eu/mapping/ems/rapid-mapping-portfolio (accessed on 26 September 2022).
  6. Boccardo, P.; Giulio Tonolo, F. Remote Sensing Role in Emergency Mapping for Disaster Response. In Engineering Geology for Society and Territory; Lollino, G., Manconi, A., Guzzetti, F., Culshaw, M., Bobrowsky, P., Luino, F., Eds.; Springer: Cham, Switzerland, 2015; Volume 5, pp. 17–24. [Google Scholar] [CrossRef]
  7. Ajmar, A.; Boccardo, P.; Broglia, M.; Kucera, J.; Tonolo, F.G.; Wania, A. Response to Flood Events: The Role of Satellite-based Emergency Mapping and the Experience of the Copernicus Emergency Management Service. In Flood Damage Survey and Assessment: New Insights from Research and Practice; Molinari, D., Menoni, S., Ballio, F., Eds.; John Wiley & Sons, Inc.: Hoboken, NJ, USA, 2017; pp. 211–228. [Google Scholar]
  8. Schumann, G.J.; Moller, D.K. Microwave remote sensing of flood inundation. Phys. Chem. Earth 2015, 83–84, 84–95. [Google Scholar] [CrossRef]
  9. Hervé, Y.; Nadine, T.; Jean-François, C.; Stephen, C. Benefit of Multisource Remote Sensing for Flood Monitoring: Actual Status and Perspectives. In Proceedings of the 2021 IEEE International Geoscience and Remote Sensing Symposium IGARSS, Brussels, Belgium, 11 July 2021. [Google Scholar] [CrossRef]
  10. Chaouch, N.; Temimi, M.; Hagen, S.; Weishampel, J.; Medeiros, S.; Khanbilvardi, R. A synergetic use of satellite imagery from SAR and optical sensors to improve coastal flood mapping in the Gulf of Mexico. Hydrol. Process. 2012, 26, 1617–1628. [Google Scholar] [CrossRef] [Green Version]
  11. Chowdary, V.M.; Vinu Chandran, R.; Neeti, N.; Bothale, R.V.; Srivastava, Y.K.; Ingle, P.; Ramakrishnan, D.; Dutta, D.; Jeyaram, A.; Sharma, J.R.; et al. Assessment of surface and sub-surface waterlogged areas in irrigation command areas of Bihar state using remote sensing and GIS. Agric. Water Manag. 2008, 95, 754–766. [Google Scholar] [CrossRef]
  12. Memon, A.A.; Muhammad, S.; Rahman, S.; Haq, M. Flood monitoring and damage assessment using water indices: A case study of Pakistan flood-2012. Egypt. J. Remote Sens. Space Sci. 2015, 18, 99–106. [Google Scholar] [CrossRef] [Green Version]
  13. Haworth, B.; Bruce, E. A Review of Volunteered Geographic Information for Disaster Management: A Review of VGI for Disaster Management. Geogr. Compass 2015, 9, 237–250. [Google Scholar] [CrossRef]
  14. Poser, K.; Dransch, D. Volunteered Geographic Information for Disaster Management with Application to Rapid Flood Damage Estimation. Geomatica 2010, 64, 89–98. [Google Scholar] [CrossRef]
  15. Schnebele, E.; Cervone, G. Improving remote sensing flood assessment using volunteered geographical data. Nat. Hazards Earth Syst. Sci. 2013, 13, 669–677. [Google Scholar] [CrossRef]
  16. McDougall, K.; Temple-Watts, P. The use of LiDAR and Volunteered Geographic Information to map flood extents and inundation. ISPRS Ann. Photogramm. Remote Sens. Spat. Inf. Sci. 2012, I-4, 251–256. [Google Scholar] [CrossRef] [Green Version]
  17. Fohringer, J.; Dransch, D.; Kreibich, H.; Schröter, K. Social media as an information source for rapid flood inundation mapping. Nat. Hazards Earth Syst. Sci. 2015, 15, 2725–2738. [Google Scholar] [CrossRef] [Green Version]
  18. Li, Z.; Wang, C.; Emrich, C.T.; Guo, D. A novel approach to leveraging social media for rapid flood mapping: A case study of the 2015 South Carolina floods. Cartogr. Geogr. Inf. Sci. 2018, 45, 97–110. [Google Scholar] [CrossRef]
  19. Rosser, J.F.; Leibovici, D.G.; Jackson, M.J. Rapid flood inundation mapping using social media, remote sensing and topographic data. Nat. Hazards 2017, 87, 103–120. [Google Scholar] [CrossRef] [Green Version]
  20. Feng, Y.; Brenner, C.; Sester, M. Flood severity mapping from Volunteered Geographic Information by interpreting water level from images containing people: A case study of Hurricane Harvey. ISPRS J. Photogramm. Remote Sens. 2020, 169, 301–319. [Google Scholar] [CrossRef]
  21. Bruneau, P.; Brangbour, E.; Marchand-Maillet, S.; Hostache, R.; Chini, M.; Pelich, R.-M.; Matgen, P.; Tamisier, T. Measuring the Impact of Natural Hazards with Citizen Science: The Case of Flooded Area Estimation Using Twitter. Remote Sens. 2021, 13, 1153. [Google Scholar] [CrossRef]
  22. Kharazi, B.A.; Behzadan, A.H. Flood depth mapping in street photos with image processing and deep neural networks. Comput. Environ. Urban Syst. 2021, 88, 101628. [Google Scholar] [CrossRef]
  23. Sadiq, R.; Akhtar, Z.; Imran, M.; Ofli, F. Integrating remote sensing and social sensing for flood mapping. Remote Sens. Appl. Soc. Environ. 2022, 25, 100697. [Google Scholar] [CrossRef]
  24. Thorne, C. Geographies of UK flooding in 2013/4. Geogr. J. 2014, 180, 297–309. [Google Scholar] [CrossRef]
  25. Saffir, H.S. Hurricane Wind and Storm Surge. Mil. Eng. 1973, 423, 4–5. [Google Scholar]
  26. Simpson, R.H. The Hurricane Disaster Potential Scale. Weatherwise 1974, 27, 169–186. [Google Scholar]
  27. Hurricane Florence (AL062018) 31 August–17 September 2018. National Hurricane Center, Tropical Cyclone Report. Available online: https://www.nhc.noaa.gov/data/tcr/AL062018_Florence.pdf (accessed on 3 September 2022).
  28. Havas, C.; Resch, B.; Francalanci, C.; Pernici, B.; Scalia, G.; Fernandez-Marquez, J.L.; Van Achte, T.; Zeug, G.; Mondardini, M.R.; Grandoni, D.; et al. E2mC: Improving Emergency Management Service Practice through Social Media and Crowdsourcing Analysis in Near Real Time. Sensors 2017, 17, 2766. [Google Scholar] [CrossRef]
  29. Pernici, B.; Francalanci, C.; Scalia, G.; Corsi, M.; Grandoni, D.; Biscardi, M.A. Geolocating social media posts for emergency mapping. In Proceedings of the Social Web in Emergency and Disaster Management, Los Angeles, CA, USA, 9 February 2018. [Google Scholar]
  30. Barozzi, S.; Fernandez Marquez, J.L.; Shankar, A.R.; Pernici, B. Filtering images extracted from social media in the response phase of emergency events. In Proceedings of the 16th ISCRAM Conference, Valencia, Spain, 19–22 May 2019. [Google Scholar]
  31. European Commission-Joint Research Centre-Institute for the Protection and the Security of the Citizen. Validation Protocol for Emergency Response Geo-Information Products. Available online: https://data.europa.eu/doi/10.2788/63690 (accessed on 27 September 2022).
  32. UK Environment Agency. Historic Flood Map. Available online: https://www.data.gov.uk/dataset/76292bec-7d8b-43e8-9c98-02734fd89c81/historic-flood-map (accessed on 7 September 2022).
  33. European Space Agency. HASARD Service Specification. Available online: https://docs.charter.uat.esaportal.eu/services/hasard/service-specs/ (accessed on 7 September 2022).
  34. Congedo, L. Semi-Automatic Classification Plugin Documentation. Available online: https://semiautomaticclassificationmanual.readthedocs.io/en/latest/ (accessed on 5 September 2022).
  35. United States Geological Survey. Landsat Missions. Available online: https://www.usgs.gov/landsat-missions/landsat-7 (accessed on 6 September 2022).
  36. QGIS Documentation. GDAL Fill Nodata. Available online: https://docs.qgis.org/3.16/en/docs/user_manual/processing_algs/gdal/rasteranalysis.html#gdalfillnodata (accessed on 6 September 2022).
  37. McFeeters, S.K. The use of the normalized difference water index (NDWI) in the delineation of open water features. Int. J. Remote Sens. 1996, 17, 1425–1432. [Google Scholar] [CrossRef]
  38. Singh, S.; Dhasmana, M.K.; Shrivastava, V.; Sharma, V.; Pokhriyal, N.; Thakur, P.K.; Aggarwal, S.P.; Nikam, B.R.; Garg, V.; Chouksey, A.; et al. Estimation of revised capacity in Gobind Sagar reservoir using Google earth engine and GIS. Int. Arch. Photogramm. Remote Sens. Spat. Inf. Sci. 2018, 42, 20–23. [Google Scholar] [CrossRef] [Green Version]
  39. Bijeesh, T.V.; Narasimhamurthy, K.N. Surface water detection and delineation using remote sensing images: A review of methods and algorithms. Sustain. Water Resour. Manag. 2020, 6, 68. [Google Scholar] [CrossRef]
  40. Tromble, R. Where Have All the Data Gone? A Critical Reflection on Academic Digital Research in the Post-API Age. Soc. Media Soc. 2021, 7, 2056305121988929. [Google Scholar] [CrossRef]
  41. Fábrega-Álvarez, P.; Lynch, J. Archaeological Survey Supported by Mobile GIS: Low-Budget Strategies at the Hualfín Valley (Catamarca, Argentina). Adv. Archaeol. Pract. 2022, 10, 215–226. [Google Scholar] [CrossRef]
  42. Montagnetti, R.; Guarino, G. From Qgis to Qfield and Vice Versa: How the New Android Application Is Facilitating the Work of the Archaeologist in the Field. Environ. Sci. Proc. 2021, 10, 6. [Google Scholar] [CrossRef]
  43. Bruno, S.; Vita, L.; Loprencipe, G. Development of a GIS-Based Methodology for the Management of Stone Pavements Using Low-Cost Sensors. Sensors 2022, 22, 6560. [Google Scholar] [CrossRef]
  44. Spataru, M.; Vlasenco, A.; Nistor-Lopatenco, L.; Grama, V. Updating the statistical register of housing in the Republic of Moldova using Open-Source GIS technologies. J. Eng. Sci. 2022, 29, 123–132. [Google Scholar] [CrossRef]
  45. Tikhonova, O.; Romão, X.; Salazar, G. The use of GIS tools for data collection and processing in the context of fire risk assessment in urban cultural heritage. In Proceedings of the International Conference of Young Professionals <<GeoTerrace-2021>>, Lviv, Ukraine, 4–6 October 2021. [Google Scholar] [CrossRef]
  46. Duncan, J.; Davies, K.P.; Saipai, A.; Vainikolo, L.; Wales, N.; Varea, R.; Bruce, E.; Boruff, B. An Open-Source Mobile Geospatial Platform for Agricultural Landscape Mapping: A Case Study of Wall-To Farm Systems Mapping in Tonga. Int. Arch. Photogramm. Remote Sens. Spat. Inf. Sci. 2022, XLVIII-4/W1-2022, 119–126. [Google Scholar] [CrossRef]
  47. Nowak, M.M.; Dziób, K.; Ludwisiak, Ł.; Chmiel, J. Mobile GIS applications for environmental field surveys: A state of the art. Glob. Ecol. Conserv. 2020, 23, e01089. [Google Scholar] [CrossRef]
  48. Schattschneider, J.L.; Daudt, N.W.; Mattos, M.P.S.; Bonetti, J.; Rangel-Buitrago, N. An open-source geospatial framework for beach litter monitoring. Environ. Monit. Assess 2020, 192, 648. [Google Scholar] [CrossRef] [PubMed]
  49. Chudý, F.; Slámová, M.; Tomaštík, J.; Tunák, D.; Kardoš, M.; Saloň, Š. The application of civic technologies in a field survey of landslides. Land Degrad. Dev. 2018, 29, 1858–1870. [Google Scholar] [CrossRef] [Green Version]
  50. Liu, Y.; Zhang, M. An IoT-Based Intelligent Geological Disaster Application Using Open-Source Software Framework. Sci. Program 2022, 2022, e9285258. [Google Scholar] [CrossRef]
  51. Piccinini, F.; Gorreja, A.; Di Stefano, F.; Pierdicca, R.; Sanchez Aparicio, L.J.; Malinverni, E.S. Preservation of Villages in Central Italy: Geomatic Techniques’ Integration and GIS Strategies for the Post-Earthquake Assessment. ISPRS Int. J. Geo-Inf. 2022, 11, 291. [Google Scholar] [CrossRef]
  52. Mandarino, A.; Luino, F.; Faccini, F. Flood-induced ground effects and flood-water dynamics for hydro-geomorphic hazard as-sessment: The 21–22 October 2019 extreme flood along the lower Orba River (Alessandria, NW Italy). J. Maps 2021, 17, 136–151. [Google Scholar] [CrossRef]
  53. Paulik, R.; Crowley, K.; Williams, S. Post-event Flood Damage Surveys: A New Zealand Experience and Implications for Flood Risk Analysis. In Proceedings of the FLOODrisk 2020-4th European Conference on Flood Risk Management, online, Budapest, Hungary, 22–24 June 2021. [Google Scholar]
  54. QField. OPENGIS.ch. Available online: https://qfield.org (accessed on 9 September 2022).
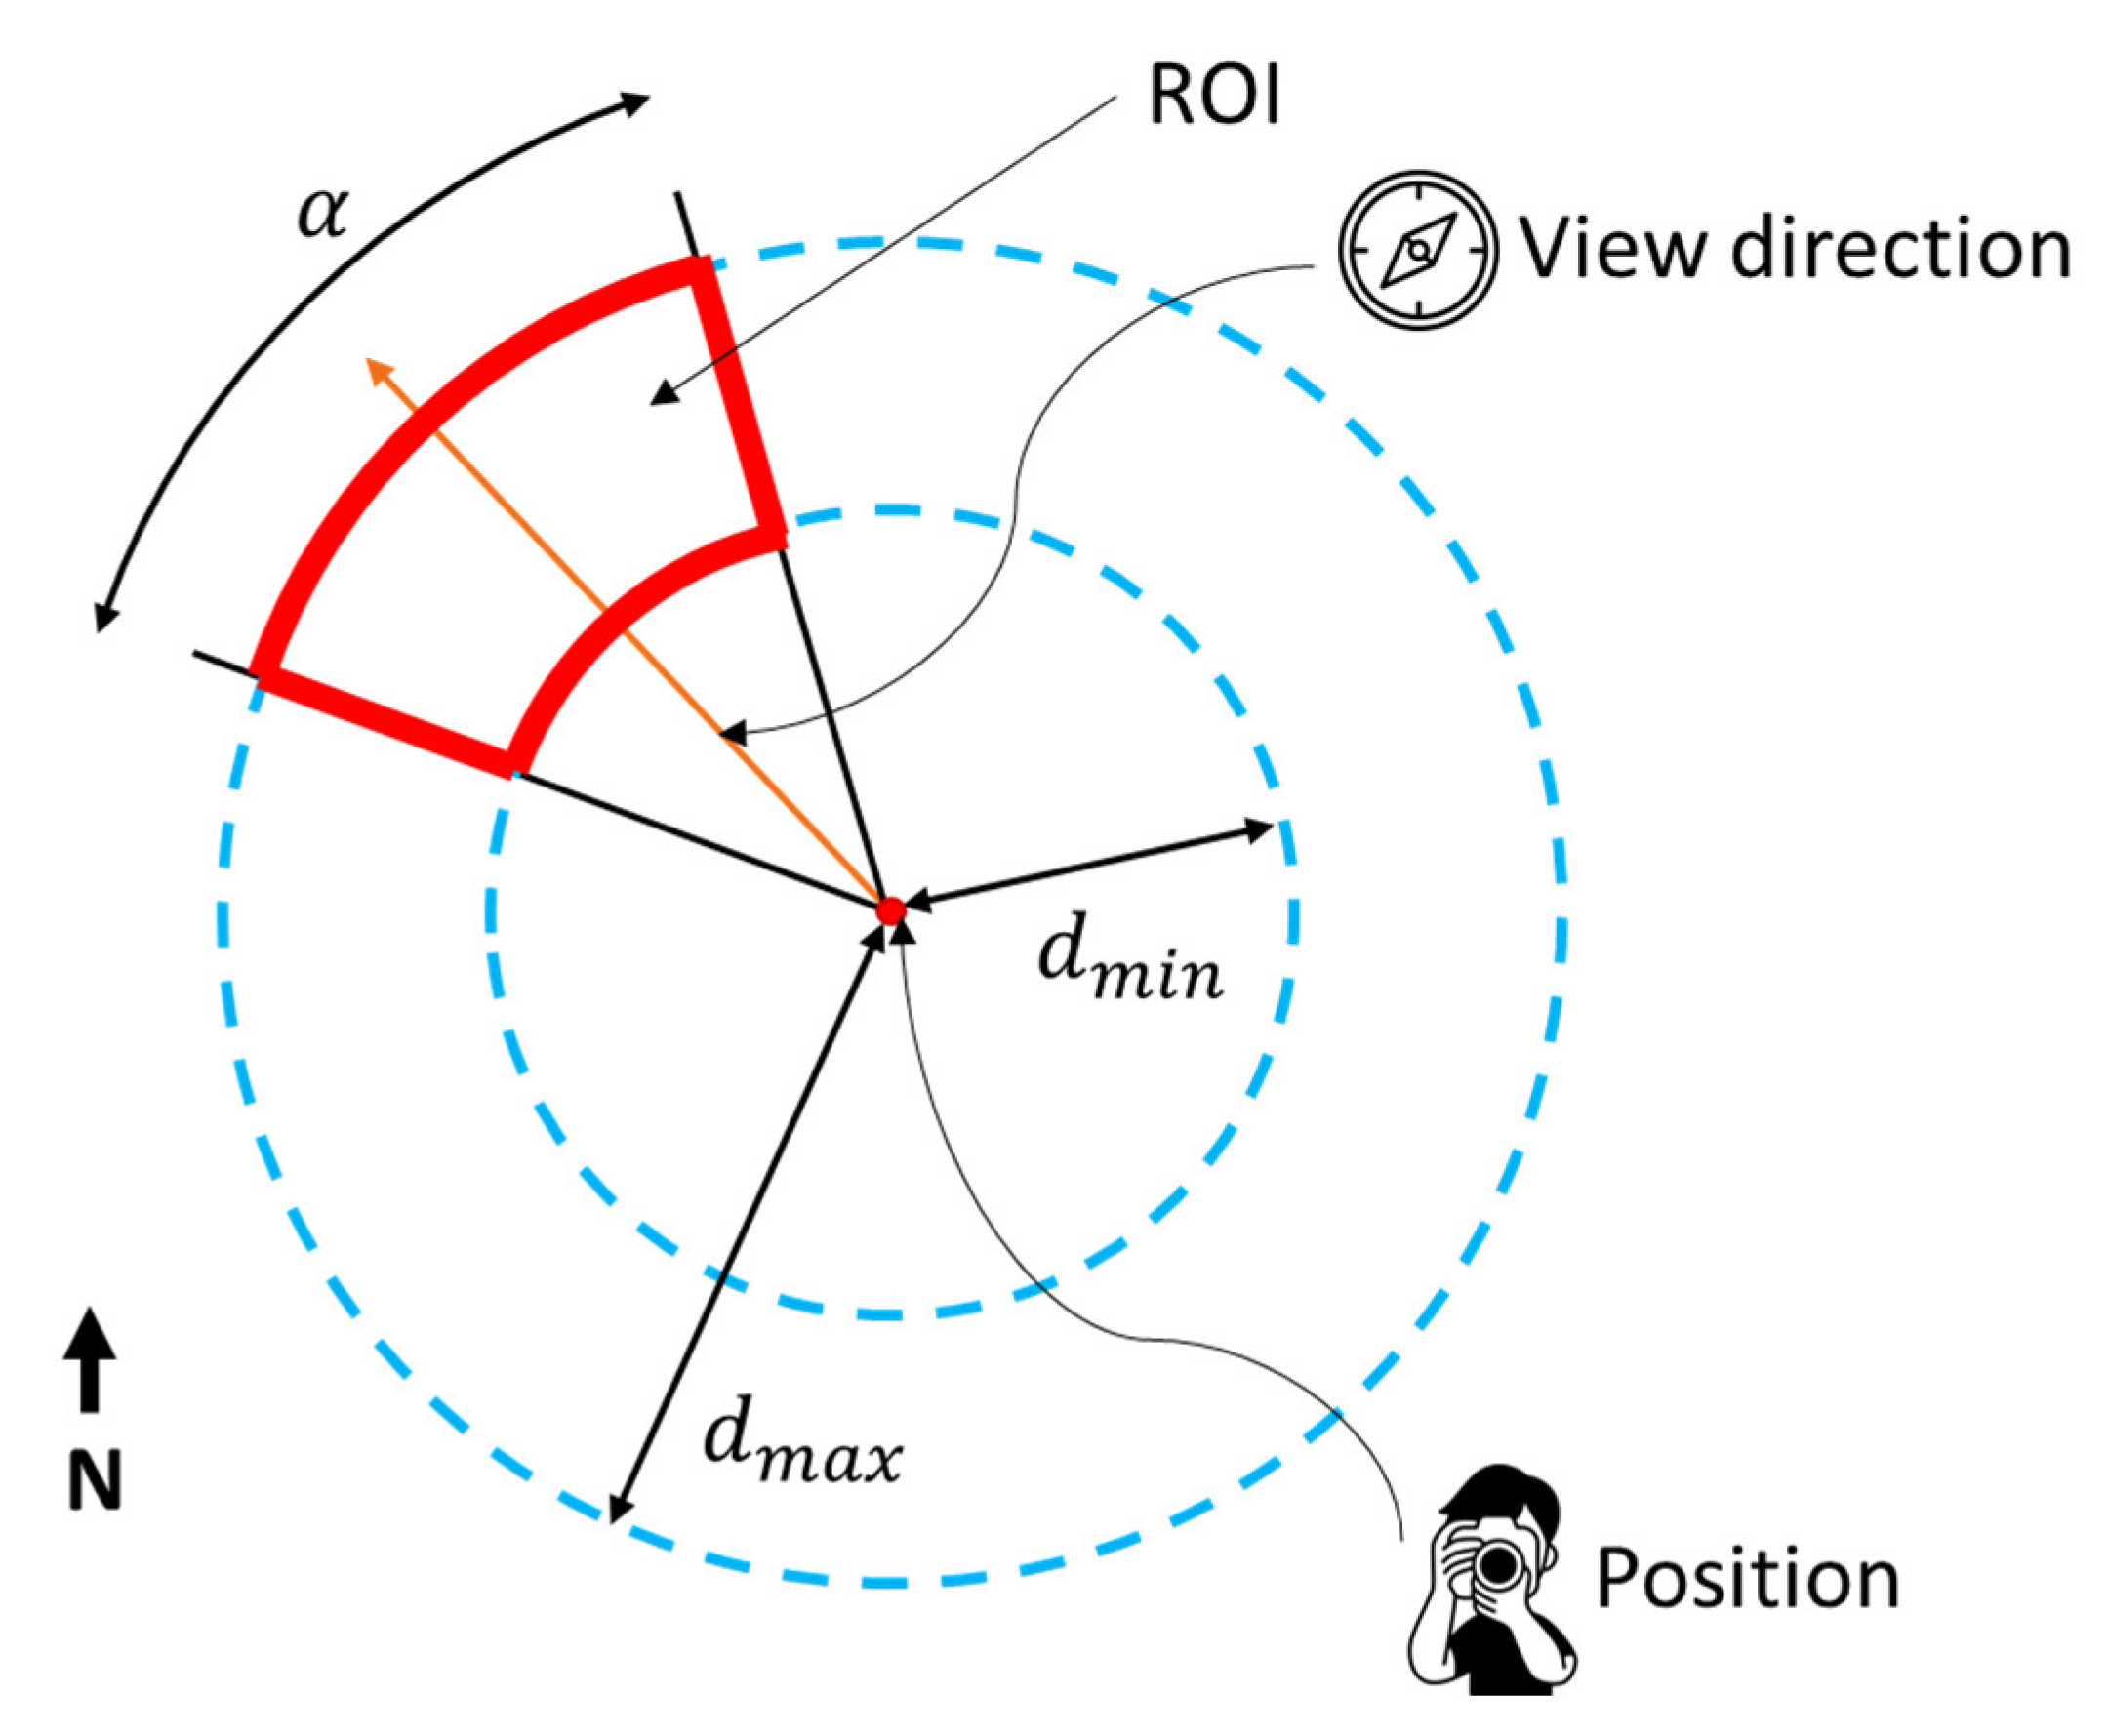
Figure 1. Definition of a single ROI for floodwater training sample construction starting from the position where the photograph is taken, the view direction, the view angle, and flooding minimum and maximum distance.
Ijgi 11 00611 g001
Figure 2. Overview of the areas of interest for the UK flood case study (a) and US flood case study (b). CRS: WGS84/UTM zone 30 N (a), WGS84/UTM zone 17 N (b). Basemap data: Esri Gray (light) © Esri.
Ijgi 11 00611 g002
Figure 3. Distribution of posts used to build floodwater training samples for the Bridgwater and Worcester areas (UK). CRS: WGS84/UTM zone 30 N. Basemap data: OpenStreetMap contributors.
Ijgi 11 00611 g003
Figure 4. Distribution of posts used to build floodwater training samples for the Lumberton area (US). CRS: WGS84/UTM zone 17 N. Basemap data: OpenStreetMap contributors.
Ijgi 11 00611 g004
Figure 5. Distribution of posts used to build floodwater training samples for the Wilmington area (US). CRS: WGS84/UTM zone 18 N. Basemap data: OpenStreetMap contributors.
Ijgi 11 00611 g005
Figure 6. Workflow adopted for flood delineation mapping.
Ijgi 11 00611 g006
Figure 7. Examples of posts retrieved from Flickr and YouTube and used to construct the training samples. For the Flickr post, the metadata of the device used to take the picture is also shown.
Ijgi 11 00611 g007
Figure 8. Final flood delineation map (left panel) and reference flood map (right panel) for the Bridgwater area (UK). CRS: WGS84/UTM zone 30 N. Basemap data: Esri Gray (light) © Esri.
Ijgi 11 00611 g008
Figure 9. Final flood delineation map (left panel) and reference flood map (right panel) for the Worcester area (UK). CRS: WGS84/UTM zone 30 N. Basemap data: Esri Gray (light) © Esri.
Ijgi 11 00611 g009
Figure 10. Final flood delineation map (left panel) and reference flood map (right panel) for the Lumberton area (US). CRS: WGS84/UTM zone 17 N. Basemap data: Esri Gray (light) © Esri.
Ijgi 11 00611 g010
Figure 11. Flood delineation map (left panel) and permanent waterbodies map (right panel) for the Wilmington area (US). CRS: WGS84/UTM zone 18 N. Basemap data: Esri Gray (light) © Esri.
Ijgi 11 00611 g011
Figure 12. Screenshot of the QGIS project, showing the map with the details acquired in the field, an example of the Attribute form configuration, the Attribute form filled, and the tool to Sync the project in the Cloud.
Ijgi 11 00611 g012
Figure 13. Screenshot of the QField project, showing how the map is used to help the user check their position and the collected data, and how the metadata are acquired in the process.
Ijgi 11 00611 g013
Table 1. Datasets used to produce the flood delineation map for each study area.
Study AreaSocial Media PostsSatellite Images
Number of PostsDatesSatelliteAcquisition Date
Bridgwater/
Worcester (UK) 1
13 (Flickr)10–11 February
2014
Landsat-716 February 2014
Wilmington (US)11 (Twitter)14–17 September 2018Sentinel-218 September 2018
Lumberton (US)6 (YouTube)18–20 September 2018Sentinel-218 September 2018
1 A single satellite imagery and training set was used for the study areas of the UK.
Table 2. Datasets used to inter-compare the resulting maps for each study area.
Study AreaProviderSourceDate
Bridgwater
(UK)
UK Environment AgencyRadar image16 February 2014
Worcester
(UK)
UK Environment AgencyRadar image11 February 2014
Wilmington (US) 1---
Lumberton
(US)
HASARDSentinel-1 imagesPre-event:
7 September 2018
Post-event:
19 September 2018
1 Consistency was not evaluated for the flood map of Wilmington. Indeed, the social media posts available for this study area did not allow us to reconstruct reliable training samples (which resulted in a misclassification of the flooded areas). This issue will be further explained in the following Sections.
Table 3. Overall Accuracy (OA), User Accuracy (UA), and Producer Accuracy (PA) of the flood delineation maps for each study area.
Study AreaOA [%]UA [%]PA [%]
FloodedNon-FloodedFloodedNon-Flooded
Bridgwater (UK)93.683.197.693.093.7
Worcester (UK)86.871.198.597.282.0
Wilmington (US) 1-----
Lumberton (US)93.169.395.966.996.3
1 Accuracy was not evaluated for the flood map of Wilmington.
Publisher’s Note: MDPI stays neutral with regard to jurisdictional claims in published maps and institutional affiliations.