Groundwater Potential Zone Mapping: Integration of Multi-Criteria Decision Analysis (MCDA) and GIS Techniques for the Al-Qalamoun Region in Syria
Abstract
1. Introduction
| Literature | LULC | Drainage Density | Soil Texture | Lithology | Slope | Lineament Density | Rainfall | Geomorphology | Elevation | NDVI | Groundwater Depth | Distance to River | Aquifer Thickness | Recharge Rate | Pond Density | Sentinel Water Index | Topographic Wetness Index | Soil Depth | Hillshade |
|---|---|---|---|---|---|---|---|---|---|---|---|---|---|---|---|---|---|---|---|
| [43] | * | * | * | * | * | * | * | * | |||||||||||
| [37] | * | * | * | * | * | * | * | * | * | * | * | ||||||||
| [44] | * | * | * | * | * | * | * | ||||||||||||
| [34] | * | * | * | * | * | * | * | * | |||||||||||
| [45] | * | * | * | * | * | * | * | * | |||||||||||
| [38] | * | * | * | * | * | * | * | * | |||||||||||
| [46] | * | * | * | * | * | * | * | * | |||||||||||
| [47] | * | * | * | * | * | * | * | * | |||||||||||
| [48] | * | * | * | * | * | * | * | * | |||||||||||
| [49] | * | * | * | * | * | * | * | * | |||||||||||
| [50] | * | * | * | * | * | * | * | * | |||||||||||
| [51] | * | * | * | * | * | * | * | * | |||||||||||
| [52] | * | * | * | * | * | * | * | * | |||||||||||
| [53] | * | * | * | * | * | * | * | * | |||||||||||
| [54] | * | * | * | * | * | * | * | * | |||||||||||
| [15] | * | * | * | * | * | * | * | * | |||||||||||
| [6] | * | * | * | * | * | * | * | * | |||||||||||
| [35] | * | * | * | * | * | * | * | * | * | * | |||||||||
| [55] | * | * | * | * | * | * | * | ||||||||||||
| [56] | * | * | * | * | * | * | * | * | |||||||||||
| [57] | * | * | * | * | * | * | * | * | * | * | * | ||||||||
| [22] | * | * | * | * | * | ||||||||||||||
| [58] | * | * | * | * | * | * | * | * | * | ||||||||||
| [59] | * | * | * | * | * | * | * | ||||||||||||
| [60] | * | * | * | * | * | ||||||||||||||
| [61] | * | * | * | * | * | * | |||||||||||||
| [62] | * | * | * | * | * | * | |||||||||||||
| [63] | * | * | * | * | * | * | * | * | * | ||||||||||
| [64] | * | * | * | * | * | * | * | ||||||||||||
| Average rate% | 96.6 | 96.6 | 93.1 | 89.7 | 89.7 | 79.3 | 75.8 | 72.4 | 24.1 | 17.2 | 13.8 | 6.9 | 6.9 | 6.9 | 3.5 | 3.5 | 3.5 | 3.5 | 3.5 |
2. Methodology
2.1. Study Area
2.2. Factors Used for Modeling
2.3. Statistical Models
2.3.1. Multi-Influence Factor (MIF) Techniques and Groundwater Potential Zone Method
2.3.2. Analytical Hierarchy Process (AHP) Techniques and Groundwater Potential Zone Method
2.4. Validation
3. Results and Discussion
3.1. Evaluation of Predictive Factors
3.2. Groundwater Potential Zonation
3.3. Validation
4. Conclusions
Author Contributions
Funding
Institutional Review Board Statement
Informed Consent Statement
Data Availability Statement
Conflicts of Interest
Appendix A
| Factors | Sub-Classes | MIF1 | AHP1 | ||
|---|---|---|---|---|---|
| Weight | Score | Weight | Rank | ||
Drainage Density | Very Low | 20 | 20 | 35 | 9 |
| Low | 16 | 7 | |||
| Medium | 12 | 5 | |||
| High | 8 | 3 | |||
| Very High | 4 | 1 | |||
Slope | 80–87 | 18 | 2 | 19 | 1 |
| 60–80 | 6 | 3 | |||
| 40–60 | 10 | 5 | |||
| 20–40 | 14 | 7 | |||
| 0–20 | 18 | 9 | |||
Lithology | Quaternary sands, loams | 15 | 15 | 16 | 9 |
| Quaternary conglomerates, sandstones, loams | 12 | 7 | |||
| Cretaceous limestone, marl dolomites | 9 | 5 | |||
| Neogene limestone, conglomerates, sands | 6 | 3 | |||
| Paleogene Chalky limestone, marls | 3 | 1 | |||
Geomorphology | Flood plain | 13 | 13 | 10 | 9 |
| Upper quaternary and recent alluvial fans | 10 | 7 | |||
| Low mountains with small and low ridges | 7 | 5 | |||
| Desert weathering outliers | 4 | 3 | |||
| Low mountains with coniform and cuesta—hilly relief | 1 | 1 | |||
| Medium-height mountains with flattened divides and steep abrupt slopes | 1 | 1 | |||
Rainfall (mm) | 270–430 | 11 | 3 | 10 | 9 |
| 197–270 | 5 | 7 | |||
| 163–197 | 7 | 5 | |||
| 139–163 | 9 | 3 | |||
| 111–139 | 11 | 1 | |||
Soil | Entisols-Lithic Torriorthents, Coarse and medium- Orthids, level to Steep. | 9 | 9 | 9 | |
| Low Entisols-Lithic Torriorthents, Coarse and medium-Rock outcrop, steep. | 7 | 5 | 7 | ||
| Aridisols-Typic Camborthids, medium- Typic Calciorthids, Level. | 5 | 5 | |||
| Aridisols-Typic Paleorthids, Coarse and medium-level sloping and steep | 3 | 3 | |||
| Aridisols-Typic Calciorthids, Coarse- Paleorthids, Sloping. | 1 | 1 | |||
LULC | Built-Up Land | 7 | 3 | 3 | 1 |
| Bare Mountain | 4 | 3 | |||
| Barren Land | 5 | 5 | |||
| Pasture Land | 6 | 7 | |||
| Agriculture Land | 7 | 9 | |||
Lineament Density | Very High High | 7 | 7 6 | 2 | 9 7 |
| Medium | 5 | 5 | |||
| Low | 4 | 3 | |||
| Very Low | 3 | 1 | |||
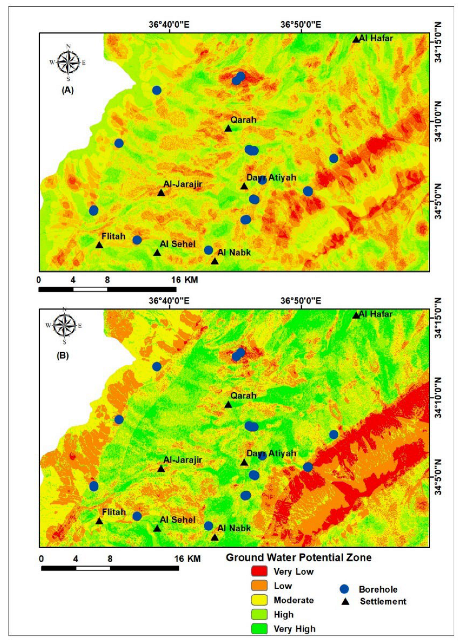
| Factors | Sub-Classes | MIF2 | AHP2 | ||
|---|---|---|---|---|---|
| Weight | Score | Weight | Rank | ||
Lithology | Quaternary sands, loams | 20 | 20 | 31 | 9 |
| Quaternary conglomerates, sandstones, loams | 16 | 7 | |||
| Cretaceous limestone, marl dolomites | 12 | 5 | |||
| Neogene limestone, conglomerates, sands | 8 | 3 | |||
| Paleogene Chalky limestone, marls | 4 | 1 | |||
Slope | 80–87 | 18 | 2 | 21 | 1 |
| 60–80 | 6 | 3 | |||
| 40–60 | 10 | 5 | |||
| 20–40 | 14 | 7 | |||
| 0–20 | 18 | 9 | |||
Drainage Density | Very Low | 15 | 15 | 16 | 9 |
| Low | 12 | 7 | |||
| Medium | 9 | 5 | |||
| High | 6 | 3 | |||
| Very High | 3 | 1 | |||
Geomorphology | Flood plain | 13 | 13 | 11 | 9 |
| Upper quaternary and recent alluvial fans | 10 | 7 | |||
| Low mountains with small and low ridges | 7 | 5 | |||
| Desert weathering outliers | 4 | 3 | |||
| Low mountains with coniform and cuesta- hilly relief | 1 | 1 | |||
| Medium-height mountains with flattened divides and steep abrupt slopes | 1 | 1 | |||
LULC | Built-Up Land | 11 | 3 | 9 | 1 |
| Bare Mountain | 5 | 3 | |||
| Barren Land | 7 | 5 | |||
| Pasture Land | 9 | 7 | |||
| Agriculture Land | 11 | 9 | |||
Lineament Density | Very Low | 9 | 1 | 1 | |
| Low | 3 | 5 | 3 | ||
| Medium | 5 | 5 | |||
| High | 7 | 7 | |||
| Very High | 9 | 9 | |||
Rainfall (mm) | 270–430 | 7 | 7 | 4 | 9 |
| 197–270 | 6 | 7 | |||
| 163–197 | 5 | 5 | |||
| 139–163 | 4 | 3 | |||
| 111–139 | 3 | 1 | |||
Soil | Entisols-Lithic Torriorthents, Coarse and medium-Orthids, level to Steep. | 7 | 7 | 3 | 9 |
| Entisols-Lithic Torriorthents, Coarse and medium-Rock outcrop, steep. | 6 | 7 | |||
| Aridisols-Typic Camborthids, medium- Typic Calciorthids, Level. | 5 | 5 | |||
| Aridisols-Typic Paleorthids, Coarse and medium-level sloping and steep. | 4 | 3 | |||
| Aridisols-Typic Calciorthids, Coarse- Paleorthids, Sloping. | 3 | ||||
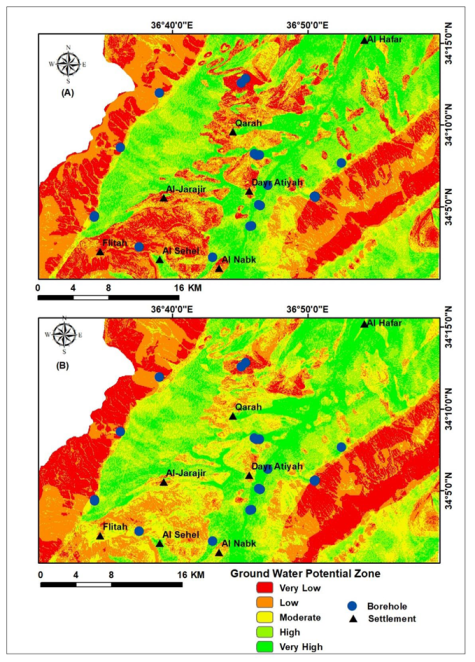
| Factors | Sub-Classes | MIF3 | AHP3 | ||
|---|---|---|---|---|---|
| Weight | Score | Weight | Rank | ||
Lithology | Quaternary sands, loams | 20 | 20 | 31 | 9 |
| Quaternary conglomerates, sandstones, loams | 16 | 7 | |||
| Cretaceous limestone, marl dolomites | 12 | 5 | |||
| Neogene limestone, conglomerates, sands | 8 | 3 | |||
| Paleogene Chalky limestone, marls | 4 | 1 | |||
Slope | 80–87 | 18 | 2 | 22 | 1 |
| 60–80 | 6 | 3 | |||
| 40–60 | 10 | 5 | |||
| 20–40 | 14 | 7 | |||
| 0–20 | 18 | 9 | |||
Geomorphology | Flood plain | 15 | 15 | 16 | 9 |
| Upper quaternary and recent alluvial fans | 12 | 7 | |||
| Low mountains with small and low ridges | 9 | 5 | |||
| Desert weathering outliers | 6 | 3 | |||
| Low mountains with coniform and cuesta- hilly relief Medium-height mountains with flattened divides and steep abrupt slopes | 3 1 | 1 1 | |||
Drainage Density | Very Low | 13 | 13 | 11 | 9 |
| Low | 10 | 7 | |||
| Medium | 7 | 5 | |||
| High | 4 | 3 | |||
| Very High | 1 | 1 | |||
LULC | Built-Up Land | 11 | 3 | 9 | 1 |
| Bare Mountain | 5 | 3 | |||
| Barren Land | 7 | 5 | |||
| Pasture Land | 9 | 7 | |||
| Agriculture Land | 11 | 9 | |||
Lineament Density | Very Low | 9 | 1 | 1 | |
| Low | 3 | 5 | 3 | ||
| Medium | 5 | 5 | |||
| High | 7 | 7 | |||
| Very High | 9 | 9 | |||
Rainfall (mm) | 270–430 | 7 | 7 | 4 | 9 |
| 197–270 | 6 | 7 | |||
| 163–197 | 5 | 5 | |||
| 139–163 | 4 | 3 | |||
| 111–139 | 3 | 1 | |||
Soil | Entisols-Lithic Torriorthents, Coarse and medium-Orthids, level to Steep. | 7 | 7 | 2 | 9 |
| Entisols-Lithic Torriorthents, Coarse and medium-Rock outcrop, steep. | 6 | 7 | |||
| Aridisols-Typic Camborthids, medium-Typic Calciorthids, Level. | 5 | 5 | |||
| Aridisols-Typic Paleorthids, Coarse and medium-level sloping and steep. | 4 | 3 | |||
| Aridisols-Typic Calciorthids, Coarse-Paleorthids, Sloping. | 3 | 1 | |||

| Factors | Sub-classes | MIF4 | AHP4 | ||
|---|---|---|---|---|---|
| Weight | Score | Weight | Rank | ||
Lithology | Quaternary sands, loams | 20 | 20 | 32 | 9 |
| Quaternary conglomerates, sandstones, loams | 16 | 7 | |||
| Cretaceous limestone, marl dolomites | 12 | 5 | |||
| Neogene limestone, conglomerates, sands | 8 | 3 | |||
| Paleogene Chalky limestone, marls | 4 | 1 | |||
Geomorphology | Flood plain | 18 | 18 | 22 | 9 |
| Upper quaternary and recent alluvial fans | 14 | 7 | |||
| Low mountains with small and low ridges | 10 | 5 | |||
| Desert weathering outliers | 6 | 3 | |||
| Low mountains with coniform and cuesta-hilly relief Medium-height mountains with flattened divides and steep abrupt slopes | 2 1 | 1 1 | |||
Slope | 80–87 | 15 | 3 | 15 | 1 |
| 60–80 | 6 | 3 | |||
| 40–60 | 9 | 5 | |||
| 20–40 | 12 | 7 | |||
| 0–20 | 15 | 9 | |||
LULC | Built-Up Land | 13 | 1 | 11 | 1 |
| Bare Mountain | 4 | 3 | |||
| Barren Land | 7 | 5 | |||
| Pasture Land | 10 | 7 | |||
| Agriculture Land | 13 | 9 | |||
Drainage Density | Very Low | 11 | 11 | 9 | 9 |
| Low | 9 | 7 | |||
| Medium | 7 | 5 | |||
| High | 5 | 3 | |||
| Very High | 3 | 1 | |||
Lineament Density | Very Low | 9 | 1 | 1 | |
| Low | 3 | 5 | 3 | ||
| Medium | 5 | 5 | |||
| High | 7 | 7 | |||
| Very High | 9 | 9 | |||
Rainfall (mm) | 270–430 | 7 | 7 | 4 | 9 |
| 197–270 | 6 | 7 | |||
| 163–197 | 5 | 5 | |||
| 139–163 | 4 | 3 | |||
| 111–139 | 3 | 1 | |||
Soil | Entisols-Lithic Torriorthents, Coarse and medium- Orthids, level to Steep. | 7 | 7 | 2 | 9 |
| Entisols-Lithic Torriorthents, Coarse and medium- Rock outcrop, steep. | 6 | 7 | |||
| Aridisols-Typic Camborthids, medium- Typic Calciorthids, Level. | 5 | 5 | |||
| Aridisols-Typic Paleorthids, Coarse and medium-level sloping and steep. | 4 | 3 | |||
| Aridisols-Typic Calciorthids, Coarse- Paleorthids, Sloping. | 3 | 1 | |||
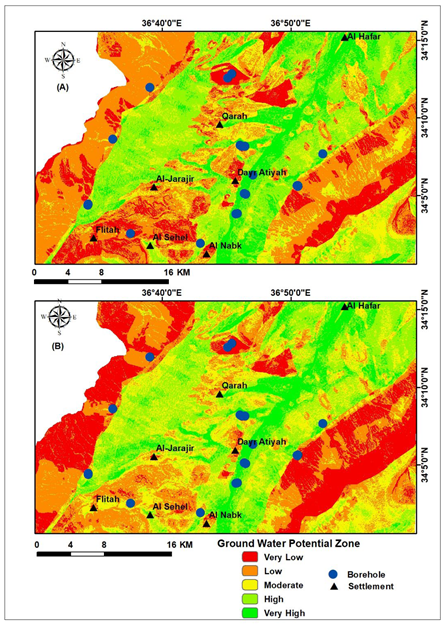
| Factors | Sub-Classes | MIF5 | AHP5 | ||
|---|---|---|---|---|---|
| Weight | Score | Weight | Rank | ||
Lithology | Quaternary sands, loams | 20 | 20 | 32 | 9 |
| Quaternary conglomerates, sandstones, loams | 16 | 7 | |||
| Cretaceous limestone, marl dolomites | 12 | 5 | |||
| Neogene limestone, conglomerates, sands | 8 | 3 | |||
| Paleogene Chalky limestone, marls | 4 | 1 | |||
LULC | Built-Up Land | 18 | 2 | 22 | 1 |
| Bare Mountain | 6 | 3 | |||
| Barren Land | 10 | 5 | |||
| Pasture Land | 14 | 7 | |||
| Agriculture Land | 18 | 9 | |||
Rainfall (mm) | 270–430 | 15 | 15 | 15 | 9 |
| 197–270 | 12 | 7 | |||
| 163–197 | 9 | 5 | |||
| 139–163 | 6 | 3 | |||
| 111–139 | 3 | 1 | |||
Soil | Entisols-Lithic Torriorthents, Coarse and medium-Orthids, level to Steep. | 13 | 13 | 11 | 9 |
| Entisols-Lithic Torriorthents, Coarse and medium-Rock outcrop, steep. | 10 | 7 | |||
| Aridisols-Typic Camborthids, medium-Typic Calciorthids, Level | 7 | 5 | |||
| Aridisols-Typic Paleorthids, Coarse and medium-level sloping and steep. | 4 | 3 | |||
| Aridisols-Typic Calciorthids, Coarse-Paleorthids, Sloping. | 1 | 1 | |||
Geomorphology | Flood plain | 11 | 11 | 9 | 9 |
| Upper quaternary and recent alluvial fans | 9 | 7 | |||
| Low mountains with small and low ridges | 7 | 5 | |||
| Desert weathering outliers | 5 | 3 | |||
| Low mountains with coniform and cuesta-hilly relief Medium-height mountains with flattened divides and steep abrupt slopes | 3 1 | 1 1 | |||
Slope | 80–87 | 9 | 1 | 1 | |
| 60–80 | 3 | 5 | 3 | ||
| 40–60 | 5 | 5 | |||
| 20–40 | 7 | 7 | |||
| 0–20 | 9 | 9 | |||
Drainage Density | Very Low | 7 | 7 | 4 | 9 |
| Low | 6 | 7 | |||
| Medium | 5 | 5 | |||
| High | 4 | 3 | |||
| Very High | 3 | 1 | |||
Lineament Density | Very Low Low | 7 | 3 4 | 2 | 1 3 |
| Medium High | 5 6 | 5 7 | |||
| Very High | 7 | 9 | |||

References
- Ghorbani Nejad, S.; Falah, F.; Daneshfar, M.; Haghizadeh, A.; Rahmati, O. Delineation of Groundwater Potential Zones Using Remote Sensing and GIS-Based Data-Driven Models. Geocarto Int. 2017, 32, 167–187. [Google Scholar] [CrossRef]
- Abd Manap, M.; Nampak, H.; Pradhan, B.; Lee, S.; Sulaiman, W.N.A.; Ramli, M.F. Application of Probabilistic-Based Frequency Ratio Model in Groundwater Potential Mapping Using Remote Sensing Data and GIS. Arab. J. Geosci. 2014, 7, 711–724. [Google Scholar] [CrossRef]
- Rudra, K. Interrelationship between Surface and Groundwater: The Case of West Bengal. In Ground Water Development-Issues and Sustainable Solutions; Springer: Berlin/Heidelberg, Germany, 2019; pp. 175–181. [Google Scholar]
- Mukherjee, P.; Singh, C.K.; Mukherjee, S. Delineation of Groundwater Potential Zones in Arid Region of India—A Remote Sensing and GIS Approach. Water Resour. Manag. 2012, 26, 2643–2672. [Google Scholar] [CrossRef]
- Pal, S.; Kundu, S.; Mahato, S. Groundwater Potential Zones for Sustainable Management Plans in a River Basin of India and Bangladesh. J. Clean. Prod. 2020, 257, 120311. [Google Scholar] [CrossRef]
- Pande, C.B.; Moharir, K.N.; Panneerselvam, B.; Singh, S.K.; Elbeltagi, A.; Pham, Q.B.; Varade, A.M.; Rajesh, J. Delineation of Groundwater Potential Zones for Sustainable Development and Planning Using Analytical Hierarchy Process (AHP), and MIF Techniques. Appl. Water Sci. 2021, 11, 186. [Google Scholar] [CrossRef]
- Mallick, J.; Talukdar, S.; Kahla, N.B.; Ahmed, M.; Alsubih, M.; Almesfer, M.K.; Islam, A.R.M. A Novel Hybrid Model for Developing Groundwater Potentiality Model Using High Resolution Digital Elevation Model (DEM) Derived Factors. Water 2021, 13, 2632. [Google Scholar] [CrossRef]
- Mitra, R.; Roy, D. Delineation of Groundwater Potential Zones through the Integration of Remote Sensing, Geographic Information System, and Multi-Criteria Decision-Making Technique in the Sub-Himalayan Foothills Region, India. Int. J. Energy Water Resour. 2022, 1–21. [Google Scholar] [CrossRef]
- Karimi-Rizvandi, S.; Goodarzi, H.V.; Afkoueieh, J.H.; Chung, I.-M.; Kisi, O.; Kim, S.; Linh, N.T.T. Groundwater-Potential Mapping Using a Self-Learning Bayesian Network Model: A Comparison among Metaheuristic Algorithms. Water 2021, 13, 658. [Google Scholar] [CrossRef]
- Elmahdy, S.; Ali, T.; Mohamed, M. Regional Mapping of Groundwater Potential in Ar Rub Al Khali, Arabian Peninsula Using the Classification and Regression Trees Model. Remote Sens. 2021, 13, 2300. [Google Scholar] [CrossRef]
- Magesh, N.S.; Chandrasekar, N.; Soundranayagam, J.P. Delineation of Groundwater Potential Zones in Theni District, Tamil Nadu, Using Remote Sensing, GIS and MIF Techniques. Geosci. Front. 2012, 3, 189–196. [Google Scholar] [CrossRef]
- Ghayoumian, J.; Saravi, M.M.; Feiznia, S.; Nouri, B.; Malekian, A. Application of GIS Techniques to Determine Areas Most Suitable for Artificial Groundwater Recharge in a Coastal Aquifer in Southern Iran. J. Asian Earth Sci. 2007, 30, 364–374. [Google Scholar] [CrossRef]
- Jha, M.K.; Chowdhury, A.; Chowdary, V.M.; Peiffer, S. Groundwater Management and Development by Integrated Remote Sensing and Geographic Information Systems: Prospects and Constraints. Water Resour. Manag. 2007, 21, 427–467. [Google Scholar] [CrossRef]
- Prasad, R.K.; Mondal, N.C.; Banerjee, P.; Nandakumar, M.V.; Singh, V.S. Deciphering Potential Groundwater Zone in Hard Rock through the Application of GIS. Environ. Geol. 2008, 55, 467–475. [Google Scholar] [CrossRef]
- Chowdhury, A.; Jha, M.K.; Chowdary, V.M.; Mal, B.C. Integrated Remote Sensing and GIS-based Approach for Assessing Groundwater Potential in West Medinipur District, West Bengal, India. Int. J. Remote Sens. 2009, 30, 231–250. [Google Scholar] [CrossRef]
- Saha, D.; Dhar, Y.R.; Vittala, S.S. Delineation of Groundwater Development Potential Zones in Parts of Marginal Ganga Alluvial Plain in South Bihar, Eastern India. Environ. Monit. Assess. 2010, 165, 179–191. [Google Scholar] [CrossRef]
- Machiwal, D.; Jha, M.K.; Mal, B.C. Assessment of Groundwater Potential in a Semi-Arid Region of India Using Remote Sensing, GIS and MCDM Techniques. Water Resour. Manag. 2011, 25, 1359–1386. [Google Scholar] [CrossRef]
- Teixeira, J.; Chaminé, H.I.; Carvalho, J.M.; Pérez-Alberti, A.; Rocha, F. Hydrogeomorphological Mapping as a Tool in Groundwater Exploration. J. Maps 2013, 9, 263–273. [Google Scholar] [CrossRef]
- Teixeira, J.; Chaminé, H.I.; Marques, J.E.; Carvalho, J.M.; Pereira, A.; Carvalho, M.R.; Fonseca, P.E.; Pérez-Alberti, A.; Rocha, F. A Comprehensive Analysis of Groundwater Resources Using GIS and Multicriteria Tools (Caldas Da Cavaca, Central Portugal): Environmental Issues. Environ. Earth Sci. 2015, 73, 2699–2715. [Google Scholar] [CrossRef]
- Jasrotia, A.S.; Kumar, A.; Singh, R. Integrated Remote Sensing and GIS Approach for Delineation of Groundwater Potential Zones Using Aquifer Parameters in Devak and Rui Watershed of Jammu and Kashmir, India. Arab. J. Geosci. 2016, 9, 304. [Google Scholar] [CrossRef]
- Abijith, D.; Saravanan, S.; Singh, L.; Jennifer, J.J.; Saranya, T.; Parthasarathy, K.S.S. GIS-Based Multi-Criteria Analysis for Identification of Potential Groundwater Recharge Zones-a Case Study from Ponnaniyaru Watershed, Tamil Nadu, India. HydroResearch 2020, 3, 1–14. [Google Scholar] [CrossRef]
- Bhattacharya, S.; Das, S.; Das, S.; Kalashetty, M.; Warghat, S.R. An Integrated Approach for Mapping Groundwater Potential Applying Geospatial and MIF Techniques in the Semiarid Region. Environ. Dev. Sustain. 2021, 23, 495–510. [Google Scholar] [CrossRef]
- Nag, S.K.; Chowdhury, P. Decipherment of Potential Zones for Groundwater Occurrence: A Study in Khatra Block, Bankura District, West Bengal, Using Geospatial Techniques. Environ. Earth Sci. 2019, 78, 49. [Google Scholar] [CrossRef]
- Wind, Y.; Saaty, T.L. Marketing Applications of the Analytic Hierarchy Process. Manag. Sci. 1980, 26, 641–658. [Google Scholar] [CrossRef]
- Salar, S.G.; Othman, A.A.; Hasan, S.E. Identification of Suitable Sites for Groundwater Recharge in Awaspi Watershed Using GIS and Remote Sensing Techniques. Environ. Earth Sci. 2018, 77, 701. [Google Scholar] [CrossRef]
- Al-Ruzouq, R.; Shanableh, A.; Merabtene, T.; Siddique, M.; Khalil, M.A.; Idris, A.; Almulla, E. Potential Groundwater Zone Mapping Based on Geo-Hydrological Considerations and Multi-Criteria Spatial Analysis: North UAE. Catena 2019, 173, 511–524. [Google Scholar] [CrossRef]
- Thapa, R.; Gupta, S.; Guin, S.; Kaur, H. Assessment of Groundwater Potential Zones Using Multi-Influencing Factor (MIF) and GIS: A Case Study from Birbhum District, West Bengal. Appl. Water Sci. 2017, 7, 4117–4131. [Google Scholar] [CrossRef]
- Othman, A.A.; Obaid, A.K.; Al-Manmi, D.A.M.; Pirouei, M.; Salar, S.G.; Liesenberg, V.; Al-Maamar, A.F.; Shihab, A.T.; Al-Saady, Y.I.; Al-Attar, Z.T. Insights for Landfill Site Selection Using Gis: A Case Study in the Tanjero River Basin, Kurdistan Region, Iraq. Sustainability 2021, 13, 12602. [Google Scholar] [CrossRef]
- Bashir, B.; Alsalman, A.; Othman, A.A.; Obaid, A.K.; Bashir, H. New Approach to Selecting Civil Defense Centers in Al-Riyadh City (Ksa) Based on Multi-Criteria Decision Analysis and Gis. Land 2021, 10, 1108. [Google Scholar] [CrossRef]
- Othman, A.A.; Al- Maamar, A.F.; Al-Manmi, D.A.M.; Veraldo, L.; Hasan, S.E.; Obaid, A.K.; Al-Quraishi, A.M.F. GIS-Based Modeling for Selection of Dam Sites in the Kurdistan Region, Iraq. ISPRS Int. J. Geo.-Inf. 2020, 9, 244. [Google Scholar] [CrossRef]
- Agarwal, R.; Garg, P.K. Remote Sensing and GIS Based Groundwater Potential & Recharge Zones Mapping Using Multi-Criteria Decision Making Technique. Water Resour. Manag. 2016, 30, 243–260. [Google Scholar]
- Singh, L.K.; Jha, M.K.; Chowdary, V.M. Assessing the Accuracy of GIS-Based Multi-Criteria Decision Analysis Approaches for Mapping Groundwater Potential. Ecol. Indic. 2018, 91, 24–37. [Google Scholar] [CrossRef]
- Shekhar, S.; Pandey, A.C. Delineation of Groundwater Potential Zone in Hard Rock Terrain of India Using Remote Sensing, Geographical Information System (GIS) and Analytic Hierarchy Process (AHP) Techniques. Geocarto Int. 2015, 30, 402–421. [Google Scholar] [CrossRef]
- Murmu, P.; Kumar, M.; Lal, D.; Sonker, I.; Singh, S.K. Delineation of Groundwater Potential Zones Using Geospatial Techniques and Analytical Hierarchy Process in Dumka District, Jharkhand, India. Groundw. Sustain. Dev. 2019, 9, 100239. [Google Scholar] [CrossRef]
- Dey, S.; Shukla, U.K.; Mehrishi, P.; Mall, R.K. Appraisal of Groundwater Potentiality of Multilayer Alluvial Aquifers of the Varuna River Basin, India, Using Two Concurrent Methods of MCDM. Environ. Dev. Sustain. 2021, 23, 17558–17589. [Google Scholar] [CrossRef]
- Taheri, K.; Missimer, T.M.; Taheri, M.; Moayedi, H.; Mohseni Pour, F. Critical Zone Assessments of an Alluvial Aquifer System Using the Multi-Influencing Factor (MIF) and Analytical Hierarchy Process (AHP) Models in Western Iran. Nat. Resour. Res. 2020, 29, 1163–1191. [Google Scholar] [CrossRef]
- Sutradhar, S.; Mondal, P.; Das, N. Delineation of Groundwater Potential Zones Using MIF and AHP Models: A Micro-Level Study on Suri Sadar Sub-Division, Birbhum District, West Bengal, India. Groundw. Sustain. Dev. 2021, 12, 100547. [Google Scholar] [CrossRef]
- Zghibi, A.; Mirchi, A.; Msaddek, M.H.; Merzougui, A.; Zouhri, L.; Taupin, J.-D.; Chekirbane, A.; Chenini, I.; Tarhouni, J. Using Analytical Hierarchy Process and Multi-Influencing Factors to Map Groundwater Recharge Zones in a Semi-Arid Mediterranean Coastal Aquifer. Water 2020, 12, 2525. [Google Scholar] [CrossRef]
- Abrams, W.; Ghoneim, E.; Shew, R.; LaMaskin, T.; Al-Bloushi, K.; Hussein, S.; AbuBakr, M.; Al-Mulla, E.; Al-Awar, M.; El-Baz, F. Delineation of Groundwater Potential (GWP) in the Northern United Arab Emirates and Oman Using Geospatial Technologies in Conjunction with Simple Additive Weight (SAW), Analytical Hierarchy Process (AHP), and Probabilistic Frequency Ratio (PFR) Techniques. J. Arid Environ. 2018, 157, 77–96. [Google Scholar] [CrossRef]
- Das, B.; Pal, S.C. Combination of GIS and Fuzzy-AHP for Delineating Groundwater Recharge Potential Zones in the Critical Goghat-II Block of West Bengal, India. HydroResearch 2019, 2, 21–30. [Google Scholar] [CrossRef]
- Elewa, H.H.; Qaddah, A.A. Groundwater Potentiality Mapping in the Sinai Peninsula, Egypt, Using Remote Sensing and GIS-Watershed-Based Modeling. Hydrogeol. J. 2011, 19, 613–628. [Google Scholar] [CrossRef]
- Yeh, H.-F.; Lee, C.-H.; Hsu, K.-C.; Chang, P.-H. GIS for the Assessment of the Groundwater Recharge Potential Zone. Environ. Geol. 2009, 58, 185–195. [Google Scholar] [CrossRef]
- Das, S. Comparison among Influencing Factor, Frequency Ratio, and Analytical Hierarchy Process Techniques for Groundwater Potential Zonation in Vaitarna Basin, Maharashtra, India. Groundw. Sustain. Dev. 2019, 8, 617–629. [Google Scholar] [CrossRef]
- Ahmed, A.; Ranasinghe-Arachchilage, C.; Alrajhi, A.; Hewa, G. Comparison of Multicriteria Decision-Making Techniques for Groundwater Recharge Potential Zonation: Case Study of the Willochra Basin, South Australia. Water 2021, 13, 525. [Google Scholar] [CrossRef]
- Bera, A.; Mukhopadhyay, B.P.; Barua, S. Delineation of Groundwater Potential Zones in Karha River Basin, Maharashtra, India, Using AHP and Geospatial Techniques. Arab. J. Geosci. 2020, 13, 693. [Google Scholar] [CrossRef]
- Pathmanandakumar, V.; Thasarathan, N.; Ranagalage, M. An Approach to Delineate Potential Groundwater Zones in Kilinochchi District, Sri Lanka, Using GIS Techniques. ISPRS Int. J. Geo.-Inf. 2021, 10, 730. [Google Scholar] [CrossRef]
- Dar, T.; Rai, N.; Bhat, A. Delineation of Potential Groundwater Recharge Zones Using Analytical Hierarchy Process (AHP). Geol. Ecol. Landsc. 2021, 5, 292–307. [Google Scholar] [CrossRef]
- Koirala, P.; Thakuri, S.; Joshi, S.; Chauhan, R. Estimation of Soil Erosion in Nepal Using a RUSLE Modeling and Geospatial Tool. Geosciences 2019, 9, 147. [Google Scholar] [CrossRef]
- Kanagaraj, G.; Suganthi, S.; Elango, L.; Magesh, N.S. Assessment of Groundwater Potential Zones in Vellore District, Tamil Nadu, India Using Geospatial Techniques. Earth Sci. Inform. 2019, 12, 211–223. [Google Scholar] [CrossRef]
- Etikala, B.; Golla, V.; Li, P.; Renati, S. Deciphering Groundwater Potential Zones Using MIF Technique and GIS: A Study from Tirupati Area, Chittoor District, Andhra Pradesh, India. HydroResearch 2019, 1, 1–7. [Google Scholar] [CrossRef]
- Arulbalaji, P.; Padmalal, D.; Sreelash, K. GIS and AHP Techniques Based Delineation of Groundwater Potential Zones: A Case Study from Southern Western Ghats, India. Sci. Rep. 2019, 9, 2082. [Google Scholar] [CrossRef]
- Onur, T.; Gök, R.; Abdulnaby, W.; Mahdi, H.; Numan, N.M.S.; Al-Shukri, H.; Shakir, A.M.; Chlaib, H.K.; Ameen, T.H.; Abd, N.A. A Comprehensive Earthquake Catalog for Iraq in Terms of Moment Magnitude. Seismol. Res. Lett. 2017, 88, 798–811. [Google Scholar] [CrossRef]
- Lakshmi, S.V.; Reddy, Y.V.K. Identification of Groundwater Potential Zones Using GIS and Remote Sensing. Int. J. Pure Appl. Math. 2018, 119, 3195–3210. [Google Scholar]
- Hussein, A.-A.; Govindu, V.; Nigusse, A.G.M. Evaluation of Groundwater Potential Using Geospatial Techniques. Appl. Water Sci. 2017, 7, 2447–2461. [Google Scholar] [CrossRef]
- Ajay Kumar, V.; Mondal, N.C.; Ahmed, S. Identification of Groundwater Potential Zones Using RS, GIS and AHP Techniques: A Case Study in a Part of Deccan Volcanic Province (DVP), Maharashtra, India. J. Indian Soc. Remote Sens. 2020, 48, 497–511. [Google Scholar] [CrossRef]
- Senapati, U.; Das, T.K. GIS-Based Comparative Assessment of Groundwater Potential Zone Using MIF and AHP Techniques in Cooch Behar District, West Bengal. Appl. Water Sci. 2022, 12, 43. [Google Scholar] [CrossRef]
- Goswami, T.; Ghosal, S. Understanding the Suitability of Two MCDM Techniques in Mapping the Groundwater Potential Zones of Semi-Arid Bankura District in Eastern India. Groundw. Sustain. Dev. 2022, 17, 100727. [Google Scholar] [CrossRef]
- Allafta, H.; Opp, C.; Patra, S. Identification of Groundwater Potential Zones Using Remote Sensing and GIS Techniques: A Case Study of the Shatt Al-Arab Basin. Remote Sens. 2020, 13, 112. [Google Scholar] [CrossRef]
- Kolli, M.K.; Opp, C.; Groll, M. Mapping of Potential Groundwater Recharge Zones in the Kolleru Lake Catchment, India, by Using Remote Sensing and GIS Techniques. Nat. Resour. 2020, 11, 127. [Google Scholar] [CrossRef][Green Version]
- Benjmel, K.; Amraoui, F.; Boutaleb, S.; Ouchchen, M.; Tahiri, A.; Touab, A. Mapping of Groundwater Potential Zones in Crystalline Terrain Using Remote Sensing, GIS Techniques, and Multicriteria Data Analysis (Case of the Ighrem Region, Western Anti-Atlas, Morocco). Water 2020, 12, 471. [Google Scholar] [CrossRef]
- Arshad, A.; Zhang, Z.; Zhang, W.; Dilawar, A. Mapping Favorable Groundwater Potential Recharge Zones Using a GIS-Based Analytical Hierarchical Process and Probability Frequency Ratio Model: A Case Study from an Agro-Urban Region of Pakistan. Geosci. Front. 2020, 11, 1805–1819. [Google Scholar] [CrossRef]
- Choubin, B.; Rahmati, O.; Soleimani, F.; Alilou, H.; Moradi, E.; Alamdari, N. Regional Groundwater Potential Analysis Using Classification and Regression Trees. In Spatial Modeling in GIS and R for Earth and Environmental Sciences; Elsevier: Amsterdam, The Netherlands, 2019; pp. 485–498. [Google Scholar]
- Patra, S.; Mishra, P.; Mahapatra, S.C. Delineation of Groundwater Potential Zone for Sustainable Development: A Case Study from Ganga Alluvial Plain Covering Hooghly District of India Using Remote Sensing, Geographic Information System and Analytic Hierarchy Process. J. Clean. Prod. 2018, 172, 2485–2502. [Google Scholar] [CrossRef]
- Nasir, M.J.; Khan, S.; Zahid, H.; Khan, A. Delineation of Groundwater Potential Zones Using GIS and Multi Influence Factor (MIF) Techniques: A Study of District Swat, Khyber Pakhtunkhwa, Pakistan. Environ. Earth Sci. 2018, 77, 367. [Google Scholar] [CrossRef]
- The General Company for Water Studies. The Qalamoun Water Study Project, Volume Three, Hydrogeological Report. Homs, 1994. [Google Scholar]
- Ponikarov, V.P.; Kozlov, V.V.; Artemove, A.V.; Kalis, A.F. The Geology of Syria. Explanatory Notes on the Geological Map of Syria, Scale 1:200,000; Syrian Arab Republic, Ministry of Industry, Departement of Geological and Mineral Research: Damascus, Syria, 1966. [Google Scholar]
- Mohammed, S.; Khallouf, A.; Kiwan, S.; Alhenawi, S.; Ali, H.; Harsányi, E. Characterization of Major Soil Orders in Syria 1. Eurasian Soil Sci. 2020, 53, 420–429. [Google Scholar] [CrossRef]
- TECHNOEXPORT, M.O.G.U. Geological Map Of Syria Scale 1:200,000, Sheets I-36-XVIII, I-37-XIII (Trablus, Homs); Ministry of Industry, S.A.R.: Damascus, Syria, 1963. [Google Scholar]
- Llaiwi, M.D. Soil Map of Syria and Lebanon Scale 1:1,000,000; The Arab Center for the Studies of Arid Zones and Dry Lands, (ACSAD): Damascus, Syria, 1985. [Google Scholar]
- Mirzayev, K. Geological Map of Syria; Syrian Arab Republic Ministry of Industry Department of Geological and Mineral Research: Damascus, Syria, 1963. [Google Scholar]
- USGS EarthExplorer. Available online: https://earthexplorer.usgs.gov/ (accessed on 10 April 2020).
- Dinku, T.; Funk, C.; Peterson, P.; Maidment, R.; Tadesse, T.; Gadain, H.; Ceccato, P. Validation of the CHIRPS Satellite Rainfall Estimates over Eastern Africa. Q. J. R. Meteorol. Soc. 2018, 144, 292–312. [Google Scholar] [CrossRef]
- Bai, L.; Shi, C.; Li, L.; Yang, Y.; Wu, J. Accuracy of CHIRPS Satellite-Rainfall Products over Mainland China. Remote Sens. 2018, 10, 362. [Google Scholar] [CrossRef]
- Saeidizand, R.; Sabetghadam, S.; Tarnavsky, E.; Pierleoni, A. Evaluation of CHIRPS Rainfall Estimates over Iran. Q. J. R. Meteorol. Soc. 2018, 144, 282–291. [Google Scholar] [CrossRef]
- Sulugodu, B.; Deka, P.C. Evaluating the Performance of CHIRPS Satellite Rainfall Data for Streamflow Forecasting. Water Resour. Manag. 2019, 33, 3913–3927. [Google Scholar] [CrossRef]
- Ocampo-Marulanda, C.; Fernández-Álvarez, C.; Cerón, W.L.; Canchala, T.; Carvajal-Escobar, Y.; Alfonso-Morales, W. A Spatiotemporal Assessment of the High-Resolution CHIRPS Rainfall Dataset in Southwestern Colombia Using Combined Principal Component Analysis. Ain Shams Eng. J. 2022, 13, 101739. [Google Scholar] [CrossRef]
- Abdourahamane, Z.S.; Garba, I.; Boukary, A.G.; Mirzabaev, A. Spatiotemporal Characterization of Agricultural Drought in the Sahel Region Using a Composite Drought Index. J. Arid Environ. 2022, 204, 104789. [Google Scholar] [CrossRef]
- FAO. Food and Agriculture Organization of the United Nation. Available online: https://wapor.apps.fao.org (accessed on 15 May 2020).
- Das, S.; Pardeshi, S.D. Integration of Different Influencing Factors in GIS to Delineate Groundwater Potential Areas Using IF and FR Techniques: A Study of Pravara Basin, Maharashtra, India. Appl. Water Sci. 2018, 8, 197. [Google Scholar] [CrossRef]
- Saaty, T.L. A Scaling Method for Priorities in Hierarchical Structures. J. Math. Psychol. 1977, 15, 234–281. [Google Scholar] [CrossRef]
- Saaty, T.L.; Vargas, L.G. Dispersion of Group Judgments. Math. Comput. Model. 2007, 46, 918–925. [Google Scholar] [CrossRef]
- Saaty, T.L. Fundamentals of the Analytic Network Process—Multiple Networks with Benefits, Costs, Opportunities and Risks. J. Syst. Sci. Syst. Eng. 2004, 13, 348–379. [Google Scholar] [CrossRef]
- Saaty, T.L. Decision Making with the Analytic Hierarchy Process. Int. J. Serv. Sci. 2008, 1, 83–98. [Google Scholar] [CrossRef]
- Thirumalaivasan, D.; Karmegam, M.; Venugopal, K. AHP-DRASTIC: Software for Specific Aquifer Vulnerability Assessment Using DRASTIC Model and GIS. Environ. Model. Softw. 2003, 18, 645–656. [Google Scholar] [CrossRef]
- Pilevar, A.R.; Matinfar, H.R.; Sohrabi, A.; Sarmadian, F. Integrated Fuzzy, AHP and GIS Techniques for Land Suitability Assessment in Semi-Arid Regions for Wheat and Maize Farming. Ecol. Indic. 2020, 110, 105887. [Google Scholar] [CrossRef]
- Souissi, D.; Msaddek, M.H.; Zouhri, L.; Chenini, I.; El May, M.; Dlala, M. Mapping Groundwater Recharge Potential Zones in Arid Region Using GIS and Landsat Approaches, Southeast Tunisia. Hydrol. Sci. J. 2018, 63, 251–268. [Google Scholar] [CrossRef]
- Arya, S.; Subramani, T.; Karunanidhi, D. Delineation of Groundwater Potential Zones and Recommendation of Artificial Recharge Structures for Augmentation of Groundwater Resources in Vattamalaikarai Basin, South India. Environ. Earth Sci. 2020, 79, 102. [Google Scholar] [CrossRef]
- Fashae, O.A.; Tijani, M.N.; Talabi, A.O.; Adedeji, O.I. Delineation of Groundwater Potential Zones in the Crystalline Basement Terrain of SW-Nigeria: An Integrated GIS and Remote Sensing Approach. Appl. Water Sci. 2014, 4, 19–38. [Google Scholar] [CrossRef]
- Rahmati, O.; Samani, A.N.; Mahdavi, M.; Pourghasemi, H.R.; Zeinivand, H. Groundwater Potential Mapping at Kurdistan Region of Iran Using Analytic Hierarchy Process and GIS. Arab. J. Geosci. 2015, 8, 7059–7071. [Google Scholar] [CrossRef]
- Saranya, T.; Saravanan, S. Groundwater Potential Zone Mapping Using Analytical Hierarchy Process (AHP) and GIS for Kancheepuram District, Tamilnadu, India. Model. Earth Syst. Environ. 2020, 6, 1105–1122. [Google Scholar] [CrossRef]
- Mohammady, M.; Pourghasemi, H.R.; Pradhan, B. Landslide Susceptibility Mapping at Golestan Province, Iran: A Comparison between Frequency Ratio, Dempster–Shafer, and Weights-of-Evidence Models. J. Asian Earth Sci. 2012, 61, 221–236. [Google Scholar] [CrossRef]
- Pradhan, B. Groundwater Potential Zonation for Basaltic Watersheds Using Satellite Remote Sensing Data and GIS Techniques. Cent. Eur. J. Geosci. 2009, 1, 120–129. [Google Scholar] [CrossRef]
- Pourghasemi, H.R.; Moradi, H.R.; Fatemi Aghda, S.M. Landslide Susceptibility Mapping by Binary Logistic Regression, Analytical Hierarchy Process, and Statistical Index Models and Assessment of Their Performances. Nat. Hazards 2013, 69, 749–779. [Google Scholar] [CrossRef]
- Naghibi, S.A.; Moradi Dashtpagerdi, M. Evaluation of Four Supervised Learning Methods for Groundwater Spring Potential Mapping in Khalkhal Region (Iran) Using GIS-Based Features. Hydrogeol. J. 2017, 25, 169–189. [Google Scholar] [CrossRef]
- Pourtaghi, Z.S.; Pourghasemi, H.R. GIS-Based Groundwater Spring Potential Assessment and Mapping in the Birjand Township, Southern Khorasan Province, Iran. Hydrogeol. J. 2014, 22, 643–662. [Google Scholar] [CrossRef]
- Nag, S.K.; Ghosh, P. Delineation of Groundwater Potential Zone in Chhatna Block, Bankura District, West Bengal, India Using Remote Sensing and GIS Techniques. Environ. Earth Sci. 2013, 70, 2115–2127. [Google Scholar] [CrossRef]
- Senanayake, I.P.; Dissanayake, D.; Mayadunna, B.B.; Weerasekera, W.L. An Approach to Delineate Groundwater Recharge Potential Sites in Ambalantota, Sri Lanka Using GIS Techniques. Geosci. Front. 2016, 7, 115–124. [Google Scholar] [CrossRef]
- Chitsazan, M.; Akhtari, Y. A GIS-Based DRASTIC Model for Assessing Aquifer Vulnerability in Kherran Plain, Khuzestan, Iran. Water Resour. Manag. 2009, 23, 1137–1155. [Google Scholar] [CrossRef]
- Al-manmi, D.A.M.; Rauf, L.F. Groundwater Potential Mapping Using Remote Sensing and GIS-Based, in Halabja City, Kurdistan, Iraq. Arab. J. Geosci. 2016, 9, 357. [Google Scholar] [CrossRef]
- Mohammed, D.A.; Mohammed, S.H.; Szűcs, P. Integrated Remote Sensing and GIS Techniques to Delineate Groundwater Potential Area of Chamchamal Basin, Sulaymaniyah, NE Iraq. Kuwait J. Sci. 2021, 48. [Google Scholar] [CrossRef]
- Şener, E.; Şener, Ş.; Davraz, A. Groundwater Potential Mapping by Combining Fuzzy-Analytic Hierarchy Process and GIS in Beyşehir Lake Basin, Turkey. Arab. J. Geosci. 2018, 11, 187. [Google Scholar] [CrossRef]
- Pradhan, B.; Youssef, A.M. Manifestation of Remote Sensing Data and GIS on Landslide Hazard Analysis Using Spatial-Based Statistical Models. Arab. J. Geosci. 2010, 3, 319–326. [Google Scholar] [CrossRef]
- Pradhan, B.; Singh, R.P.; Buchroithner, M.F. Estimation of Stress and Its Use in Evaluation of Landslide Prone Regions Using Remote Sensing Data. Adv. Sp. Res. 2006, 37, 698–709. [Google Scholar] [CrossRef]
- Subba Rao, N.; Chakradhar, G.K.J.; Srinivas, V. Identification of Groundwater Potential Zones Using Remote Sensing Techniques in and around Guntur Town, Andhra Pradesh, India. J. Indian Soc. Remote Sens. 2001, 29, 69–78. [Google Scholar] [CrossRef]
- Chung, C.-J.F.; Fabbri, A.G. Validation of Spatial Prediction Models for Landslide Hazard Mapping. Nat. Hazards 2003, 30, 451–472. [Google Scholar] [CrossRef]
- Razandi, Y.; Pourghasemi, H.R.; Neisani, N.S.; Rahmati, O. Application of Analytical Hierarchy Process, Frequency Ratio, and Certainty Factor Models for Groundwater Potential Mapping Using GIS. Earth Sci. Inform. 2015, 8, 867–883. [Google Scholar] [CrossRef]
- Abo-Khomra, N.K.N.; Al-Tamimi, O.S.I.; Othman, A.A. DRASTIC for Groundwater Vulnerability Assessment Using GIS: A Case Study in Laylan Sub-Basin, Kirkuk, Iraq. Iraqi Geol. J. 2022, 71–81. [Google Scholar] [CrossRef]

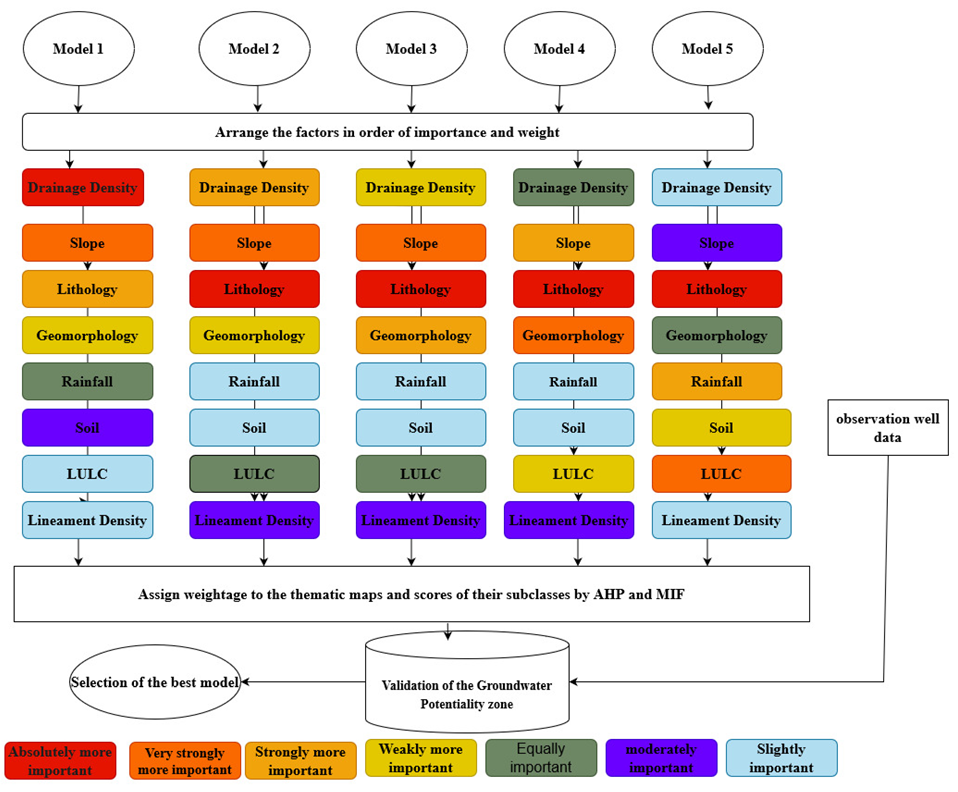
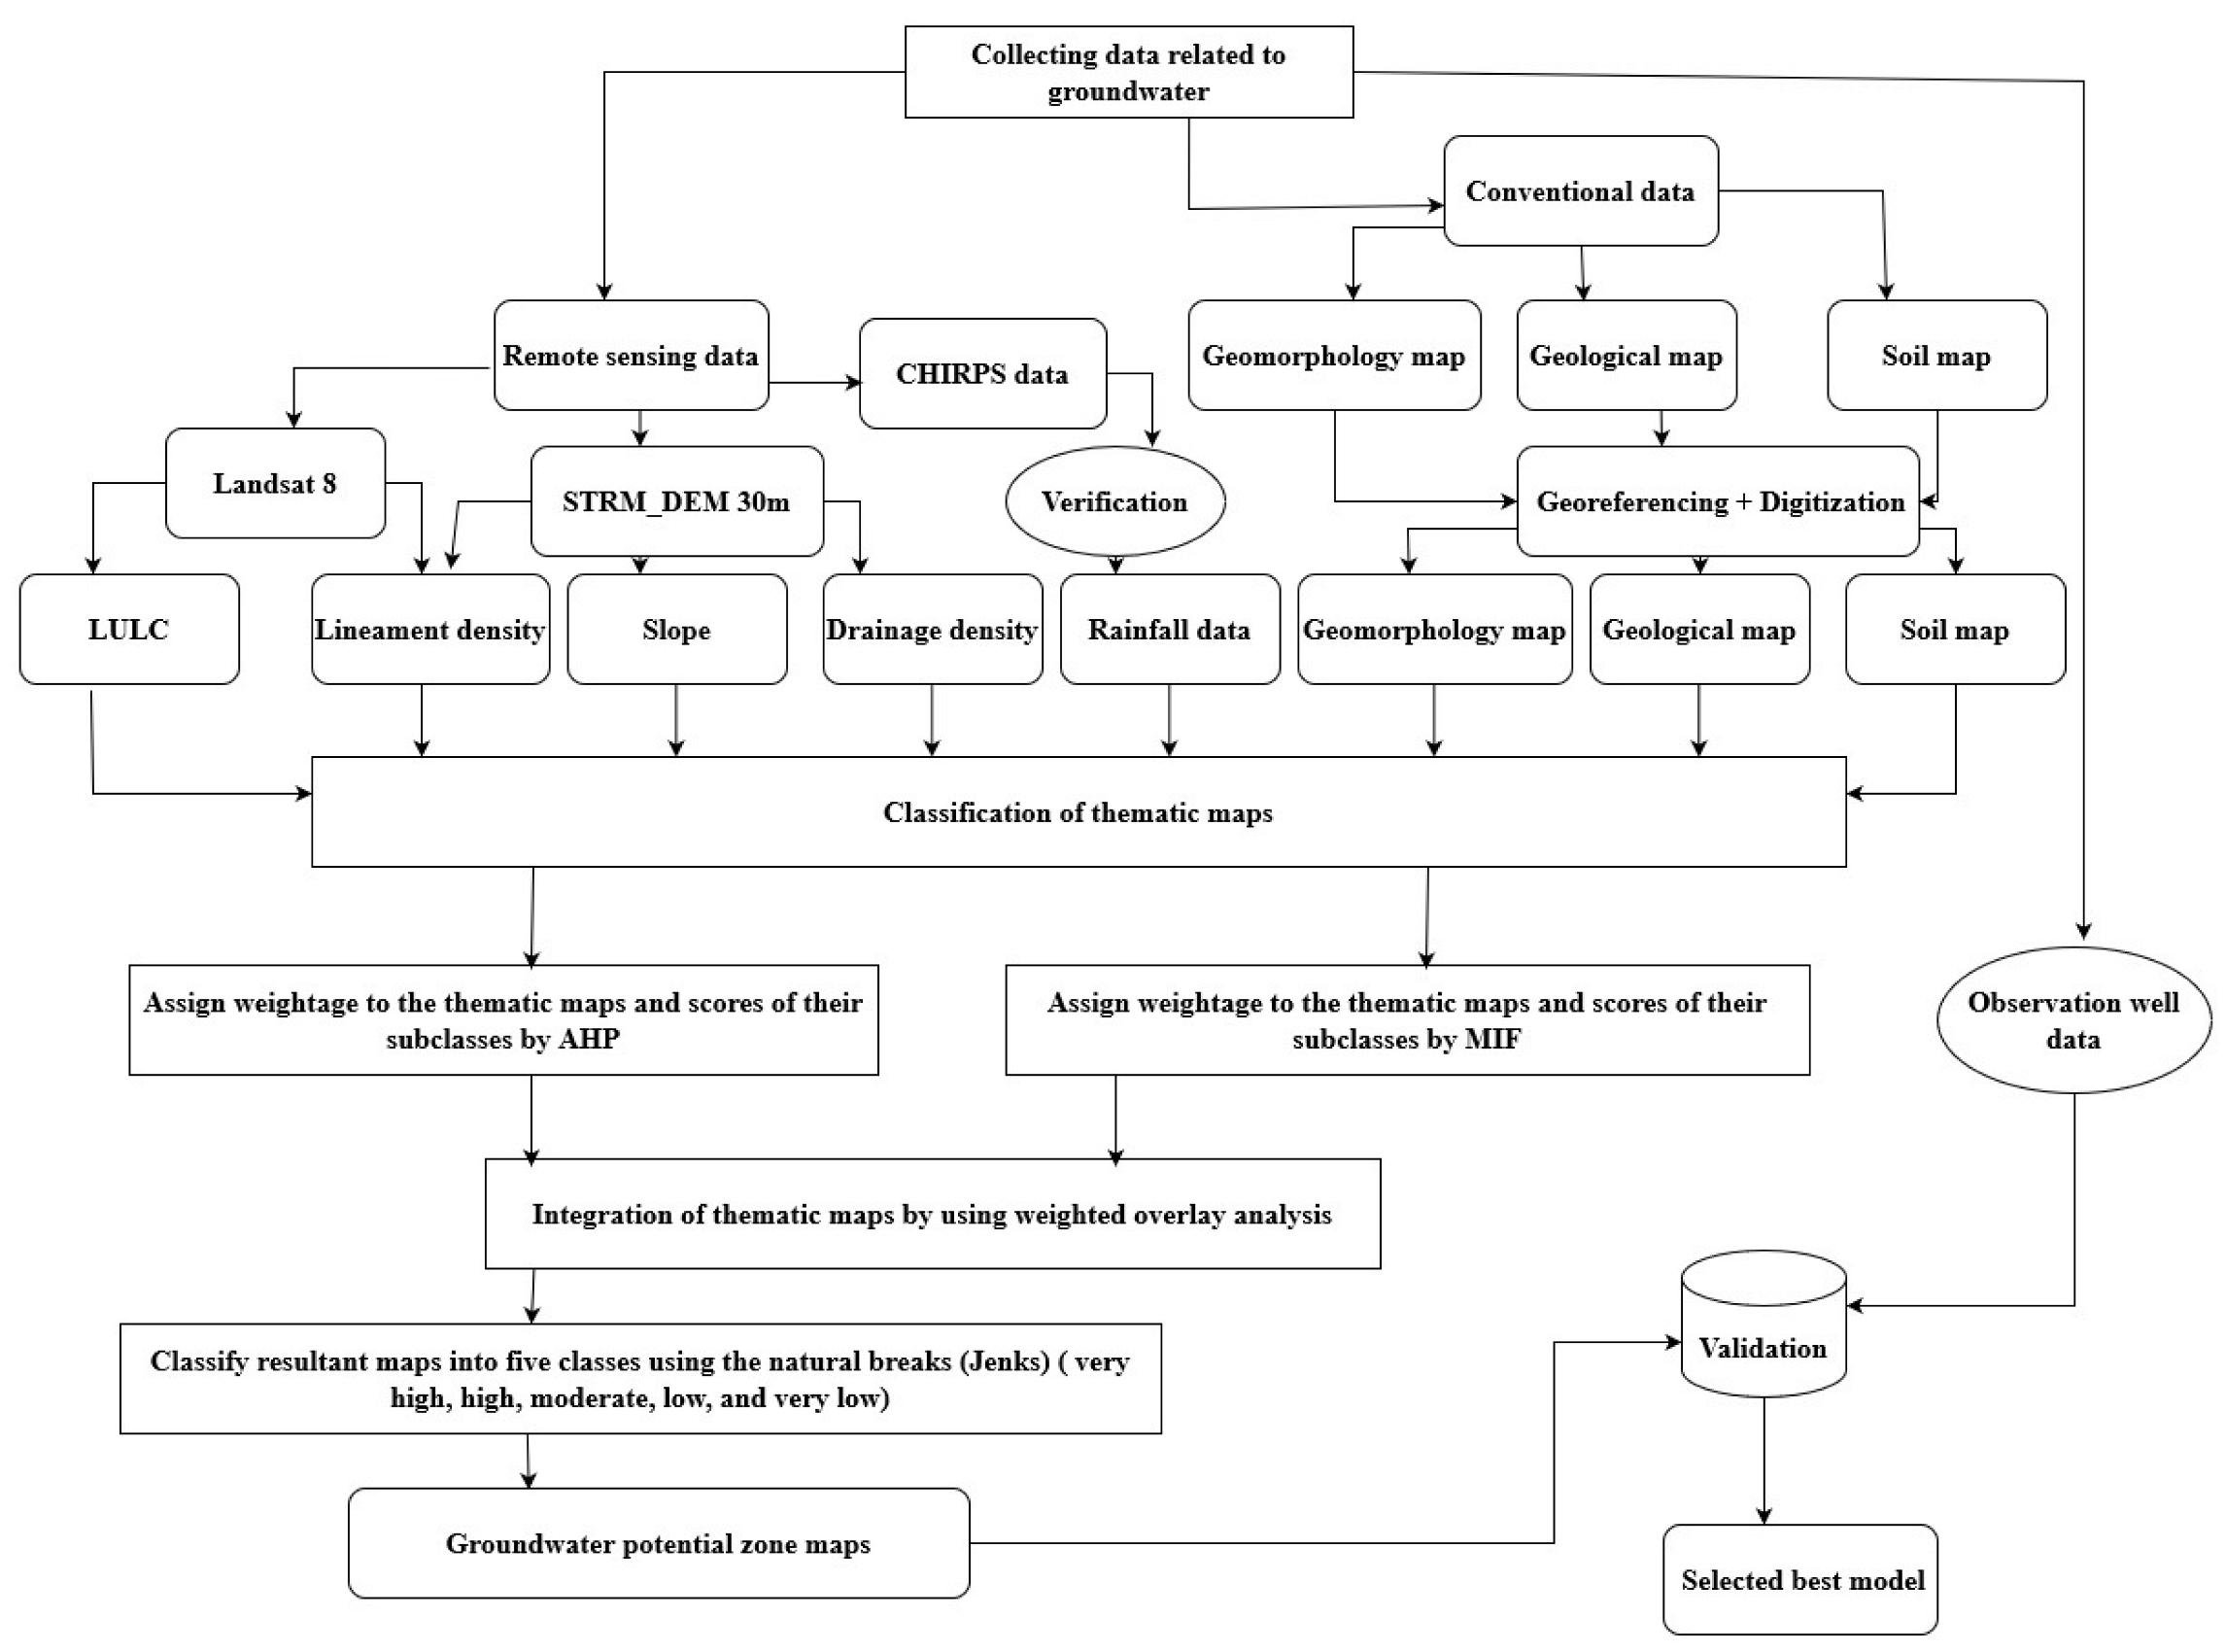
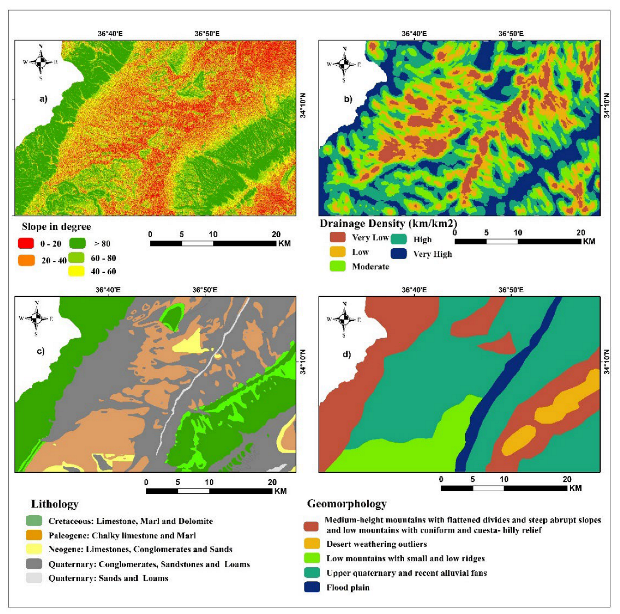
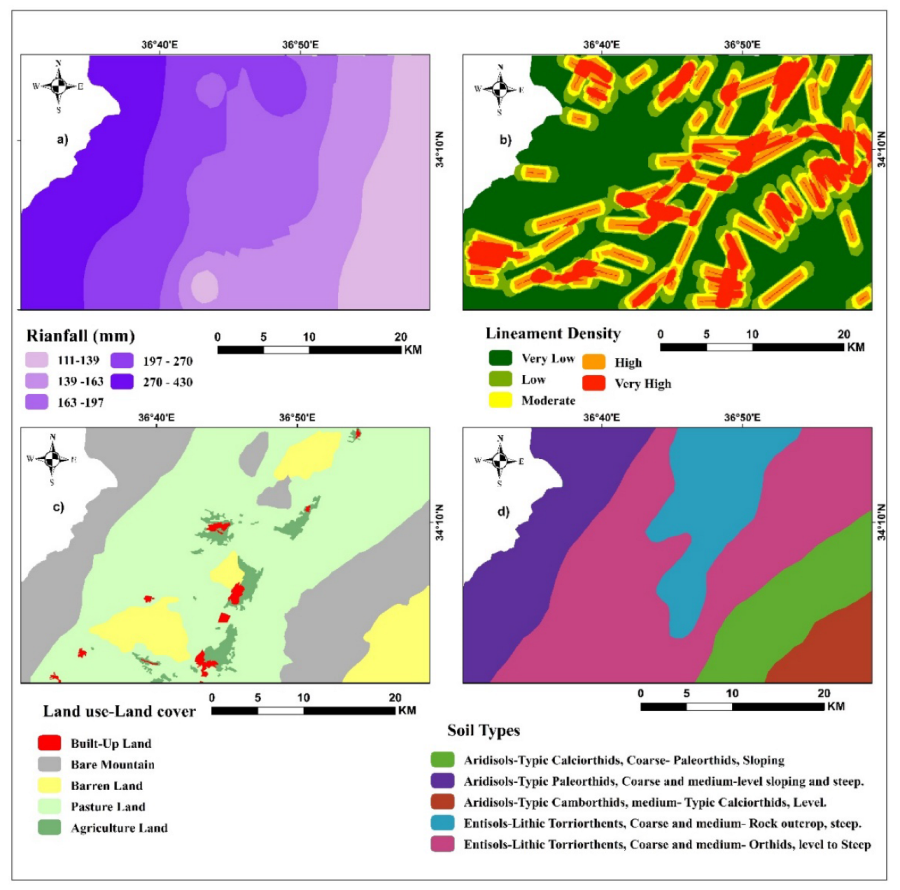
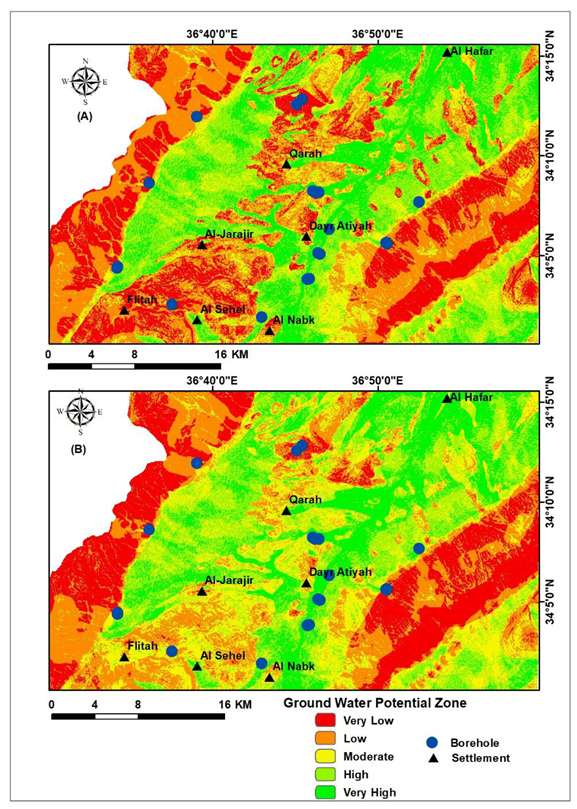
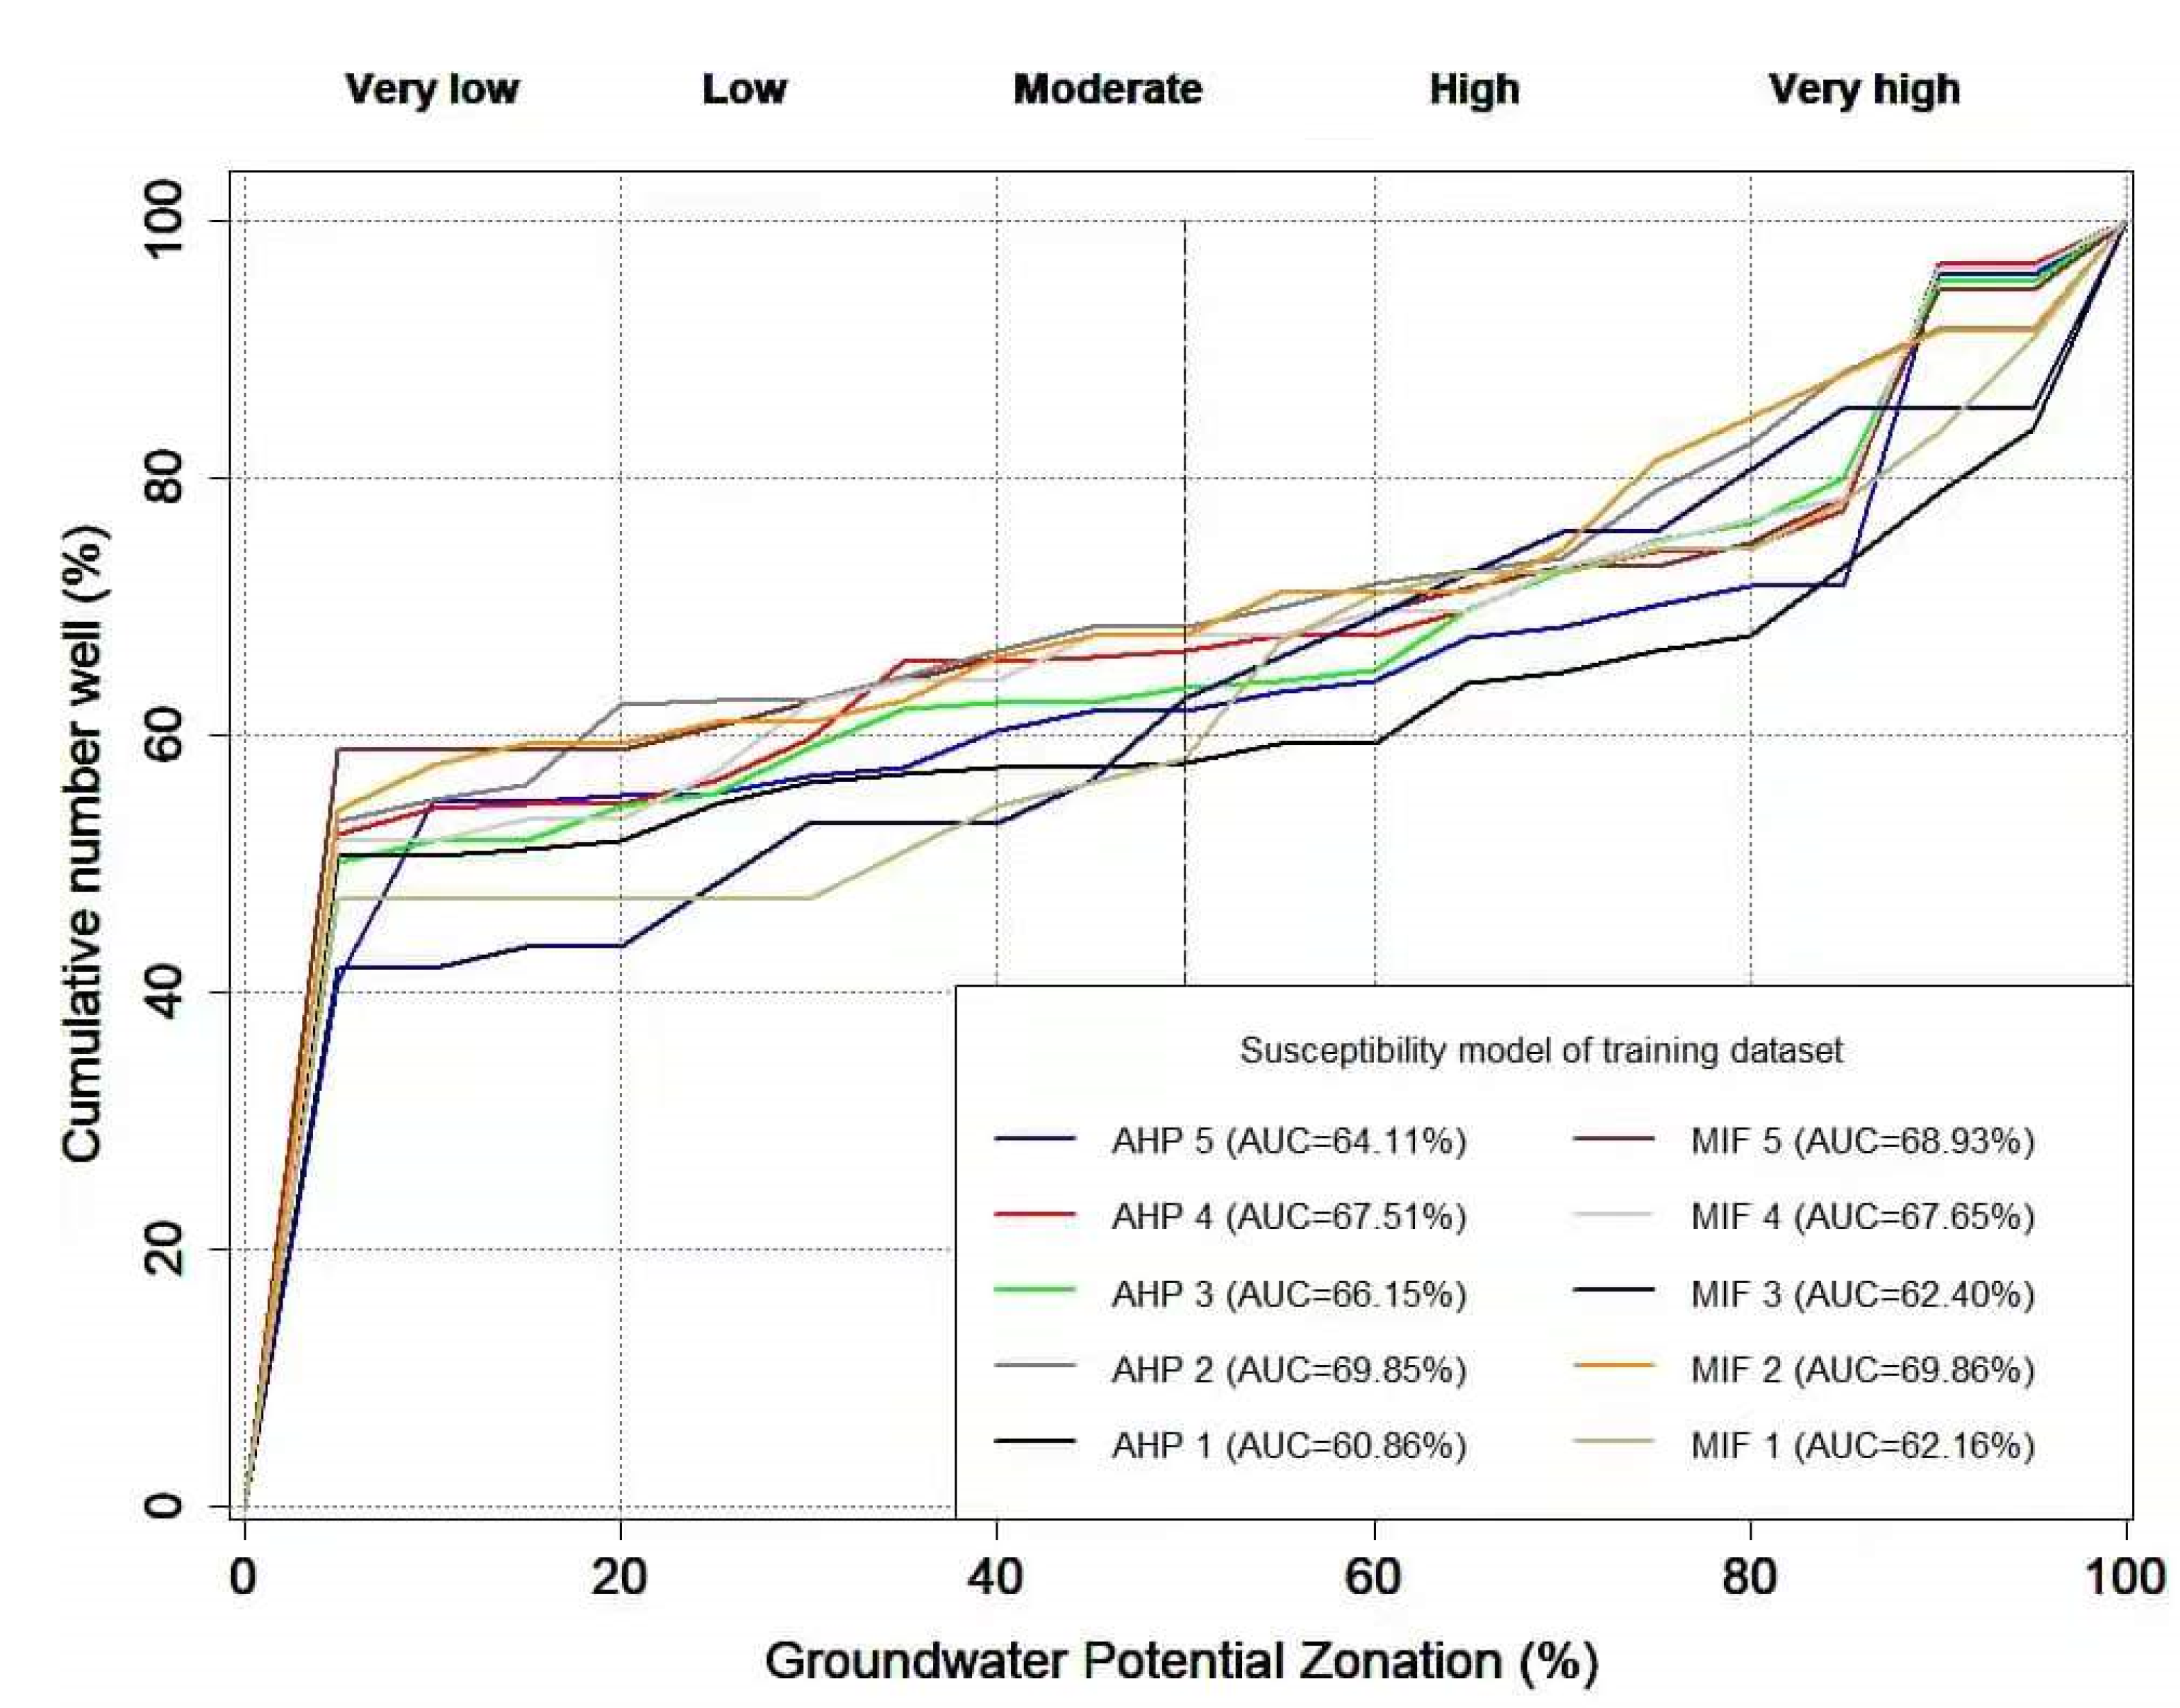
| Factors | Major Effect (j) | Minor Effect (n) | Proposed Relative Rate (j + n) | Proposed Score |
|---|---|---|---|---|
| Lithology | 1 + 1 + 1 + 1 | 0.5 | 4.5 | 20 |
| Slope | 1 + 1 + 1 | 0.5 + 0.5 | 4 | 18 |
| Drainage Density | 1 + 1 + 1 | 0.5 | 3.5 | 15 |
| Geomorphology | 1 + 1 | 0.5 + 0.5 | 3 | 13 |
| LULC | 1 + 1 | 0.5 | 2.5 | 11 |
| Lineament Density | 1 + 1 | 0.0 | 2 | 9 |
| Rainfall | 1 | 0.5 | 1.5 | 7 |
| Soil | 1 | 0.5 | 1.5 | 7 |
| Total | = 22.5 | 100 |
| Factors | LI | SLP | DD | GM | LULC | LD | RN | SL |
|---|---|---|---|---|---|---|---|---|
| Lithology (LI) | 1 | 2 | 3 | 3 | 5 | 5 | 7 | 9 |
| Slope (SLP) | 1/2 | 1 | 2 | 3 | 3 | 5 | 5 | 7 |
| Drainage (DD | 1/3 | 1/2 | 1 | 3 | 3 | 3 | 5 | 5 |
| Geomorphology (GM) | 1/3 | 1/3 | 1/3 | 1 | 2 | 3 | 4 | 5 |
| Land use and Land cover (LULC) | 1/5 | 1/3 | 1/3 | 1/2 | 1 | 3 | 5 | 5 |
| Lineaments (LD) | 1/5 | 1/5 | 1/3 | 1/3 | 1/3 | 1 | 2 | 3 |
| Rainfall (RN) | 1/7 | 1/5 | 1/5 | 1/4 | 1/5 | 1/2 | 1 | 3 |
| Soil (SL) | 1/9 | 1/7 | 1/5 | 1/5 | 1/5 | 1/3 | 1/3 | 1 |
| SUM | 2.82 | 4.71 | 7.40 | 11.28 | 14.73 | 20.83 | 29.33 | 38 |
| Scale for Importance | Scale |
|---|---|
| Equally important (EI) | 1 |
| Weakly more important (WMI) | 3 |
| Strongly more important (SMI) | 5 |
| Very strongly more important (VSMI) | 7 |
| Absolutely more important (AMI) | 9 |
| Intermediate scale | 2,4,6,8 |
| Factor | LI | SLP | DD | GM | LULC | LD | RN | SL | Weight | Weight % |
|---|---|---|---|---|---|---|---|---|---|---|
| LI | 0.35 | 0.43 | 0.40 | 0.27 | 0.34 | 0.24 | 0.24 | 0.24 | 0.31 | 31 |
| SLP | 0.18 | 0.21 | 0.27 | 0.26 | 0.20 | 0.24 | 0.17 | 0.18 | 0.21 | 21 |
| DD | 0.12 | 0.11 | 0.13 | 0.27 | 0.20 | 0.15 | 0.17 | 0.13 | 0.16 | 16 |
| GM | 0.12 | 0.07 | 0.05 | 0.09 | 0.14 | 0.14 | 0.14 | 0.13 | 0.11 | 11 |
| LULC | 0.07 | 0.07 | 0.04 | 0.04 | 0.07 | 0.14 | 0.17 | 0.13 | 0.09 | 9 |
| LD | 0.07 | 0.04 | 0.05 | 0.03 | 0.02 | 0.05 | 0.07 | 0.08 | 0.05 | 5 |
| RN | 0.05 | 0.04 | 0.03 | 0.02 | 0.02 | 0.02 | 0.03 | 0.08 | 0.04 | 4 |
| SL | 0.04 | 0.03 | 0.03 | 0.02 | 0.01 | 0.02 | 0.01 | 0.03 | 0.03 | 3 |
| SUM | 1 | 1 | 1 | 1 | 1 | 1 | 1 | 1 | 1 | 1 |
| n | 1 | 2 | 3 | 4 | 5 | 6 | 7 | 8 | 9 | 10 |
| RI | 0 | 0 | 0.58 | 0.90 | 1.12 | 1.24 | 1.32 | 1.41 | 1.49 | 1.51 |
| Factors | Sub-Classes | MIF | AHP | ||
|---|---|---|---|---|---|
| Weight | Score | Weight | Rank | ||
Lithology | Quaternary sands, loams | 20 | 20 | 31 | 9 |
| Quaternary conglomerates, sandstones, loams | 16 | 7 | |||
| Cretaceous limestone, marl dolomites | 12 | 5 | |||
| Neogene limestone, conglomerates, sands | 8 | 3 | |||
| Paleogene Chalky limestone, marls | 4 | 1 | |||
Slope | 80–87 | 18 | 2 | 21 | 1 |
| 60–80 | 6 | 3 | |||
| 40–60 | 10 | 5 | |||
| 20–40 | 14 | 7 | |||
| 0–20 | 18 | 9 | |||
Drainage Density | Very Low | 15 | 15 | 16 | 9 |
| Low | 12 | 7 | |||
| Medium | 9 | 5 | |||
| High | 6 | 3 | |||
| Very High | 3 | 1 | |||
Geomorphology | Flood plain | 13 | 13 | 11 | 9 |
| Upper quaternary and recent alluvial fans | 10 | 7 | |||
| Low mountains with small and low ridges | 7 | 5 | |||
| Desert weathering outliers | 4 | 3 | |||
| Low mountains with coniform and cuesta-hilly relief | 1 | 1 | |||
| Medium-height mountains with flattened divides and steep abrupt slopes | 1 | 1 | |||
LULC | Built-Up Land | 11 | 3 | 9 | 1 |
| Bare Mountain | 5 | 3 | |||
| Barren Land | 7 | 5 | |||
| Pasture Land | 9 | 7 | |||
| Agriculture Land | 11 | 9 | |||
Lineament Density | Very Low | 9 | 1 | 1 | |
| Low | 3 | 5 | 3 | ||
| Medium | 5 | 5 | |||
| High | 7 | 7 | |||
| Very High | 9 | 9 | |||
Rainfall (mm) | 270–430 | 7 | 7 | 4 | 9 |
| 197–270 | 6 | 7 | |||
| 163–197 | 5 | 5 | |||
| 139–163 | 4 | 3 | |||
| 111–139 | 3 | 1 | |||
Soil | Entisols-Lithic Torriorthents, Coarse and medium—Orthids, level to Steep. | 7 | 7 | 3 | 9 |
| Entisols-Lithic Torriorthents, Coarse and medium—Rock outcrop, steep. | 6 | 7 | |||
| Aridisols-Typic Camborthids, medium—Typic Calciorthids, Level. | 5 | 5 | |||
| Aridisols-Typic Paleorthids, Coarse and medium-level sloping and steep. | 4 | 3 | |||
| Aridisols-Typic Calciorthids, Coarse—Paleorthids, Sloping. | 3 | ||||
Publisher’s Note: MDPI stays neutral with regard to jurisdictional claims in published maps and institutional affiliations. |
© 2022 by the authors. Licensee MDPI, Basel, Switzerland. This article is an open access article distributed under the terms and conditions of the Creative Commons Attribution (CC BY) license (https://creativecommons.org/licenses/by/4.0/).
Share and Cite
Alrawi, I.; Chen, J.; Othman, A.A. Groundwater Potential Zone Mapping: Integration of Multi-Criteria Decision Analysis (MCDA) and GIS Techniques for the Al-Qalamoun Region in Syria. ISPRS Int. J. Geo-Inf. 2022, 11, 603. https://doi.org/10.3390/ijgi11120603
Alrawi I, Chen J, Othman AA. Groundwater Potential Zone Mapping: Integration of Multi-Criteria Decision Analysis (MCDA) and GIS Techniques for the Al-Qalamoun Region in Syria. ISPRS International Journal of Geo-Information. 2022; 11(12):603. https://doi.org/10.3390/ijgi11120603
Chicago/Turabian StyleAlrawi, Imad, Jianping Chen, and Arsalan Ahmed Othman. 2022. "Groundwater Potential Zone Mapping: Integration of Multi-Criteria Decision Analysis (MCDA) and GIS Techniques for the Al-Qalamoun Region in Syria" ISPRS International Journal of Geo-Information 11, no. 12: 603. https://doi.org/10.3390/ijgi11120603
APA StyleAlrawi, I., Chen, J., & Othman, A. A. (2022). Groundwater Potential Zone Mapping: Integration of Multi-Criteria Decision Analysis (MCDA) and GIS Techniques for the Al-Qalamoun Region in Syria. ISPRS International Journal of Geo-Information, 11(12), 603. https://doi.org/10.3390/ijgi11120603


