Abstract
This study proposes a new model for land suitability for educational facilities based on spatial product development to determine the optimal locations for achieving education targets in West Java, Indonesia. Single-aspect approaches, such as accessibility and spatial hazard analyses, have not been widely applied in suitability assessments on the location of educational facilities. Model development was performed based on analyses of the economic value of the land and on the integration of various parameters across three main aspects: accessibility, comfort, and a multi-natural/biohazard (disaster) risk index. Based on the maps of disaster hazards, higher flood-prone areas are found to be in gentle slopes and located in large cities. Higher risks of landslides are spread throughout the study area, while higher levels of earthquake risk are predominantly in the south, close to the active faults and megathrusts present. Presently, many schools are located in very high vulnerability zones (2057 elementary, 572 junior high, 157 senior high, and 313 vocational high schools). The comfort-level map revealed 13,459 schools located in areas with very low and low comfort levels, whereas only 2377 schools are in locations of high or very high comfort levels. Based on the school accessibility map, higher levels are located in the larger cities of West Java, whereas schools with lower accessibility are documented far from these urban areas. In particular, senior high school accessibility is predominant in areas of lower accessibility levels, as there are comparatively fewer facilities available in West Java. Overall, higher levels of suitability are spread throughout West Java. These distribution results revealed an expansion of the availability of schools by area: senior high schools, 303,973.1 ha; vocational high schools, 94,170.51 ha; and junior high schools, 12,981.78 ha. Changes in elementary schools (3936.69 ha) were insignificant, as the current number of elementary schools is relatively much higher. This study represents the first to attempt to integrate these four parameters—accessibility, multi natural hazard, biohazard, comfort index, and land value—to determine potential areas for new schools to achieve educational equity targets.
1. Introduction
Education is a basic human right, playing a significant socio-economic role in each nation. Several studies have shown the strategic role of education in improving the quality of life and economy [1,2]. Furthermore, research in Indonesia has shown that education level affects an individual’s welfare levels [3,4]; however, there are still numerous impediments afflicting some developing countries. For example, the South Asian region had the highest dropout rate, totaling to 11.32 million children in 2014 [5]. Unsurprisingly, the COVID-19 pandemic has worsened the conditions. Some developing countries, such as Indonesia, are experiencing severe educational problems with the current online learning systems, experiencing even higher dropout rates in virtual classes [6]. The main issues lie in the unpreparedness of facilities and lack of experience, as appropriate adaptations of the learning process can require a significant amount of time to implement. In addition, regional differences in internet coverage have exacerbated the condition of education during the pandemic, as some locations do not even meet the most basic requirements [7,8]. Due to the urgency of these global education issues, the United Nations has included quality education as one of the targets of the Sustainable Development Goals [9]. Such programs are necessary, considering that access to education is a long-term investment for achieving equitable quality human resource development [10].
The predominantly young demographic of Indonesia can be viewed as a tremendous opportunity that can only be acquired with a corresponding increase in the quality of resources available [11]. Namely, raising the performance of the Indonesian educational system is crucial for individuals to reach higher-income status. Recently, the Indonesian government has increased the education budget, reaching IDR 505.8 trillion (USD 35.5 billion) in 2020 or 20% of the state revenue and expenditure budget [12]. Improving rural infrastructure, expanding access to quality education, and labor market mobility could all boost the earnings of vulnerable families, helping to combat inequality.
In addition to accessibility, several other parameters should be used when planning the distribution and construction of educational facilities. As Indonesia is particularly vulnerable to natural disasters and environmental change [13], both must be considered in any realistic analyses. For example, vulnerability to earthquakes is high due to the numerous active faults in the surrounding area [13] and this is worsened by the presence of a subduction zone in South Java Island [14]. Geomorphological conditions and high rates of urbanization also increase the risk of other natural disasters, such as floods and landslides [15,16]. Such disasters can threaten the safety and security of educational continuity if left unacknowledged. In addition to disasters, a comfort aspect must be considered when designing the distribution of new educational facilities due to worsening environmental problems, including increasing atmospheric pollution [17], temperatures [18,19], and noise [20,21]. Air pollution can trigger respiratory disorders [22], potentially interfering with educational activities and students’ capture power [23,24]. Several studies have also shown a negative correlation between classroom temperature and student performance [25]. In addition, noise is an important performance factor for both students and teachers [26], yet convenience often sets new schools near noisier locations. Therefore, a comprehensive, multiparameter approach is required for optimizing new school locations with appropriate designs.
Single-aspect approaches, such as accessibility and spatial hazard analyses, have not been widely applied in suitability assessments on the location of educational facilities. For example, Prasetyo et al. [27] integrated a spatial approach in planning access to education, developing a model for selecting school lands using a multi-criteria decision analysis and a public participatory approach. Samad et al. [28] integrated AHP and GIS methods to conduct a land suitability analysis on existing and potential school locations in the Perlis area, Malaysia, using three levels of suitability values. Barthellos et al. [29] applied a multi-hazard assessment method to increase the sensitivity of spatial products and focus on urban development. This approach maintains great potential for developing new access to education. Furthermore, by examining the resilience of school buildings with respect to various potential disasters, losses in construction costs can be minimized.
From an analysis of previous research employing spatial technology to assess the development in the education sector, a suitable method can be developed; however, to date, few researchers have included such a factor. Additionally, integrating multiple natural hazards and biohazards, particularly with respect to conditions of the COVID-19 pandemic, can significantly influence the results as well. Due to the importance of sensitivity in developing spatial products via land suitability analyses, the present study aimed to build an educational land suitability model based on three primary aspects: accessibility, multi-disaster resilience, and convenience. During product development, a distribution scenario of new schools also considered an analysis of the economic value of the land. This study represents the first to attempt to integrate these four parameters—accessibility, multi-natural hazard and biohazards, comfort index, and land value—in determining potential areas for new schools to achieve educational equity targets. This research study can also serve as the foundation for other developmental strategies in a more strategic, comprehensive, and sustainable manner, especially regarding those on school facilities in different regions of Indonesia or similar countries.
2. Materials and Methods
2.1. Study Area
Indonesia’s education system is generally divided into two main groups: primary and higher education at the university level. Primary education consists of three stages: elementary school (SD, Sekolah Dasar), junior high school (SMP, Sekolah Menengah Pertama), and senior high school, which consists of an academic senior high school, henceforth referred to as a senior high (SMA, Sekolah Menengah Atas), and a vocational senior high school, henceforth referred to as a vocational high (SMK, Sekolah Menengah Kejuruan). The study area was located in the West Java Province, Indonesia (Figure 1), which necessitates a systematic effort to improve educational facility access. The unequal distribution to educational facilities and the high dropout rate are substantial obstacles in this region [30]. For example, out of 626 sub-districts in West Java, 35% had no public senior high school [31]. According to the Ministry of Education and Culture (Kemendikbud), 6030 West Javan students dropped out of school at the elementary level in the 2019/2020 academic year [4], an approximate 67% increase since the previous year (3596 students) [4]. Due to these conditions, the West Java provincial government launched various priority programs to increase educational access, which relates to the construction of new schools [32]. As West Java maintains the highest population and urbanization [11] rates in the country, coupled with its demographic diversity and a high level of disaster vulnerability [33], a comprehensive approach is demanded prior to designing the equitable and sustainable distributions of new schools.
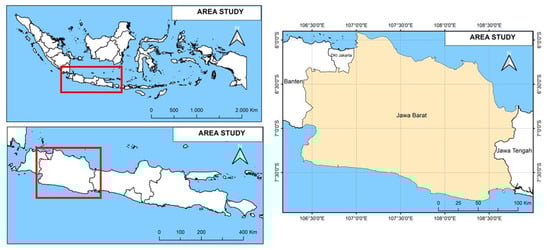
Figure 1.
Study area: West Java Province, Indonesia.
2.2. Data
Various geospatial data products were used and integrated to improve the sensitivity and accuracy of the results. Table 1 summarizes the characteristics of the data used and Table 2 shows the distribution of data use across the four main research objectives, namely the effective factors of erosion, floods, earthquakes, comfort, and school distance. Broadly speaking, these data products can be grouped into three major types: vector, static raster, and dynamic raster.

Table 1.
Summary of data types and sources.
Table 2.
Dataset use in the present research study.
2.2.1. Vector Data
This study used three types of vector data, namely points, lines, and polygons. Point data used are locations of schools, earthquake epicenters, COVID-19 case counts, and flood and landslide occurrences, whereas line data include roads, rivers, and fault lines. Meanwhile, administrative boundaries, watershed areas, soil types, and protected areas are all polygon data used in this study. Figure 2a shows the availability distribution maps for public elementary, junior high, senior high, and vocational high schools (point location data were obtained from the Educational Agency [34]). Elementary schools were the most abundant type of school compared to junior high, senior high, and vocational high schools (19,692; 5372; 1643; and 2938, respectively). Indonesia’s 9-year primary education level (from elementary to junior high) drives this pattern. Figure 2b shows aggregate points for COVID-19 patient locations, accumulating case information until December 2020, while Figure 2c shows earthquake data points including the location, date of occurrence, and magnitude. The earthquake data were derived from the USGS Earthquake Catalog [35], and was further reduced to earthquake magnitude data by interpolation. Figure 2c also describes food and landslide occurrence distribution from the National Agency for Disaster Management (BNPB).
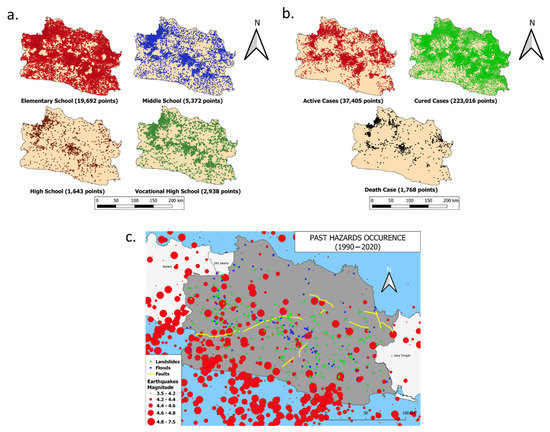
Figure 2.
(a) School locations across West Java (Source, Education Office of West Java); (b) COVID-19 cases from April–December 2020; and (c) distribution and magnitude of earthquakes, floods, and landslide occurrence, with major fault distributions.
Road data were used as a network layer to inform accessibility analyses, whereas river network data showed the river flow in West Java. Fault data showed the locations of the four active faults in West Java: Lembang, Garsela, Baribis, and Kendeng. Provincial and district administrative boundary data were obtained from the official government data produced by the Geospatial Information Agency [36]. Watershed data (DAS) contained information about areas bounded by a topographic barrier, united by its receipt, storage, and drainage of rainwater through a common river point. The soil type map [37] was differentiated based on the Fe/Al chemical component developed by the World Reference Base for Soil Resources (WRB). The World Database on Protected Areas (WDPA) [38] is the most current and comprehensive source of information on protected areas, updated monthly with submissions from international governments, NGOs, landowners, and communities. It is managed by the United Nations Environment Program’s World Conservation Monitoring Center (UNEP-WCMC), with support from the IUCN and its World Commission on Protected Areas (WCPA).
2.2.2. Static Raster
The static raster data consisted of a digital surface model (DSM) and population density. ALOS DSM 30 (AW3D30) [39], with a resolution of ~30 m (1 arcsec mesh), was used here to build maps of elevation and slope. Population density data (WorldPop [40]) consisted of contemporary, global high-resolution data on human population distributions. Such data is a prerequisite for accurately measuring the impact of population growth, monitoring changes, and planning interventions. Residential area data (Facebook CIESIN [41]) provided an estimation of human population distribution at a resolution of 1 arc-second (~30 m) for 2015, derived from recent census data and high-resolution (0.5 m) satellite imagery (Digital Globe). Such population grids provide a detailed delineation of settlements in urban and rural areas, which is useful for disaster response, humanitarian planning, and future development. Figure 3 shows the constraint analysis results for the protected and unpopulated areas. Protected area constraints (Figure 3a) generally pertained to natural forests of mountainous areas within the study region. Figure 3b shows the unpopulated locations as obtained from the Facebook CIESIN high-resolution settlement layer.
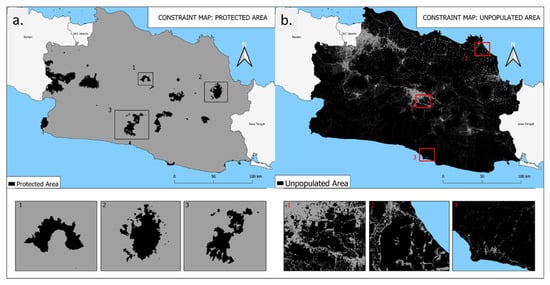
Figure 3.
Constraints of: (a) protected areas and (b) unpopulated areas.
2.2.3. Dynamic Raster Type Data
Dynamic raster data included land use land cover (LULC), rainfall, residential area, precipitation, land surface temperature (LST), and air pollution. For LULC, the MCD12Q1 V6 [42], Land Cover Type 1: Annual International Geosphere-Biosphere Program classification (16 classes), global product was used. In particular, the residential (predominantly housing) area product had a spatial resolution of 30 m. Precipitation data were used to determine the effectiveness of school distances, whereas Climate Hazards Group InfraRed Precipitation with Station data (CHIRPS) [43] is a 30+ year quasi-global rainfall dataset. CHIRPS incorporates 0.05° resolution satellite imagery with in situ station data to create a gridded rainfall time-series for trend analysis and seasonal drought monitoring. LST data can be observed through satellite imagery containing a thermal sensor. Here, LST data were acquired from Landsat-8 (30 m resolution) [44,45] and used to describe school comfort related to the optimal temperature. Air pollution data consisted of CO (carbon monoxide), NO2 (nitrogen dioxide), and SO2 (sulfur dioxide), which are all significant parameters of the air quality index, obtained from observations of the Sentinel-5 Precursor [46] and used here to further determine the comfort level of school areas.
2.3. Methodology
2.3.1. New School Location Suitability
Data processing underwent four analytical stages: disaster, comfort, accessibility, and land suitability. Figure 4 shows an overview of the research methodology used in this study. Geographic information systems (GIS) provided data processing tools for analyses and assessments of each research stage. A multi-criteria decision analysis (MCDA) was employed for model building. Its more comprehensive range of application lies in its dependence on a set of environmental parameters determined by the analyst [49]. The sub-methods used to calculate each criterion included multi-hazard assessments, overlays, and network analyses. Furthermore, a new school location suitability analysis was conducted for local government recommendation with respect to these three primary aspects: security from natural disasters, comfort, and accessibility. Several scenarios were used to determine the suitability of school locations under various economic conditions to obtain a more accurate depiction of conditions after construction and to serve as a basis for both local governments and policymakers when placing new schools. The disaster analysis contained a synthesis of spatial data to produce a map of disaster vulnerability levels within each academic unit; the comfort analysis synthesized data on air quality, noise, and temperature; the accessibility analysis measured the distance from a school using the network analysis method; and the land suitability study contained a synthesis of these three aspects to obtain an overall fitness of each area in West Java Province.
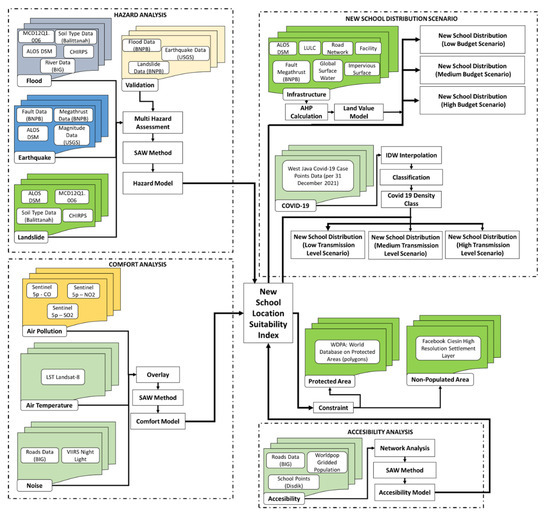
Figure 4.
Flow chart of the methodology employed.
2.3.2. School Accessibility Analysis
The accessibility analysis was based on a new government regulation (Minister of Education Regulation no. 23/2013) [50] regarding a maximum school distance from the residential area. These 12 regulations suggest that a primary school must exist ≤3 km from a residential, urban area, whereas secondary schools must be within ≤6 km. The regulation only applies to schools in urban areas, whereas most of the areas in our study consist of urban and rural areas. Due to this, we used an extended definition in rural areas from a minimum distance of 3 km to 5 km for primary schools and 6 km to 10 km for secondary schools. We reason that using the default distances defined by the government regulation for rural areas would result in many potential areas being analyzed unfavorably and extending the definitions would avoid this issue. The accessibility analysis employed a multi-network at each school point location (elementary, junior high, senior high, and vocational high school). Current school accessibility was then categorized by area: ≤5 km radius was considered a higher level of school availability; between 5 and ≤10 km were deemed moderate levels of school availability; and those >10 km were termed low school availability. The results of this accessibility categorization were in the form of different scores for each class. Furthermore, the accessibility results were associated with population density data, classified into five classes using the quantile method. The next stage was the reduction of two accessibility layers to produce a single one showing the balance of supply (school availability) and demand (population density levels).
2.3.3. Multi-Natural Hazard Analysis
A multi-hazard analysis was then conducted, focusing on several types of disasters, including floods, earthquakes, and landslides. Generally, parameters for each type of disaster were determined based on a literature study and merged into an overall disaster map. The parameters used for the flood disaster analysis were land cover, soil type, slope, elevation, rainfall, and river density. The LULC type most affected by flooding was settlements, whereas forests and waters were the least affected. Soil types were split into five categories based on their sensitivity to water intrusion, varying from insensitive to very sensitive: insensitive soil types consisted of alluvial, planosol, gray hydromorph, and groundwater laterite; slightly sensitive soil types consisted of latosol; moderately sensitive soil types consisted of brown forest and Mediterranean soils; sensitive soil types consisted of andosol, laterite, grumosol, podsol, and podzolic; and very sensitive soil types consisted of regosol, litosol, organosol, and renzina. The sloping contours tended to hold water longer, thus increasing the likelihood of flooding, whereas steeper contours tended to displace water in lower elevation areas, thus flooding probability was low. The primary determining factor of flooding was the intensity of rainfall [51]. Furthermore, low river densities can also cause flooding. River density (DD) was calculated according to Equation (1):
where ΣL is the sum of river flow lengths and A is the basin area. The quantile classification method was used for scoring parameters with numerical values (slope, elevation, rainfall, and river density). This approach is advantageous because of its uniform representation on the map, simplifying class calculations [52]. Moreover, the quantile method also aims to standardize parameter values with different units and measurement methods, ranging from 1–5 in the present analysis. The simple additive weighting (SAW) method, often used to complete multi-attribute decision-making [51], was employed here to combine each parameter and was calculated according to Equation (2):
where the weight value was modified from Darmawan et al. [53]. The validation of the results involved flood point data from the BNPB. The landslide disaster analysis used slope, land use, soil type, and rainfall parameters. Upland land cover was the most likely to cause landslides, while plantations, mixed gardens, settlements, and rice fields also had landslide potential. Soil erodibility was another reference for categorizing soil type, varying with land use and changing over time: high erodibility soils include regosol; moderate erodibility includes andosol, glei hummus, Mediterranean, and podzolic soil types; and low erodibility includes alluvial, latosol, and grumosol soil types. High rainfall could cause landslides, as the slip surface is exposed to water and causes the ground above to move. Parameter values ranged from 1 to 5 and the distribution of the score values was obtained using the quantile method. A similar SAW method technique for combining all the parameters was used (Equation (2) and validation was conducted using landslide point data from the BNPB. The weight value was modified from Kusratmoko [54]. The earthquake analysis parameters used were the distance from the fault, distance from megathrust, elevation, slope, and magnitude. The closer a place is to a fault, the greater the potential earthquake damage [55]. West Java has four active faults spreading throughout the region and a megathrust located in the southern part, especially in the Indian Ocean, increasing the earthquake potential. The recorded magnitude of previous events could indicate how large an earthquake may be and the spatial interpolation of these magnitudes produced a raster map for further calculations. In particular, the slope elevation and slope were also very influential, where the higher the elevation and slope angle, the greater the potential for damage caused by the earthquake. The standardization of the parameter values used was 1–5. Similarly, the distribution of the score values was obtained using the quantile method and the SAW method technique of combining all the parameters was used here as well (Equation (2). Validation was conducted and obtained using earthquake point data from the USGS.
2.3.4. Biohazard: Dynamic COVID-19 Model
A biohazard analysis was employed to measure the transmission level of COVID-19 in West Java using case point distributions. The assumptions used in the study aimed to anticipate future developments in the short term, while the COVID-19 pandemic is still ongoing. Accordingly, it will be necessary to build schools in areas with low COVID-19 transmission rates, mainly because children and adolescents are the lowest priority in vaccination efforts focused on health workers, teaching staff, the elderly, and the vulnerable. COVID-19 case locations were obtained from the Information and Coordination Center West Java Province (Pikobar) [48]. The first step was the rasterization of COVID-19 points, with each pixel containing the number of corresponding cases. Rasterized data was created via inverse distance weighted (IDW) interpolation to produce case densities across West Java, helping to further constrain the location of new schools.
2.3.5. Air, Noise, and Temperature Comfort Analysis
The comfort analysis consisted of air pollution, noise level, and temperature analyses. General air pollutant data came from Sentinel-5P and included CO, NO2, and SO2. Sentinel-5P data have been used in various previous studies to measure and monitor air quality. For example, Zheng et al. [56] and Kaplan et al. [57] used NO2 data to measure the impact factor on air quality. In contrast, Kaplan et al. [58] used Sentinel-5P data to analyze the relationship between pollutants, geographic, and social data. CO is a byproduct of fuel combustion in cars or trucks, small engines, stoves, lanterns, grills, fireplaces, gas ranges, or furnaces, potentially building up indoor and poisoning inhabitants [59]. NO2 is one of several nitrogen oxides and an intermediate in the industrial synthesis of nitric acid, millions of tons of which are produced each year for use primarily in the production of fertilizers. At higher temperatures, it is a reddish-brown gas [60]. SO2 is a toxic gas that is naturally released by volcanic activity and also produced as a by-product of copper extraction and fossil fuel (namely coal) combustion. All pollutant data generated from the Sentinel-5P sensor were obtained using the Google Earth Engine platform. The pixel average throughout 2019 was used to represent pollution levels under normal conditions, as 2020 patterns were severely affected by the COVID-19 lockdown. The data were then split into a five-level quantile classification. Next, the three data points were combined by averaging them to obtain an overall air pollution map.
Noise analysis was performed using road and airport location data. The former were divided into major roads (those that can be passed by all types of motorized vehicles and thus are noisier) and local roads (roads that cannot be passed by heavy cars). Next, the buffer data were used to represent the range of noise levels by mean. The three buffer results (major roads, local roads, and airports) were overlaid and scored. The highest score (5) covered all three sources, whereas the lowest (1) covered only a single source. The temperature analysis was based on Landsat-8 imagery to extract LST values using the retrieval algorithm proposed by Jimenez-Munoz et al. [44] and Rajeshwari and Mani [45], expressed through Equations (3) and (4)):
where TB is the brightness temperature (temperature band 10, landsat 8); λ is the emission wavelength (0.0015); C2 is h x c/s = 1.4388 × 10⁻² m·K; and e is emissivity = 0.004 × Pv + 0.986, where
3. Results
3.1. School Accessibility
School accessibility modeling is the first step taken to investigate the current state of access to education in West Java. Figure 5 shows the population distribution based on age groups in West Java at 30 m resolution. Ages were divided into five groups: baby–toddler (0–5 year old), child (6–9 year old), teenager (10–24 year old), adult (25–59 year old), and elderly (>59 year old). Based on the analysis, the population density ranged from 0 to 43 people per 900 m2. Teenager and adult groups also varied more compared to the other three groups. The results were then combined with school availability distribution data to determine the balance between supply and demand in the research area. The result of combining these two maps was the school accessibility map (Figure 6). Accessibility levels ranged from very low to very high, with the former indicating information related to high population size and a lack of school availability. The latter is related to the size of the population and the sufficient availability of schools. Elementary schools maintained the highest level of accessibility across almost all areas in West Java. Areas with the highest priority for new school construction are thus those with low or no accessibility to achieve equal distribution.
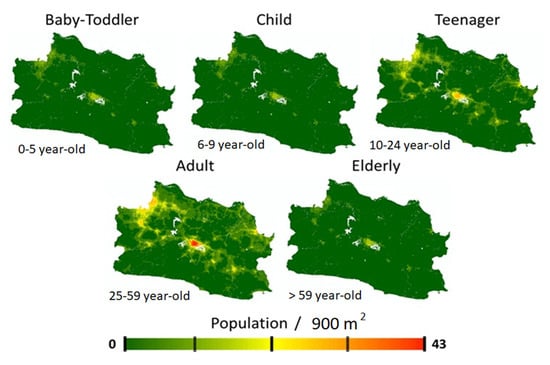
Figure 5.
Distribution of population density based on age group.
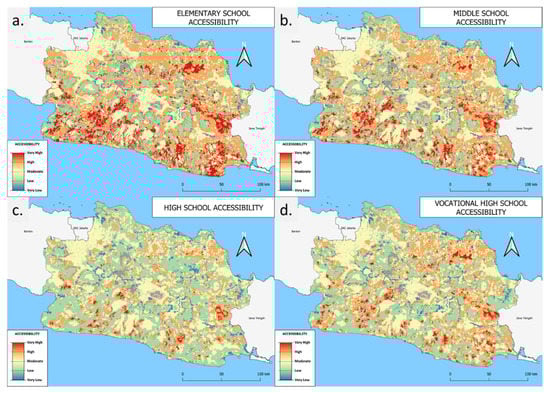
Figure 6.
School accessibility for: (a) elementary, (b) junior high, (c) senior high, and (d) vocational high schools.
3.2. Multi-Hazard Index Analysis
High levels of variability were recorded for flood susceptibility (Figure 7a), with a greater tendency of floods in the western and northern parts of the study area, with relatively flat to gentle slope conditions, poorer soil water absorption and drainage, more built-up lands, and stronger rainfall conditions. Very low levels of flood risk were confined to the southern region, generally dominated by hilly and montane topography. Figure 7b shows the class division earthquake vulnerability, with higher levels recorded in the south due to the larger number of active faults scattered throughout the area. The existence of a megathrust zone in the South Java Sea also increases local earthquake vulnerability. The history of large earthquakes in the southern region also contributes to its higher levels of vulnerability. Lower risk levels were recorded in the northern part of the research area. Figure 7c shows that the high to very high landslide susceptibility levels were relatively evenly distributed across almost all areas of West Java, mainly deriving from the dominance of hilly and mountainous terrain. These areas tended to have very high rainfall, slopes, and soil erodibility potential. In addition, changes in land use exacerbate these conditions by replacing the function of native plants’ roots as a binder of soil and rock aggregates with certain seasonal, weaker rooted plants, or dry agricultural land. Several historical records also show numerous previous occurrences and high landslide points in the study area.
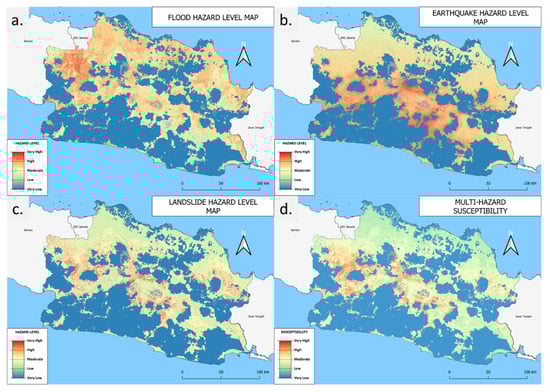
Figure 7.
Disaster hazard distribution for: (a) floods, (b) earthquakes, (c) landslides, and (d) the total multi-hazard susceptibility index.
Meanwhile, the northern area is dominated by low sloping relief, resulting in decreased landslide susceptibility. Accordingly, landslide vulnerability is essential to any suitability analysis when building new schools due to the relatively even distribution of high-risk areas. A multi-hazard susceptibility index analysis (Figure 7d) and multi-hazard probability map (Figure 8) was carried out for floods, earthquakes, and landslide disaster potential, collectively maintaining the highest frequency in the research area. Disaster potential was then grouped from very low to very high. Overall, the northern area maintained the lowest overall disaster vulnerability, yet the current distribution of schools is still mostly in disaster-prone regions (Figure 9).
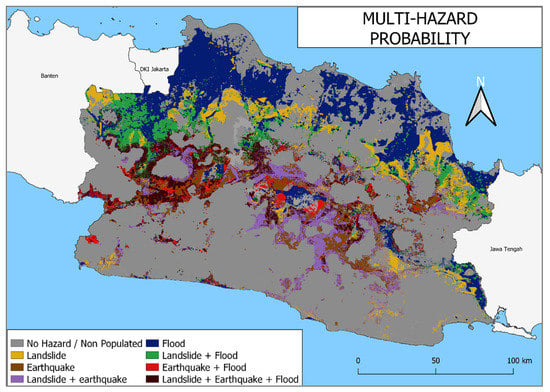
Figure 8.
Multi-hazard probability map of landslides, earthquakes, and floods.
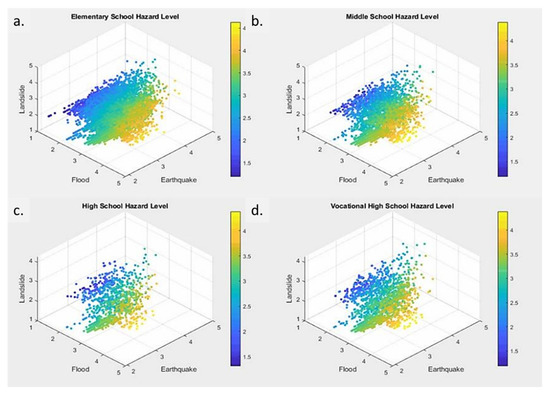
Figure 9.
School hazard level for: (a) elementary, (b) junior high, (c) senior high, and (d) vocational high schools.
3.3. Multi-Comfort Level Product
Figure 10 shows the results of the multi-comfort level product based on the analysis of air pollution, temperature, and noise level conditions in the research area. Figure 10a illustrates the total pollution value as a combination of CO, NO2, and SO2 data, showing that high pollution values were dominant in the northern and eastern regions, in addition to the spread of CO throughout the study area. This pollution usually originates from the combustion of fuel and is thus influenced by the number of motorized vehicles and factory waste. The obtained results indicate elevated CO conditions in urban areas, a well-documented phenomenon closely related to anthropogenic activities, especially in industrialized sectors; however, CO can be transported to rural areas via meteorological factors. The distribution of NO2 was highest in the northwestern area, primarily due to the influence of industrial effluents and agricultural fertilizers, which are correlated to the number of factories and plantation areas. In urban areas, NO2 pollutants can also be caused by the industrial sector and the use of motor vehicles. The northwest region is a massive industrialized area close to Jakarta, the most densely populated portion of the country. SO2 in the study area is generally produced naturally by volcanic activity or anthropogenically through the combustion of fossil fuels in industries, cars, planes, and ships, leading to a relatively even distribution.
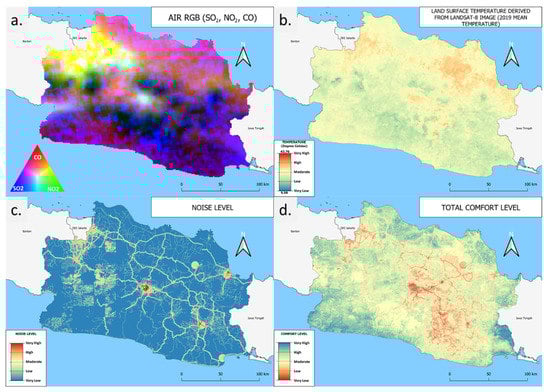
Figure 10.
Distribution of: (a) air pollution, (b) LST (2019 average), (c) noise, and (d) total comfort levels.
Figure 10b shows the LST from Landsat-8 to measure the mean temperature throughout 2019. In general, the LST mean ranged from 9.58 to 43.76 °C and was further grouped into five classes from very low to very high. The temperature data analysis and processing results showed very high temperature areas in the north, whereas in the highlands, especially in the central part of the research area, the temperatures tended to be lower, with higher LST values interspersed within. Figure 10c shows the analysis results of the noise level in the research area, which were similarly grouped into five classes. High-to-very high noise levels were generally located in large urban areas close to airports as well as major and local roads. Medium-to-very low levels were typically located far from these locations. Validation was conducted using a comparison test of the noise level index and VIIRS night light average radiance. Population and infrastructure developments could affect light and sound emissions, given their magnitude, geographical extent, and the degree to which they represent unprecedented environmental conditions [61]. Accordingly, 500 random sample points distributed throughout the study area were used for validation, revealing a positive correlation between the two datasets. A map of the total comfort distribution was created by combining air pollution parameters, noise levels, and LSTs (Figure 10d). The highest comfort levels were observed in the southwest, with numerous additional moderate-to-high comfort level conditions scattered throughout.
3.4. New School Location Suitability
The suitability analysis of new school locations incorporated the above disaster, comfort, accessibility, and land suitability aspects (Figure 11). These results were further processed into location suitability for the various academic levels assessed, namely elementary (Figure 11A), junior high (Figure 11B), senior high (Figure 11C), and vocational high schools (Figure 11D), before being subsequently divided into five classes from very high to very low. High-to-very high suitability locations were primarily those with low disaster hazard, high comfort, and low accessibility values, whereas the inverse was true for low suitability locations. Figure 4 shows the lack of senior high schools throughout West Java; therefore, the need for corresponding suitable locations is greater than that of elementary, junior high, and vocational high schools.
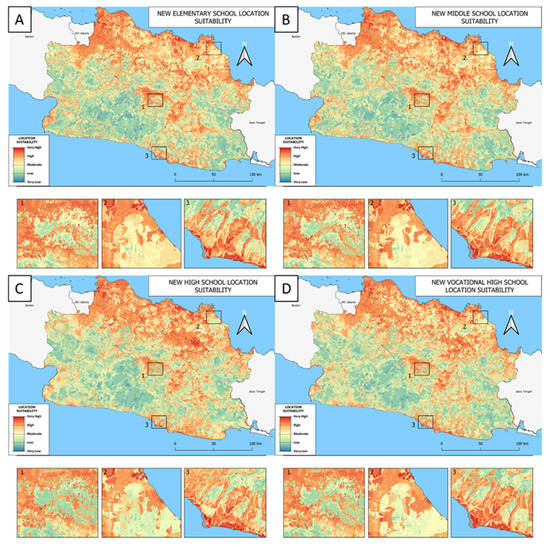
Figure 11.
New school land suitability distribution for: (A) elementary, (B) junior high, (C) senior high, and (D) vocational high schools.
4. Discussion
The educational infrastructure suitability analysis used a multi-hazard and accessibility model based on disaster, comfort, accessibility, and land suitability to achieve equal education distribution across the research area. Data were normalized across all layers prior to analysis using a scale setting of 1–5. Weights were applied equally to avoid subjectivity by combining data via the SAW method. The discussion section of this study focuses on the analysis and comparison of results, hazard and comfort analyses of the existing school locations, new school distribution based on the budget scenario, and the correlated effects of accessibility, limitations, and future research directions.
4.1. Results and Corresponding Data Comparison
Figure 12 shows a comparison of the findings from the present study, including validations of the disaster points, the noise index and night light data, and a comparison of the land values to those of Somantri [62]. Figure 12a shows the validation results of the disaster vulnerability map using historical data. Results showed that the middle-to-very high classes of floods, earthquakes, and landslides were 81.045%, 73.478%, and 63.859% accurate, respectively.
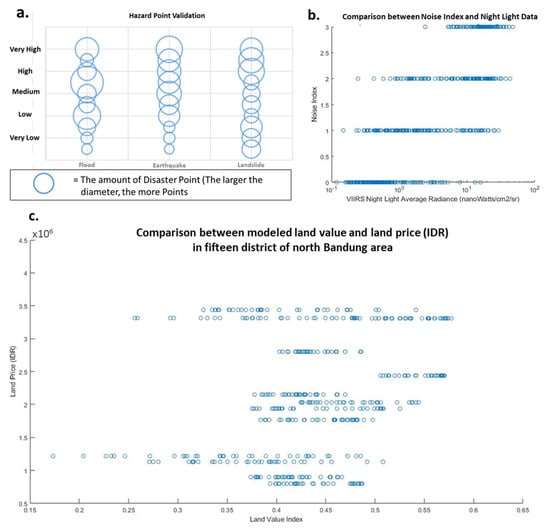
Figure 12.
Image comparison of mapped results for the (a) validation of disaster points (b). Comparison between the noise index and night light data (c). Comparison of land value model in this study with the estimated land price in fifteen district North Bandung City area estimated by Somantri [62].
The noise map validation used a comparison test between the noise level index and the VIIRS night light average radiance across 500 random sample points throughout the study area (Figure 12b). Results of the analysis showed a positive correlation between the two datasets. Population and infrastructure developments can affect light and sound emissions given the magnitude of their respective geographic ranges and the extent to which they represent unnatural environmental conditions [61]. Land value validation came from comparing the results of land value maps here with actual world prices according to Somantri [62], who surveyed land prices in fifteen district in the North Bandung area (Figure 10c). Five-hundred point samples were randomly distributed for comparison, revealing a positive correlation between the land value index and land prices.
4.2. Hazard Analysis of Existing Schools
The hazard analysis of the existing schools was based on overlaying disaster vulnerability maps with school point locations (Table 3). Based on the results, the suitable locations for new senior high schools are more widely distributed than those for elementary, junior high, or vocational high schools. The number of schools located under high or very-high levels of vulnerability were 5028 and 3099, respectively. The identification of disaster-prone areas, especially for landslides and earthquakes, was needed to create the priority analysis in school retrofitting efforts, where those most prone to earthquakes could be retrofitted with earthquake-resistant building standards as soon as possible. Different retrofitting methods are needed for schools vulnerable to landslides, such as strengthening soil conditions, foundations, or relocating buildings. An evacuation area plan is required for all disasters. It can be further informed by the analysis here according to the most likely types of disaster and the nearest safest locations.
Table 3.
The number of schools at each level of disaster vulnerability.
4.3. Comfort Analysis of Existing Schools
Table 4 shows the results of the comfort analysis for existing schools, where 2332 and 45 schools held high and very high levels of comfort, respectively. Optimization efforts in areas of lower comfort levels are needed to bolster student performance and thus the quality of education. Schools in areas with low comfort levels are affected by temperature, noise, and air pollution, which are directly proportional to the urban development and population growth in West Java.
Table 4.
The number of schools at each comfort level.
4.4. New School Distribution by Budget Scenario
Figure 13 shows the land value across the research area, where red indicates high-value locations, yellow indicates medium values, and blue indicates low land values. Figure 14 shows the results of the new school distribution based on the budget scenario analysis for each academic level analyzed and potential future school sites were located in areas with high to very high levels of suitability. Each scenario included 200 new schools placed on correlated land values (red dots, high value; yellow dots, medium value; and green dots, low value) according to the levels of disaster vulnerability, comfort, and accessibility.
Figure 13.
Relative land value in the West Java Province area.
Figure 14.
Distribution of new schools by budget scenario: (a) elementary, (b) junior high, (c) senior high, and (d) vocational high schools.
4.5. Evaluation of Existing and New School Based on COVID-19 Transmission Level
Educational activities in schools were highly impacted by public health measures and restrictions during the COVID-19 pandemic, and thus we processed and used COVID-19 transmission rate data in West Java as part of this analysis. COVID-19 transmission levels (Figure 15) were categorized into several classes: very high, moderate, low, and very low. The analysis results show high to very high transmission levels in larger urban areas, such as the cities of Bandung, Bekasi, and Pangandaran Regency, where transmission is positively correlated with total cases. This COVID-19 transmission rate modeling was further used to analyze existing schools (Figure 16) and the distribution of potential new school locations (Figure 17) for elementary, middle high, senior high, and vocational high schools.
Figure 15.
COVID-19 transmission rates according to case number.
Figure 16.
School Bio hazard (COVID 19) level for: (a) elementary, (b) junior high, (c) senior high, and (d) vocational high schools.
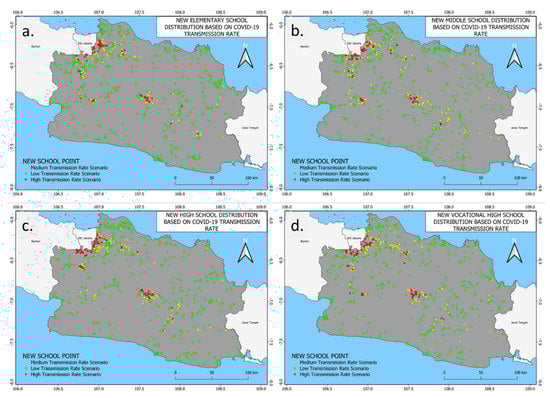
Figure 17.
Distribution of new schools by COVID-19 transmission level: (a) elementary, (b) junior high, (c) senior high, and (d) vocational high schools.
Analysis of COVID-19 transmission rates at existing school locations is based on the condition of educational activities in Indonesia during the pandemic; schools are mandated to enforce policies aimed at reducing COVID-19 transmission rates and infection and to protect students. Examples of these policies include conducting classes fully online, partially online using a hybrid approach, or fully offline for schools deemed low risk for virus transmission. In our analysis, we rank the level of COVID-19 transmission in schools, which will be beneficial to the provincial, as well as local, governments in determining which policies regarding teaching models and health protocols in schools to enact and prioritize. This is considered to protect students who are among the groups with the lowest vaccination priority.
Furthermore, analysis of COVID-19 transmission rates at potential new school locations were also conducted to identify the need for supporting infrastructure in the implementation of educational activities in schools. Experience during the pandemic has shown that the success of online and long-distance learning hinges on the availability and quality of the supporting infrastructure. Data on COVID-19 transmission rates at potential new school locations can be integrated with data on the availability of local infrastructure, which will be useful in determining whether new schools in those particular locations are feasible, cost-effective, and/or beneficial. Policy holders and relevant agencies can use this information to identify any lack of infrastructure for new schools and plan accordingly, in order for those schools to be ready in the event of more mandated online and long-distance learning and educational activities. Figure 17 shows the results of the new school distribution based on the COVID-19 transmission rates analysis for each academic level analyzed.
Figure 18 shows the results of field checks through high-resolution imagery using Google Earth Pro by sampling four new school points. This process ensured that the resulting points were sufficiently close to residential or populated areas. In general, it was revealed that the proposed points were near public roads, buildings (sometimes within), or residential areas. These point distribution results were the only ground-level assessments of suitable areas for new school development. The distribution must also be considered against a cadastral map to ensure that the proposed points have an owner or sit on vacant land.
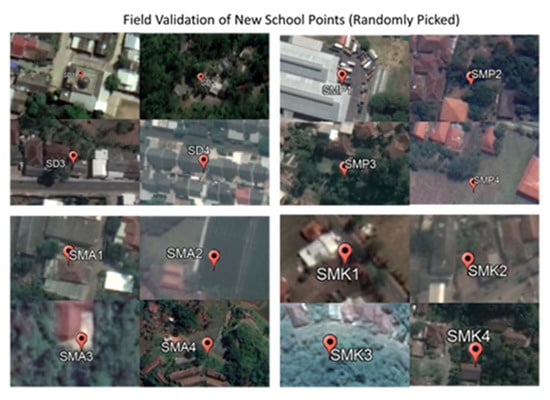
Figure 18.
Field validation of the randomly picked new school points.
4.6. Building New Schools by Budget Scenario and Accessibility
The results of the effect of building new schools based on budget scenarios and accessibility are shown in Figure 19, revealing the expansion of school availability after the inclusion of additional school points (see Section 4.3).
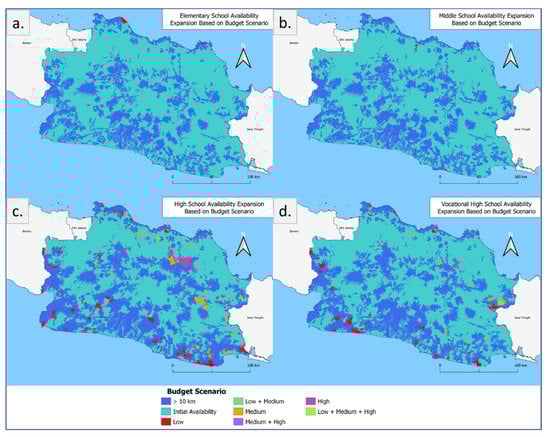
Figure 19.
Expansion of school availability by budget scenario: (a) elementary, (b) junior high, (c) senior high, and (d) vocational high schools.
The expansion is indicated in all colors other than blue, each correlating to the effect of certain scenarios on expansion. The most significant expansions occurred for senior high (303,973.1 ha), followed by vocational high schools (94,170.51 ha) and junior high schools (12,981.78 ha). Alternatively, the change in elementary schools was not significant (3936.69 ha) considering the high number of schools already in existence. The overall results indicate that the construction of senior high and vocational high schools is the most critical due to their relatively lower numbers in reality.
4.7. Limitations and Future Possible Direction
Several limitations are present in the current research study, including technical issues requiring several assumptions. The available input data used as input parameters in each model have different resolutions, potentially leading to biases in the resulting model. The weighting mechanism employed the SAW method, giving equal weights to each analysis result. Mechanism development could be used in the Analytic Hierarchy Process (AHP) method based on expert-based assessments or weights derived through a community-based method that has been empirically tested [63,64].
To improve the accuracy of the new school land suitability maps created, further research could be conducted with the inclusion of (1) better weights through expert-based or community-based analyses and methods that have been empirically tested; (2) field measurements and institutional surveys to obtain and more comprehensively validate results; (3) an updated or replaced land value map with more official data; (4) detailed cadastral maps to distribute new schools and prioritization of school retrofitting; and (5) several additional factors, such as evacuation area and retrofitting, for school prioritization based on disaster type and risk, thus providing a more optimal school location.
Improvements regarding hazard and comfort analyses can also be done in the future. The machine learning method can be used to improve multi-hazard analysis in the future [65,66]. Besides improvement in the method, the intensive use of data, such as the inclusion of extreme precipitation, antecedent, and time of concentration information, will enhance the quality of the flood hazard map [67]. These parameters are helpful to distinguish flood types (e.g., fluvial and flash floods). For the comfort analysis, it is better to include humidity information in addition to the temperature. Meteorological stations can be used to adjust the temperature information of the LST data so that the air temperature will be more representative. This study uses several compounds for air quality indicator; however, it is better to add particulate matters for a more comprehensive study.
In addition, data integration with other natural disasters is also a potential element to be developed. For instance, buildings in West Java Province are also susceptible to strong wind incidents [68]. Other disasters such as land subsidence [69,70], volcanic eruption [71,72], tsunami [73,74], and wildfire [75,76] should be considered in Indonesia. This multi-hazard analysis and comfort index could be applied in other potential sectors such as transportation [77] or other infrastructure developments such as power plants [78] and river networks [79]. Moreover, disaster vulnerability could be estimated, especially when ecosystem service calculation is used. Coastal [80,81,82,83], cropland [84,85], and forest ecosystems [86] including mangrove [87,88,89] are the potential ecosystems important to be analyzed for its vulnerability.
5. Conclusions
A new model of land suitability for educational facilities was created based on spatial product development to determine the optimal locations for achieving education targets in West Java, Indonesia. The research results can serve as the foundation for policyholders’ developmental strategies, especially in the education sector. Considering multi-aspect development scenarios based on the impacts of increasing access, minimizing risk, and allocating available funds, future development must be carried out in a more systematic, impactful, and sustainable manner. Therefore, there is a need for improvement (i.e., retrofitting) and mitigation efforts to sufficiently prepare for disasters in the most prone areas. Thus, it is necessary to optimize schools placed in locations with high levels of comfort to increase student performance and therefore the quality of education. Based on the school accessibility map, higher levels were located in the larger cities of West Java, whereas lower accessibility was documented far from these urban areas. In particular, senior high school accessibility is predominant in areas of lower accessibility levels, as there are comparatively fewer facilities available in West Java. Overall, higher levels of suitability were spread throughout West Java. The distribution of schools based on potential future budget scenarios was conducted using the created land value map. The results of this study can also serve as the foundation for developmental strategies, especially school facilities in other Indonesian regions or countries with similar characteristics.
Author Contributions
Anjar Dimara Sakti, Muhammad Ario Eko Rahadianto, and Ketut Wikantika conceived and designed the experiments; Anjar Dimara Sakti, Muhammad Ario Eko Rahadianto, Tania Septi Anggraini, and Andhika Dimas Purnomo performed the experiments; Hubbi Nashrullah Muhammad, I Gusti Ayu Andani, Prasanti Widyasih Sarli, Muhammad Rais Abdillah and Biswajeet Pradhan analyzed the data; Riki Ridwana, Fajar Yulianto, Masita Dwi Mandini Manessa, Afina Nur Fauziyyah, Lissa Fajri Yayusman, pre-processed the base datasets; all authors wrote the paper; all authors read the paper and provided revision suggestions. All authors have read and agreed to the published version of the manuscript.
Funding
This project was funded in 2021 by the Capacity Building Research Program for ITB Young Scientists by the Institute of Research and Community Service, Institut Teknologi Bandung and Indonesia Endowment Fund for Education (LPDP), Ministry of Finance Republic of Indonesia.
Data Availability Statement
The datasets generated during and/or analyzed during the current study are available from the corresponding author upon reasonable request.
Acknowledgments
The authors are grateful to acknowledge the support from the Indonesia Endowment Fund for Education (LPDP), Ministry of Finance Republic of Indonesia, and the Institute of Research and Community Service, Institut Teknologi Bandung. We also thank the anonymous reviewers whose valuable comments greatly helped us to prepare an improved and clearer version of this paper. All persons and institutes who kindly made their data available for this analysis are acknowledged.
Conflicts of Interest
The authors declare no conflict of interest.
References
- Barro, R.J. Education and Economic Growth. The Contribution of Human and Social Capital to Sustained Economic Growth and Well-Being. 2001, pp. 14–41. Available online: https://www.oecd.org/innovation/research/1825902.pdf (accessed on 16 December 2021).
- Hanushek, E.A.; Woessmann, L. Education and economic growth. Econ. Educ. 2010, 60–67. [Google Scholar]
- Reza, F.; Widodo, T. The Impact of education on economic growth in Indonesia. J. Indones. Econ. Bus. 2013, 28, 23–44. [Google Scholar]
- Ministry of Education and Culture Republic of Indonesia (MEC). Kementrian Pendidikan dan Kebudayaan. Strategic Planning (Rencana Strategis) 2020–2024. 2020. Available online: https://dikti.kemdikbud.go.id/wp-content/uploads/2020/10/RENSTRA-KEMENDIKBUD-full-version.pdf (accessed on 12 May 2020).
- Max Roser and Esteban Ortiz-Ospina—Primary and Secondary Education. 2020. Available online: https://ourworldindata.org/primary-and-secondary-education (accessed on 12 May 2020).
- Yustika, G.P.; Subagyo, A.; Iswati, S. Masalah Yang Dihadapi Dunia Pendidikan Dengan Tutorial Online: Sebuah Short Review. Tadbir. J. Stud. Manaj. Pendidik. 2019, 3, 187. [Google Scholar] [CrossRef] [Green Version]
- Saleh, A.M. Problematika Kebijakan Pendidikan Di Tengah Pandemi Dan Dampaknya Terhadap Proses Pembelajaran Di Indonesia. J. Pendidik. 2020, 2, 24. [Google Scholar]
- Ahyar, M. Problematika Pendidikan Berbasis Masyarakat dan Solusinya di Era New Normal COVID-19. J. El-Huda Study Islam 2020, 11, 15. [Google Scholar]
- Sustainable Development Goals. Available online: https://sdgs.un.org/goals (accessed on 12 May 2020).
- Kristiansen, S. Decentralizing education in Indonesia. Int. J. Educ. Dev. 2006, 26, 513–531. [Google Scholar] [CrossRef]
- Indonesia Statistics. 2020. Available online: https://www.bps.go.id/publication/2020/04/29/e9011b3155d45d70823c141f/statistik-indonesia-2020.html (accessed on 20 May 2020).
- Indonesia’s Budget Planning. 2020. Available online: http://www.dpr.go.id/dokakd/dokumen/BANGGAR-RJ-20200311-085609-9144.pdf (accessed on 18 August 2020).
- Indonesia’s Disasters Occurrence Report. 2010. Available online: https://bnpb.go.id/infografis/kejadian-bencana-tahun-2010 (accessed on 20 August 2020).
- Widiyantoro, S.; Gunawan, E.; Muhari, A.; Rawlinson, N.; Mori, J.; Hanifa, N.R.; Putra, H.E. Implications for megathrust earthquakes and tsunamis from seismic gaps south of Java Indonesia. Sci. Rep. 2020, 10, 15274. [Google Scholar] [CrossRef]
- Reichenbach, P.; Mondini, A.C.; Rossi, M. The influence of land use change on landslide susceptibility zonation: The Briga catchment test site (Messina, Italy). Environ. Manag. 2014, 54, 1372–1384. [Google Scholar] [CrossRef] [Green Version]
- Rahmati, O.; Darabi, H.; Panahi, M.; Kalantari, Z.; Naghibi, S.A.; Ferreira, C.S.S.; Bui, D.T. Development of novel hybridized models for urban flood susceptibility mapping. Sci. Rep. 2020, 10, 12937. [Google Scholar] [CrossRef]
- Yang, G.; Liu, Y.; Li, X. Spatiotemporal distribution of ground-level ozone in china at a city level. Sci. Rep. 2020, 10, 7229. [Google Scholar] [CrossRef]
- Du, Y.; Xie, Z.; Zeng, Y.; Shi, Y.; Wu, J. Impact of urban expansion on regional temperature change in the Yangtze River Delta. J. Geogr. Sci. 2007, 17, 387–398. [Google Scholar] [CrossRef]
- Nurwanda, A.; Honjo, T. The prediction of city expansion and land surface temperature in Bogor City, Indonesia. Sustain. Cities Soc. 2020, 52, 101772. [Google Scholar] [CrossRef]
- Doygun, H.; Gurun, D.K. Analysing and mapping spatial and temporal dynamics of urban traffic noise pollution: A case study in Kahramanmaraş, Turkey. Environ. Monit. Assess. 2008, 142, 65–72. [Google Scholar] [CrossRef]
- Bilaşco, Ş.; Govor, C.; Roşca, S.; Vescan, I.; Filip, S.; Fodorean, I. GIS model for identifying urban areas vulnerable to noise pollution: Case study. Front. Earth Sci. 2017, 11, 214–228. [Google Scholar] [CrossRef]
- Xing, Y.F.; Xu, Y.H.; Shi, M.H.; Lian, Y.X. The impact of PM2.5 on the human respiratory system. J. Thorac. Dis. 2016, 8, E69. [Google Scholar]
- Chithra, V.S.; Nagendra, S.S. Indoor air quality investigations in a naturally ventilated school building located close to an urban roadway in Chennai, India. Build. Environ. 2012, 54, 159–167. [Google Scholar] [CrossRef]
- Kalimeri, K.K.; Saraga, D.E.; Lazaridis, V.D.; Legkas, N.A.; Missia, D.A.; Tolis, E.I.; Bartzis, J.G. Indoor air quality investigation of the school environment and estimated health risks: Two-season measurements in primary schools in Kozani, Greece. Atmos. Pollut. Res. 2016, 7, 1128–1142. [Google Scholar] [CrossRef]
- Wargocki, P.; Porras-Salazar, J.A.; Contreras-Espinoza, S. The relationship between classroom temperature and children’s performance in school. Build. Environ. 2019, 157, 197–204. [Google Scholar] [CrossRef]
- Shield, B.M.; Dockrell, J.E. The effects of noise on children at school: A review. Build. Acoust. 2003, 10, 97–116. [Google Scholar] [CrossRef]
- Prasetyo, D.H.; Mohamad, J.; Fauzi, R. A GIS-based multi-criteria decision analysis approach for public school site selection in Surabaya, Indonesia. Geomatica 2018, 72, 69–84. [Google Scholar] [CrossRef]
- Samad, A.M.; Hifni, N.A.; Ghazali, R.; Hashim, K.A.; Disa, N.M.; Mahmud, S. A study on school location suitability using AHP in GIS approach. In Proceedings of the 2012 IEEE 8th International Colloquium on Signal Processing and its Applications, Malacca, Malaysia, 23–25 March 2012; pp. 393–399. [Google Scholar]
- Bathrellos, G.D.; Skilodimou, H.D.; Chousianitis, K.; Youssef, A.M.; Pradhan, B. Suitability estimation for urban development using multi-hazard assessment map. Sci. Total Environ. 2017, 575, 119–134. [Google Scholar] [CrossRef]
- Aprianoor, P.; Muktiali, M. Kajian Ketimpangan Wilayah di Provinsi Jawa Barat. Tek. PWK (Perenc. Wil. Kota) 2015, 4, 484–498. [Google Scholar]
- West Java’s School Statistics. 2019/2020. Available online: https://dapodik.disdik.jabarprov.go.id/statistik/?page=sma (accessed on 18 August 2020).
- West Java Development Priorities. Available online: https://jabarprov.go.id/index.php/news/33657/2019/07/11/Sembilan-Prioritas-Pembangunan-Jawa-Barat-pada-2020 (accessed on 12 May 2020).
- Severity of West Java’s Disaster Vulnerability. Available online: https://jabarprov.go.id/index.php/news/1480/2010/12/29/57-Bencana-Gerakan-Tanah-Terjadi-di-Jabar (accessed on 20 September 2020).
- West Java Education Office. West Java School Location; West Java Education Office: Bandung, Indonesia, 2020. [Google Scholar]
- USGS Earthquake Catalog. Available online: https://earthquake.usgs.gov/earthquakes/search/ (accessed on 22 August 2020).
- Indonesia’s Basemap. Available online: https://tanahair.indonesia.go.id/portal-web/download/perwilayah (accessed on 12 May 2020).
- Soil Type and Watershed Data. Available online: http://pdashl.menlhk.go.id/service.php?type=2-Data-dan-Informasi (accessed on 12 May 2020).
- UNEP-WCMC; IUCN. Protected Planet: The World Database on Protected Areas (WDPA) and World Database on Other Effective Area-based Conservation Measures (WD-OECM) [Online], February 2021. UNEP-WCMC and IUCN: Cambridge, UK, 2021. Available online: www.protectedplanet.net (accessed on 22 October 2020).
- Tadono, T.; Ishida, H.; Oda, F.; Naito, S.; Minakawa, K.; Iwamoto, H. Precise Global DEM Generation By ALOS PRISM. ISPRS Annu. Photogramm. Remote Sens. Spat. Inf. Sci. 2014, II-4, 71–76. [Google Scholar] [CrossRef] [Green Version]
- Gaughan, A.E.; Stevens, F.R.; Linard, C.; Jia, P.; Tatem, A.J. High resolution population distribution maps for Southeast Asia in 2010 and 2015. PLoS ONE 2013, 8, e55882. [Google Scholar] [CrossRef]
- Facebook Connectivity Lab and Center for International Earth Science Information Network. High Resolution Settlement Layer. University of Columbia: New York, NY, USA. Available online: https://ciesin.columbia.edu/data/hrsl/ (accessed on 27 October 2017).
- Friedl, M.; Sulla-Menashe, D. MCD12Q1 MODIS/Terra+Aqua Land Cover Type Yearly L3 Global 500m SIN Grid V006 [Data set]. NASA EOSDIS Land Processes DAAC 2019. Available online: https://ladsweb.modaps.eosdis.nasa.gov/missions-and-measurements/products/MCD12Q1 (accessed on 16 September 2021).
- Funk, C.; Peterson, P.; Landsfeld, M.; Pedreros, D.; Verdin, J.; Shukla, S.; Husak, G.; Rowland, J.; Harrison, L.; Hoell, A.; et al. The climate hazards infrared precipitation with stations—A new environmental record for monitoring extremes. Sci. Data 2015, 150066. [Google Scholar] [CrossRef] [PubMed] [Green Version]
- Jiménez-Muñoz, J.C.; Sobrino, J.A.; Skoković, D.; Mattar, C.; Cristóbal, J. Land surface temperature retrieval methods from Landsat-8 thermal infrared sensor data. IEEE Geosci. Remote Sens. Lett. 2014, 11, 1840–1843. [Google Scholar] [CrossRef]
- Rajeshwari, A.; Mani, N.D. Estimation of land surface temperature of Dindigul district using Landsat 8 data. Int. J. Res. Eng. Technol. 2014, 3, 122–126. [Google Scholar]
- Sentinel 5-p Data. Available online: https://sentinel.esa.int/web/sentinel/missions/sentinel-5p (accessed on 22 May 2020).
- Fault Data. Available online: https://gis.bnpb.go.id/ (accessed on 12 May 2020).
- West Java COVID-19 Case Points. Available online: https://pikobar.jabarprov.go.id/ (accessed on 31 December 2020).
- Malczewski, J.; Rinner, C. Multicriteria Decision Analysis in Geographic Information Science; Springer: New York, NY, USA, 2015; pp. 220–228. [Google Scholar]
- Curriculum. 2013. Available online: https://www.kemdikbud.go.id/kemdikbud/dokumen/Paparan/Paparan%20Wamendik.pdf (accessed on 12 May 2020).
- Luong, T.T.; Pöschmann, J.; Kronenberg, R.; Bernhofer, C. Rainfall Threshold for Flash Flood Warning Based on Model Output of Soil Moisture: Case Study Wernersbach, Germany. Water 2021, 13, 1061. [Google Scholar] [CrossRef]
- Quantile Explanation. Available online: http://www.ncgia.ucsb.edu/cctp/units/unit47/html/comp_class.html (accessed on 23 October 2020).
- Darmawan, K.; Suprayogi, A. Analisis tingkat kerawanan banjir di kabupaten sampang menggunakan metode overlay dengan scoring berbasis sistem informasi geografis. J. Geod. Undip 2017, 6, 31–40. [Google Scholar]
- Kusratmoko. Aplikasi Sistem Informasi Geografis untuk Penentuan Wilayah Prioritas Penanganan Bahaya Erosi Studi Kasus DAS Citarum. Jurusan Geografi dan Pusat Penelitian Geografi Terapan Fakultas MIPA Universitas Indonesia. 2002. Available online: https://library.ui.ac.id/detail?id=90287 (accessed on 16 September 2021).
- The Severity of an Earthquake. Available online: https://pubs.usgs.gov/gip/earthq4/severitygip.html (accessed on 26 December 2020).
- Zheng, Z.; Yang, Z.; Wu, Z.; Marinello, F. Spatial variation of NO2 and its impact factors in China: An application of sentinel-5P products. Remote Sens. 2019, 11, 1939. [Google Scholar] [CrossRef] [Green Version]
- Kaplan, G.; Avdan, Z.Y.; Avdan, U. Spaceborne Nitrogen Dioxide Observations from the Sentinel-5P TROPOMI over Turkey. Multidiscip. Digit. Publ. Inst. Proc. 2019, 18, 4. [Google Scholar] [CrossRef] [Green Version]
- Kaplan, G.; Avdan, Z.Y. Space-borne air pollution observation from sentinel-5p tropomi: Relationship between pollutants, geographical and demographic data. Int. J. Eng. Geosci. 2020, 5, 130–137. [Google Scholar] [CrossRef]
- Carbon Monoxide. Available online: https://www.cdc.gov/co/faqs.htm (accessed on 1 July 2020).
- Nitrogen Dioxide. Available online: https://www.epa.gov/no2-pollution (accessed on 20 May 2020).
- Swaddle, J.P.; Francis, C.D.; Barber, J.R.; Cooper, C.B.; Kyba, C.C.; Dominoni, D.M.; Longcore, T. A framework to assess evolutionary responses to anthropogenic light and sound. Trends Ecol. Evol. 2015, 30, 550–560. [Google Scholar] [CrossRef] [PubMed] [Green Version]
- Somantri, L. Land Price Mapping in the Northern Suburbs of Bandung City. Forum Geografi. 2020, 34, 6–155. [Google Scholar] [CrossRef]
- Bera, R.; Maiti, R. Multi hazards risk assessment of Indian Sundarbans using GIS based Analytic Hierarchy Process (AHP). Reg. Stud. Mar. Sci. 2021, 44, 101766. [Google Scholar] [CrossRef]
- Vojtek, M.; Vojteková, J.; Costache, R.; Pham, Q.B.; Lee, S.; Arshad, A.; Sahoo, S.; Linh, N.T.T.; Anh, D.T. Comparison of multi-criteria-analytical hierarchy process and machine learning-boosted tree models for regional flood susceptibility mapping: A case study from Slovakia. Geomatics. Nat. Hazards Risk 2021, 12, 1153–1180. [Google Scholar] [CrossRef]
- Rahmati, O.; Yousefi, S.; Kalantari, Z.; Uuemaa, E.; Teimurian, T.; Keesstra, S.; Pham, T.D.; Tien Bui, D. Multi-Hazard Exposure Mapping Using Machine Learning Techniques: A Case Study from Iran. Remote Sens. 2019, 11, 1943. [Google Scholar] [CrossRef] [Green Version]
- Yousefi, S.; Pourghasemi, H.R.; Emami, S.N.; Pouyan, S.; Eskandari, S.; Tiefenbacher, J.P. A machine learning framework for multi-hazards modeling and mapping in a mountainous area. Sci. Rep. 2020, 10, 12144. [Google Scholar] [CrossRef]
- Harjupa, W.; Abdillah, M.R.; Azura, A.; Putranto, M.F.; Marzuki, M.; Nauval, F.; Risyanto; Saufina, E.; Jumianti, N.; Fathrio, I. On the utilization of RDCA method for detecting and predicting the occurrence of heavy rainfall in Indonesia. Remote Sens. Appl. Soc. Environ. 2021, 100681. [Google Scholar] [CrossRef]
- Sarli, P.W.; Abdillah, M.R.; Sakti, A.D. Relationship between wind incidents and wind-induced damage to construction in West Java, Indonesia. In Proceedings of the IOP Conference Series: Earth and Environmental Science, Bandung, Indonesia, 20–21 October 2001; Volume 592. [Google Scholar] [CrossRef]
- Hayati, N.; Niemeier, W.; Sadarviana, V. Ground Deformation in The Ciloto Landslides Area Revealed by Multi-Temporal InSAR. Geosciences 2020, 10, 156. [Google Scholar] [CrossRef]
- Chaussard, E.; Amelung, F.; Abidin, H.; Hong, S.-H. Sinking cities in Indonesia: ALOS PALSAR detects rapid subsidence due to groundwater and gas extraction. Remote Sens. Environ. 2013, 128, 150–161. [Google Scholar] [CrossRef]
- Poland, M.P.; Lopez, T.; Wright, R.; Pavolonis, M.J. Forecasting, Detecting, and Tracking Volcanic Eruptions from Space. Remote Sens. Earth Syst. Sci. 2020, 3, 55–94. [Google Scholar] [CrossRef]
- Malawani, M.N.; Lavigne, F.; Gomez, C.; Mutaqin, B.W.; Hadmoko, D.S. Review of Local and Global Impacts of Volcanic Eruptions and Disaster Management Practices: The Indonesian Example. Geosciences 2021, 11, 109. [Google Scholar] [CrossRef]
- Selva, J.; Lorito, S.; Volpe, M.; Romano, F.; Tonini, R.; Perfetti, P.; Bernardi, F.; Taroni, M.; Scala, A.; Babeyko, A.; et al. Probabilistic tsunami forecasting for early warning. Nat. Commun. 2021, 12, 5677. [Google Scholar] [CrossRef] [PubMed]
- Cummins, P.R.; Pranantyo, I.R.; Pownall, J.M.; Griffin, J.D.; Meilano, I.; Zhao, S. Earthquakes and tsunamis caused by low-angle normal faulting in the Banda Sea, Indonesia. Nat. Geosci. 2020, 13, 312–318. [Google Scholar] [CrossRef]
- Ban, Y.; Zhang, P.; Nascetti, A.; Bevington, A.R.; Wulder, M.A. Near Real-Time Wildfire Progression Monitoring with Sentinel-1 SAR Time Series and Deep Learning. Sci. Rep. 2020, 10, 1322. [Google Scholar] [CrossRef] [Green Version]
- Sakti, A.D.; Tsuyuki, S. Spectral Mixture Analysis of Peatland Imagery for Land Cover Study of Highly Degraded Peatland in Indonesia. In The International Archives of the Photogrammetry, Remote Sensing and Spatial Information Science; Copernicus Publications: Göttingen, Germany, 2015. [Google Scholar]
- Andani, I.G.A.; Puello, L.L.P.; Geurs, K. Exploring the role of toll road construction on residential location choice in the Jakarta—Bandung region. Case Stud. Transp. Policy 2020, 8, 599–611. [Google Scholar] [CrossRef]
- Global Energy Observatory; Google; KTH Royal Institute of Technology in Stockholm; University of Groningen; World Resources Institute. Global Power Plant Database. Published on Resource Watch and Google Earth Engine. 2018. Available online: http://https://resourcewatch.org/ or https://earthengine.google.com/ (accessed on 16 December 2021).
- Sakti, A.D.; Rinasti, A.N.; Agustina, E.; Diastomo, H.; Muhammad, F.; Anna, Z.; Wikantika, K. Multi-Scenario Model of Plastic Waste Accumulation Potential in Indonesia Using Integrated Remote Sensing, Statistic and Socio-Demographic Data. ISPRS Int. J. Geo-Inf. 2021, 10, 481. [Google Scholar] [CrossRef]
- Fauzi, A.I.; Sakti, A.D.; Robbani, B.F.; Ristiyani, M.; Agustin, R.T.; Yati, E.; Nuha, M.U.; Anika, N.; Putra, R.; Siregar, D.I.; et al. Assessing Potential Climatic and Human Pressures in Indonesian Coastal Ecosystems Using a Spatial Data-Driven Approach. ISPRS Int. J. Geo-Inf. 2021, 10, 778. [Google Scholar] [CrossRef]
- Saputra, E.; Ariyanto, I.S.; Ghiffari, R.A.; Fahmi, M.S.I. Land Value in a Disaster-Prone Urbanized Coastal Area: A Case Study from Semarang City, Indonesia. Land 2021, 10, 1187. [Google Scholar] [CrossRef]
- Sakti, A.D.; Fauzi, A.I.; Wilwatikta, F.N.; Rajagukguk, Y.S.; Sudhana, S.A.; Yayusman, L.F.; Syahid, L.N.; Sritarapipat, T.; Principe, J.A.; Trang, N.T.Q.; et al. Multi-Source Remote Sensing Data Product Analysis: Investigating Anthropogenic and Naturogenic Impacts on Mangroves in Southeast Asia. Remote Sens. 2020, 12, 2720. [Google Scholar] [CrossRef]
- Fauzi, A.; Sakti, A.; Yayusman, L.; Harto, A.; Prasetyo, L.; Irawan, B.; Kamal, M.; Wikantika, K. Contextualizing Mangrove Forest Deforestation in Southeast Asia Using Environmental and Socio-Economic Data Products. Forests 2019, 10, 952. [Google Scholar] [CrossRef] [Green Version]
- Sakti, A.D.; Takeuchi, W. A Data-Intensive Approach to Address Food Sustainability: Integrating Optic and Microwave Satellite Imagery for Developing Long-Term Global Cropping Intensity and Sowing Month from 2001 to 2015. Sustainability 2020, 12, 3227. [Google Scholar] [CrossRef] [Green Version]
- Lee, T.-H.; Chang, H.-H.; Hsieh, Y.-T.; Chang, B.-Y. Can Agricultural Disaster Relief Programs Affect Farmland Prices? Empirical Evidence from Farmland Transaction Data. Land 2021, 10, 728. [Google Scholar] [CrossRef]
- Felipe-Lucia, M.R.; Soliveres, S.; Penone, C.; Manning, P.; Van Der Plas, F.; Boch, S.; Prati, D.; Ammer, C.; Schall, P.; Gossner, M.M.; et al. Multiple forest attributes underpin the supply of multiple ecosystem services. Nat. Commun. 2018, 9, 4839. [Google Scholar] [CrossRef] [PubMed] [Green Version]
- Fauzi, A.I.; Sakti, A.D.; Yayusman, L.F.; Harto, A.B.; Prasetyo, L.B.; Irawan, B.; Wikantika, K. Evaluating mangrove forest deforestation causes in Southeast Asia by analyzing recent environment and socio-economic data products. In Proceedings of the 39th Asian Conference on Remote Sensing, Kuala Lumpur, Malaysia, 15–19 October 2018; Volume 2, pp. 880–889. [Google Scholar]
- Rajagukguk, Y.S.; Sakti, A.D.; Yayusman, L.F.; Harto, A.B.; Prasetyo, L.B.; Irawan, B.; Wikantika, K. Evaluation of Southeast Asia mangrove forest deforestation using longterm remote sensing index datasets. In Proceedings of the 39th Asian Conference on Remote Sensing, Kuala Lumpur, Malaysia, 15–19 October 2018; Volume 2, pp. 931–937. [Google Scholar]
- Syahid, L.N.; Sakti, A.D.; Virtriana, R.; Wikantika, K.; Windupranata, W.; Tsuyuki, S.; Caraka, R.E.; Pribadi, R. Determining Optimal Location for Mangrove Planting Using Remote Sensing and Climate Model Projection in Southeast Asia. Remote Sens. 2020, 12, 3734. [Google Scholar] [CrossRef]
Publisher’s Note: MDPI stays neutral with regard to jurisdictional claims in published maps and institutional affiliations. |
© 2021 by the authors. Licensee MDPI, Basel, Switzerland. This article is an open access article distributed under the terms and conditions of the Creative Commons Attribution (CC BY) license (https://creativecommons.org/licenses/by/4.0/).