
Geospatial Analysis of the Non-Surveyed (Estimated) Coastlines in Inoh’s Map, 1821


1
Graduate School of Life and Environmental Sciences, University of Tsukuba, Tsukuba 305-8572, Japan
2
JSPS Research Fellow, Japan Society for the Promotion of Science, Chiyoda, Tokyo 102-8471, Japan
3
Faculty of Life and Environmental Sciences, University of Tsukuba, Tsukuba 305-8572, Japan
*
Author to whom correspondence should be addressed.
ISPRS Int. J. Geo-Inf. 2021, 10(9), 580; https://doi.org/10.3390/ijgi10090580
Submission received: 30 June 2021
/
Revised: 19 August 2021
/
Accepted: 24 August 2021
/
Published: 27 August 2021
(This article belongs to the Special Issue Geographic Information Science (GIScience) and Geospatial Approaches for the Analysis of Historical Visual Sources and Cartographic Material)
Abstract
:The history of modern maps in Japan began with Inoh’s map that was made by surveying the whole of Japan on foot 200 years ago. Inoh’s team investigated coastlines, major roads, and geographical features such as rivers, lakes, temples, forts, village names, etc. The survey was successively conducted ten times from 1800 to 1816. Inoh’s map is known as the first scientific map in Japan using a systematic method. However, the actual survey was conducted only for 75% of the coastlines in Japan and the remaining 25% was drawn by Inoh’s estimation (observation). This study investigated how the non-surveyed (estimated) coastlines were distributed in the map and why the actual survey was not conducted in these non-surveyed coastlines. Using GIS, we overlaid the geometrically corrected Inoh’s map (Digital Inoh’s Map Professional Edition) with the current map published by the Geospatial Information Authority (GSI) of Japan for examining the spatial difference. We found that the non-surveyed coastlines were in places where the practice of actual surveying was topographically difficult because of the limited surveying technology of those days. The analytical result shows that 38.6% of the non-surveyed coastlines were cliffs, 25.7% were rocky beaches, and 6.2% were wetlands and tidal lands (including rice fields and tidal flats).
1. Introduction
Inoh’s map is known as Japan’s first scientific map with high accuracy [1]. In the later period of the Edo era (1603–1868), mapping techniques had developed incredibly, and the Shogunate (government) had started editing the Japanese archipelago’s precise map to protect national land from foreign invaders [2]. At first, the national map had been compiled by connecting local maps of different regions based on different surveying standards. Finally, in 1821, the national map of Japan, titled “Dai Nihon Enkai Yochi Zenzu“ (commonly known as “Inoh’s map”), was completed by surveyor Inoh Tadataka. He surveyed the coastlines in the whole of Japan with a uniform standard unlike previous national maps of Japan.
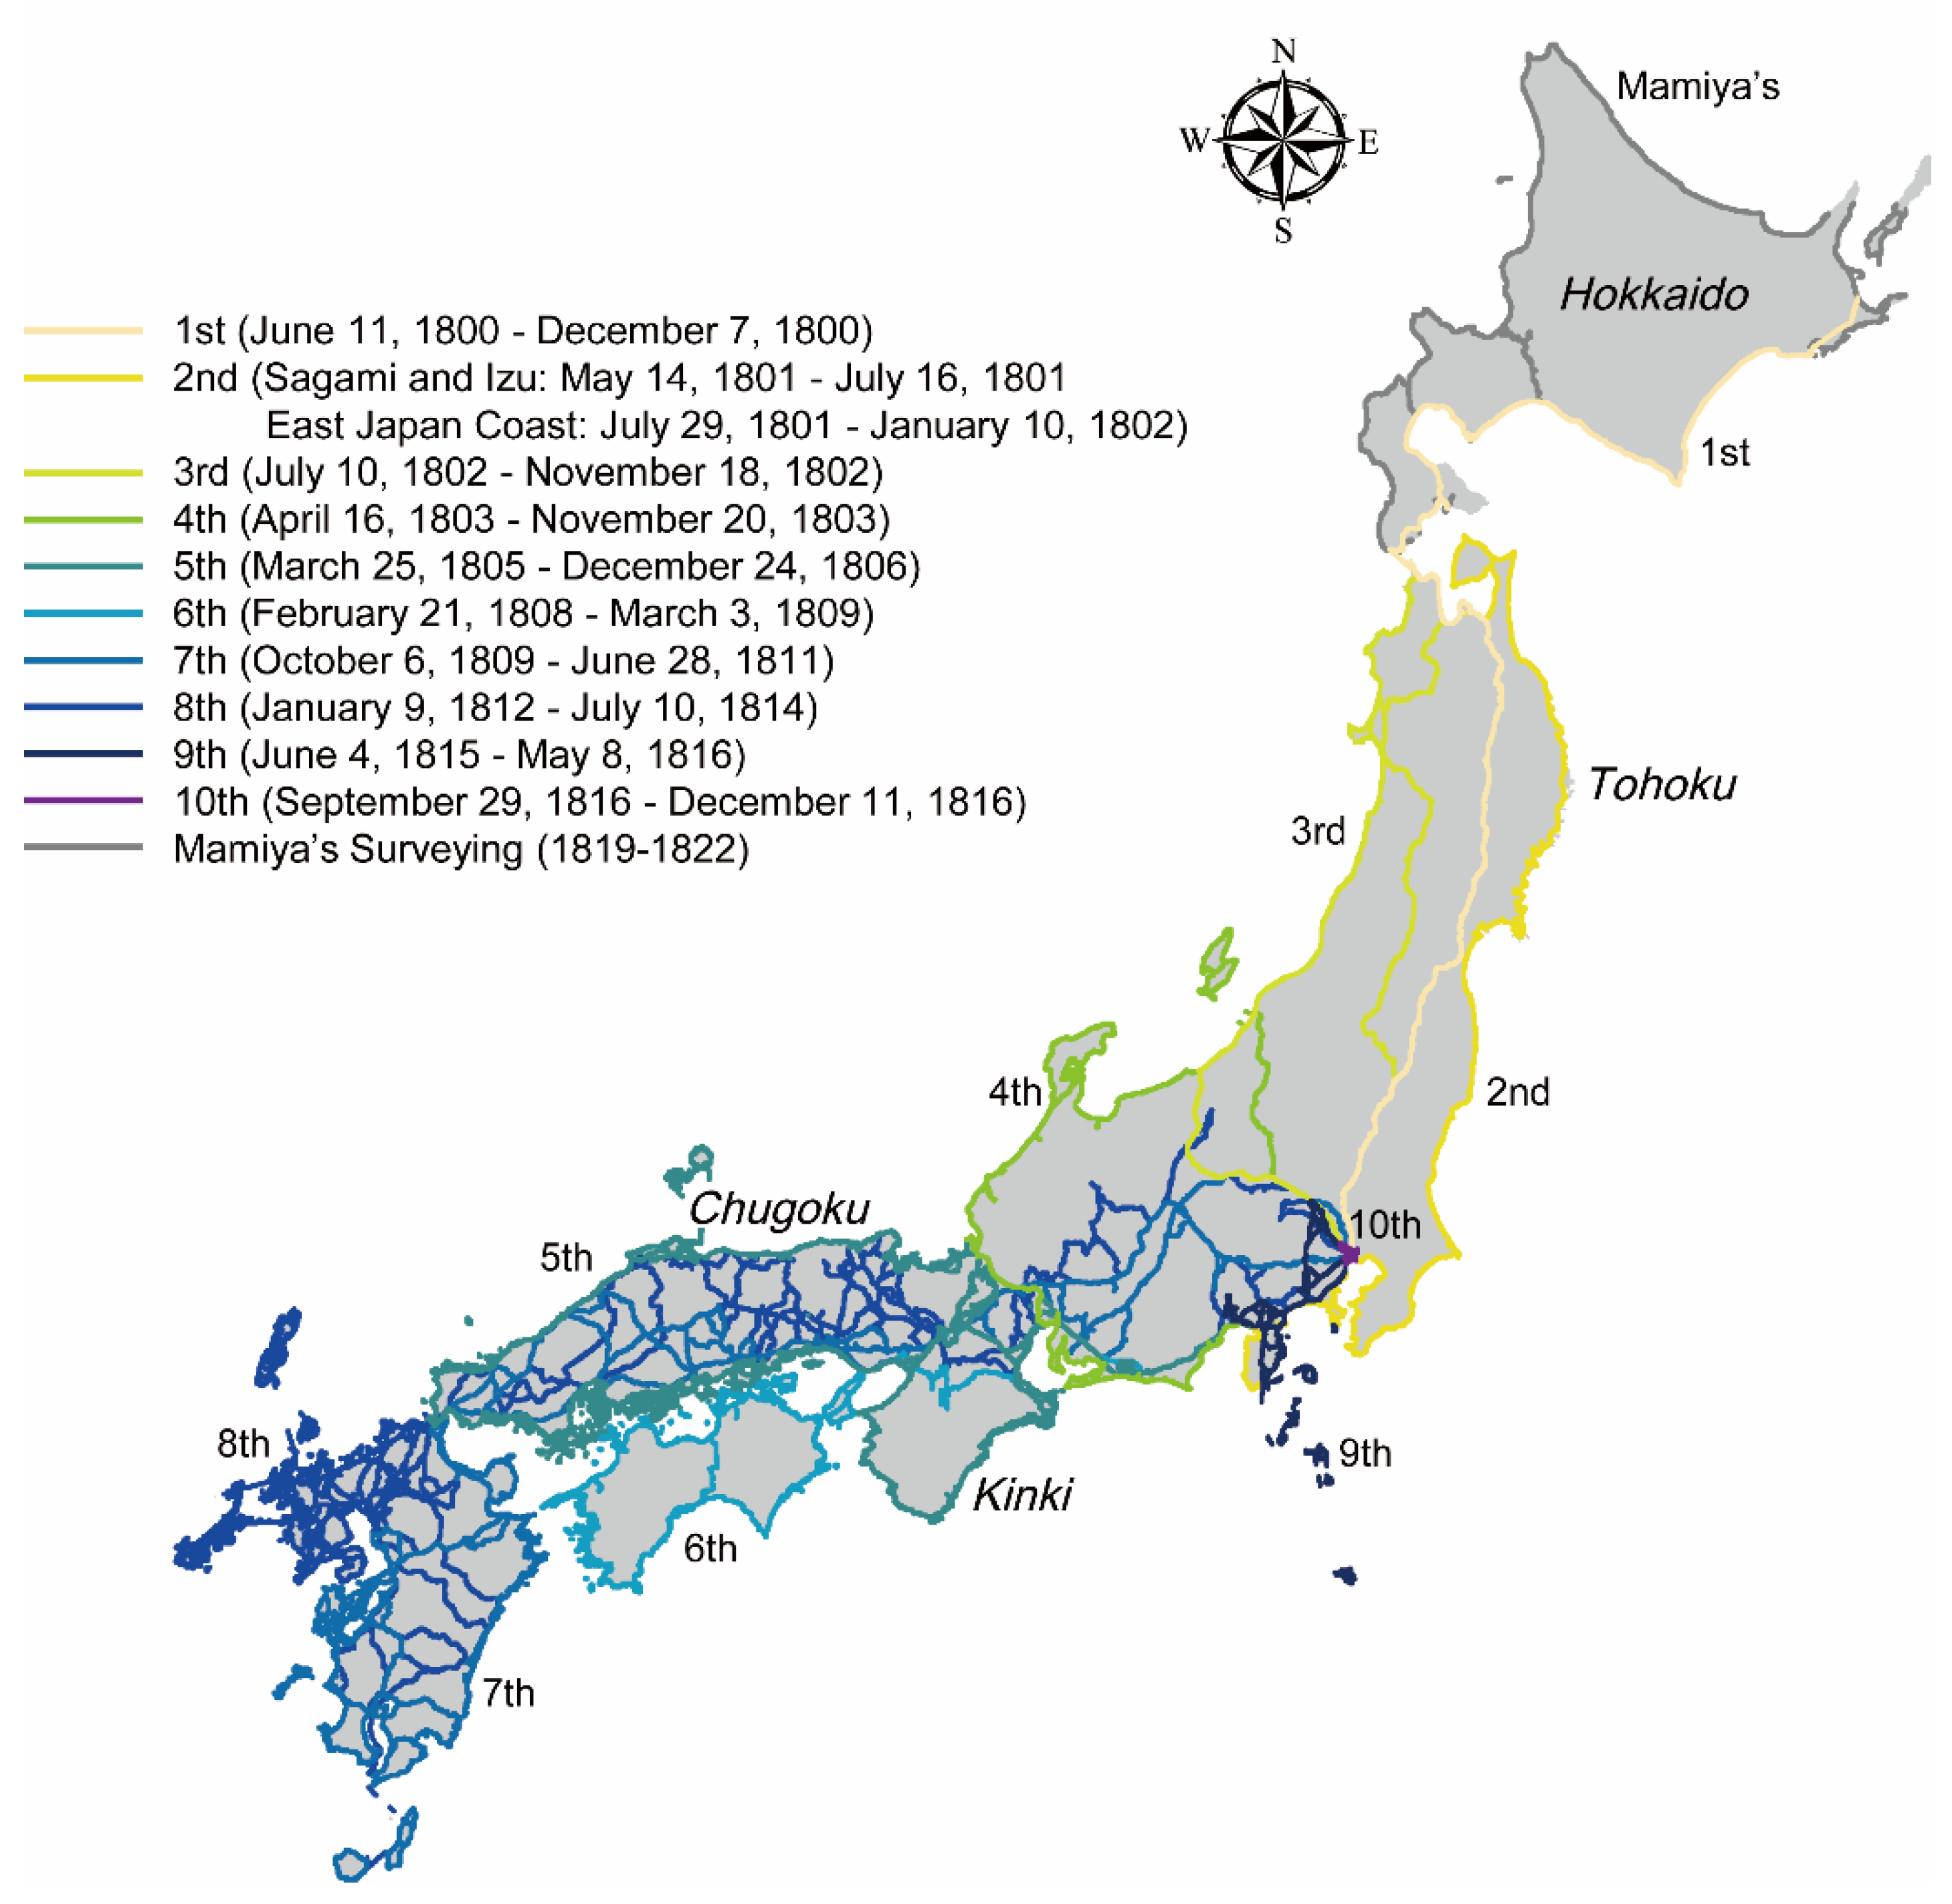
Inoh’s map consists of several different scales to represent the whole of Japan (3 small-scale maps about 1:432,000, 8 medium-scale maps about 1:216,000, and 214 large-scale maps about 1:36,000). To create a precise national map, Inoh Tadataka carried out 10 survey trips between 1800 and 1816 (Figure 1). Hokkaido was surveyed during the first expedition launched in 1800. Surveying in western Japan began in 1805. From the fifth survey in the Kinki and Chugoku regions, the project had gained enough financial support and direct management by the Shogunate government [3]. After that, the size of Inoh’s team had been upgraded drastically with rich equipment. The combination of the open traversing and forward intersection functioned efficiently for accurate surveying at that time [4]. Using the latitude astronomical observation, Inoh Tadataka attempted to correct the map errors caused by open traversing [5]. Furthermore, he added the measurement of coastlines from the sea by boat to overcome topographical obstacles (in this paper, this method is considered estimation).
Many studies have demonstrated that Inoh’s map is very accurate [6,7,8]. However, the coastlines surveyed by Inoh accounted for only 75% of the total in the country (Figure 2). The remaining 25% were drawn by his estimation (including indirect surveys from the sea and visual observation) [9], which is defined as the non-surveyed coastlines in this study. For the scientific discussion on the accuracy of Inoh’s map, it is important to specify the places that were not surveyed, identify their geographical characteristics, and find out why these coastlines were not directly surveyed. A survey at Inoh’s time might be complex, especially for the rias (jagged coastlines) in northern Japan, where steep terrains were dominant in the coastal region. It is also essential to examine the accuracy of the observed non-surveyed coastlines to discuss the limitations of surveying in that period. Based on the above background, this study investigates the geographical characteristics of the non-surveyed coastlines by analyzing their distributions, physical conditions, and differences between the estimated and actual coastlines at that time.
Figure 1.
Roads and coastlines in Inoh’s map. The date of the survey is based on [10]. Mamiya Rinzo learned surveying from Inoh Tadataka, and he was in charge of surveying Hokkaido (Ezo) [11]. Source: Digital Inoh’s Map.
GIS-based analysis on historical maps has been conducted for restoring landscapes and geographical features to their state at the map’s creation. Previous studies have examined historical maps by employing residual components for georeferencing (e.g., X, Y, etc.) [12,13,14,15,16,17]. For instance, Hirai [18] introduced a sophisticated method to analyze the distortion based on residual information from georeferenced historical maps. For the location errors of geographical features in historical maps, many studies have demonstrated the usefulness of overlay with other accurate maps [19,20,21]. Iwai and Murayama [22] discussed the distortion factors in Inoh’s Tokyo map regarding the projection aspects and the surrounding geographical environment. Further, there were extensive studies on the changes in the landscape between the past and present [23,24,25,26,27,28,29,30]. The spatial transformation of the landscape and regional structure over a long period was the main target of these studies. However, their use of GIS and spatial analysis was not much concerned with investigating landscape features concerning how the historical maps were made (or where the surveying was conducted).
2. Materials and Methods
Unfortunately, to the best of our knowledge, accurate historical maps showing non-surveyed coasts do not exist today. So that, we cannot obtain the actual (correct) shape of the coastlines in the early 19th century. However, it is reasonable to assume that most coastlines have retained the same condition until now. Hence, we use the current map published by the Geospatial Information Authority (GSI) of Japan to elucidate the geographical features of those days (According to the GSI website, the GSI map defines the coastline as the boundary between the land and the sea when the sea level reaches its highest level. This coastline definition is the same as Inoh’s map [3]). In addition, we exclude the coastlines changed by anthropogenic activities (terrain modification) in this analysis.
It is noteworthy that the remarkable transformation in coastlines in Japan started after the Meiji period (1868–1912) due to rapid modernization, such as constructing ports, reclaiming wetlands, etc. In this study, such changed coastlines are designated as “unknown” because we cannot visualize their exact shape in the early 19th century. We focus on the non-surveyed (estimated) coastlines of “cliff,” “rocky beaches,” and “wetlands” (including rice fields and tidal flats) that were supposed to be unchanged during the last 200 years (Figure 3) (According to the GSI website, a cliff is defined as a steep slope at least 3 m high and 75 m long. The rocky beach is a beach made up of rocks that are scattered around. Wetlands are a minimum of 75 m by 75 m or 50 m by 125 m. A tidal flat is defined as an area of sand, mud, etc., at least 50 m by 50 m). The effects of erosion and other factors are discussed later.
By overlaying Inoh’s map with the GSI map, we can compare the non-surveyed (estimated) coastlines with the actual coastlines. The Inoh’s map used in this study is the Digital Inoh’s Map, Professional Edition (from now on referred to simply as “Digital Inoh’s Map”), which is a georeferenced Inoh’s large-scale map (scale 1: 36,000) [31]. In the Digital Inoh’s Map, georeferencing was conducted to collate the curved sections and branching points of the existing roads and coasts on the GSI map. Control points were set up at shrines and temples, whose locations have been fixed until the present. At least 50 control points (at most 200 control points) were acquired for a single Inoh’s large-scale map [31]. Figure 4 shows the non-surveyed coastlines in Inoh’s map and the actual coastlines of those days (substituted by GSI map). The shape of each non-surveyed coastline is different from the shape of the actual coastline. This is because the non-surveyed coastline was drawn from the tip of the surveyed coastline by estimation (observation). Therefore, it is considered that the difference is larger further away from the surveyed coastline.
It is preferable to use the topographic map of the same era, but there are no national maps showing land use or terrain in the late Edo period. Therefore, the GSI map was used in this study to supplement national scale topographic and land use information. We constructed the non-surveyed sections using the coastline data of the GSI map and combined the topographic and land use information with Inoh’s map. The criterion for determining the topography and land use of the non-surveyed coast was based on the nearest adjacent map symbol in the GSI map (Figure 5).
The spatial difference (gap) between non-surveyed and actual coastlines was visualized as follows. First, the data for the coastlines were converted from line data to polygon data. Next, both polygon data were superimposed to derive the difference between the seaward and landward of the current coastline. The surveyed coastline data include a small number of coastlines based on the shape of the georeferenced Inoh’s large-scale map. In this study, the gaps generated from the surveyed coastline were not considered because the purpose was to evaluate the accuracy of the non-surveyed coastline. Figure 6 indicates the example of derived gaps.
3. Results
First, we identified the geographical features of the non-surveyed (estimated) coastlines. Then, we compared the difference (gap) between the non-surveyed (estimated) coastline and the actual coastline, focusing on the landscape features in the specified locations, given that the estimated coastline was explored from the land and sea.
3.1. Relationship between Non-Surveyed Coastline Distribution and Topographical/Land Conditions
Our spatial analysis reveals that 38.6% of the non-surveyed coastlines were cliffs, 25.7% were rocky beaches, and 6.2% were wetlands and tidal lands. The muddy coastline with tidal flats was also depicted on the basis of Inoh’s estimation (including visual observation from the sea) without actual surveying, even on a flat coast. The results show that land reclamation modified 29.5% of the coastline over the last 200 years. However, the terrain of the coastlines of those days was unknown because there were no data.
Figure 7 displays the distribution of non-surveyed coastlines by terrain and land classification. Cliffs and rocky beaches are prevalent in rias and peninsulas across Japan. Most of these coasts have kept the shapes unchanged during the last 200 years, and therefore the results of the analysis are valid. However, as the coastlines in wetlands and tidal lands were not surveyed in Inoh’s map, the coastlines were not easy to identify. As is well known, various reclamation projects targeting wetlands and other regions had started in different parts of the country since the Meiji era (1868–1912), which had led to the rapid development of ports, industrial sites, and residential areas.
Cliffs are predominantly distributed along the cape’s tip in the rias, and rocky beaches are adjacent to cliffs in the Tohoku region. The “unknown” coastlines are predominantly spread in the bay. “Unknown”, which accounts for approximately 30% of all non-surveyed coastlines on the main islands, can be found scattered primarily near large cities and on intricate coasts. Specifically, “unknown” corresponds to harbors, factories, idle land, and parks in the present.
3.2. Differences between Non-Surveyed Coastlines and Actual Coastlines
Figure 8 displays the distribution of the gaps in the non-surveyed coastlines. At first glance, it appears that the gaps are prominent on capes, especially in the rias. Bays tend to be less uncertain than capes. The non-surveyed coastlines with flat terrain have smaller gaps. As shown in ⑤ and ⑥ in Figure 8, the non-surveyed coastlines in western Japan have relatively high accuracy.
In the next step, we examine the characteristics in the gaps, linking them with the terrain and land use conditions. First, terrain and land use gaps are calculated as the percentage of terrain and land use in the non-surveyed coastlines adjacent to the gaps.
Table 1 shows the area of the gaps based on terrain and land use. As a result of comparing cliffs and rocky beaches, the total area of the gaps was 1.5 times larger for cliffs. In addition, the difference in the direction of the gaps (on the sea or landward of the current coastline) is more prominent for cliffs than for rocky beaches. The gap area on the seaward of the present coast is approximately 2 times larger than the landward. Inoh’s team recognized that the coastline facing the cliffs protruded more toward the sea.
3.3. Non-Surveyed Coastline Drawn by Sea-Based Measurement
The accuracy of the coastlines drawn by sea-based measurement (without actual surveying) was investigated, and the working section was visualized spatially using GIS (Figure 9). The exploration from the sea was often found in areas with complex coastal terrain. For example, in the Tohoku region, where rias were dominant, 61.4% was occupied by sea-based measurements.
Measuring from the sea by boat was conducted 303 times in the whole of Japan. The total distance was 468.0 km, accounting for 10.9% of the whole non-surveyed coastline. The maximum and minimum length difference was greater than 40 km (max = 44.7 km, min = 0.1 km). The average length was 1.5 km per section. The average distance became shorter in the later years of the ten survey trips. This means that the measurement from the sea became more elaborate over time.
Table 2 shows the topographical characteristics of the non-surveyed coastlines drawn by sea-based measurement. Excluding “unknown”, the rocky beaches (147.6 km, 31.5%) reveal the most significant distribution of the coastlines measured by boat (not actual surveying). Here, “unknown” includes small sandy beaches between cliffs, such as Ago Bay, and ports in bays without rocky beaches. On the other hand, sea-based measurement by boat was not generally carried out in wetlands and tidal lands.
In Table 3, excluding “unknown,” the total area of the gaps is the largest for rocky beaches (13.9 km2). In addition, the direction of the gaps is more outstanding on the landward of the current coastline for both cliffs and rocky beaches.
4. Discussion
This section discusses the validity of our study and the contribution to historical GIS. Inoh’s map had the highest accuracy, but Inoh could not survey 25% of the total coastlines. The non-surveyed coastlines drawn by estimation were in places where actual surveying was impossible due to technical problems.
70.5% of these non-surveyed coastlines were in “cliffs, rocky beaches, wetlands and tidal lands”. In this study, we classified the remaining 29.5% as “unknown”. Unfortunately, we cannot obtain the exact coastlines of the “unknown”. In the early 19th century, most of the unknown coastlines were in wetlands or tidal flats and are on reclaimed land today. A good example showing this situation is in Tokyo Bay (Figure 10). This figure shows the spatial relationship between the non-surveyed coastline and land use patterns in the middle Meiji period (Ihoh estimated the coastline of Tokyo Bay along the coastal roads because the actual survey was not possible). Tokyo Bay was covered with tidal flats in the early 19th century (which has been reclaimed into agricultural land, factory sites, housing estates, etc., since the modernization period). Using GIS, we superimposed the non-surveyed coastlines in Inoh’s map, the old land use maps in 1881–1882, and the current GSI map.
We found that the inland distributions of tidal flats and non-surveyed (estimated) coastlines were almost consistent. This approach would be applicable to the coastal areas of large cities such as Nagoya and Osaka and regions along the coast of the Sea of Japan, where land reclamation had been very active (fortunately, many land use maps are available for these regions). Therefore, the proportion of wetlands and tidal lands (6.2%) seems to be underestimated because the unknown (29.5%) includes swampy lands. In other words, non-surveyed (estimated) coastlines, which were in places where actual surveying was difficult, were expected to be more than 70.5%. In addition, since Japan belongs to the Circum-Pacific Belt, more than two-thirds of the country are mountainous [32]. Thus, steep topographical surfaces might have had a negative influence on the surveying practice.
As Figure 8 shows, overall, the non-surveyed (estimated) coastlines were more accurate in western Japan than in eastern Japan because of the solid financial support by the central government [3]. Focusing on the landscape features, the gap between the non-surveyed coastlines and the actual coastlines was the greatest in cliffs (Table 1). It means that the estimation of rocky beaches is more accurate in comparison with cliffs. Most rocky shores were in bays, and the distance from the estimation point was relatively short. Therefore, rocky shores were more accessible for Inoh’s team.
On the other hand, the largest distributor of the non-surveyed coastlines in the sea-based measurement was found on rocky beaches (Table 2). Comparison of the accuracy between the land-based and sea-based measurements shows that the error was minor for the sea-based measurement, regardless of the landscape features. Inoh’s team often rented boats from villagers [33]; boat use might have been effective in reducing uncertainty because the coastline gaps estimated by sea-based measurements were generally small (as seen by comparing Table 1 and Table 3).
According to the direction of the gaps, we can say that the seaward for the land-based estimates and the landward for the sea-based estimates were prominent, respectively (Table 1 and Table 3). It suggests that Inoh perceived the coastline as further away than it was, regardless of forecasts from the land or sea. Therefore, we conclude that a specific spatial distortion existed in Inoh’s cognition of the distance, more or less.
Our findings contribute to interpreting the uncertainty in the past coastlines and the use of GIS in historical maps. Firstly, as [34] states, geomorphological factors were not discussed in the previous historical GIS studies, although the land use pattern was well-considered. In contrast, we could examine the relationship between surveying situations and topography using Inoh’s map and GIS techniques. Secondly, our study succeeded in delineating the surveying activity quantitatively on a nationwide scale. On the contrary, in previous studies, surveying was mainly analyzed using the survey logbook [33]. Thirdly, our study examined the coastline accuracy (i.e., Inoh’s cognition) from the geographical conditions of the coasts. Thus, this study might be the first approach combining historical GIS and critical cartography [35].
5. Conclusions
For the discussion on the accuracy of Inoh’s map, it is crucial to examine why these coastlines were not directly surveyed. This study focused on the non-surveyed coastline drawn by estimation in Inoh’s map and investigated their distributions, physical conditions, and differences with actual coastlines at that time. Over 70% of all non-surveyed coastlines were situated in “cliffs, rocky beaches, wetlands, and tidal lands”. We conclude that the non-surveyed coastlines were in places where actual surveying was not possible by using the surveying technology available at that time. The approach used in this study can be applied for examining the survey accuracy of historical maps in other countries.
Finally, we would like to note several remaining tasks and future research possibilities. First, this study assumed that geographical changes in coastal areas are small in cliffs and rocky beaches because man-made modifications to the cliffs and rocky shores are limited compared to wetlands and tidal lands. In this connection, we thought the present-day GSI map was substitutable as a base map showing steep topographical areas in the early 19th century. However, we must note that the coastline shape of cliffs and rocky beaches is continuously changing due to erosion by waves (at least 0.3m per year) [36]. Although our results show that the difference between the GSI and Inoh’s maps tends to be larger than the effect of erosion (Table 1), a more sophisticated approach is necessary to check the influence of the erosion phenomena. Second, the Digital Inoh’s Map (Professional Edition) we used was a georeferenced map, not the original. In addition, we regarded the surveyed coastlines to be consistent with the GSI map. However, we found there was distortion between them, and thus we must check the setting of the control points in the Digital Inoh’s Map. Third, cliffs and rocky beaches in some coastal areas were directly surveyed by Inoh’s team. Thus, it is an important task to investigate why actual surveying became possible in these coastal areas.
There is room to study Inoh’s map from a historical GIS viewpoint. Inoh’s survey logbook (diary) is also helpful in assessing Inoh’s team’s activities. As Inoh’s map is valuable historical material among various maps prepared on a national scale, empirical scientific research on regional differences is required to develop quantitative historical geography.
Author Contributions
Conceptualization, Yuki Iwai and Yuji Murayama; writing—original draft preparation, Yuki Iwai and Yuji Murayama; writing—review and technical analysis for spatial analysis and visualization, Yuki Iwai; supervision, Yuji Murayama. All authors have read and agreed to the published version of the manuscript.
Funding
We used Grant-in-Aid for Scientific Research (C) 21K01027 to carry out this research.
Acknowledgments
The authors would like to express their gratitude to Kota Inohara (Tokyo Cartographic Co., Ltd.) for arranging the surveying data in “Digital Inoh’s Map”. We are indebted to the Inoh Tadataka Study Group members for the place name index and the translation of the survey diary into modern languages. We are also grateful for the insightful and constructive comments of the audience at the AAG Annual Meeting 2021.
Conflicts of Interest
The authors declare no conflict of interest.
References
- Hoshino, Y. The Inoh’s survey and its evaluation: Comparison with the country scale surveys around the Inoh’s survey. Map J. Jpn. Cartogr. Assoc. 2018, 56, 1–8. [Google Scholar]
- Kawamura, H. The Study of Kuni-Ezu Compiled by the Tokugawa Shogunate; Kokon Shoin: Tokyo, Japan, 1984. (In Japanese) [Google Scholar]
- Tokyo Geographical Society. A Recent Knowledge of Ino-Tadataka’s Map; Asakura Shoten: Tokyo, Japan, 1998. (In Japanese) [Google Scholar]
- Hoshino, Y. Some issues raised by Inoh Tadataka’s nationwide survey. J. Geogr. (Chigaku Zasshi) 2020, 129, 227–240. [Google Scholar] [CrossRef]
- Nogami, M. Techniques to secure precision of the open traverse surveying of Ino Tadataka. Map J. Jpn. Cartogr. Assoc. 2019, 57, 1–13. [Google Scholar]
- Sato, H. Shoreline changes on the Toyama and Buzenbungo coasts during 1807–1907 by comparison of Maps. Trans. Jpn. Geomorphol. Union 2000, 21, 451–467. [Google Scholar]
- Tanaka, H.; Matsutomi, H.; Izumi, N. A study on the long-term changes of coastlines in Sendai and Ishinomaki cities using historical maps. Proc. Coast. Eng. JSCE 2005, 52, 556–560. [Google Scholar]
- Iwai, Y.; Murayama, Y. Overlay analysis of the Inoh’s map and the present map: Geographical changes in Japanese national land in the last 200 years. Geogr. Sp. 2021, 14, 19–35. [Google Scholar]
- Iwai, Y.; Murayama, Y.; Inohara, K. Spatial analysis of Inoh’s map using GIS with the focus on national land changes over 200 years in Japan. J. Geogr. (Chigaku Zasshi) 2020, 129, 215–226. [Google Scholar] [CrossRef]
- Hoyanagi, M. A New Appreciation of the Scientific Achievement of Ino-Tadataka Who Established a Landmark in the History of Land-Survey and Cartography of Japan; Hoyanagi, M., Ed.; Kokon Shoin: Tokyo, Japan, 1974. (In Japanese) [Google Scholar]
- Watanabe, I.; Yokomizo, K. Comparison of Inoh Tadataka’s first survey Hokkaido map and final Inoh’s Map (Mamiya’s Map). Stud. Inoh Tadataka 2015, 75, 1–19. [Google Scholar]
- Hu, B. Assessing the accuracy of the map of the prefectural capital of 1261 using geographic information systems. Prof. Geogr. 2001, 53, 32–44. [Google Scholar] [CrossRef]
- Claeys Boùùaert, M.; De Baets, B.; Vervust, S.; Neutens, T.; De Maeyer, P.; Van de Weghe, N. Computation and visualisation of the accuracy of old maps using differential distortion analysis. Int. J. Geogr. Inf. Sci. 2016, 30, 1255–1280. [Google Scholar] [CrossRef]
- Jongepier, I.; Soens, T.; Temmerman, S.; Missiaen, T. Assessing the planimetric accuracy of historical maps (sixteenth to nineteenth centuries): New methods and potential for coastal landscape reconstruction. Cartogr. J. 2016, 53, 114–132. [Google Scholar] [CrossRef]
- Schaffer, G.; Peer, M.; Levin, N. Quantifying the completeness of and correspondence between two historical maps: A case study from nineteenth-century Palestine. Cartogr. Geogr. Inf. Sci. 2016, 43, 154–175. [Google Scholar] [CrossRef]
- Armstrong, M. How large is Aroostook County? Exploring the historical mutability of US county area measurements. Cartogr. Geogr. Inf. Sci. 2018, 45, 438–455. [Google Scholar] [CrossRef]
- Uhl, J.; Leyk, S.; Chiang, Y.-Y.; Duan, W.; Knoblock, C. Map archive mining: Visual-analytical approaches to explore large historical map collections. ISPRS Int. J. Geo-Inf. 2018, 7, 148. [Google Scholar] [CrossRef] [Green Version]
- Hirai, S. An Analysis of the Maps of Early Modern Japanese Castle Towns; Kokon Shoin: Tokyo, Japan, 2019. (In Japanese) [Google Scholar]
- Plewe, B. The nature of uncertainty in historical geographic information. Trans. GIS 2002, 6, 431–456. [Google Scholar] [CrossRef]
- Plewe, B. Representing datum-level uncertainty in historical GIS. Cartogr. Geogr. Inf. Sci. 2003, 30, 319–334. [Google Scholar] [CrossRef]
- Tucci, M.; Giordano, A. Positional accuracy, positional uncertainty, and feature change detection in historical maps: Results of an experiment. Comput. Environ. Urban Syst. 2011, 35, 452–463. [Google Scholar] [CrossRef]
- Iwai, Y.; Murayama, Y. Geographical analysis on the projection and distortion of INŌ’s Tokyo Map in 1817. ISPRS Int. J. Geo-Inf. 2019, 8, 452. [Google Scholar] [CrossRef] [Green Version]
- Wilson, J. Historical and computational analysis of long-term environmental change: Forests in the Shenandoah Valley of Virginia. Hist. Geogr. 2005, 33, 33–53. [Google Scholar]
- Yano, K.; Nakaya, T.; Isoda, I.; Takase, I.; Kawasumi, T.; Matsuoka, K.; Seto, T.; Kawahara, D.; Tsukamoto, A.; Inoue, M.; et al. Virtual Kyoto: 4DGIS comprising spatial and temporal dimensions. J. Geogr. (Chigaku Zasshi) 2008, 117, 464–478. [Google Scholar] [CrossRef] [Green Version]
- Tucci, M.; Giordano, A.; Ronza, R. Using spatial analysis and geovisualization to reveal Urban Changes: Milan, Italy, 1737–2005. Cartographica 2010, 45, 47–63. [Google Scholar] [CrossRef]
- Jenny, B.; Hurni, L. Studying cartographic heritage: Analysis and visualization of geometric distortions. Comput. Graph. 2011, 35, 402–411. [Google Scholar] [CrossRef]
- Yang, Y.; Zhang, S.; Yang, J.; Chang, L.; Bu, K.; Xing, X. A review of historical reconstruction methods of land use/land cover. J. Geogr. Sci. 2014, 24, 746–766. [Google Scholar] [CrossRef]
- Nobajas, A.; Nadal, F. From historical map to online 3D recreation: The 1861 cadastral map of Horta (Barcelona). Cartogr. Geogr. Inf. Sci. 2015, 42, 211–223. [Google Scholar] [CrossRef] [Green Version]
- Pindozzi, S.; Cervelli, E.; Capolupo, A.; Okello, C.; Boccia, L. Using historical maps to analyze two hundred years of land cover changes: Case study of Sorrento peninsula (south Italy). Cartogr. Geogr. Inf. Sci. 2016, 43, 250–265. [Google Scholar] [CrossRef]
- Lieskovský, J.; Kaim, D.; Balázs, P.; Boltižiar, M.; Chmiel, M.; Grabska, E.; Király, G.; Konkoly-Gyuró, É.; Kozak, J.; Antalová, K.; et al. Historical land use dataset of the carpathian region (1819–1980). J. Maps 2018, 14, 644–651. [Google Scholar] [CrossRef] [Green Version]
- Murayama, Y. Digital INO’s Map, Professional Edition; Kawade Shobo Shinsha: Tokyo, Japan, 2015. (In Japanese) [Google Scholar]
- Association of Japanese Geographers (Ed.) Geography of Japan; Teikoku Shoin: Tokyo, Japan, 1980. (In Japanese) [Google Scholar]
- Watanabe, I. About the fourth survey. Stud. Inoh Tadataka 2016, 80, 18–26. [Google Scholar]
- Gupta, E.; Rajani, M.B. Historical coastal maps: Importance and challenges in their use in studying coastal geomorphology. J. Coast. Conserv. 2020, 24, 1–7. [Google Scholar] [CrossRef]
- Crampton, J.W.; Krygier, J. An introduction to critical cartography. Acme 2006, 4, 11–33. [Google Scholar]
- Uda, T. Coastal Erosion in Japan; Sankaido: Tokyo, Japan, 1997. (In Japanese) [Google Scholar]
Figure 2.
Coastlines in Inoh’s large-scale maps (1821). Only major islands of the Japanese archipelago (Hokkaido, Honshu, Shikoku, and Kyushu) are displayed. The image is superimposed on the georeferenced Inoh’s large-scale map. Source: Digital Inoh’s Map.
Figure 2.
Coastlines in Inoh’s large-scale maps (1821). Only major islands of the Japanese archipelago (Hokkaido, Honshu, Shikoku, and Kyushu) are displayed. The image is superimposed on the georeferenced Inoh’s large-scale map. Source: Digital Inoh’s Map.

Figure 3.
Topographical/land conditions: (a) cliffs, (b) rocky beaches, and (c) wetlands and mudflats. Source of photo: Google Earth Pro.
Figure 3.
Topographical/land conditions: (a) cliffs, (b) rocky beaches, and (c) wetlands and mudflats. Source of photo: Google Earth Pro.

Figure 4.
Example of a non-surveyed (estimated) coastline. The crimson line indicates the survey line corresponding to the road. Source: Digital Inoh’s Map and GSI map.
Figure 4.
Example of a non-surveyed (estimated) coastline. The crimson line indicates the survey line corresponding to the road. Source: Digital Inoh’s Map and GSI map.

Figure 5.
Examples of topographic and land use classification on the non-surveyed (estimated) coastlines: (a) cliffs, rocky beaches, and unknown, and (b) wetlands and mudflats. Non-surveyed coastlines were replaced by the current coastlines contained in the GSI map. Source: Digital Inoh’s Map and GSI map.

Figure 6.
Gap between the non-surveyed (estimated) coastline and the actual coastline. Source: Digital Inoh’s Map and GSI map.
Figure 6.
Gap between the non-surveyed (estimated) coastline and the actual coastline. Source: Digital Inoh’s Map and GSI map.

Figure 7.
Topographic and land use status of non-surveyed (estimated) coastline. Non-surveyed coastlines were replaced by the coastlines contained in the GSI map. Source: Digital Inoh’s Map and GSI map.
Figure 7.
Topographic and land use status of non-surveyed (estimated) coastline. Non-surveyed coastlines were replaced by the coastlines contained in the GSI map. Source: Digital Inoh’s Map and GSI map.
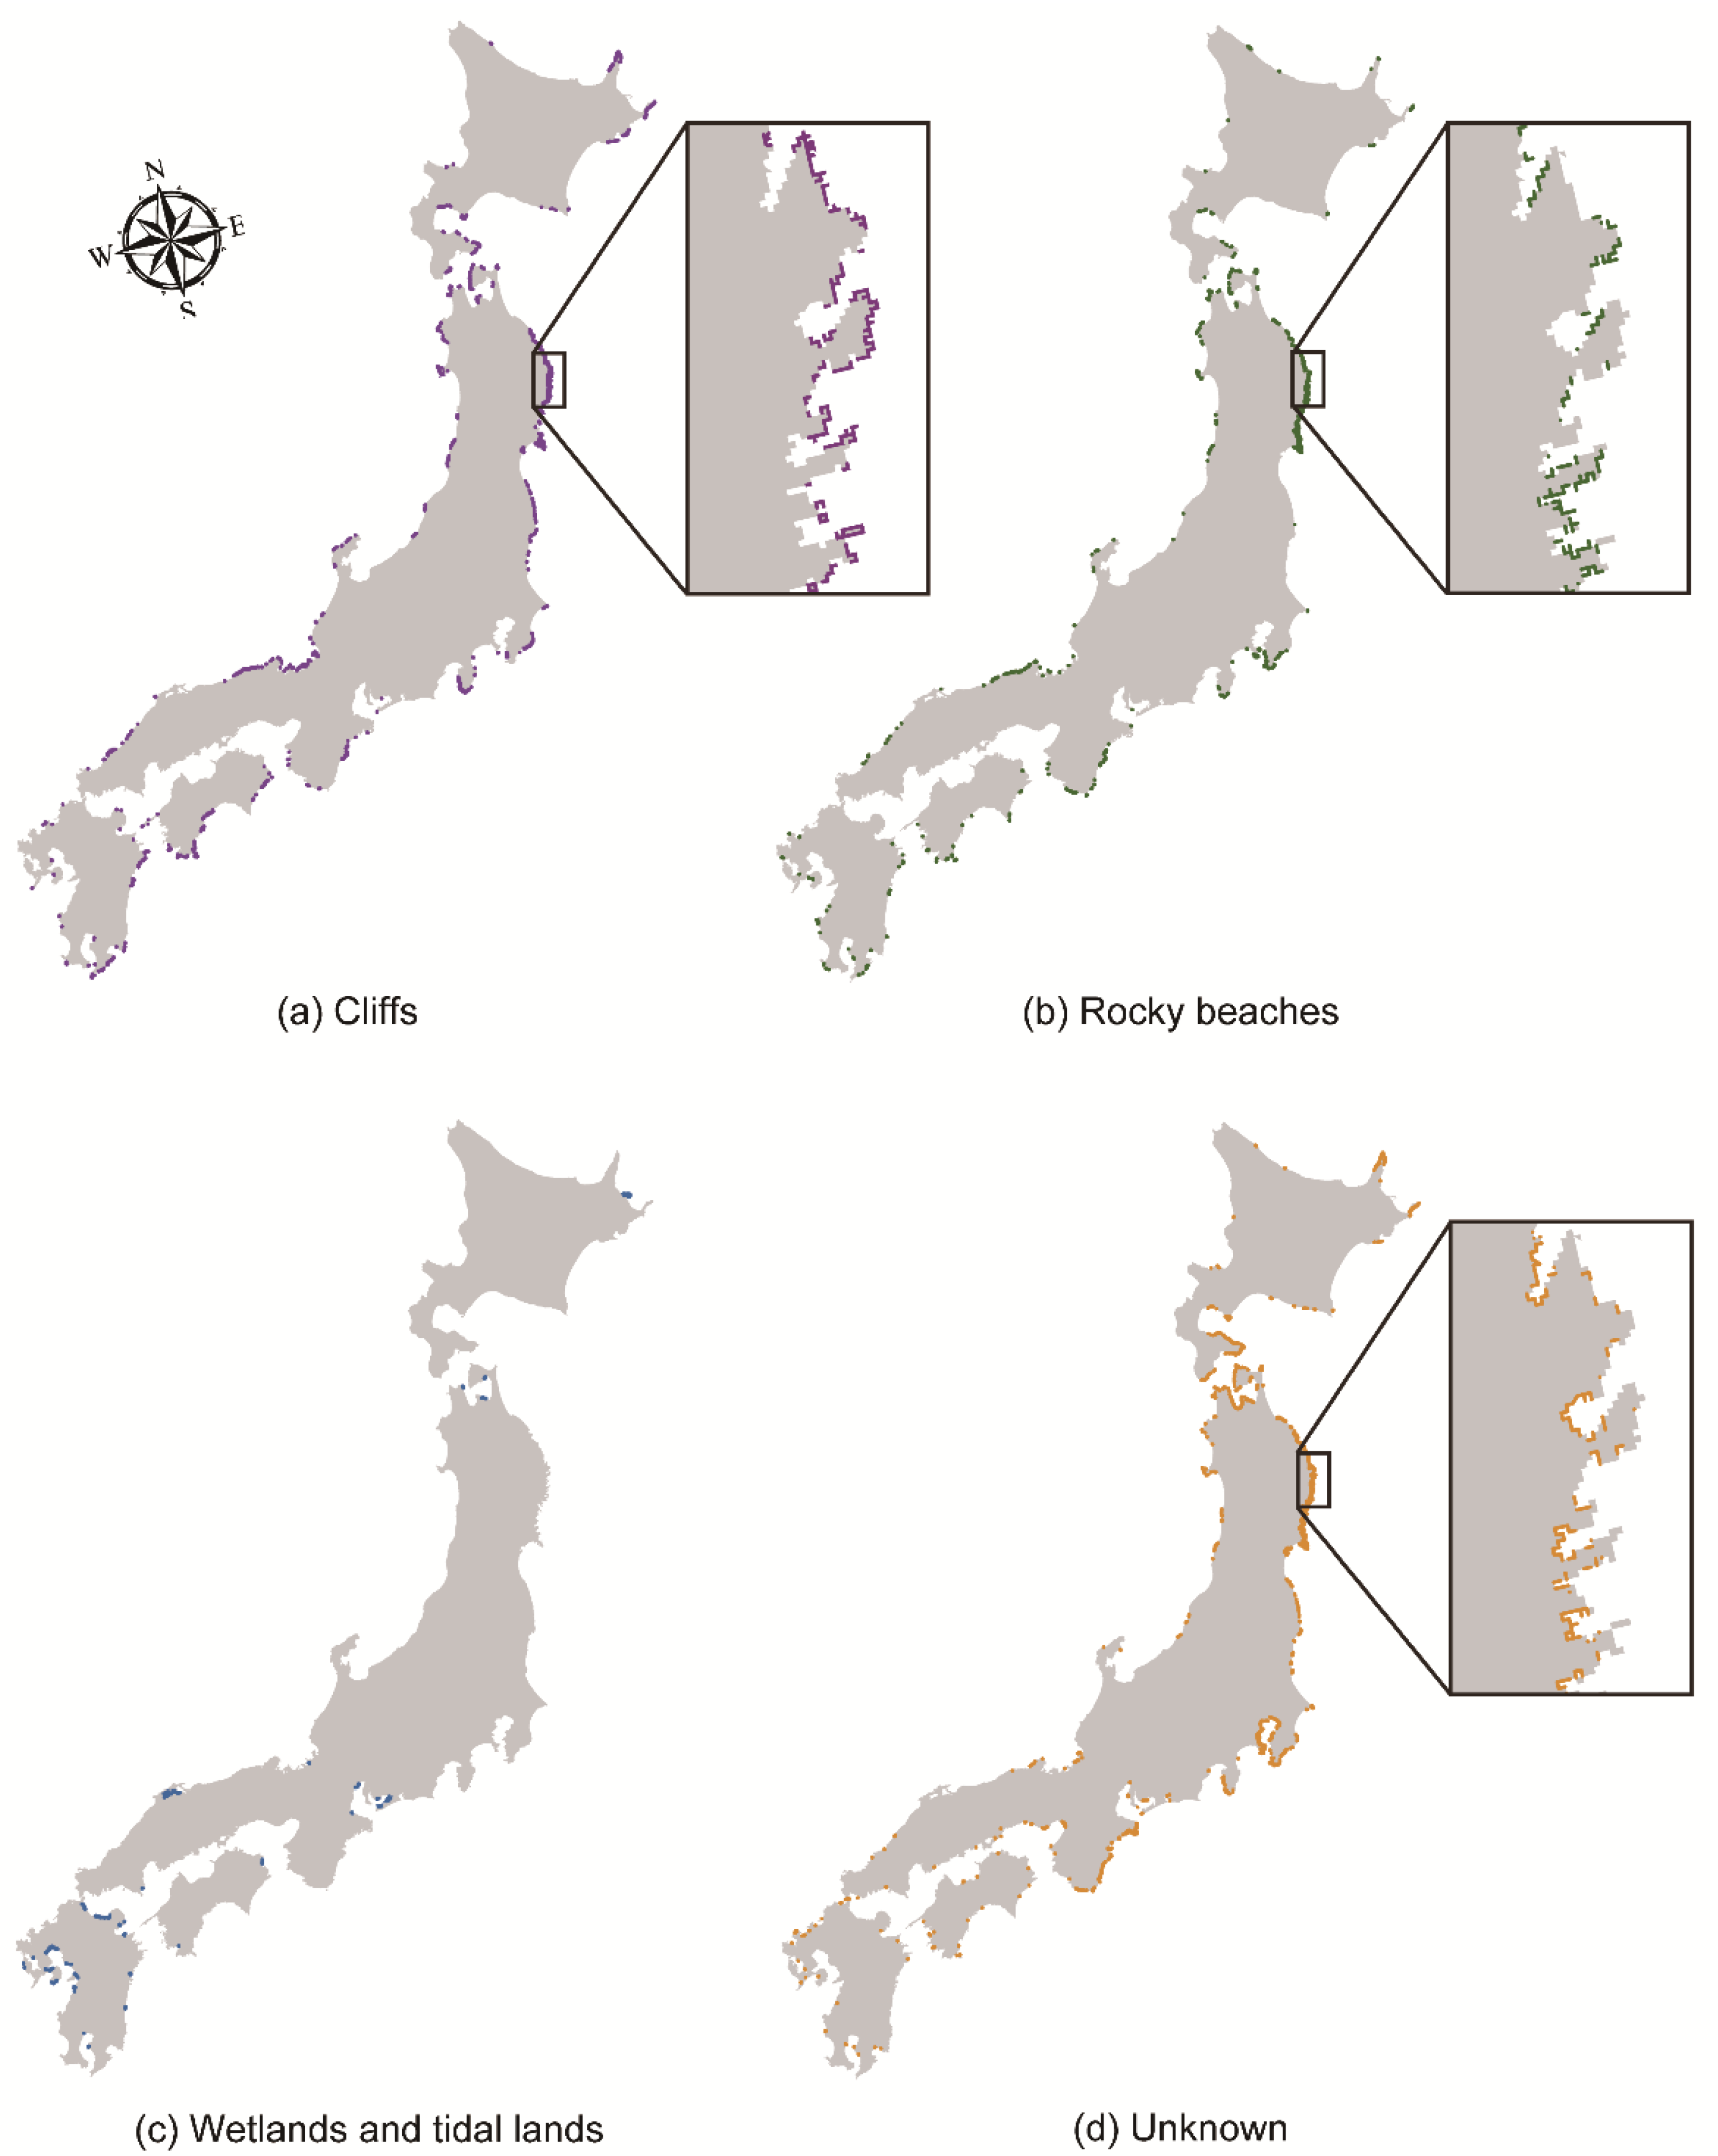
Figure 8.
Distribution of gaps in the non-surveyed (estimated) coastlines. The right maps show the enlarged views of each area.
Figure 8.
Distribution of gaps in the non-surveyed (estimated) coastlines. The right maps show the enlarged views of each area.

Figure 9.
Distribution of the map sections drawn by sea-based measurement. The right maps show the enlarged views of each area. Source: Digital Inoh’s Map.
Figure 9.
Distribution of the map sections drawn by sea-based measurement. The right maps show the enlarged views of each area. Source: Digital Inoh’s Map.

Figure 10.
Overlaying of the non-surveyed coastline and land use maps (1881–1882). The land use classification is based on the 1st Military District 1:20,000 Jinsoku-Sokuzu map. Source: Digital Inoh’s Map and Geospatial Information Authority of Japan.
Figure 10.
Overlaying of the non-surveyed coastline and land use maps (1881–1882). The land use classification is based on the 1st Military District 1:20,000 Jinsoku-Sokuzu map. Source: Digital Inoh’s Map and Geospatial Information Authority of Japan.


Table 1.
Number of gaps and their areas in the non-surveyed (estimated) coastlines in Japan.
| Classification | Total (km2) | Seaward of the Present Coastline | Landward of the Present Coastline | Average (km2) | Max (km2) | ||
|---|---|---|---|---|---|---|---|
| Number | Area (km2) | Number | Area (km2) | ||||
| Cliffs | 192.5 | 1553 | 126.5 | 1550 | 66.0 | 0.1 | 6.7 |
| Rocky beaches | 128.8 | 1135 | 72.9 | 1090 | 55.9 | 0.1 | 7.8 |
| Wetlands and tidal lands | 468.0 | 60 | 451.3 | 79 | 16.7 | 1.5 | 78.4 |
| Unknown | 559.1 | 1274 | 506.0 | 1281 | 53.1 | 0.2 | 15.3 |
Table 2.
Distance of non-surveyed (estimated) coastlines drawn by sea-based measurement in Japan.
| Classification | Total (km) | Rate of the Total (%) |
|---|---|---|
| Cliffs | 93.0 | 19.9 |
| Rocky beaches | 147.6 | 31.5 |
| Wetlands and tidal lands | 5.1 | 1.1 |
| Unknown | 222.4 | 47.5 |
Table 3.
Number of gaps and their areas in the non-surveyed (estimated) coastlines in Japan (the section of sea-based measurement).
Table 3.
Number of gaps and their areas in the non-surveyed (estimated) coastlines in Japan (the section of sea-based measurement).
| Classification | Total (km2) | Seaward of the Present Coastline | Landward of the Present Coastline | Average (km2) | Max (km2) | ||
|---|---|---|---|---|---|---|---|
| Number | Area (km2) | Number | Area (km2) | ||||
| Cliffs | 6.4 | 165 | 1.9 | 165 | 4.5 | 0.1 | 0.6 |
| Rocky beaches | 13.9 | 184 | 3.0 | 167 | 10.9 | 0.1 | 0.8 |
| Wetlands and tidal lands | 1.3 | 9 | 0.4 | 8 | 0.9 | 0.1 | 0.6 |
| Unknown | 25.8 | 405 | 15.2 | 382 | 10.6 | 0.1 | 5.4 |
Publisher’s Note: MDPI stays neutral with regard to jurisdictional claims in published maps and institutional affiliations. |
© 2021 by the authors. Licensee MDPI, Basel, Switzerland. This article is an open access article distributed under the terms and conditions of the Creative Commons Attribution (CC BY) license (https://creativecommons.org/licenses/by/4.0/).
Share and Cite
MDPI and ACS Style
Iwai, Y.; Murayama, Y. Geospatial Analysis of the Non-Surveyed (Estimated) Coastlines in Inoh’s Map, 1821. ISPRS Int. J. Geo-Inf. 2021, 10, 580. https://doi.org/10.3390/ijgi10090580
AMA Style
Iwai Y, Murayama Y. Geospatial Analysis of the Non-Surveyed (Estimated) Coastlines in Inoh’s Map, 1821. ISPRS International Journal of Geo-Information. 2021; 10(9):580. https://doi.org/10.3390/ijgi10090580
Chicago/Turabian StyleIwai, Yuki, and Yuji Murayama. 2021. "Geospatial Analysis of the Non-Surveyed (Estimated) Coastlines in Inoh’s Map, 1821" ISPRS International Journal of Geo-Information 10, no. 9: 580. https://doi.org/10.3390/ijgi10090580
Note that from the first issue of 2016, this journal uses article numbers instead of page numbers. See further details here.