Article

Impact of the Cartographer’s Position and Topographic Accessibility on the Accuracy of Historical Land Use Information: Case of the Second Military Survey Maps of the Habsburg Empire

Institute of Geography and Spatial Management, Faculty of Geography and Geology, Jagiellonian University, Gronostajowa 7, 30-387 Kraków, Poland
*
Author to whom correspondence should be addressed.
ISPRS Int. J. Geo-Inf. 2021, 10(12), 820; https://doi.org/10.3390/ijgi10120820
Submission received: 22 September 2021 / Revised: 18 November 2021 / Accepted: 1 December 2021 / Published: 4 December 2021

Abstract

:
Historical maps are critical for long-term land use reconstructions; however, quantifying the uncertainty involved in comparing historical maps with recent data remains a considerable challenge. To date, many works have focused on the technical aspects of comparing historical and contemporary materials, but the potential sources of uncertainty inherent in historical data remain poorly understood. In this paper, we analyze the impacts of the topographic accessibility and cartographer’s field position on the content quality of historical Austrian second military survey maps by referring to independent census data. Our results show that the topographic accessibility and visibility from the cartographer’s surveying table points had very little impact on the map content quality and that the surveying table point locations were uniformly distributed throughout the area, regardless of the landscape conditions. These findings demonstrate that the second military survey maps can be seen as valuable and consistent historical data sources, making them especially useful for long-term land use research in Central Europe.

1. Introduction

To date, dynamic land use changes have had substantial impacts on biodiversity [1], climate [2], and human well-being [3]. To assess the dynamics of such changes, long-term land change studies must be performed to facilitate a comparison with recent analyses. However, due to the limited availability of fully comparable remote sensing or statistical data [4], researchers often use regional archival maps to obtain historical land use information [5,6,7]. Since historical maps differ in scale, have inconsistent legends, or were produced with different aims, there is always uncertainty involved in using them for long-term comparisons [8,9,10]. The conceptual framework designed by Leyk et al. [11] to assess the level of uncertainty involved in such analyses distinguishes three independent domains of uncertainty for subsequent land use modelling—those inherent in historical data, those caused by data processing, and those dependent on the application. The assessment conducted by Leyk et al. [11] to evaluate the importance of these domains showed that the first domain—the uncertainty inherent in historical data (production-oriented uncertainty)—seems to be the most relevant.
In addition, automatic feature extraction techniques have been employed recently to acquire spatial information from historical maps referring mainly to the transformation-oriented uncertainty [12,13,14]. Nevertheless, the quality of the original historical cartographic work, instructions, equipment, or procedures and their impacts on the map content and subsequent analyses remain poorly understood. For instance, Jenny et al. [15] created a software package capable of illustrating local map distortions that helped to understand the spatial distribution of potential errors in a broad range of map series; however, the sources of distortion were not identified. Recently, Ostafin et al. [16] indicated that changes in the content of neighboring map sheets of the same type are connected to the map sheets’ authorship changes. Gimmi et al. [17] analyzed the contents of archival topographic maps against the true situations presented on orthophotos and terrestrial imagery serving as a proxy of the cartographer’s perspective and indicated greater discrepancies between the maps and reference data in less topographic accessible and less visible locations. However, analyzing the historical topographic accessibility or visibility of a location and their impact on the map content quality is usually difficult due to the unavailability of historical road networks available in geographic information system (GIS) formats and a lack of knowledge regarding the precise position of the cartographer’ in the field. Although accessibility is very often used as an important variable explaining environmental and social phenomena [18,19,20], usually proxy data are used in the form of current road networks, Euclidean distances to the settlements, or proximity to the waterways, instead of original, historical data [6,21].
In this paper, we were able to overcome both of the abovementioned obstacles and verify the impacts of these spatial determinants on the accuracy of Austrian second military survey maps covering a large portion of 19th century Europe [22,23]. The maps are a very popular source of historical information in the region and have thus far been used in many landscape-change analyses in different parts of Central Europe. The maps have been found useful for research on land use change [23,24,25], riverbed evolution [26], pond reconstruction [27], and landslide analyses [28]. Although the Austrian second military survey maps were produced as a form of generalization of the detailed cadastral maps (1:2880), little is known about the extent of changes, updates, and improvements done by the cartographers between the times of cadastral mapping (1844–1854 for Galicia) and military mapping (1861–1864 for Galicia). One can assume that the changes could be reflected in the independent census data collected in a similar period, however, due to a relatively short temporal framework of the map preparation, the potential updates could be also spatially determined and conducted mainly in the most accessible areas. Although reliability of the archival cartographic sources covering the Habsburg Empire are carried out [10,29,30], their authors indicate the necessity of further research, especially those focused on the comparability to other sources. It would be particularly useful in reconstruction of the land use over long time [31]. Similarly, like for the landscape painters, optimal location characterized by the high visibility enabled proper landscape reconstruction [32]; we also assumed that for the cartographers verifying and updating detailed cadastral information in order to create military maps, visibility played crucial work. Although general rules of the measurements conducting [33,34], or organizational structure [35,36,37] of the Austrian military cartography is well recognized, little is known about the impact of the local landscape conditions, or human factor on the quality of their work [16]. This might be especially important taking into account the size, weight, and quality of the former measuring equipment [38]. Specifically, we want to verify the role of the historical topographic accessibility and cartographer’s field position on the accuracy of second military survey maps, based on the information from exactly the same cartographic sources, offering no time delay, which gives high potential in assessing their impact. In doing so, we sought to answer the following questions:
-
Was the field position of the cartographer dependent on the topographic accessibility of the location?
-
How large were the portions of the maps not visible from the cartographer’s perspective?
-
How did topographic accessibility and the cartographer’s visibility impact the differences between the map content and reference data?
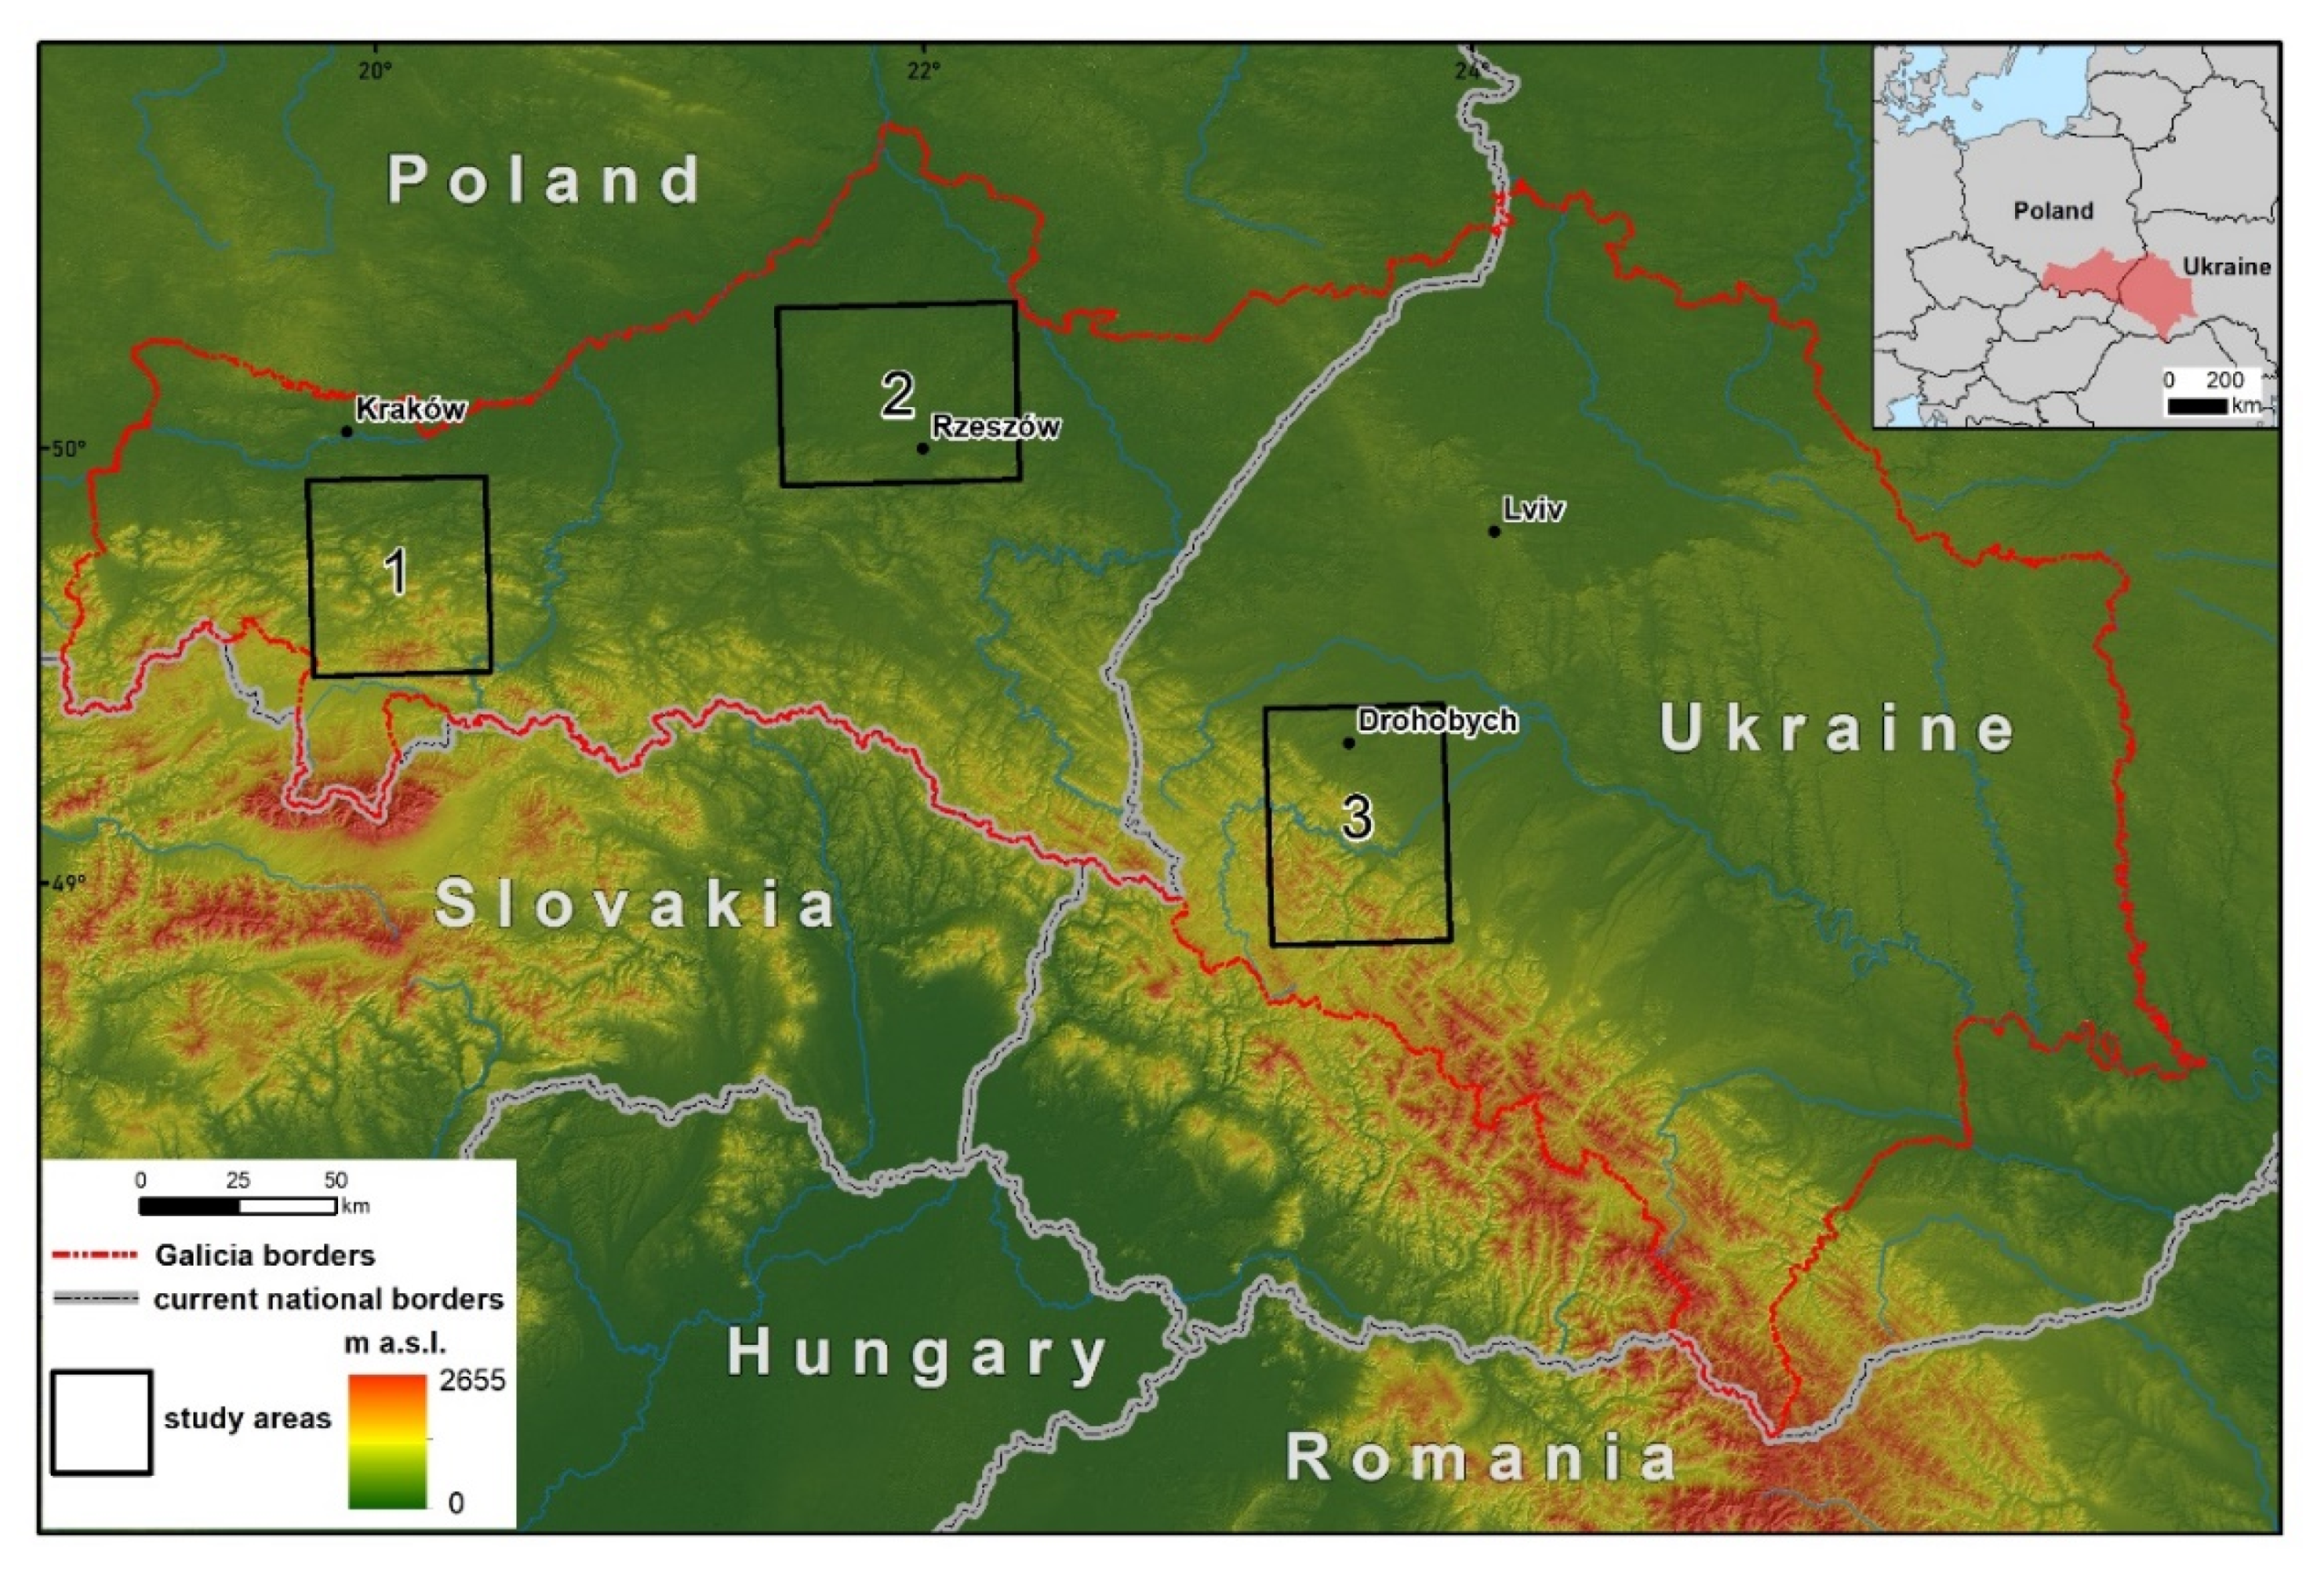
2. Study Area

Galicia was one of the largest provinces of the former Habsburg Monarchy (Austrian Empire). The region belonged to the Kingdom of Poland until 1772 and is currently divided between Poland and Ukraine. To assess the impact of the cartographer’s position and topographic accessibility on the accuracy of historical map information, we chose three test areas characterized by diverse landscape conditions within the region. The first test area (3 × 3 map sheets) was located in the western part of Galicia in the Carpathian Foothills and the Beskidy Mountains. The second test area (4 × 3 map sheets) was mainly located in the lowlands of the Sandomierz Basin. The third test area (3 × 4 map sheets) represented the eastern part of the region, covering the Outer Eastern Carpathians and Dniester Plain [39] (Figure 1). In total, these three test regions covered an area of 7813 km2, including the complete envelopment of 500 cadastral communes according to the historical boundaries during the 1860s (Table 1).

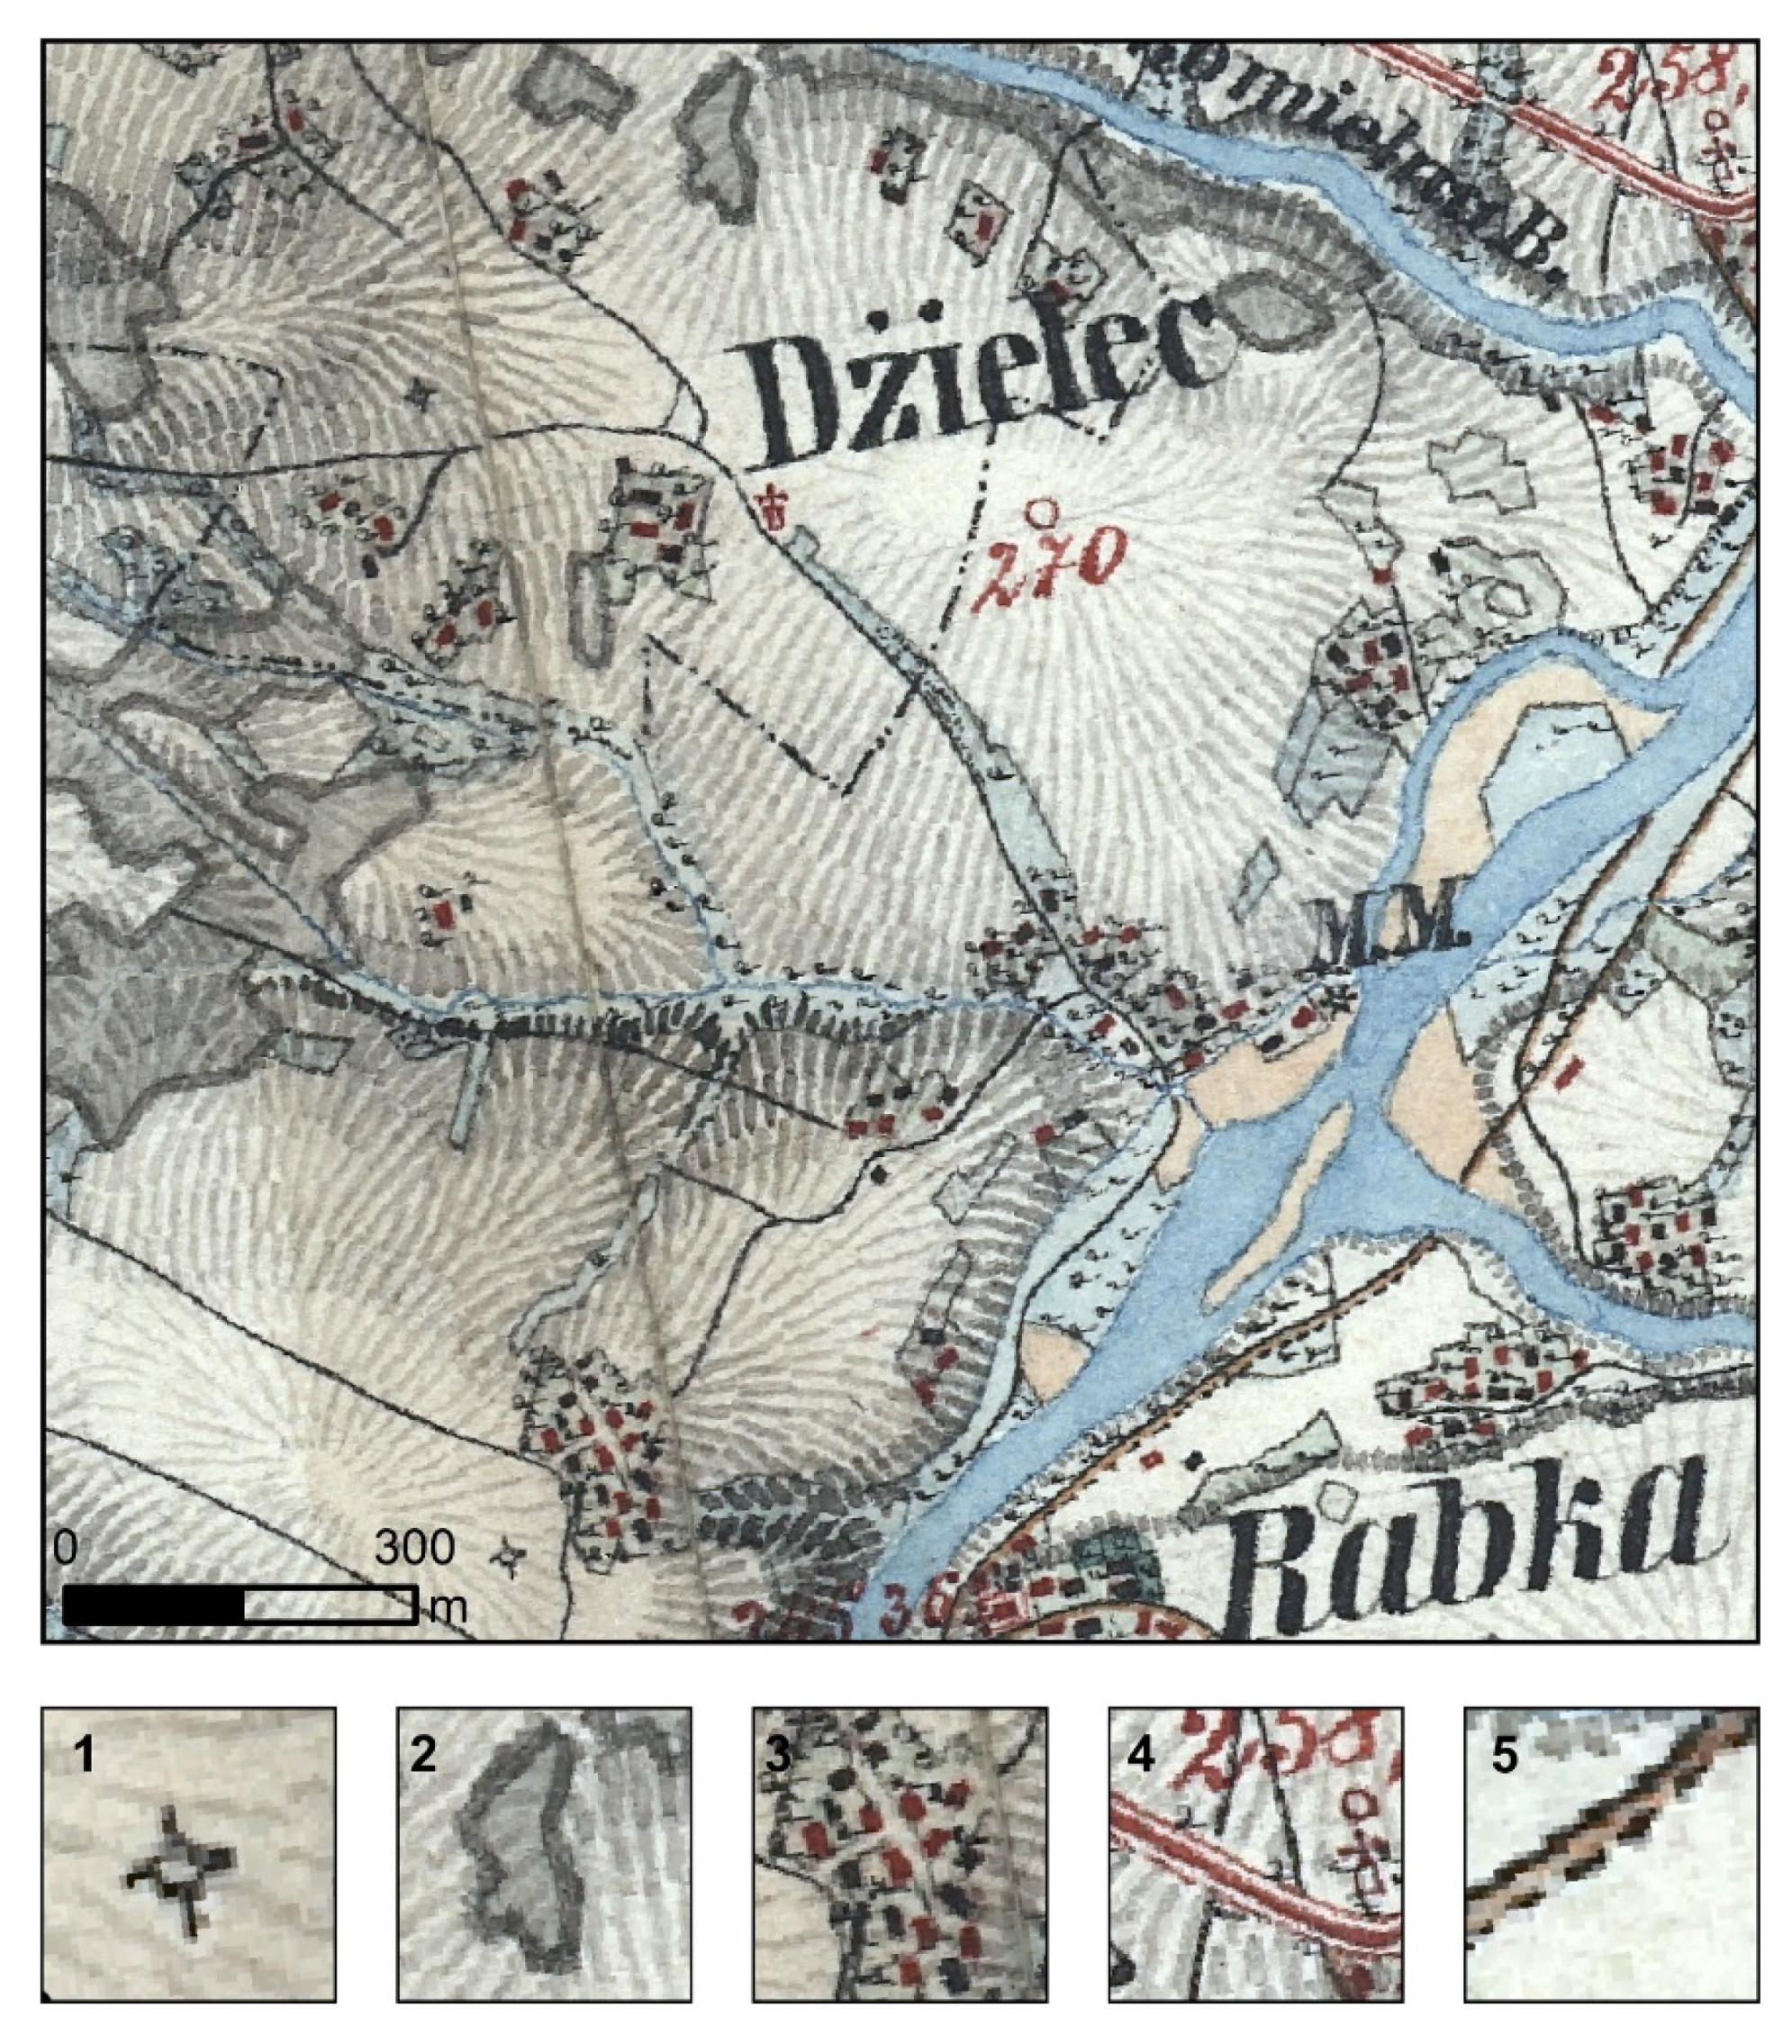
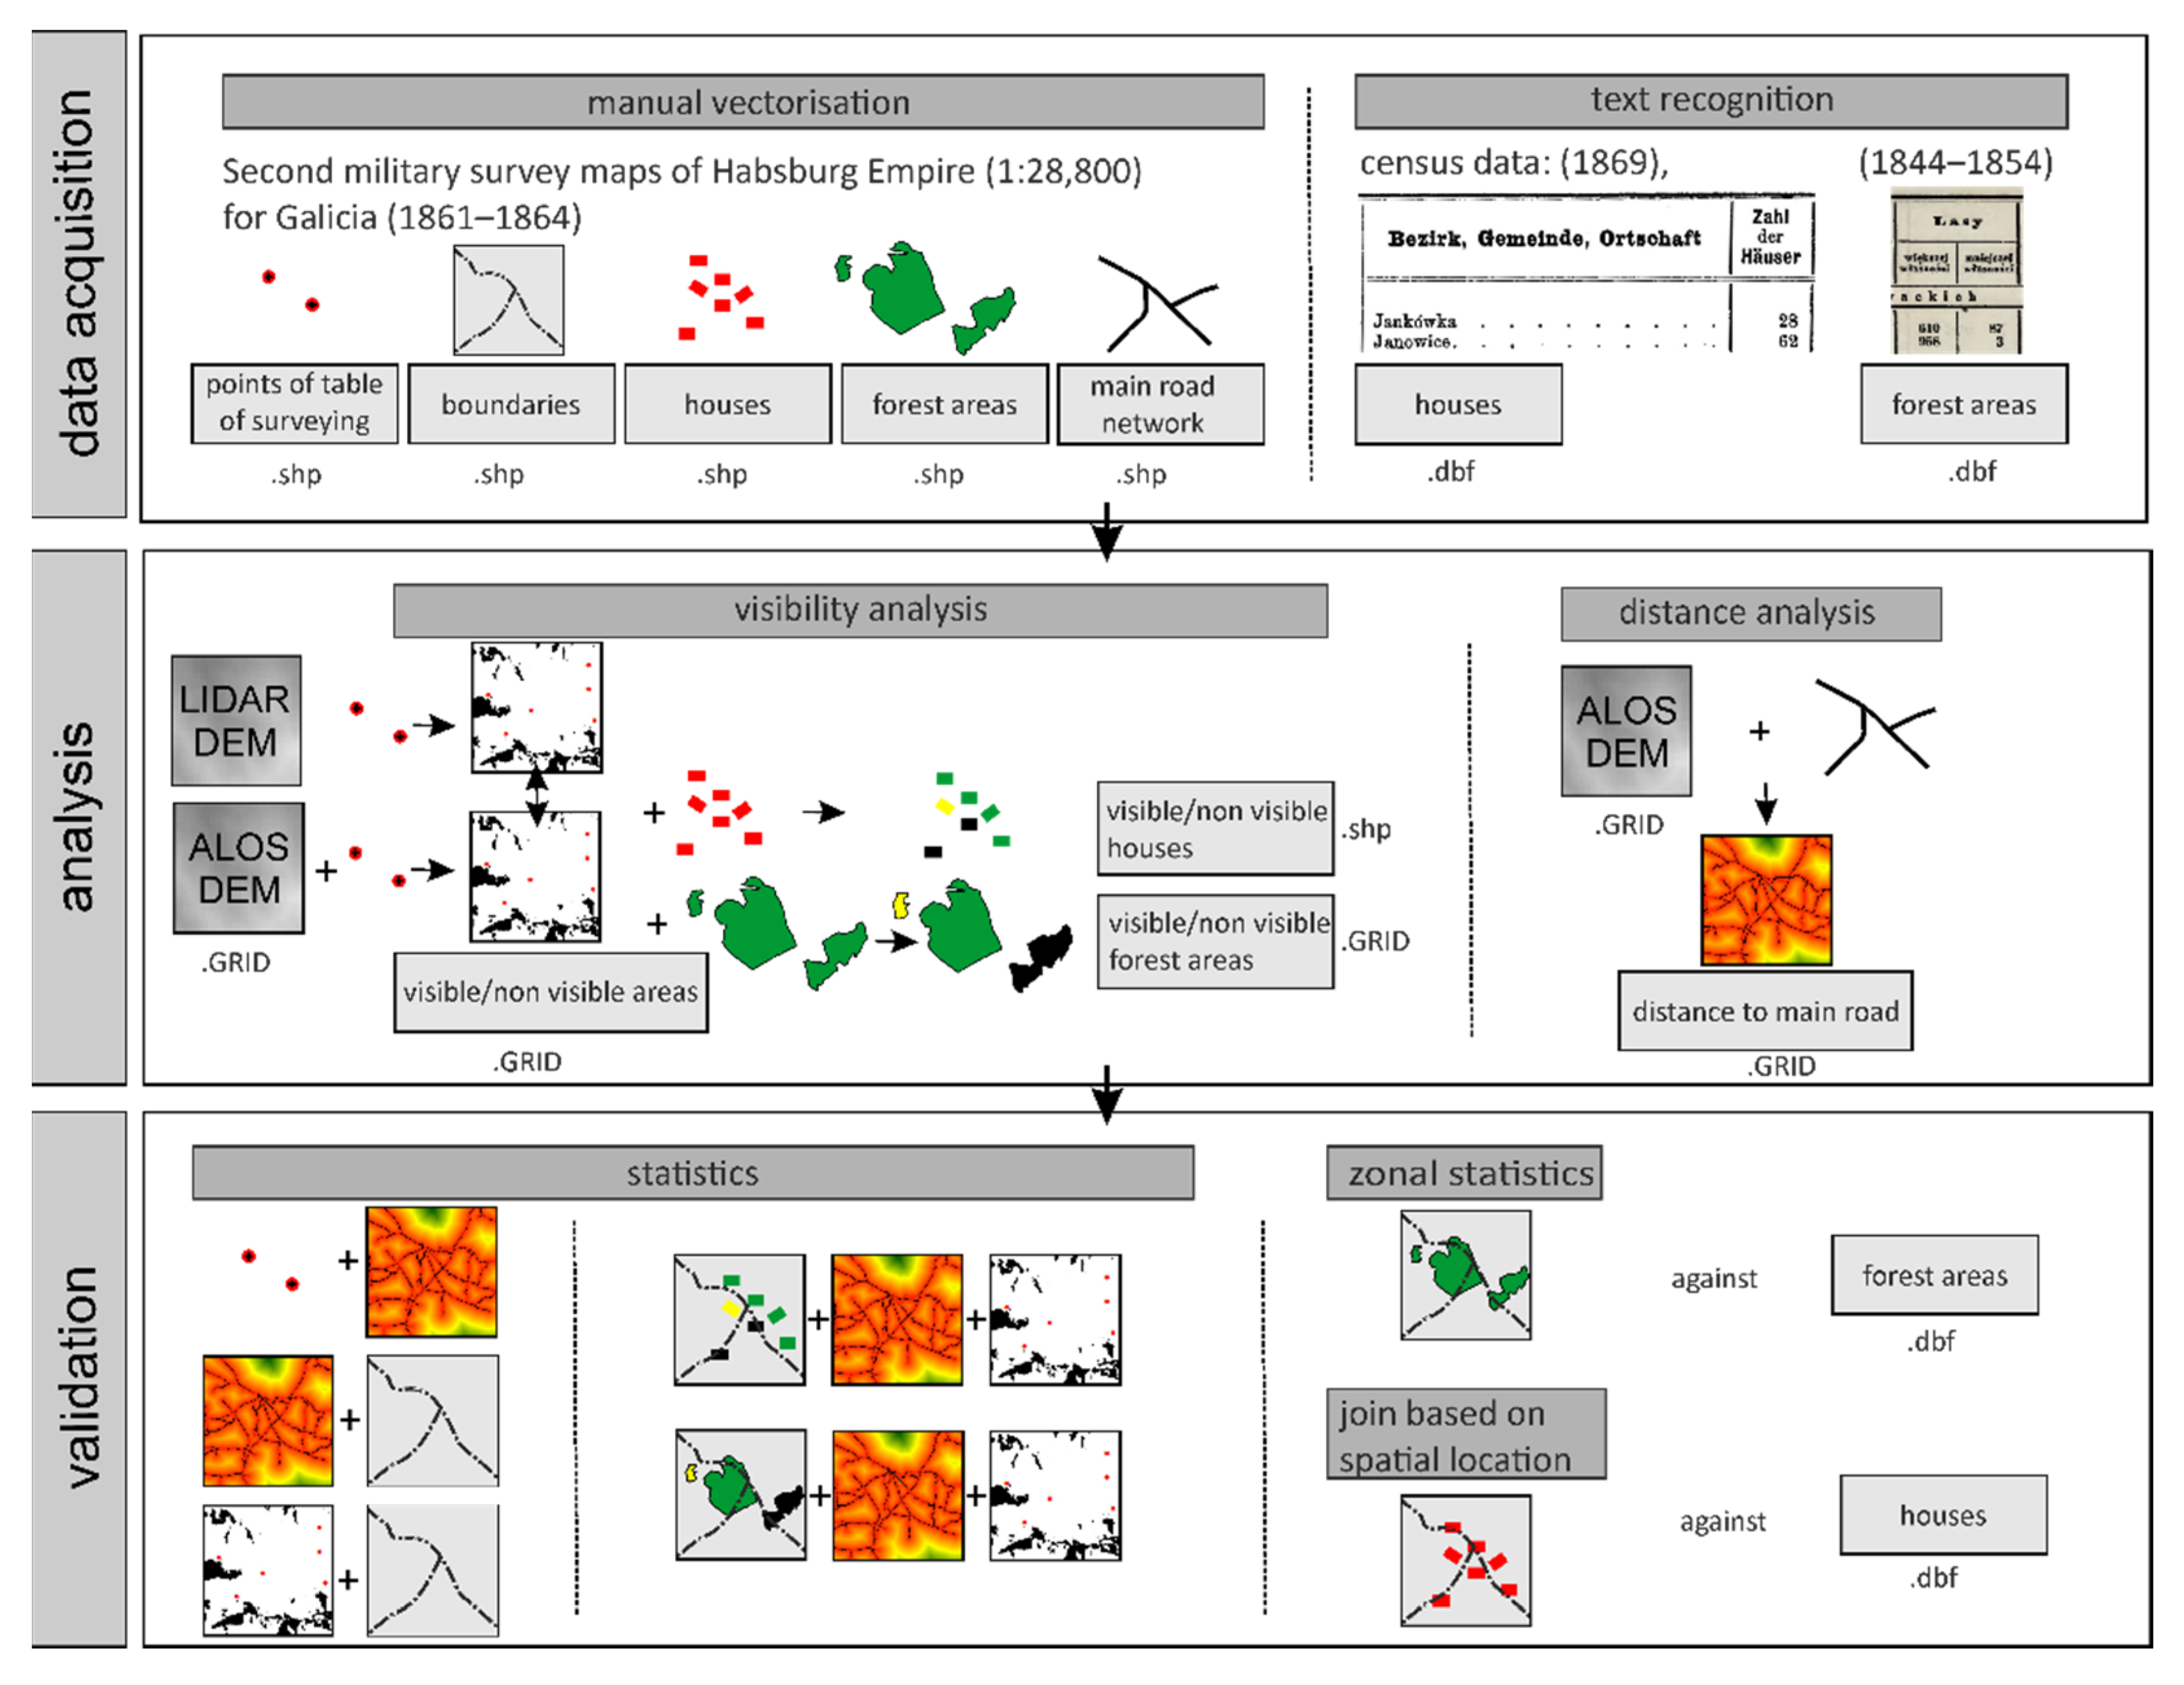
3. Materials and Methods

The main materials we used in the study were the Austrian second military survey maps of 1861–1864 (1:28,800) (Figure 2) in addition to census data (from 1869) and land use data (from 1857) published at the commune level that were employed as the reference data (Figure 3). For the three test areas, we were able to compare the numbers of houses recorded in both data sources, while for test area 1, we also performed a comparison of the forest cover (based on information from 218 cadastral communes). The data on exact house locations from the maps were acquired from the building database of the second military survey, available for the area already in shapefile format. The publication related to this database discusses the geometric accuracy and generalization of the representation of buildings in relation to accurate cadastral maps and other factors [40]. Forest cover data were acquired as a result of manual vectorization within the FORECOM project [41]. The geometric accuracy of forest areas on the second military survey maps has been verified in publications analyzing forest changes and fragmentation in the Polish Carpathians [42,43]. The corresponding census data on housing units were acquired from the 1869 census [44,45]. Housing units in the census are presented separately for the villages and small towns (ger. Orts-Gemeinden) and large estates (landed estates or manor farms) (ger. Gutsgebiete). Summarizing the abovementioned categories yielded the results for cadastral communes (ger. Katastralgemeinden). Census data on forest cover at the village level were acquired from other sources [46], where the data were collected as a result of cadastral measurements conducted in Galicia, mainly in 1844–1854. All the statistics are presented for cadastral communes separately for small and great ownership. Adding these two ownership categories together and changing the original planar units into hectares (1 Vienna morg [ger. Joch] = 0.57546 ha) [47] adequately modified the data for a comparison with the spatial map-based data. The commune boundaries were acquired by manual vectorization directly from the georeferenced sections of the second military survey maps (Figure 3). Some cadastral communes for test area 1 were aggregated due to slight changes in the commune list for 1857 compared to the cadastral communes from the maps; e.g., the lower and upper parts of the commune were merged into one. The differences in the number of buildings between the map and the census were calculated for each cadastral communes by comparing the number of buildings (points) on the map and from the census data. The differences in forest areas were calculated in a similar way.
The historical topographic accessibility was analyzed based on the road network presented on the second military survey maps. The network we used consisted of four main road categories that were passable in the mid-19th century all year round [48]. The data were acquired in the form of GIS files [49] and used to create a ‘distance to main roads’ variable. For each cadastral commune, we then indicated a mean distance to main roads as a proxy of the topographic accessibility used in the subsequent steps of the analysis.
To assess the cartographer’s visibility in the field, we first manually acquired all the map symbols indicating the cartographer’s position (surveying table points) (ger. Tischstand, Fixpunkte [48]), i.e., the places where the measurements were acquired and where the cadastral maps used as a basis for creating the second military survey maps were updated. The second military survey maps were created by reducing the selected cadastral map sheet content: land cover, settlements, and communication lines. The basic materials were prepared by the Cadastre General Directorate (ger. Generaldirection des Grundsteuer-Katasters) [35,50]. The sections of the maps prepared in this way were then verified in the field, where topographic details and elevation were added to the maps; this process also verified the triangulation network and helped update the map content changes. In the countries where cadastral maps were available, each of the military cartographers had one field assistant to help him or her, and in the areas where cadastral maps were not available, the number of field assistants increased to three people [35].
Contrary to the road-based visibility or other proxy-based variables used in many studies, the surveying table points considered herein indicate the exact position that the cartographer reached and used when working on the data. The map symbols indicating the cartographer’s position were acquired from all 33 map sheets analyzed in the study and the 2-km buffer around each of the three test areas. We discovered 717, 866, and 861 cartographer positions for test areas 1, 2, and 3, respectively.
All the points were then used to create a visibility map based on the ALOS Global Digital Surface Model (Version 3.1) [51] with an original spatial resolution of 1 arc second; the data were resampled to 30 m and then transferred to the Lambert azimuthal equal area (LAEA) (EPSG 3035) reference system. Additionally, we verified the impact of the surface model resolution on the analysis by testing a light detection and ranging (LIDAR)-based 1 m resolution digital elevation model (DEM) available only for contemporary Poland and compared it with the ALOS-based analysis. In the analysis, we used a variable reflecting invisible areas as a percentage of the area under study (i.e., the test area, map sheet, or cadastral commune). In addition to the simple division of visible/nonvisible areas, we also created a frequency mask where the output records indicate the number of times each cell location in the input surface raster can be seen by the input observation locations. The visibility analysis was performed in ArcMAP 10.8.
To assess the relations between the quality of the materials and either the topographic accessibility or the cartographer’s visibility, we conducted a set of simple regressions; the difference between the map content and the census records was taken as the dependent variable, while topographic accessibility (mean distance to main roads) and visibility (invisible areas as a percentage of a particular area) were taken as the independent variables. The analyses were conducted at the map sheet level (n = 33) and cadastral commune level (n = 500), and the relations between topographic accessibility and visibility at the cadastral commune and map sheet levels were quantified by using Pearson’s correlation (r), since the datasets followed the normal distribution (skewness μ3 = 0.96 and μ3 = 1.15, respectively; [52]).

4. Results

4.1. Initial Comparison of Digital Elevation Models

Our visibility analysis was based on a globally available DEM model since the study area is located in the territory of Poland and Ukraine and because the more detailed LIDAR-based DEM did not cover the whole study area. In accordance with the ongoing discussion, to ascertain whether a more detailed model might have an impact on the results [53,54], we tested the ALOS and LIDAR-based DEMs for two study areas located in Poland: one in a mountainous region and one in the lowlands (test areas 1 and 2, respectively, each with an area of 210 km2). In the mountainous terrain (test area 1), the difference in invisible areas between the two models was only 1.22% (Figure 4), while in the lowlands, the difference was higher at 9.21% (in both cases, more invisible areas were indicated in the 30 m resolution model than in the LIDAR-based model). Nevertheless, since only the ALOS model was available in test area 3 (most of which is mountainous terrain located in Ukraine), we decided to employ the ALOS model for the latter part of the analysis.

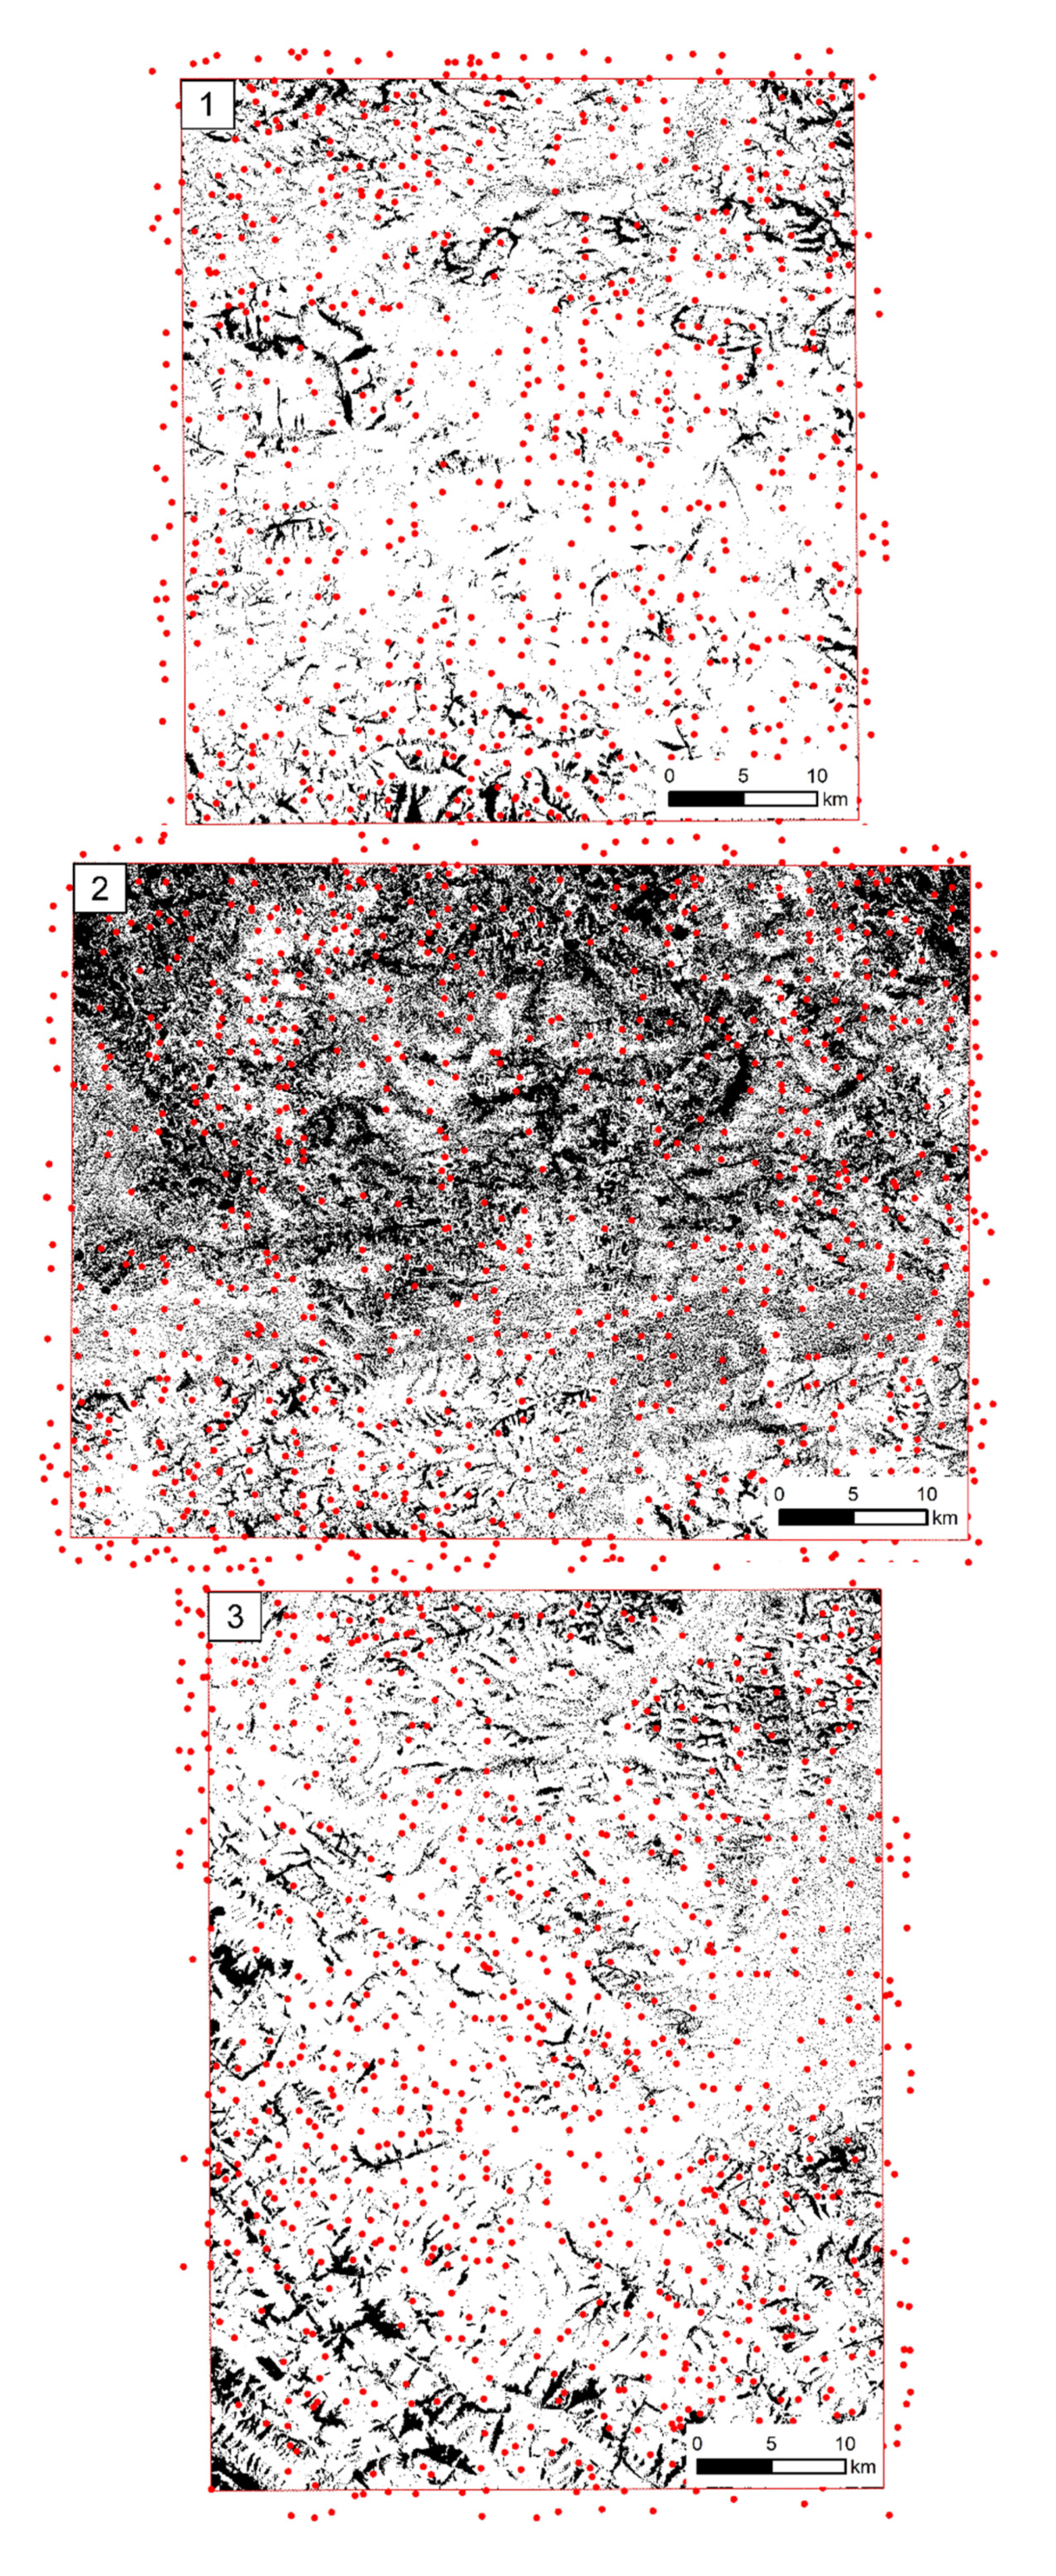
4.2. Visibility Analysis

According to the analysis, the density of surveying table points for each of the test areas was uniform at 0.27 points/km2. A visibility analysis based on the surveying table points indicated that in test area 1, 9.63% (22,021 ha) of the terrain was not visible to the cartographer, while in test areas 2 and 3, the corresponding percentages were 37.25% (102,970 ha) and 13.21% (36,503 ha), respectively. When analyzing invisible areas in smaller reference units, on average, 21% of each map sheet and 18% of the cadastral commune area were not visible. In test areas 1 and 3, the largest invisible regions were mainly steep slopes obscured by the ranges of the mountains and foothills. In contrast, due to the different landscape characteristics, the invisible areas in test area 2 were located mainly in large river valleys. In the mountainous and foothill areas featuring diverse landforms and high relative elevation differences, the invisible areas were usually compact, while in the lowlands, the pattern of invisible areas was scattered as relatively small patches (Figure 5).
According to the analysis, 7.77% of the forests were not visible to the cartographers, while 6.44% of their area was visible from one surveying table point, and 85.79% of the forested area was visible from more than one surveying table point (Figure 6).
A similar analysis of houses indicated that 17.7% (11,037 houses) were invisible to the cartographers, 11.6% were visible from one surveying table point (7264 houses), and 70.7% (44,201 houses) of all houses were visible from more than one surveying table point (Figure 7).

4.3. Impacts of Topographic Accessibility and Visibility on the Map Content

On average, the surveying table points (n = 2444) were located 2974 m from a main road. There was almost no relation between the mean distance to main roads and the number of surveying table points located in the cadastral communes (r = 0.12, p < 0.05). Furthermore, our analysis indicated a relatively weak correlation between topographic accessibility and visibility at both the map sheet level (r = 0.36, p < 0.05) and the commune level (r = 0.39, p < 0.05).
The quality of the maps reflected by the difference in the number of houses observed on the map sheets and expressed as a percentage of the corresponding census data was not explained by either the visibility (R2 = 0.02) or the topographic accessibility (R2 = 0.01) at the commune level. A similar analysis for forests indicated that the difference in the forested area between the maps and census data at the commune level also could not be explained by either visibility (R2 = 0.003) or topographic accessibility (R2 = 0.02).

5. Discussion

5.1. Difference between Census and Map Data

When analyzing the differences between the number of houses vectorized from the archival maps and the number of houses recorded in the census data, we must bear in mind that the difference in publication time between the maps and census is 5–8 years. Moreover, the target user and the purpose of creation also diverge between the two sources: the maps were created for military purposes to enable the efficient movement and stationing of military troops, while the census served as a tool for the development of sociodemographic policy. Nevertheless, it is difficult to assess the impact of the temporal difference between these sources over large areas. A cross-validation conducted on the local level and based on independent sources including, for example, parish documents would be helpful in answering this question. The overall difference in the number of houses based on the census (71,755) and that from the map-based vectorization (62,502) was substantial at 9253 houses. In the first test area, there were fewer houses according to the census than there were according to the maps (23,076 vs. 23,396, respectively). For the second and third test areas, however, the numbers based on the census were higher (test area 2, 31,298 vs. 27,580; test area 3, 17,381 vs. 11,526). These differences were especially high in the small towns. For instance, in Drohobych (ukr. Дрoгóбич, pol. Drohobycz), the difference was approximately 60% (1816 houses in the census vs. 1085 houses on the maps); in Boryslav (ukr. Бoрислав, pol. Borysław), the difference reached an astounding 479% (537 houses according to census vs. 112 on the maps) (Figure 8). The differences mentioned above might be partly due to cartographic generalization, where a large number of houses could not be presented on the maps in detail. However, in the 19th century, part of test area 3 (especially Boryslav) became a globally important centre of the oil industry, which triggered highly dynamic development [55] that was not fully captured by the materials. Since the maps are, in general, older than the census data with regard to housing units, a higher number of houses recorded in the statistical data may reflect the general sociodemographic trend resulting in increases in the overall population [56] and number of housing structures, especially in the Carpathian part of the region [57]. In 1857, the census for the districts of Galicia indicated 4,597,470 inhabitants and 760,181 houses [58], while 12 years later, there were 5,418,016 inhabitants and 857,702 houses [44], thereby reflecting the dynamics of the economic development and demographics.
The temporal difference between the census data and maps in terms of the forest cover (10–20 years, depending on the area) are even higher than that in the case of housing units. Regarding the forested area, the census data [46] had to be slightly aggregated, as the administrative commune coverage differed at the time of publication when compared to the maps. We analyzed 218 spatial units based on the 1857 census (presenting data on forest cover) vs. 222 units in 1869 (containing data on the number of houses). The statistical data present areas up to 1 morg (0.57546 ha), while the minimal area of the map-based forest cover patch is 0.02 ha. The overall difference in the forest area based on the census (50,423 ha) and the one from the map-based vectorization (48,518 ha) was 1905 hectares (Figure 9). Being aware that the differences between the census and the map-based information are substantial, we argue that the role of visibility and topographic accessibility in terms of second military survey maps might be lower than commonly expected in the research on other historical maps quality. Our research indicated uniformly distributed surveying table points, regardless the landscape conditions, which indicates limited role of the above-mentioned variables on the map content quality.

5.2. Impact of the Materials Used in this Study on the Final Results

The main source of the information used in this study was second military survey maps, which served as the source of the road networks, houses locations, forest cover, and surveying table point locations. The maps were pre-processed before acquiring the data, and one of the steps was georeferencing. Geometric correction and georeferencing to the Poland CS92 (EPSG 2180) or UTM zone 34N (EPSG 32,634) coordinate system were obtained using 2nd-order polynomial transformation and then transferred to the Lambert azimuthal equal area (LAEA) reference system. This step was accomplished by using at least 20 control points per map sheet, and the average value of the root mean square error (RMSE) in most cases ranged between 10 and 30 m, only occasionally exceeding the upper threshold. On the one hand, we are aware that changing the surveying table point locations within the RMSE values might have an impact on the resulting visibility maps; however, the upper RMSE value is close to 1 mm at the original scale of the map (1:28,800). Hence, the comparison of the visibility maps, being a result of potential changes in the cartographer’s position, is questionable, as the symbol representing the cartographer’s position on the maps was more dependent on the drawing precision of the original map than on the RMSE value itself. This example supports the findings of Leyk et al. [11] regarding the role of production-oriented uncertainty in overall uncertainty assessments of historical land use maps.
Our analysis also showed that using different DEMs might have an impact on the visibility analysis. However, as our test areas were located in two countries, we had to use a model available in both of them. That is why we employed the ALOS DEM. Moreover, most of the test areas were located in mountainous terrain, and the differences between the models, according to our tests, were relatively low. Being aware that a more detailed DEM could yield different visibility maps, we must remember that the ALOS model showed, on average, more invisible areas than the LIDAR-based model, so using the former model over the whole study area would potentially result in even less of an impact of visibility on the quality of the maps. Such a result would confirm our findings that the quality of the second military survey maps did not depend on the surveying table point locations.
The potential drawback of our work might be that the impact of land cover on the cartographer’s visibility is omitted. However, we hypothesize that the cartographer’s position was chosen carefully such that the impact of the land cover was assessed before performing the measurements. The height of vegetation, although roughly discernible from cadastral maps, cannot be determined from the second military survey maps used herein. As the forest height was diverse at the time, assigning one value for the whole forest would introduce additional uncertainty, which we decided to avoid. Usually, archival map quality assessments are conducted when the old map content can be directly compared with other cartographic sources from different periods [23], maps from similar periods but at different scales [10,29,59], or other contemporary data sources such as LIDAR point clouds to reconstruct land use changes [31]. In such situations, quality assessments of the historical maps are not the main aim of the research [24,60], and, thus, the quality is not questioned as long as the map content confirms the general trends, e.g., of the land use trajectories over time. In our analysis, we wanted to transcend such assessments to focus on the uncertainties that are dependent on the acquisition processes of historical data. Although these problems are very important for the conscious use of original sources, these issues are rarely discussed [61,62,63].

6. Conclusions

In this paper we aimed to explain the role of accessibility and visibility on the potential updates and improvements of the second military survey maps, as a generalization of the detailed cadastral mapping. Our analysis showed that topographic accessibility and visibility did not impact the quality of the land cover information from 19th century second military survey maps. Most likely, the high quality of the second military survey maps was achieved mainly by using very detailed, large-scale cadastral maps as their basis, which had never been achieved theretofore, not only for Galicia, but also for other parts of the Habsburg Empire. However, contrary to the cadastral mapping, the second military survey maps also offer analysis of the map content in relations to other topographic features. Historical maps offer the exact location of the objects in space, which cannot be acquired from detailed census data. The scale of the second military survey maps is appropriate for conducting data analyses at the level of cadastral communes, allowing them to be compared with census values on a large scale [64,65]. These 19th century cadastral maps are still commonly used for historical and geographical research, e.g., when studying land tenure and their positional accuracy has been confirmed, e.g., when compared in GIS software with new large-scale datasets [66]. Our results might be of importance for research conducted on large portions of the former Habsburg Empire (including, for example, contemporary northern Italy, Austria, Czechia, Slovakia, Hungary, Slovenia, Croatia, Romania, southern Poland, or western Ukraine), where second military survey maps are available, although their production-oriented uncertainty is still insufficiently recognized.
Overall, it is important to analyze the uncertainty inherent in historical data, as an increasing number of historical maps are becoming accessible electronically and the methods of data acquisition are developing rapidly. As a consequence, historical, map-based information is becoming more accessible and is being implemented in a greater number of analyses of different environmental studies.

Author Contributions

Krzysztof Ostafin and Dominik Kaim, conceptualization, methodology, formal analysis, and writing—original draft preparation; Małgorzata Pietrzak, writing—review and editing. All authors have read and agreed to the published version of the manuscript.

Funding

This research was funded by the Ministry of Science and Higher Education, Republic of Poland under the frame of “National Programme for the Development of Humanities” 2015–2021, as a part of the GASID project (Galicia and Austrian Silesia Interactive Database 1857–1910, 1aH 15 0324 83).

Institutional Review Board Statement

Not applicable.

Informed Consent Statement

Not applicable.

Conflicts of Interest

The authors declare no conflict of interest.

References

  1. Johnson, C.N.; Balmford, A.; Brook, B.W.; Buettel, J.C.; Galetti, M.; Guangchun, L.; Wilmshurst, J.M. Biodiversity Losses and Conservation Responses in the Anthropocene. Science 2017, 356, 270–275. [Google Scholar] [CrossRef]
  2. Doelman, J.C.; Stehfest, E.; Tabeau, A.; van Meijl, H.; Lassaletta, L.; Gernaat, D.E.H.J.; Hermans, K.; Harmsen, M.; Daioglou, V.; Biemans, H.; et al. Exploring SSP Land-Use Dynamics Using the IMAGE Model: Regional and Gridded Scenarios of Land-Use Change and Land-Based Climate Change Mitigation. Glob. Environ. Chang. 2018, 48, 119–135. [Google Scholar] [CrossRef] [Green Version]
  3. Wang, X.; Dong, X.; Liu, H.; Wei, H.; Fan, W.; Lu, N.; Xu, Z.; Ren, J.; Xing, K. Linking Land Use Change, Ecosystem Services and Human Well-Being: A Case Study of the Manas River Basin of Xinjiang, China. Ecosyst. Serv. 2017, 27, 113–123. [Google Scholar] [CrossRef]
  4. Winkler, K.; Fuchs, R.; Rounsevell, M.; Herold, M. Global Land Use Changes Are Four Times Greater than Previously Estimated. Nat. Commun. 2021, 121, 22702. [Google Scholar] [CrossRef] [PubMed]
  5. Fuchs, R.; Verburg, P.H.; Clevers, J.G.P.W.; Herold, M. The Potential of Old Maps and Encyclopaedias for Reconstructing Historic European Land Cover/Use Change. Appl. Geogr. 2015, 59, 43–55. [Google Scholar] [CrossRef] [Green Version]
  6. Munteanu, C.; Kuemmerle, T.; Keulerd, N.S.; Balázs, P.; Dobosz, M.; Griffiths, P.; Halada, L.; Kaim, D.; Király, G.; Konkoly-Gyuró, É.; et al. Legacies of 19th Century Land Use Shape Contemporary Forest Cover. Glob. Environ. Chang. 2015, 34, 83–94. [Google Scholar] [CrossRef]
  7. Uhl, H.J.; Leyk, S.; McShane, C.; Braswell, A.; Connor, D.; Balk, D. Fine-Grained, Spatiotemporal Datasets Measuring 200 Years of Land Development in the United States. Earth Syst. Sci. Data 2021, 13, 119–153. [Google Scholar] [CrossRef]
  8. Kaim, D.; Kozak, J.; Ostafin, K.; Dobosz, M.; Ostapowicz, K.; Kolecka, N.; Gimmi, U. Uncertainty in Historical Land-Use Reconstructions with Topographic Maps. Quaest. Geogr. 2014, 33, 29. [Google Scholar] [CrossRef] [Green Version]
  9. Loran, C.; Haegi, S.; Ginzler, C. Comparing Historical and Contemporary Maps—A Methodological Framework for a Cartographic Map Comparison Applied to Swiss Maps. Int. J. Geogr. Inf. Sci. 2018, 16, 1482553. [Google Scholar] [CrossRef]
  10. Forejt, M.; Dolejš, M.; Raška, P. How Reliable Is My Historical Land-Use Reconstruction? Assessing Uncertainties in Old Cadastral Maps. Ecol. Indic. 2018, 94, 237–245. [Google Scholar] [CrossRef]
  11. Leyk, S.; Boesch, R.; Weibel, R. A Conceptual Framework for Uncertainty Investigation in Map-Based Land Cover Change Modelling. Trans. GIS 2005, 9, 291–322. [Google Scholar] [CrossRef]
  12. Ostafin, K.; Iwanowski, M.; Kozak, J.; Cacko, A.; Gimmi, U.; Kaim, D.; Psomas, A.; Ginzler, C.; Ostapowicz, K. Forest Cover Mask from Historical Topographic Maps Based on Image Processing. Geosci. Data J. 2017, 4, 29–39. [Google Scholar] [CrossRef] [Green Version]
  13. Uhl, J.H.; Leyk, S.; Chiang, Y.-Y.; Duan, W.; Knoblock, C.A. Map Archive Mining: Visual-Analytical Approaches to Explore Large Historical Map Collections. ISPRS Int. J. Geo-Inf. 2018, 7, 148. [Google Scholar] [CrossRef] [PubMed] [Green Version]
  14. Can, Y.S.; Gerrits, P.J.; Kabadayi, M.E. Automatic Detection of Road Types from the Third Military Mapping Survey of Austria-Hungary Historical Map Series with Deep Convolutional Neural Networks. IEEE Access 2021, 9, 62847–62856. [Google Scholar] [CrossRef]
  15. Jenny, B.; Weber, A.; Hurni, L. Visualizing the Planimetric Accuracy of Historical Maps with MapAnalyst. Cartogr. Int. J. Geogr. Inf. Geovisualization 2007, 42, 89–94. [Google Scholar] [CrossRef] [Green Version]
  16. Ostafin, K.; Kaim, D.; Troll, M.; Maciejowski, W. The Authorship of the Second Military Survey of Galicia and Austrian Silesia at the Scale 1:28,800 and the Consistency of Sheet Content Based on Selected Examples. Polish Cartogr. Rev. 2020, 52, 141–151. [Google Scholar] [CrossRef]
  17. Gimmi, U.; Ginzler, C.; Müller, M.; Psomas, A. Assessing Accuracy of Forest Cover Information on Historical Maps Introduction Long-Term Forest Cover Change Datasets Form an Important Source of Information. Pr. Geogr. 2016, 146, 7–18. [Google Scholar] [CrossRef]
  18. Hawbaker, T.J.; Radeloff, V.C.; Clayton, M.K.; Hammer, R.B.; Gonzalez-Abraham, C.E. Road Development, Housing Growth, And Landscape Fragmentation In Northern Wisconsin: 1937–1999. Ecol. Appl. 2006, 16, 1222–1237. [Google Scholar] [CrossRef] [Green Version]
  19. O’Kelly, M.E.; Horner, M.W. Aggregate Accessibility to Population at the County Level: U.S. 1940–2000. J. Geogr. Syst. 2003, 5, 5–23. [Google Scholar] [CrossRef]
  20. Gallardo, B.; Aldridge, D.C.; González-Moreno, P.; Pergl, J.; Pizarro, M.; Pyšek, P.; Thuiller, W.; Yesson, C.; Vilà, M. Protected Areas Offer Refuge from Invasive Species Spreading under Climate Change. Glob. Chang. Biol. 2017, 23, 5331–5343. [Google Scholar] [CrossRef] [Green Version]
  21. Monsarrat, S.; Boshoff, A.F.; Kerley, G.I.H. Accessibility Maps as a Tool to Predict Sampling Bias in Historical Biodiversity Occurrence Records. Ecography 2019, 42, 125–136. [Google Scholar] [CrossRef]
  22. Timár, G.; Biszak, S.; Székely, B.; Molnár, G. Digitized Maps of the Habsburg Military Surveys–Overview of the Project of ARCANUM Ltd. (Hungary). In Preservation in Digital Cartography. Lecture Notes in Geoinformation and Cartography; Jobst, M., Ed.; Springer: Berlin/Heidelberg, Germany, 2010; pp. 273–283. ISBN 978-3-642-12732-8. [Google Scholar]
  23. Konkoly-Gyuró, É.; Király, G.; Dezső, N.; Balázs, P.; Tirászi, Á. Overview of the 18 Th-20 Th Century Military Surveys in the Light of the Land Cover Change Assessment in Eastern Central Europe. J. Maps 2017, 12, 142–180. [Google Scholar]
  24. Lieskovsky, J.; Kaim, D.; Balázs, P.; Boltiziar, M.; Chmiel, M.; Grabska, E.; Király, G.; Konkoly-Gyuró, É.; Kozak, J.; Antalová, K.; et al. Historical Land Use Dataset of the Carpathian Region (1819–1980). J. Maps 2018, 14, 644–651. [Google Scholar] [CrossRef] [Green Version]
  25. Kaim, D.; Kozak, J.; Kolecka, N.; Ziółkowska, E.; Ostafin, K.; Ostapowicz, K.; Gimmi, U.; Munteanu, C.; Radeloff, V.C. Broad Scale Forest Cover Reconstruction from Historical Topographic Maps. Appl. Geogr. 2016, 67, 39–48. [Google Scholar] [CrossRef]
  26. Kovács, G. The Advantages of Using the Second Military Survey Maps in Fluvial Studies. Acta Geod. Geophys. Hung. 2010, 45, 64–70. [Google Scholar] [CrossRef]
  27. Frajer, J.; Pavelková, R.; Létal, A.; Kopp, J. Relics and Transformation of Former Ponds in the Urban Environment of the Historical Region of Bohemia (Czech Republic). J. Maps 2020, 18, 1819900. [Google Scholar] [CrossRef]
  28. Zámolyi, A.; Székely, B.; Biszak, S. Assessing the Accuracy of the Second Military Survey for the Doren Landslide (Vorarlberg, Austria). In Geophysical Research Abstracts; EGU General Assembly: Vienna, Austria, 2010; Volume 12. [Google Scholar]
  29. Frajer, J.; Fiedor, D. A Historical Curiosity or a Source of Accurate Spatial Information on Historical Land Use? The Issue of Accuracy of Old Cadastres in the Example of Josephian Cadastre from the Habsburg Empire. Land Use Policy 2021, 100, 104937. [Google Scholar] [CrossRef]
  30. Gomiršek, T. Cultural Landscape of the Gorica Hills in the Nineteenth Century: Franciscean Land Cadastre Reports as the Source for Clarification of the Classification of Cultivable Land Types. Open Geosci. 2020, 12, 1392–1405. [Google Scholar] [CrossRef]
  31. Sobala, M. Do Historical Maps Show the Maximal Anthropopressure in the Carpathians? J. Mt. Sci. 2021, 18, 2184–2200. [Google Scholar] [CrossRef]
  32. Frajer, J.; Šimáček, P. Localisation of the Painter’s Canvas: Landscape Paintings from the Iron Mountains (Czech Republic). J. Maps 2019, 15, 66–74. [Google Scholar] [CrossRef]
  33. Timár, G. System of the 1:28 800 Scale Sheets of the Second Military Survey in Tyrol and Salzburg. Acta Geod. Geophys. Hung. 2009, 44, 95–104. [Google Scholar] [CrossRef] [Green Version]
  34. Čada, V.; Vichrová, M. Horizontal Control for Stable Cadastre and Second Military Survey (Franziszeische Landesaufnahme) in Bohemia, Moravia and Silesia. Acta Geod. Geophys. Hung. 2009, 44, 105–114. [Google Scholar] [CrossRef] [Green Version]
  35. von Fligely, A. Organisation Und Fortschritt Der Militärisch-Kartographischen Arbeiten in Österreich. Mitt. Der K. K. Geogr. Ges. 1859, 3, 1–11. [Google Scholar]
  36. Nischer-Falkenhof, E. von The Survey by the Austrian General Staff under the Empress Maria Theresa and the Emperor Joseph II., and the Subsequent Initial Surveys of Neighbouring Territories during the Years 1749–1854. Imago Mundi 1937, 2, 83–88. [Google Scholar] [CrossRef] [Green Version]
  37. Die Entwicklung Und Organisation Des Vermessungswesens in Österreich I. Teil Die Entwicklung Bis Zum Ersten Weltkrieg; Österreichischer Verein für Vermessungswesen: Wien, Austria, 1949.
  38. Bateman, A.M. Military and Geologic Mapping—A Plane-Table. Bull. Geol. Soc. Am. 1919, 30, 405–414. [Google Scholar] [CrossRef]
  39. Kondracki, J. Karpaty; Wydawnictwa Szkolne i Pedagogiczne: Warszawa, Poland, 1989; ISBN 8302040673. [Google Scholar]
  40. Kaim, D.; Szwagrzyk, M.; Dobosz, M.; Troll, M.; Ostafin, K. Mid-19th-Century Building Structure Locations in Galicia and Austrian Silesia under the Habsburg Monarchy. Earth Syst. Sci. Data 2021, 13, 1693–1709. [Google Scholar] [CrossRef]
  41. Kozak, J.; Kaim, D. Forecom Podręcznik Użytkownika; Instytut Geografii i Gospodarki Przestrzennej Uniwersytetu Jagiellońskiego: Kraków, Poland, 2016; ISBN 9788364089275. [Google Scholar]
  42. Kozak, J.; Ziółkowska, E.; Vogt, P.; Dobosz, M.; Kaim, D.; Kolecka, N.; Ostafin, K. Forest-Cover Increase Does Not Trigger Forest-Fragmentation Decrease: Case Study from the Polish Carpathians. Sustainability 2018, 10, 1472. [Google Scholar] [CrossRef] [Green Version]
  43. Kaim, D.; Radeloff, V.; Szwagrzyk, M.; Dobosz, M.; Ostafin, K. Long-Term Changes of the Wildland–Urban Interface in the Polish Carpathians. Int. J. Geo-Inf. 2018, 7, 137. [Google Scholar] [CrossRef] [Green Version]
  44. Orts-Repertorium Des Kӧnigreiches Galizien Und Lodomerien Mit Dem Grossherzogthume Krakau. In Auf Grundlage Der Volkszählung Vom Jahre 1869 Berabeitet von Der k. k. Statistischen Central-Commission; Carl Gerold’s Sohn: Wien, Austria, 1874.
  45. Teibenbacher, P.; Kramer, D.; Göderle, W. An Inventory of Austrian Census Materials, 1857–1910. Final Report; Max Planck Institute for Demographic Research: Rostock, Germany, 2012; Volume 190. [Google Scholar]
  46. Skorowidz Wszystkich Miejscowości Położonych w Królestwie Galicyi i Lodomeryi Wraz z Wielkiem Księstwem Krakowskiem; Galicyjska Drukarnia Rządowa: Lwów, Ukraine, 1868.
  47. Jansen, H. Deutsche, Österreichische Und Schweizerische Maße, Gewichte Und Münzen. Sonder-Abdruck Aus Muret-Sanders’ Deutsch-Englischem Wörterbuche. Diesem Sonder-Abdruck Sind Beigeheftet: I. Die Englischen (Und Nordamerikanischen) Maße, Gewichte Und Münzen; II. Die; Langenscheidtsche Verlagsbucghandlung: Berlin, Germany, 1900. [Google Scholar]
  48. Zaffauk, J. Signaturen In-Und Ausländischer Plan-Und Kartenwerke: Nebst Angabe Der in Karten Und Plänen Am Häufigsten Vorkommenden Worte Und Wort-Abkürzungen in 12 Sprachen; Zum Plan-Und Kartenlesen, Prämiirt Vom Internationalen Geographischen Congress in Venedig; Hölzel: Wien, Austria, 1889. [Google Scholar]
  49. Kaim, D.; Szwagrzyk, M.; Ostafin, K. Mid-19th Century Road Network Dataset for Galicia and Austrian Silesia, Habsburg Empire. Data Br. 2020, 28, 104854. [Google Scholar] [CrossRef]
  50. Konias, A. Kartografia Topograficzna Śląska Cieszyńskiego i Zaboru Austriackiego Od II Połowy XVIII Wieku Do Początku XX Wieku; Wydawnictwo Uniwersytetu Śląskiego: Katowice, Poland, 2000. [Google Scholar]
  51. Tadono, T.; Ishida, H.; Oda, F.; Naito, S.; Minakawa, K.; Iwamoto, H. Precise global dem generation by alos prism. ISPRS Ann. Photogramm. Remote. Sens. Spat. Inf. Sci. 2014, 2, 14–16. [Google Scholar] [CrossRef] [Green Version]
  52. Hair, J.; Black, W.C.; Babin, B.J.; Anderson, R.E. Multivariate Data Analysis, 7th ed.; Pearson Education International: Upper Saddle River, NJ, USA, 2010. [Google Scholar]
  53. Lagner, O.; Klouček, T.; Šímová, P. Impact of Input Data (in)Accuracy on Overestimation of Visible Area in Digital Viewshed Models. PeerJ 2018, 2018, 4835. [Google Scholar] [CrossRef] [PubMed]
  54. Mahanti, P.; Robinson, M.S.; Boyd, A.K. Uncertain Viewsheds: A Peek into Probabilistic Line-of-Sight Visibility Analysis. In Proceedings of the Lunar and Planetary Science Conference, The Woodlands, TX, USA, 18–22 March 2013; Volume 44, p. 1739. [Google Scholar]
  55. Frank, A.F. Oil Empire. Visions of Prosperity in Austrian Galicia; Harvard University Press: London, UK, 2007. [Google Scholar]
  56. Zamorski, K. Informator Statystyczny Do Dziejów Społeczno-Gospodarczych Galicji: Ludność Galicji w Latach 1857–1910; Mandurowicz-Urbańska, H., Ed.; Uniwersytet Jagielloński, Polskie Towarzystwo Statystyczne: Warszawa, Poland, 1989. [Google Scholar]
  57. Soja, M. Cykle Rozwoju Ludności Karpat Polskich w XIX i XX Wieku; Instytut Geografii i Gospodarki Przestrzennej Uniwersytetu Jagiellońskiego: Kraków, Poland, 2008; ISBN 978-83-88424-37-3. [Google Scholar]
  58. Statistische Übersichten Uber Die Bevölkerung Und Den Viehstand von Österreich Nach Der Zӓhlung Vom 31. October 1857; Kaiserlich-Königlichen Hof- und Staatsdruckerei: Wien, Austria, 1859.
  59. Troll, M.; Ostafin, K. Use of Late 18th and Early 19th Century Cadastral Data to Estimate Past Forest Cover Change—A Case Study of Zawoja Village. Pr. Geogr. 2016, 2016, 31–49. [Google Scholar] [CrossRef]
  60. Haase, D.; Walz, U.; Neubert, M.; Rosenberg, M. Changes to Central European Landscapes-Analysing Historical Maps to Approach Current Environmental Issues, Examples from Saxony, Central Germany. Land Use Policy 2007, 24, 248–263. [Google Scholar] [CrossRef]
  61. Schaffer, G.; Peer, M.; Levin, N. Quantifying the Completeness of and Correspondence between Two Historical Maps: A Case Study from Nineteenth-Century Palestine. Cartogr. Geogr. Inf. Sci. 2015, 43, 154–175. [Google Scholar] [CrossRef]
  62. Gimmi, U.; Lachat, T.; Bürgi, M. Reconstructing the Collapse of Wetland Networks in the Swiss Lowlands 1850–2000. Landsc. Ecol. 2011, 26, 1071–1083. [Google Scholar] [CrossRef]
  63. Iwai, Y.; Murayama, Y. Geospatial Analysis of the Non-Surveyed (Estimated) Coastlines in Inoh’s Map, 1821. ISPRS Int. J. Geo-Inf. 2021, 10, 580. [Google Scholar] [CrossRef]
  64. Skaloš, J.; Weber, M.; Lipský, Z.; Trpáková, I.; Šantrůčková, M.; Uhlířová, L.; Kukla, P. Using Old Military Survey Maps and Orthophotograph Maps to Analyse Long-Term Land Cover Changes—Case Study (Czech Republic). Appl. Geogr. 2011, 31, 426–438. [Google Scholar] [CrossRef]
  65. Bičík, I.; Kupková, L.; Jeleček, L.; Kabrda, J.; Štych, P.; Janoušek, Z.; Winklerová, J. Land Use Changes in the Czech Republic 1845–2010: Socio-Economic Driving Forces; Springer International Publishing: Cham, Switzerland, 2015; ISBN 9783319176710. [Google Scholar]
  66. Harvey, F.; Kaim, D.; Gajda, A. Analysis of Historical Change Using Cadastral Materials in the Carpathian Foothills. Eur. J. Geogr. 2014, 11, 145. [Google Scholar]
Figure 1. Study areas within the boundaries of historical Galicia.
Ijgi 10 00820 g001
Figure 2. Austrian second military survey maps: 1—cartographer positions (surveying table points), 2—forest areas, 3—buildings (houses in red), 4—first-class roads, and 5—maintained roads.
Ijgi 10 00820 g002
Figure 3. Schematic of the proposed workflow.
Ijgi 10 00820 g003
Figure 4. Invisible areas defined from the surveying table points (red) for the 30 m resolution ALOS model (upper map) and 1 m resolution LIDAR model (lower map).
Ijgi 10 00820 g004
Figure 5. Invisible areas (black) and cartographer positions (red) in the three test areas (1, 2, 3 as in Figure 1).
Ijgi 10 00820 g005
Figure 6. Forested areas in test area 1 that were invisible (black), visible from one surveying table point (yellow), and visible from two or more surveying table points (green).
Ijgi 10 00820 g006
Figure 7. Houses in the three test areas (1, 2, 3 as in Figure 1) that were invisible (black), visible from one surveying table point (yellow), and visible from two or more points surveying table points (green).
Ijgi 10 00820 g007
Figure 8. Differences in the number of buildings between census and maps in cadastral communes in the three test areas (1, 2, 3 as in Figure 1).
Ijgi 10 00820 g008
Figure 9. Differences in the forest area between census and maps in cadastral communes.
Ijgi 10 00820 g009
Table 1. Characteristics of the test areas.
Study AreaArea (sq. km)Elevation (m a.s.l)Cadastral Communes
12285153–1310222
22764103–458179
32764225–128899
Publisher’s Note: MDPI stays neutral with regard to jurisdictional claims in published maps and institutional affiliations.

