1. Introduction
The quantitative assessment of biotic and abiotic nature elements is a relatively new research field in geosciences. Biology was the first to determine the concept ‘biological diversity—biodiversity’ at Rio Earth Summit in 1992 [
1,
2]. It is the variability of the living organisms of the Earth [
1], or more precisely: ‘the diversity within species, between species and of ecosystems’ [
2]. The introduction of the term ‘geodiversity’ came shortly after the Rio Earth Summit. It first appeared in Sharples’s work [
3], and evolved in the following years [
4,
5]. According to Gray [
6], geodiversity is ‘the natural range (diversity) of geological (rocks, minerals, fossils), geomorphological (landform, processes) and soil features. It includes their assemblages, relationships, properties, interpretation and systems.’ Gray [
7] analyses this concept and states that geodiversity is ‘a theoretical framework of ideas’ and ‘a set of assumptions, concepts, values and practices that constitutes a way of viewing reality’.
Finally, Gray [
8] extends the preceding definition. It is considered as the backbone of geoheritage, valuing abiotic nature, and geoconservation. The publication reveals a connection between modern society and geodiversity: humans have always used and earned benefits from abiotic features of the Earth for various purposes throughout history. It is also stated that geoconservation programmes and geoheritage are often based on the calculated spatial evaluation of geodiversity.
This definition also solves the contradiction between the triad of terms geodiversity, geological heritage and geoconservation by defining a practical approach for each of them. While geodiversity refers to all abiotic elements of nature, geological heritage (or geoheritage) is only a subset of geodiversity elements (with geological, educational or tourism importance). Geoconservation can be considered as a toolset: it is responsible for the identification, evaluation, conservation, and tourism promotion of geological heritage [
9,
10].
Assessment models to measure geodiversity evolved in parallel with the definition itself [
10,
11,
12,
13,
14,
15]. Most of them are based on cartographic and spatial database materials [
16,
17,
18]. Processing geological, geomorphological and pedological features within an area for assessment tasks is done in a GIS (geographic information system) environment. Studies use various types of national data sources all over the world—even in tropical and developing countries [
19,
20,
21].
In Hungary, no geodiversity assessment has been made before. However, many areas are promoted as having geoheritage and geotourism values and are under geoconservational protection. There are two UNESCO Global Geoparks in Hungary (one common with Slovakia) and other protected areas, as well as National Parks that focus on geological and earth scientific heritage. This research aims to set a basis for further assessment works by following these guidelines:
The methodology should be used anywhere.
Data sources (maps, databases) should be available to researchers.
The method should reach a balance between different data sources—none of them should be overrepresented—this is statistical normalisation in this case.
Try to build universal variables (data sources) into the model (instead of country-specific data) without loss in scientific value to establish the potential of international comparison. These are digital elevation models and derived data from them (geomorphons and watercourse network).
The geodiversity assessment of Bakony–Balaton UGGp is the first attempt to follow these pillars to determine the geodiversity index. Apart from theoretical benefits, this study can open new perspectives to the Geopark by highlighting areas with high geodiversity.
2. Geography and Diversity of the Area
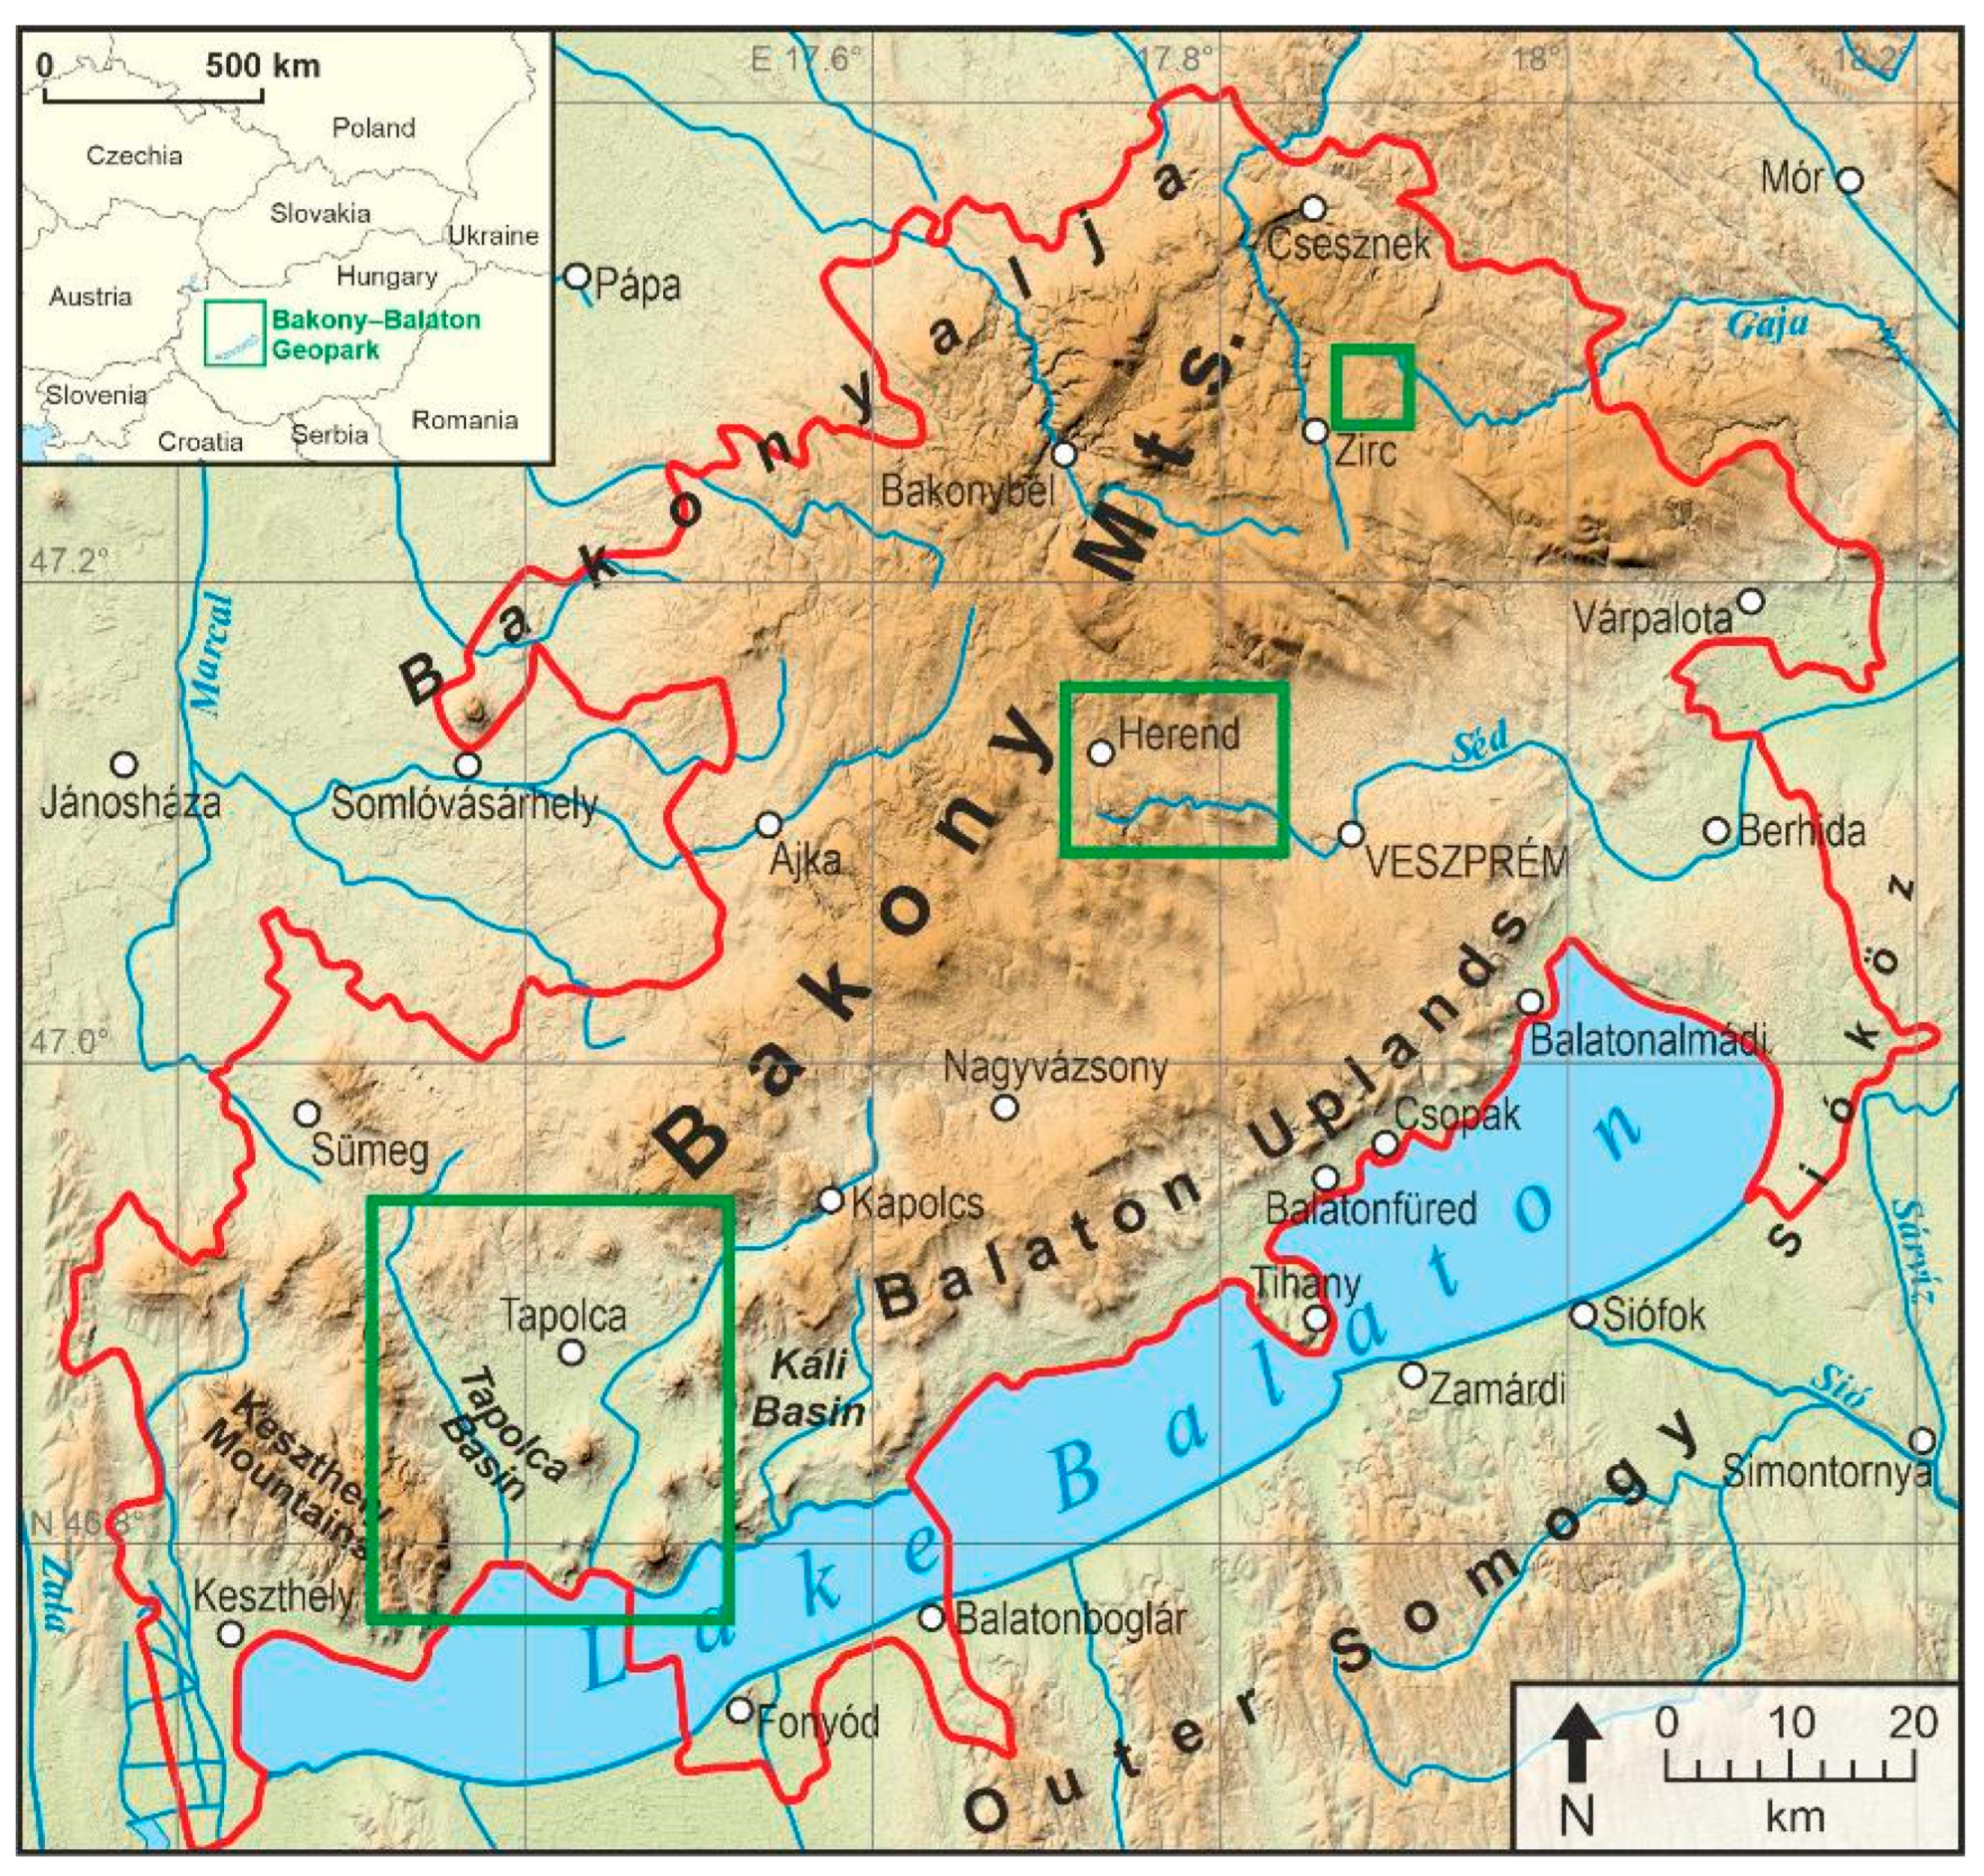
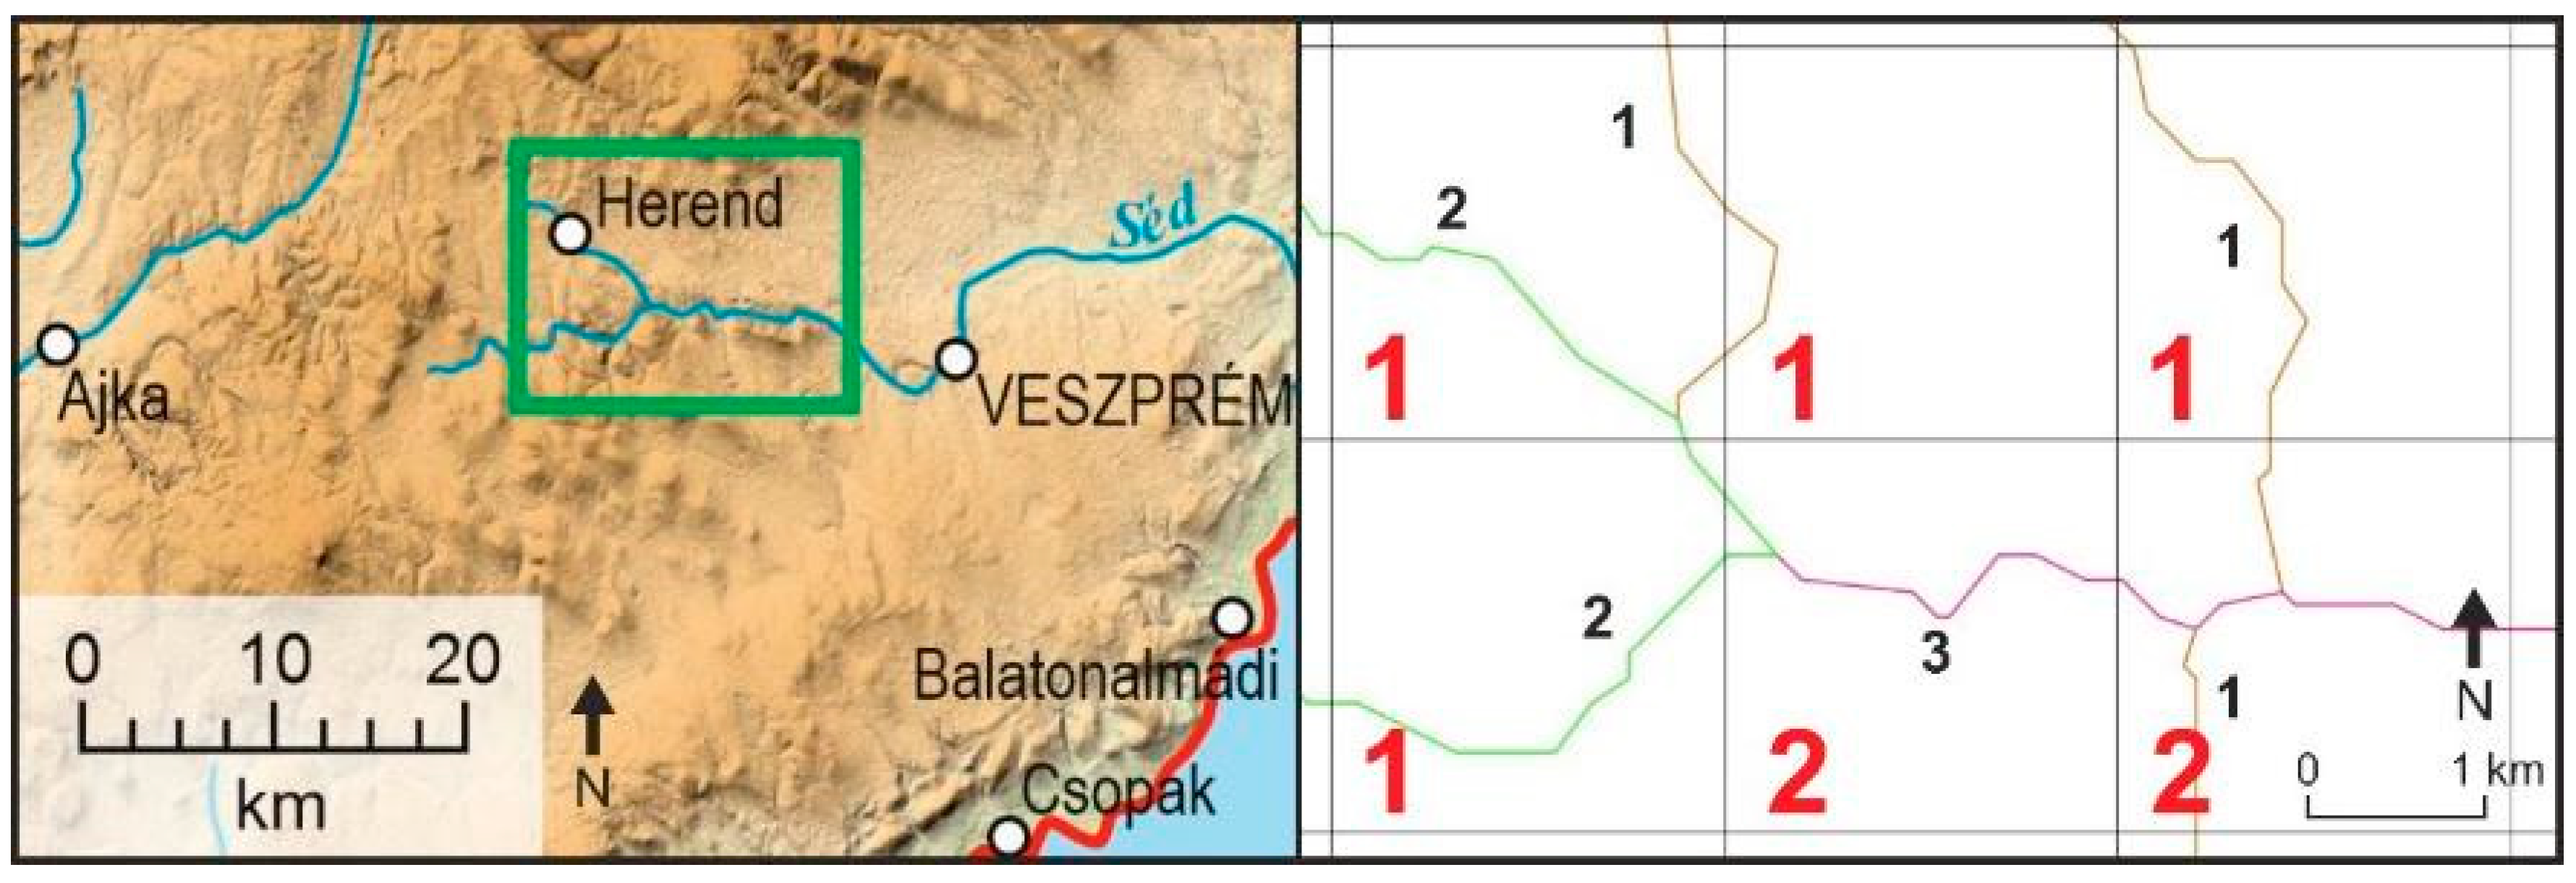
The sample area—Bakony–Balaton UNESCO Global Geopark—is located in the western part of Hungary, next to Lake Balaton, the largest lake in Central Europe. The 200 km long and 30–50 km wide Transdanubian Mountains cross through the Geopark, with an average elevation of 400–600 m. It is mostly built up by Mesozoic limestone and dolomite, with volcanic areas and karst horsts. Between the hills, basins are covered with Tertiary/Quaternary deposits. When strong tectonic forces were present, horsts, grabens and basins were formed by deflation that exhumed the basalt buttes of the area [
22]. The highest parts of the Geopark are in the Bakony Mts. The amount of precipitation is in tight connection with the NE-SW direction of the mountains: the annual rainfall is around 600 mm in the NW parts and 500–600 mm in the SE parts. In a geomorphological context, the area is divided by distinct faults into smaller units with various attributions: lifted highlands (Keszthely Mts), horsts and grabens (Balaton Uplands, Northern Bakony) and carstic–basaltic undulated relief (Southern Bakony) also appear. Due to the accentuated surface, the vegetation cover shows great variability. In the sub-Atlantic Bakony Mts, beech woods are the most common due to the relatively large amount of rainfall. As the elevation decreases, oak and hornbeam woods become common. The sub-Mediterranean climate of the surrounding of Lake Balaton is good for chestnut and almond trees too [
23,
24].
The Bakony–Balaton UNESCO Global Geopark (
Figure 1) is founded and managed by Balaton Uplands National Park. It has been a member of the Global Geoparks Network (GGN) since 2012. It has an area of 3244 km
2 and encompasses 151 settlements. Its area is mainly located in the Bakony Mountains. Since the Geopark has a geological history of 440 million years, its earth scientific and cultural heritage is internationally outstanding. Many brochures, educational trails and visitors’ centres help geotourists in gathering scientific and cultural information [
25,
26,
27].
The eastern part of Lake Balaton is bordered by the 15-thousand-year-old Kenese High Shores that are built up by the marine sediments of the Upper Miocene Pannonian Sea [
26]. This area is also home to a botanical rarity,
Crambe tataria (Brassicaceae), which is an endemic species of the Pontic-Pannonic region [
29]. The most common building stone of the Balaton Uplands is the Permian red sandstone. There are educational trails (e.g., Alsóörs) and rehabilitated quarries (e.g., Balatonalmádi) with explanatory panels introducing the scientific background of this geological formation. Lóczy Cave is the most famous geosite in the eastern part of the Geopark, where the Upper Triassic Füred Limestone layers (with thermal water effect on them) can be observed [
30]. The area is also famous for its wines.
The Tihany Peninsula is well-known for its Benedictine monastery and picturesque landscape. Both biotic and abiotic features are worth mentioning here. Lavender is the most famous domesticated plant of the peninsula—it is grown here for centuries [
31]. Even the Geopark’s visitors’ centre in Tihany is called Lavender House. The first phase of Balaton Uplands volcanism took place here 8 million years ago. The stone walls and cliffs of “Monks’ Houses” (Barátlakások) and the geyserite cones of, and around the “Golden House” (Aranyház) geosite also show the immense power of volcanic activity [
32].
Famous vineyards and karren-surfaces (karst microforms) make the Pécsely Basin a tourist destination. From the quartz-cemented late Miocene sandstones, block fields (“seas of stones”) with spectacular pseudokarren features had formed on the borders of the Káli Basin that have a cultural value too: millstones have been carved from these blocks throughout centuries [
33]. On the eastern part of the basin, an abandoned basalt quarry was converted into the Hegyestű Geological Visitor Site, where all the nearby rock types are exhibited among the basalt ‘organ pipes’ of the 7.9 Ma old volcano [
34].
The Tapolca Basin and its residual hills (e.g., Badacsony, Csobánc) made of basalt form probably the most well-known landscape in Hungary. In this area, phreatic volcanism (producing scoria cones, lava fountains and lakes) was followed by erosional processes, and the soft pyroclastic rocks eroded, exposing the columnar jointed structure of the lava lake rocks as a result [
35]. The uplift of the area resulted in stronger erosion: wind and water formed the current landscape of the Basin. Cultural heritage is also relevant here because these basalt mountains were important through history: castles were built on top of them (e.g., Szigliget, Csobánc) for defensive purposes. Many endangered plants grow on the karst terrains of the area [
36]. Tapolca Lake Cave Visitors’ Centre is located under the city of Tapolca, presenting spectacular karst morphology. Csodabogyós Cave is the most important geosite of Keszthely Mountains being famous for its stalactites and stalagmites [
37].
The educational trail of the “Ancient Karst of Úrkút” (paleokarst of Úrkút village) shows the tradition of manganese mining in the Southern Bakony. The first outdoor mining museum of Hungary can be found in Ajka—the surroundings of the city was famous for bauxite mining and alum earth production. The archaeological findings of Szentgáli Rockhole can be discovered during cave tours.
Zirc is often called the “capital” of the Bakony Mountains (located in the Northern Bakony). The Natural History Museum of the Bakony Mountains is located here, presenting the Geopark’s rich earth scientific and cultural history. The famous dinosaurs of Iharkút are exhibited in the Hungarian Natural History Museum (Budapest), but there are open days during fieldworks in the summer [
26,
36].
3. Assessment Methodology and Process
The quantitative methodology of this study is based on the Portuguese school [
10]. There have been other modified assessment techniques rooting from this [
15,
37], but this original framework suits best to our standardising propositions. The process is built up by various numerical sub-indices that represent geodiversity elements: geology, geomorphology (relief and hydrology), pedology (soil science), palaeontology and mineral occurrences (precious stones, minerals, geological energy sources, mineral waters, and springs). The outcome of the evaluation is the geodiversity index—it is the summed value of the preliminarily determined sub-indices. Its purpose is to express all mentioned aspects in the most balanced way without emphasising any of them.
This study has applied only open-access software (QGIS 3.16.0, SAGA GIS 2.3.2 and GRASS GIS 7.8.4) to ensure reproducibility. The initial step of the assessment was the division of the sample area. The 3244 km
2 of the area was sliced up into a grid of 2 × 2 km
2 squares (
Figure 2). Each square represented a homogenous unit of the Geopark. All sub-indices and the final geodiversity index were defined in these areas. The reason for choosing this resolution was in connection with the extent of the Geopark and the scale of the available data sources to produce the most realistic index values in the cells. If the grid is too dense and we have a small-scale thematic dataset, the relations between the thematic features are not correctly detected. If the grid cells are big and the data large-scale, each grid cell gets large index values, but it does not correctly represent the diversity. Otherwise, if the cells are too small or the data too small-scale, the value of the indices will be too low, and again we will not get a meaningful picture of diversity. In brief, grid resolution depends on the desired complexity of the assessment and the scale of the available data sources.
3.1. The Normalisation of Subindices
Each sub-index requires a dataset with specific thematic data. We used a 1:100,000 scale geological map [
22], a 1:100,000 pedological map [
38], a 90 m-resolution DEM [
28], and explanatory books of geological formations of Hungary [
39,
40,
41]. Usually, it is hard to find and use layers of the same scale and complexity. Scale differences may result in the overrepresentation of more complex thematic layers. This problem can be improved by the normalisation of sub-indices:
The multiplicative inverse (or reciprocal) of the maximum value of a certain sub-index multiplied by the sub-index value of a specified cell gives the normalised value for the cell. Therefore, the maximum of a sub-index can be 1, and the other values range from 0 to 1 proportionally. If this process is repeated in case of every thematic sub-index, a normalised geodiversity index is calculated by summing them up. The normalisation reduces the distortion of scale and complexity differences from the assessment process, and thus, a more balanced geodiversity index can be produced.
3.2. Geological Sub-Index
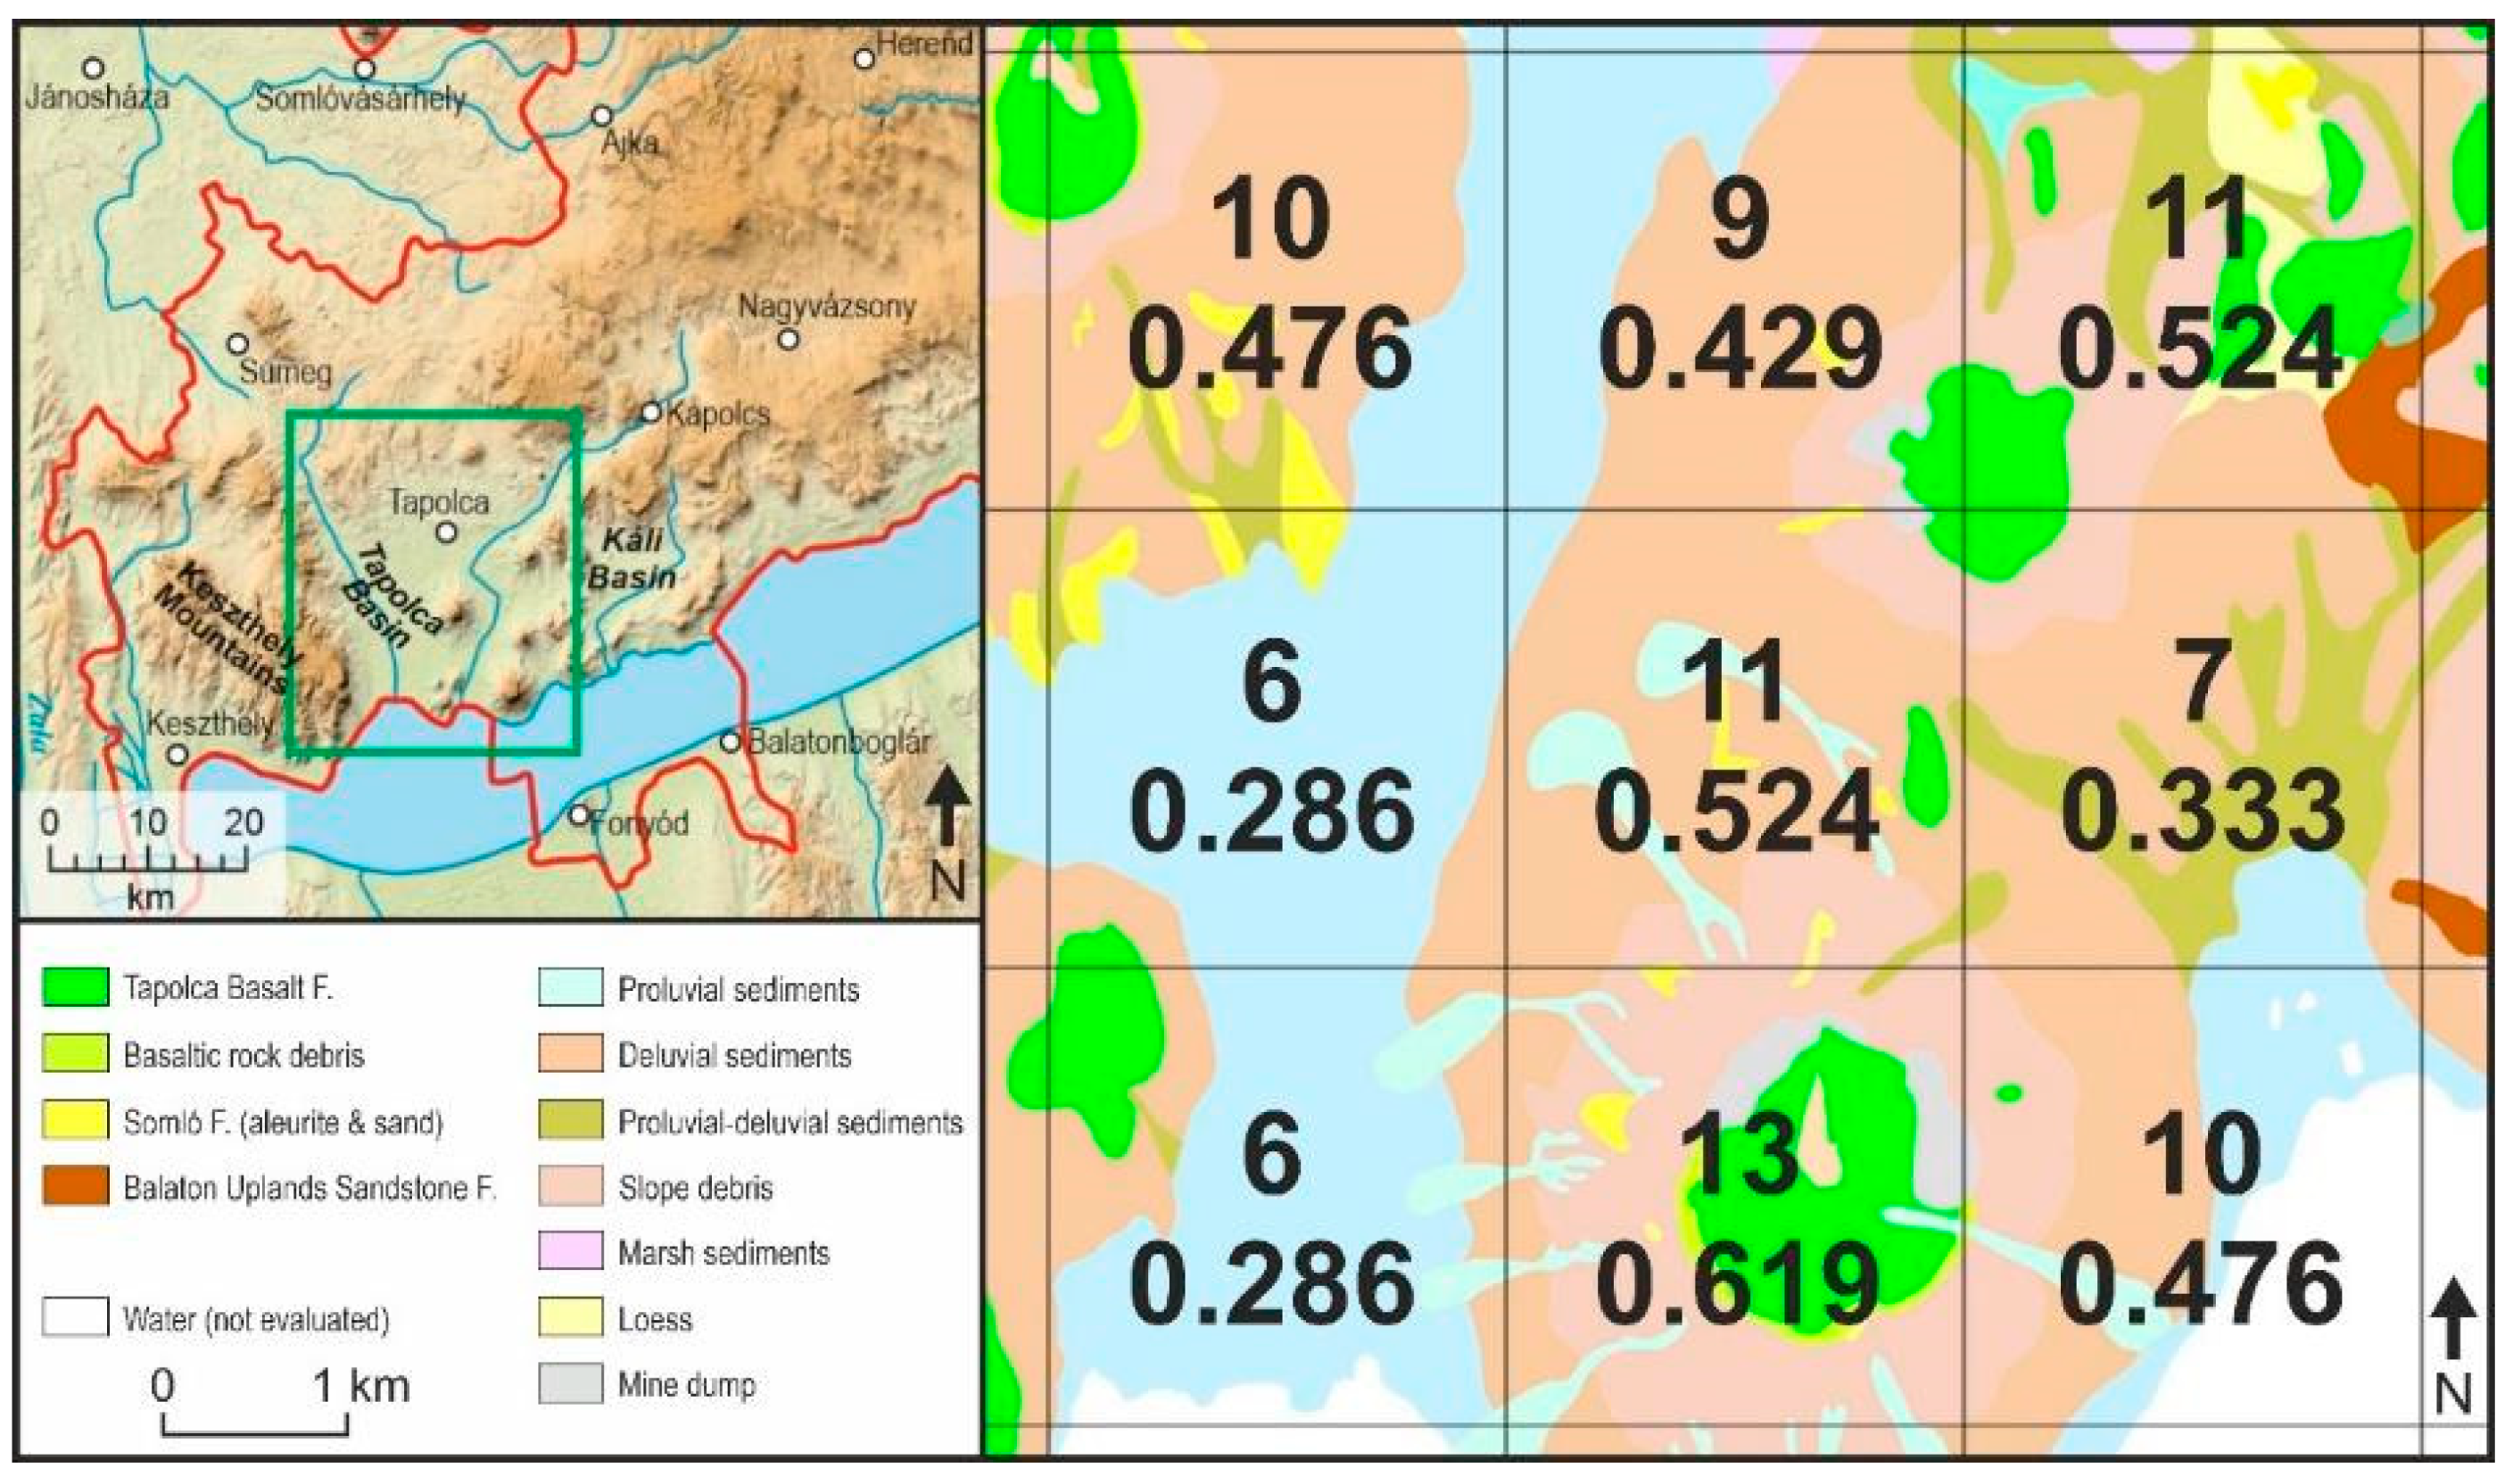
The geological sub-index was calculated using the 1:100,000-scale geological map of Hungary, cropped for the Geopark [
22]. The sub-index was determined by counting the number of different lithostratigraphic units in each grid cell (
Figure 3). For this, the geological vector layer was rasterised and the ‘Zonal Statistics’ geoprocessing tool’s ‘Variety’ attribute gave the different raster values (geological types) of each cell. After this, the normalisation formula was applied to get balanced sub-index values.
3.3. Pedological Sub-Index
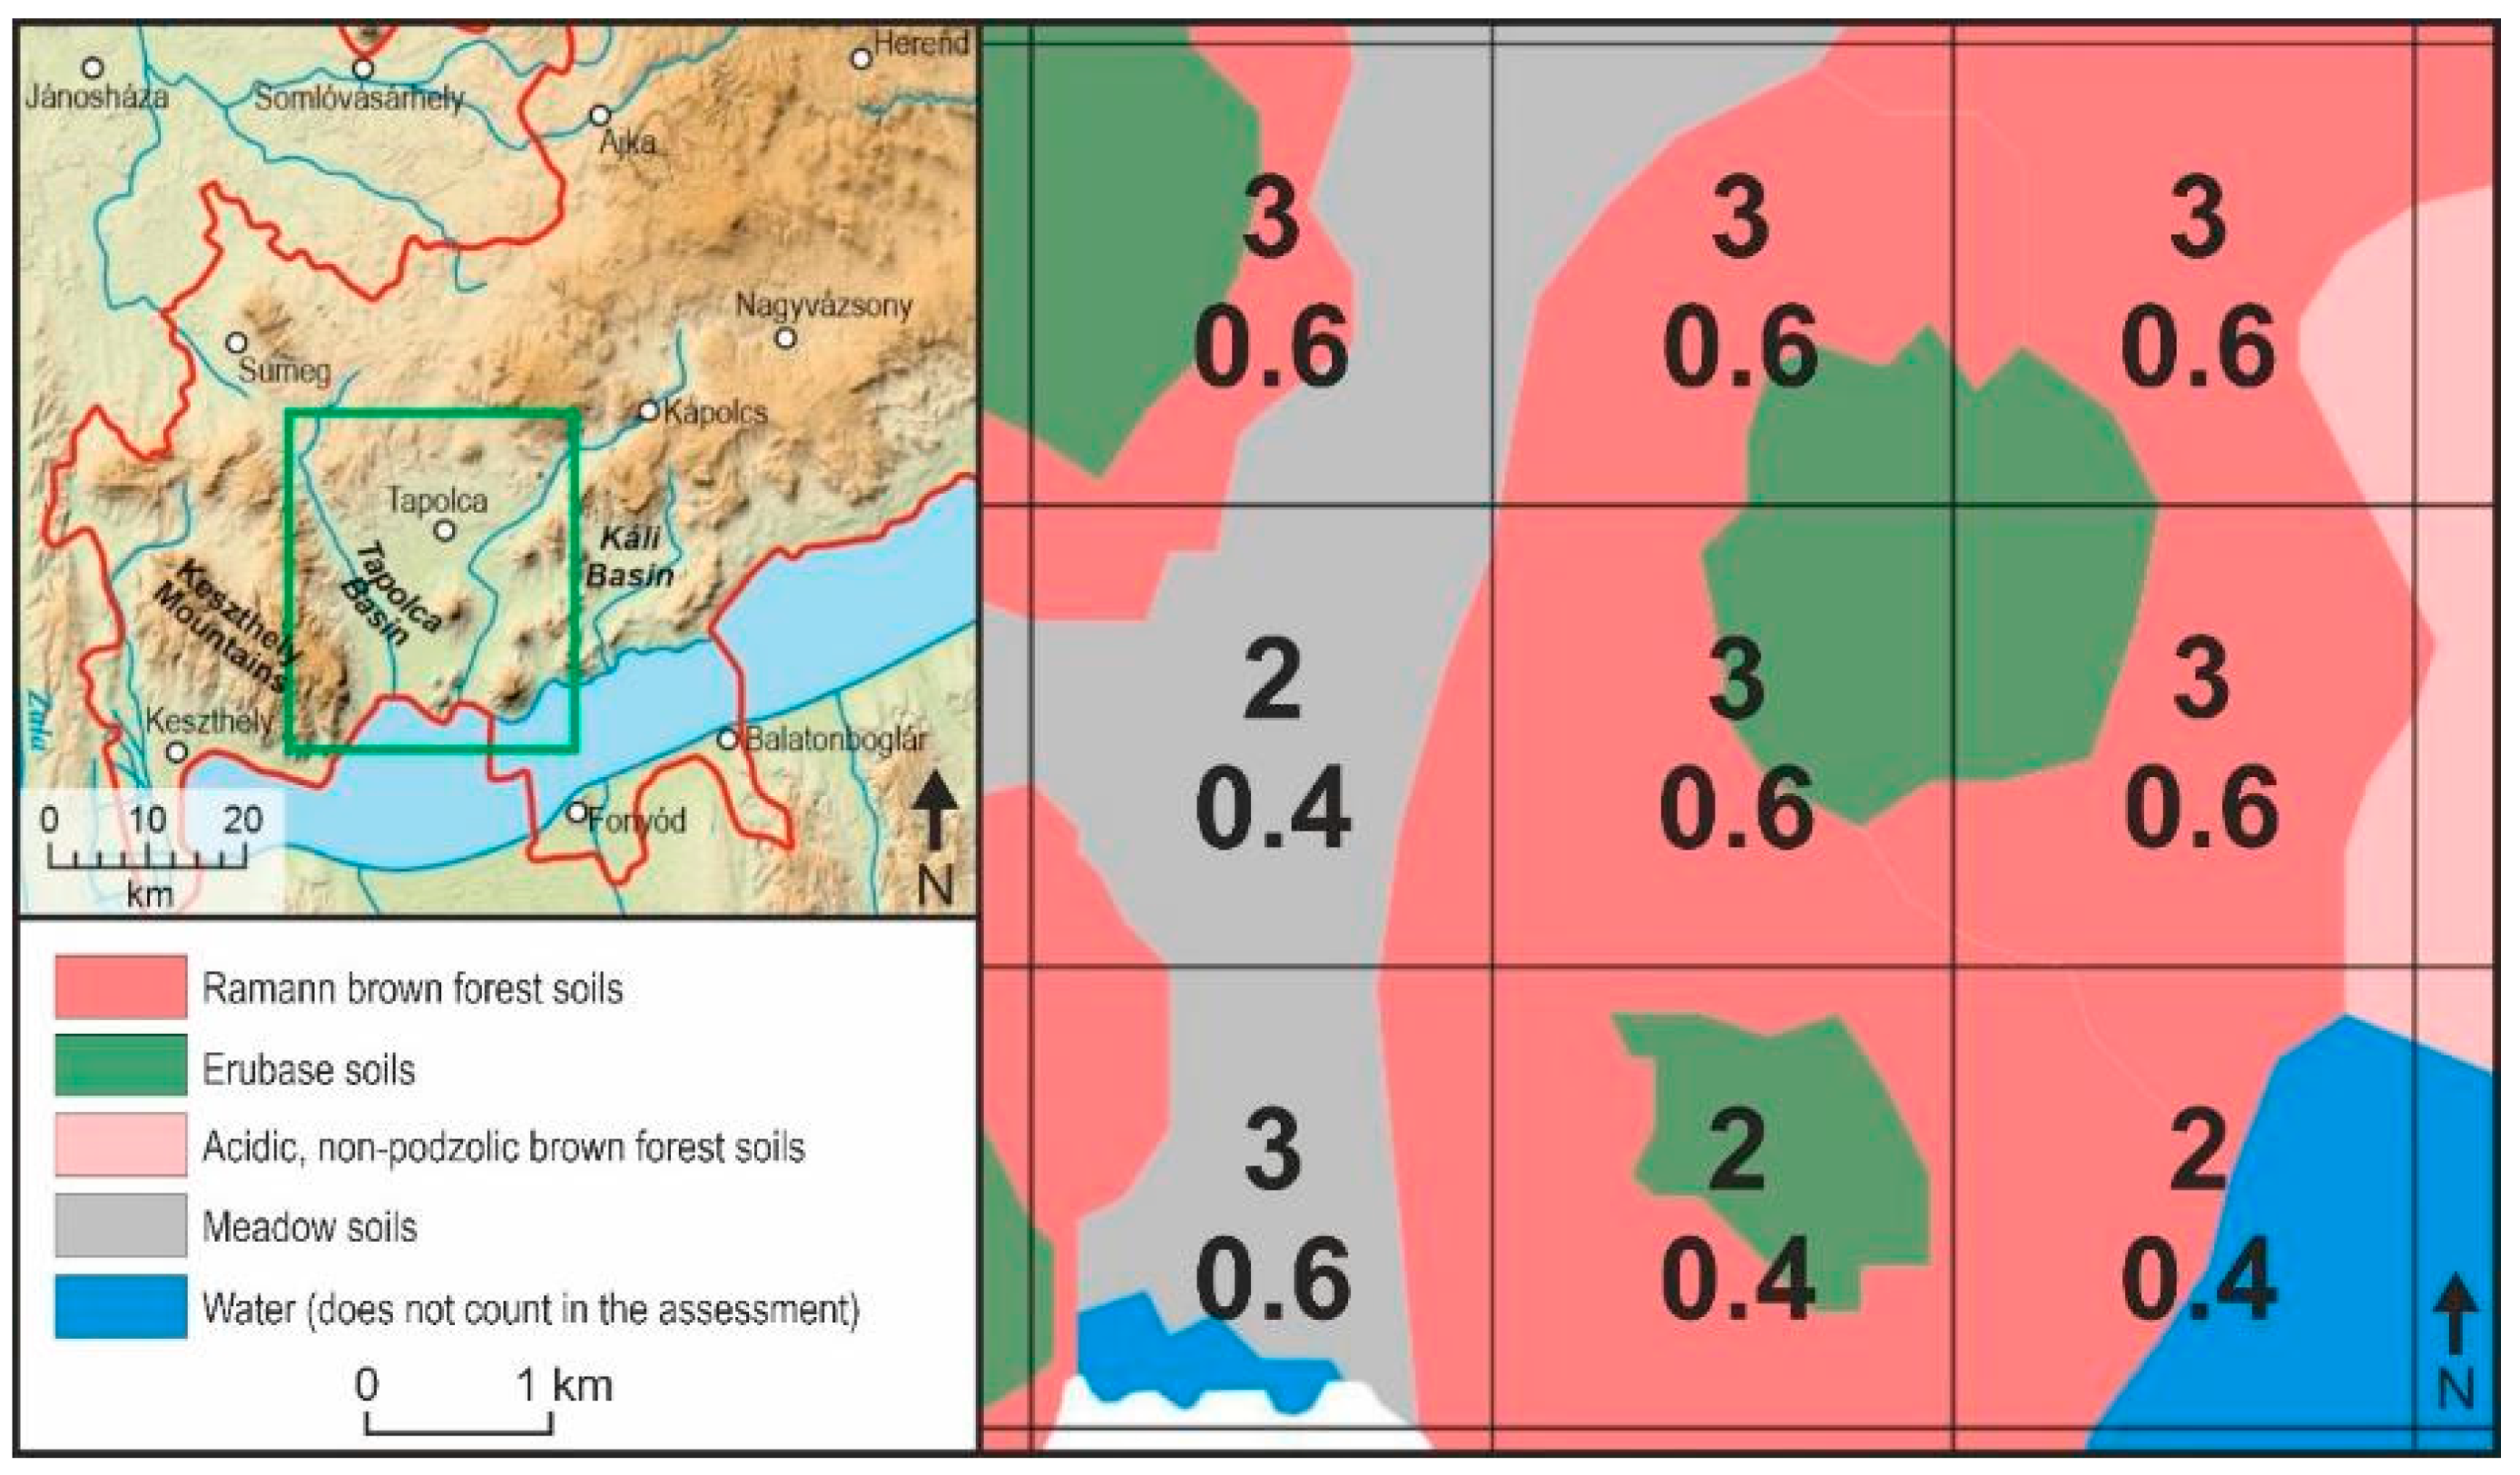
This sub-index was calculated by using ‘AGROTOPO 100’ [
38] that is a 1:100,000-scale soil map and digital database containing genetic soil classes. Using the different soil class occurrences in each cell, the sub-index was calculated in a way similar to the geological sub-index. After rasterization and running ‘Zonal Statistics’, the normalisation formula was applied (
Figure 4).
3.4. Geomorphological Sub-Index
The geomorphological sub-index is the composition of relief and hydrological indices. In preceding publications [
10,
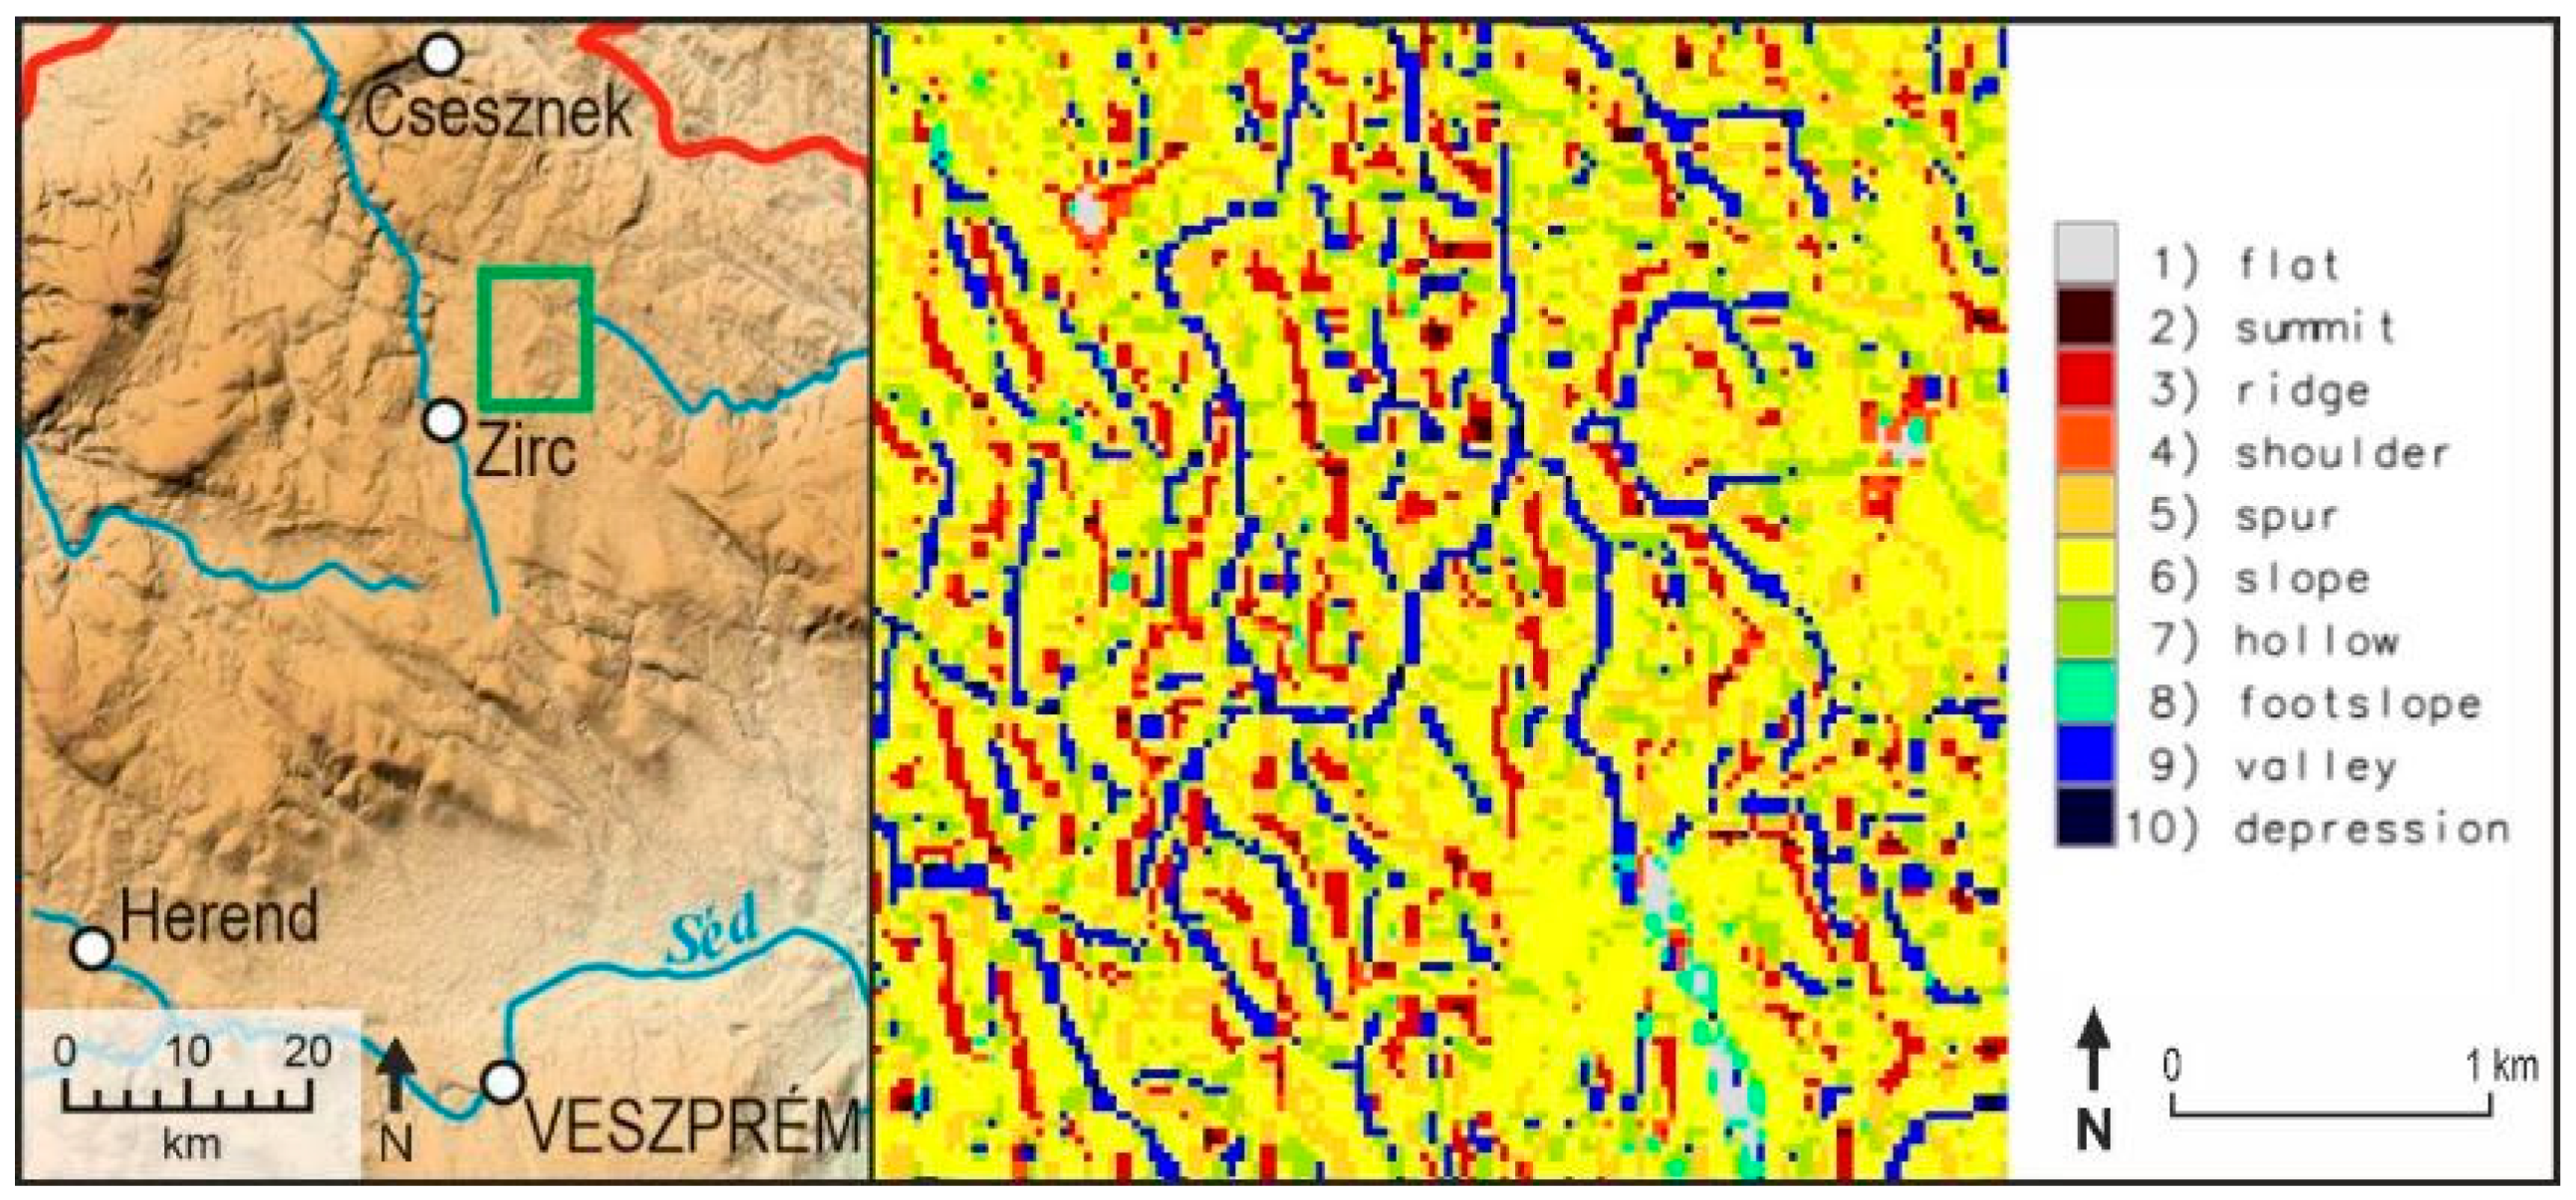
15], the relief index was calculated by using geomorphological maps, and the method was similar to the geological and pedological indices we described: the number of different geomorphological units determined the score for each cell (some models counted in the borders between morphostructural units too). In the study area, a medium scale geomorphological map was not available, so we used the MERIT DEM [
28] digital elevation model for this task, which is an improved version of the SRTM 3 surface model. The DEM was categorised into morphological types called geomorphons, based on the morphometric derivatives. The theory of geomorphons [
42] is a relatively new concept of terrain analysis. It uses 8-tuple patterns of the visibility neighbourhood to detect pixel values and determine terrain forms in the eight principal directions to a surface point. Two parameters can be manually changed: search radius and flatness threshold—they affect the complexity of form recognition. By analysing DEMs this way, we can delineate 10 different morphological types (
Figure 5). The production of relief sub-index was produced similarly to geology and pedology from this raster data.
The hydrological index counts with the effect of hydrological elements on geomorphology. As in the case of the relief index, we tried to find a universal way to construct a watercourse network for the sample area. To do so, the hydrological modelling tools of SAGA GIS were used. After generating a depressionless elevation layer (‘Fill sinks’ tool), channel network can be extracted (‘Channel network’ tool). We have also used a ‘Flow Direction’ raster (also generated with SAGA) that enhanced the results. However, current hydrography does not always reflect the phenomena expected from geomorphology. This is because the climate may have changed since the valley was formed, or the stream may flow in a different direction due to erosion or tilt, or it may disappear underground because it is in karstic rock. In any case, the valley is there. Due to this, the generated channel network was corrected with the use of OpenStreetMap and large-scale topographic maps to avoid that the extracted network contains valleys where water is not present. With proper parametrisation and resolution, it is not too time-consuming—mostly limestone and karstic formations need moderate supervision. The resulting layer can be categorised by applying the tool ‘Strahler order’ [
43]. According to this system, the lowest hierarchical group (with a value of 1) encompasses streams while the highest value (5) is assigned to large rivers, lakes, and coastal areas. The value of the index in each cell is the highest hierarchical level divided by 2, rounded up to the nearest integer (
Figure 6). For instance: a score of 3 can be assigned by having a level ‘5′ watercourse (5/2 rounded to 3) in a certain cell. Zero value is determined if there is no hydrological element in the grid cell.
Finally, the geomorphological sub-index was calculated by summing the relief and hydrological indices and then performing normalization on the summed cell values.
3.5. Palaeontological Sub-Index
Unlike the previous cases, this sub-index was not determined with the use of geodatabase sources since freely available medium-scale fossil map was not available. However, the method based on the geological map we used for calculating the geological sub-index. The original dataset of the geological map does not contain information about the fossils, but the explanatory books of geological formations of Hungary [
39,
40,
41] do. A new attribute was created for all the lithostratigraphic units using their descriptions. Fossiliferous formations were noted (based on the formation descriptions), and the number of different fossils per formation was added to each geological polygon. This value in every cell was considered as the palaeontological sub-index. The maximum number of different fossils in a cell was 9 and the minimum was 0. The average number of fossils in the cells was 2.31. Normalisation was also applied in this case.
3.6. Mineral Occurrences Sub-Index
This sub-index was also determined with the help of the geological map and the formation description booklets [
39,
40,
41], as there were no medium-scale thematic maps available. The following elements were searched and written in the database in case of each geological formation polygon: (1) precious stones—e.g., diamond, gold, silver; (2) metallic minerals—e.g., lead, copper, manganese; (3) industrial minerals—e.g., quartz sand, calcite, bauxite, gypsum; (4) geological energy sources—e.g., lignite, oil shale, natural gas; (5) mineral waters and springs. In each cell, we counted all the different elements (enumerated before) and considered their number as the sub-index. The maximum number of different mineral elements in a cell was 5 and the minimum was 0. The average number of mineral elements in the cells was 0.68. The values were also normalised.
4. Results
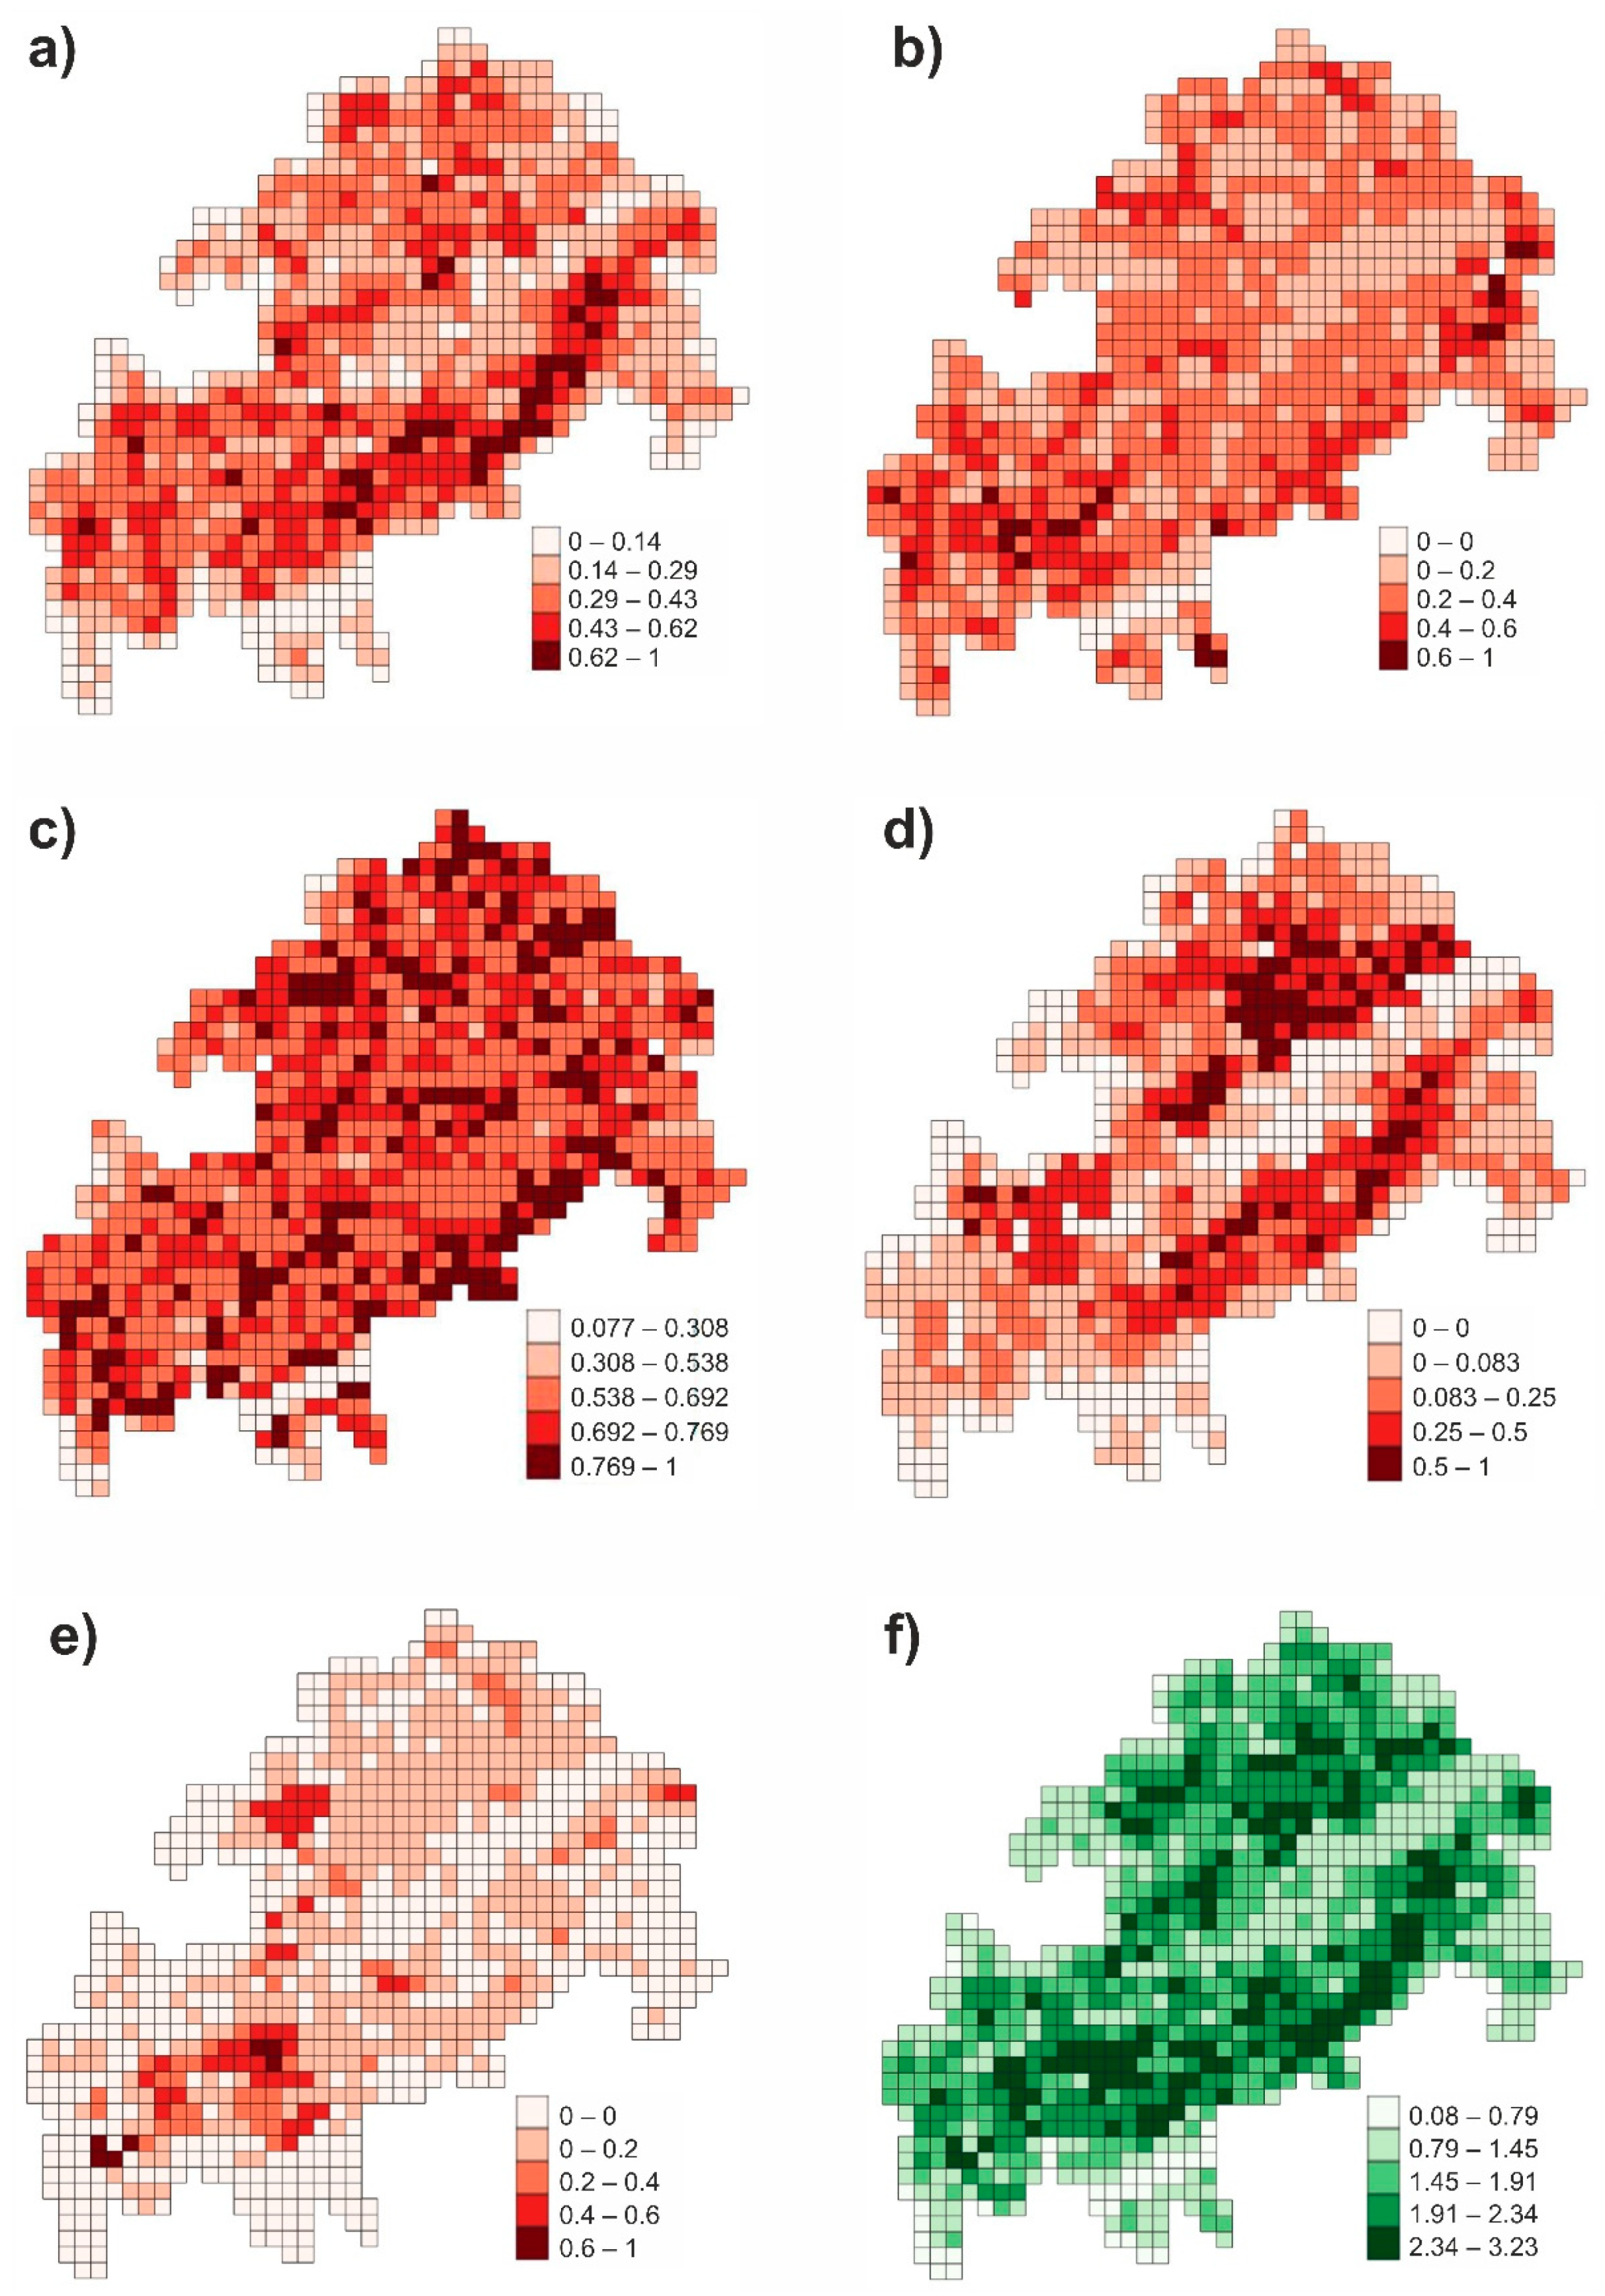
Each sub-index value set was visualised using the 2 × 2 km grid in QGIS. Five cluster groups were formed by ‘Natural Breaks’ method [
44]—it minimises normal deviation between the elements of groups and maximises the difference between the groups. The distribution of geodiversity elements can be observed in the produced maps (
Figure 7).
The visualization of the geological sub-index shows that Balaton Uplands (south-eastern and central part—for geographic names see
Figure 1) is geologically the most diverse area in the Geopark. There are some large-score cells in the Bakony Mountains (northern part), Tapolca Basin and the Keszthely Mountains (western part). The shore of Lake Balaton and the valley of stream Séd around Veszprém are the least diverse areas in the Geopark in this aspect (
Figure 7a). Before normalisation, the maximum geological sub-index value was 21 and the minimum 0.
The highest pedological sub-index values are in the eastern part of the Geopark (around the city of Várpalota), Tapolca Basin, and the southern shore of Lake Balaton around Fonyód. The lowest scores occur around Veszprém and in the Bakony Mountains (
Figure 7b). The maximum pedological subindex value before normalisation was 5, the minimum 0.
The distribution of geodiversity sub-index is rather even. The balanced relief index resulting from geomorphon analysis is supplemented with the hydrological index. Due to this, the shores of Lake Balaton and watercourses (e.g., Séd stream) can be spotted and tracked in the grid map (
Figure 7c). Deep valleys and relatively high altitudes resulted large scores in some cells in the Bakony Mountains, Keszthely Mountains and Balaton Uplands. Before normalisation, the relief index value was between 1 and 10, and the hydrographic index value was between 0 and 3.
Palaeontology slightly correlates with the geological sub-index. Some sedimentary rocks (e.g., various formations of Triassic/Jurassic limestone and dolomite) of Balaton Uplands and even more in the Bakony Mountains have many more kinds of fossils than quaternary sediments or volcanic rocks (
Figure 7d). The maximum value of palaeontological sub-index before normalisation was 12, and the minimum 0.
The sub-index of mineral occurrences, mineral waters and springs shows the opposite trend that of palaeontology. Geopark areas with metamorphic and volcanic features show a greater variety of these geodiversity elements: Tapolca Basin, the western part of the Bakony Mountains and the Keszthely Mountains are outstanding in this aspect (
Figure 7e). The maximum value of this sub-index before normalisation was 5, and the minimum 0.
Geodiversity Index Map
By summarising normalised sub-indices in each cell, geodiversity index was produced. It was also visualised on a grid map (
Figure 7f). The highest geodiversity values occur in the Balaton Uplands, Tapolca Basin, Káli Basin and Bakony Mountains (
Figure 8). Less diverse are the valley of Séd stream and in the southern and eastern surroundings of the shores of Lake Balaton.
5. Discussion—The Use of Geomorphons and the Comparison of Raw and Normalised Geodiversity Index Values
In this paper, we presented two new methodological approaches: the use of geomorphons and the normalisation of geodiversity values.
The significance of the geomorphon concept in the production of a relief sub-index is that the use of DEMs eliminates the country- and scale-dependent factor, making the results more easily comparable. The algorithm used to generate the geomorphon parameters ensure that the method produces results that can be applied to any base data scale and grid resolution. This way, the relief sub-index can be produced easier where DEMs are available, thus simplifying the geospatial processing. However, for methods where other geomorphological parameters (e.g., age of landforms) are used to determine this sub-index in addition to the classification of landform types, this method may not be appropriate.
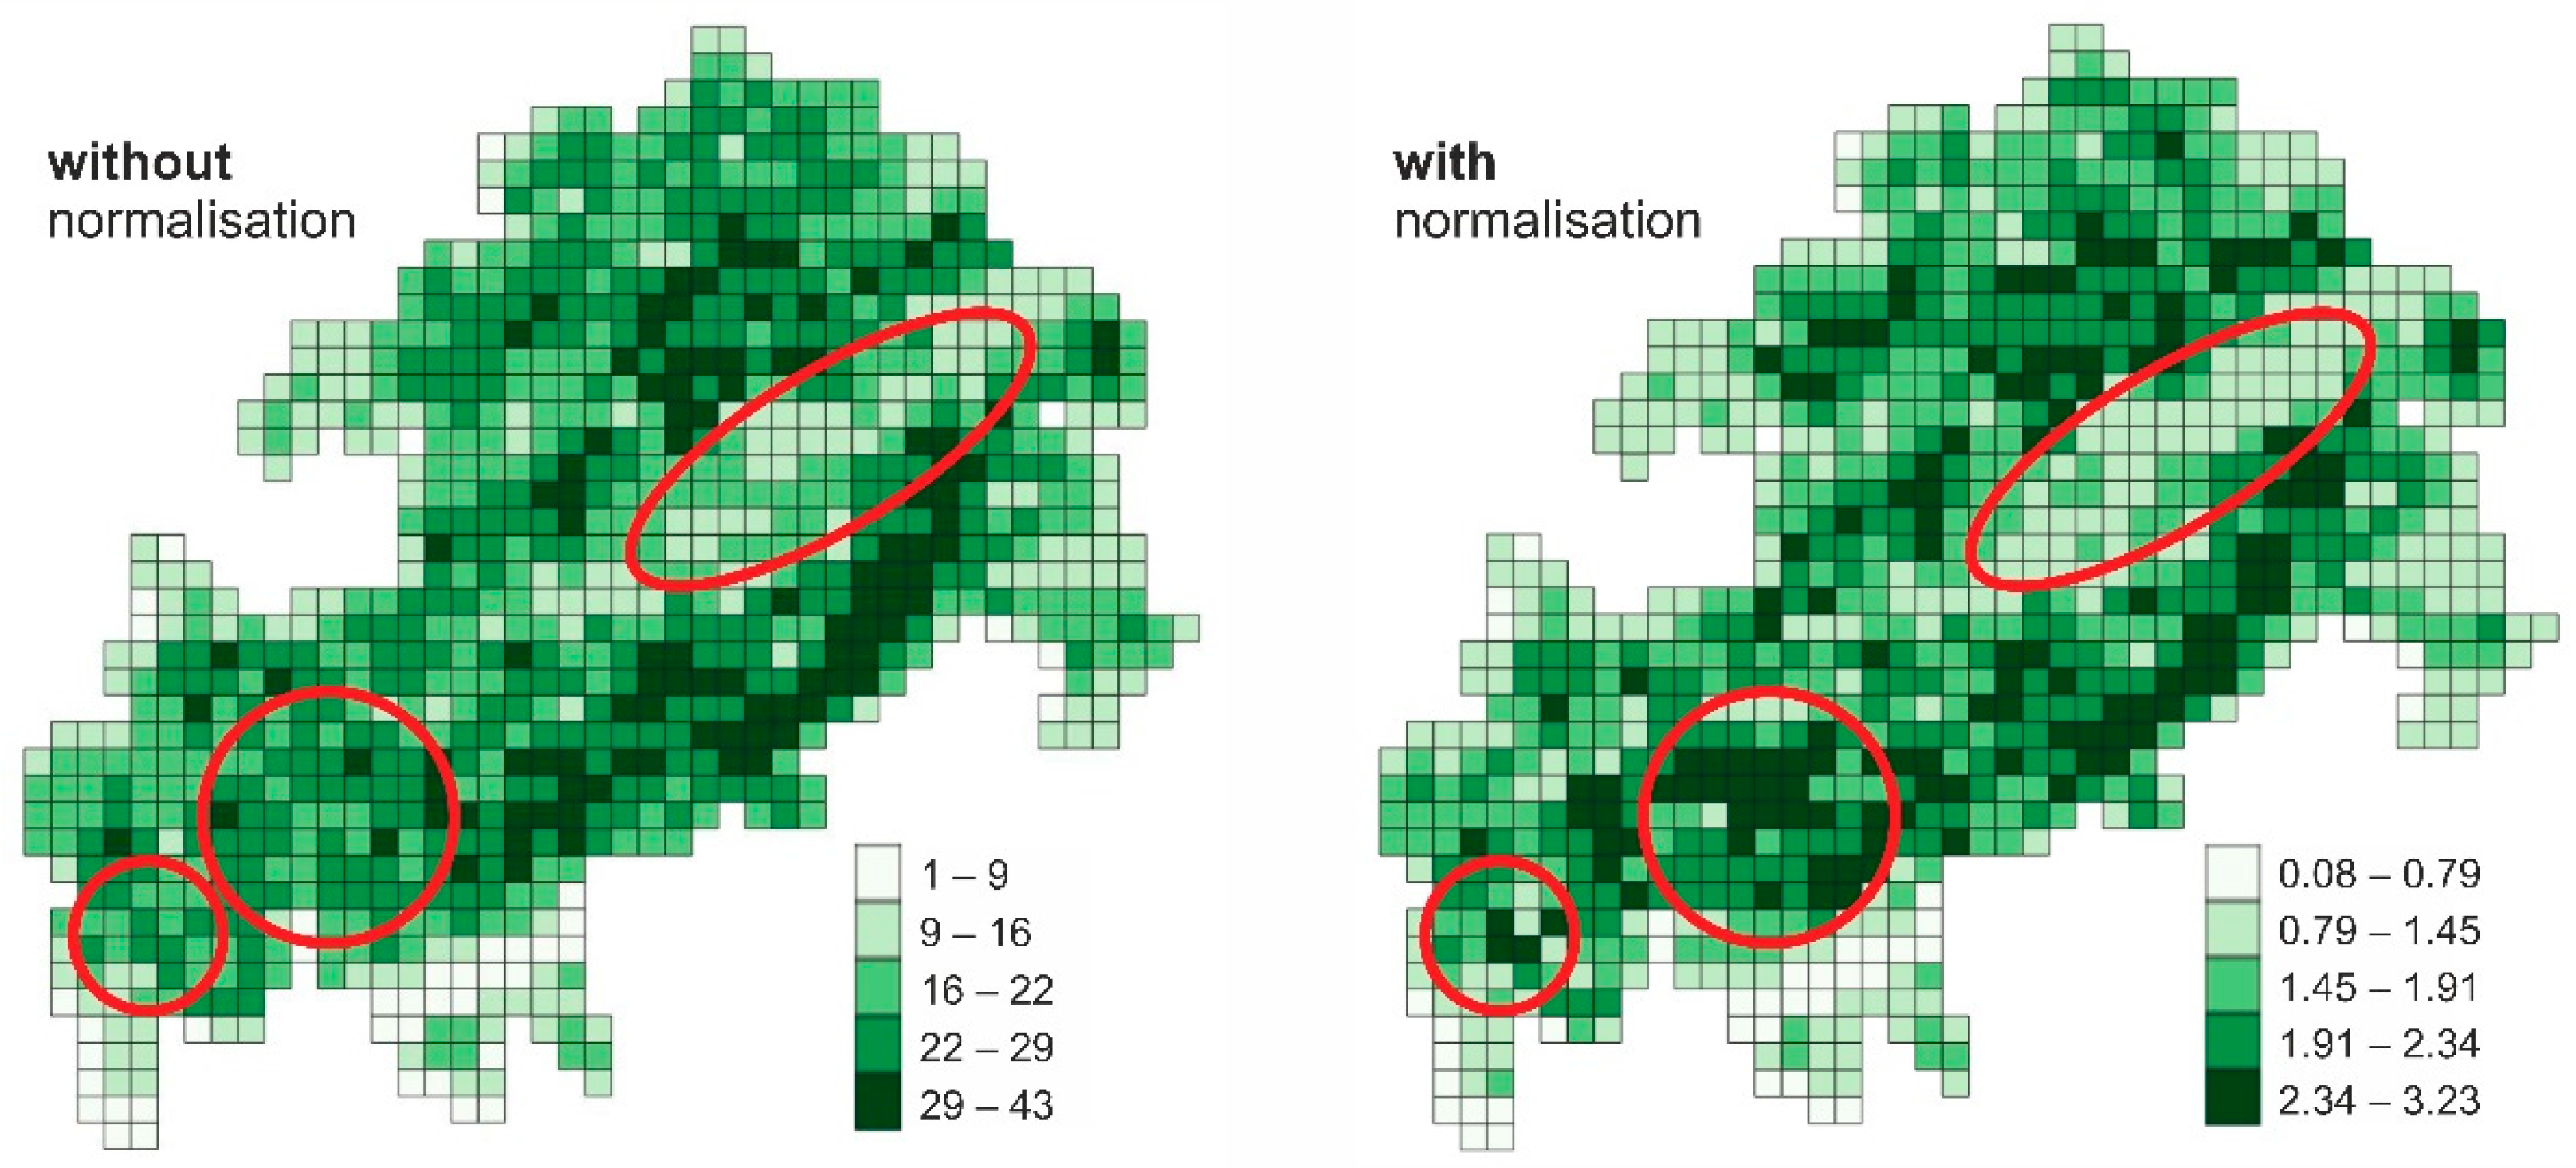
The summing up of the five different thematic indices without normalisation results in a geodiversity value in which some of the sub-indices are overrepresented (
Table 1). Such assessment may cause a large inequality when taking sub-indices into account. Two different percentage values were counted. ‘Max % of geodiversity’ means the proportion of each sub-index maximum value in the maximum geodiversity index, while ‘Median % of geodiversity’ means the proportion of each sub-index median value in the median geodiversity index. If looking at the median values, it occurs that the geological (33.3% of points) and geomorphological values (42.8% of points) are largely overrepresented in the assessment.
This unbalanced situation is mostly caused by the various scales and different types (vector, raster, DEM, formation descriptions) of base data. Accordingly, this kind of error can occur anywhere in the world where datasets from various sources are used for geodiversity assessment. The difference between the two methods is visible in the geodiversity maps generated from the two types (raw and normalised) of indices (
Figure 9).
The normalisation reduced the highlighting of both diverse and less diverse cells. Areas of large geodiversity are confirmed by the database of visitors’ centres and visitors’ sites of the Geopark [
45]: they are mostly located in the most geologically diverse parts of the Geopark.
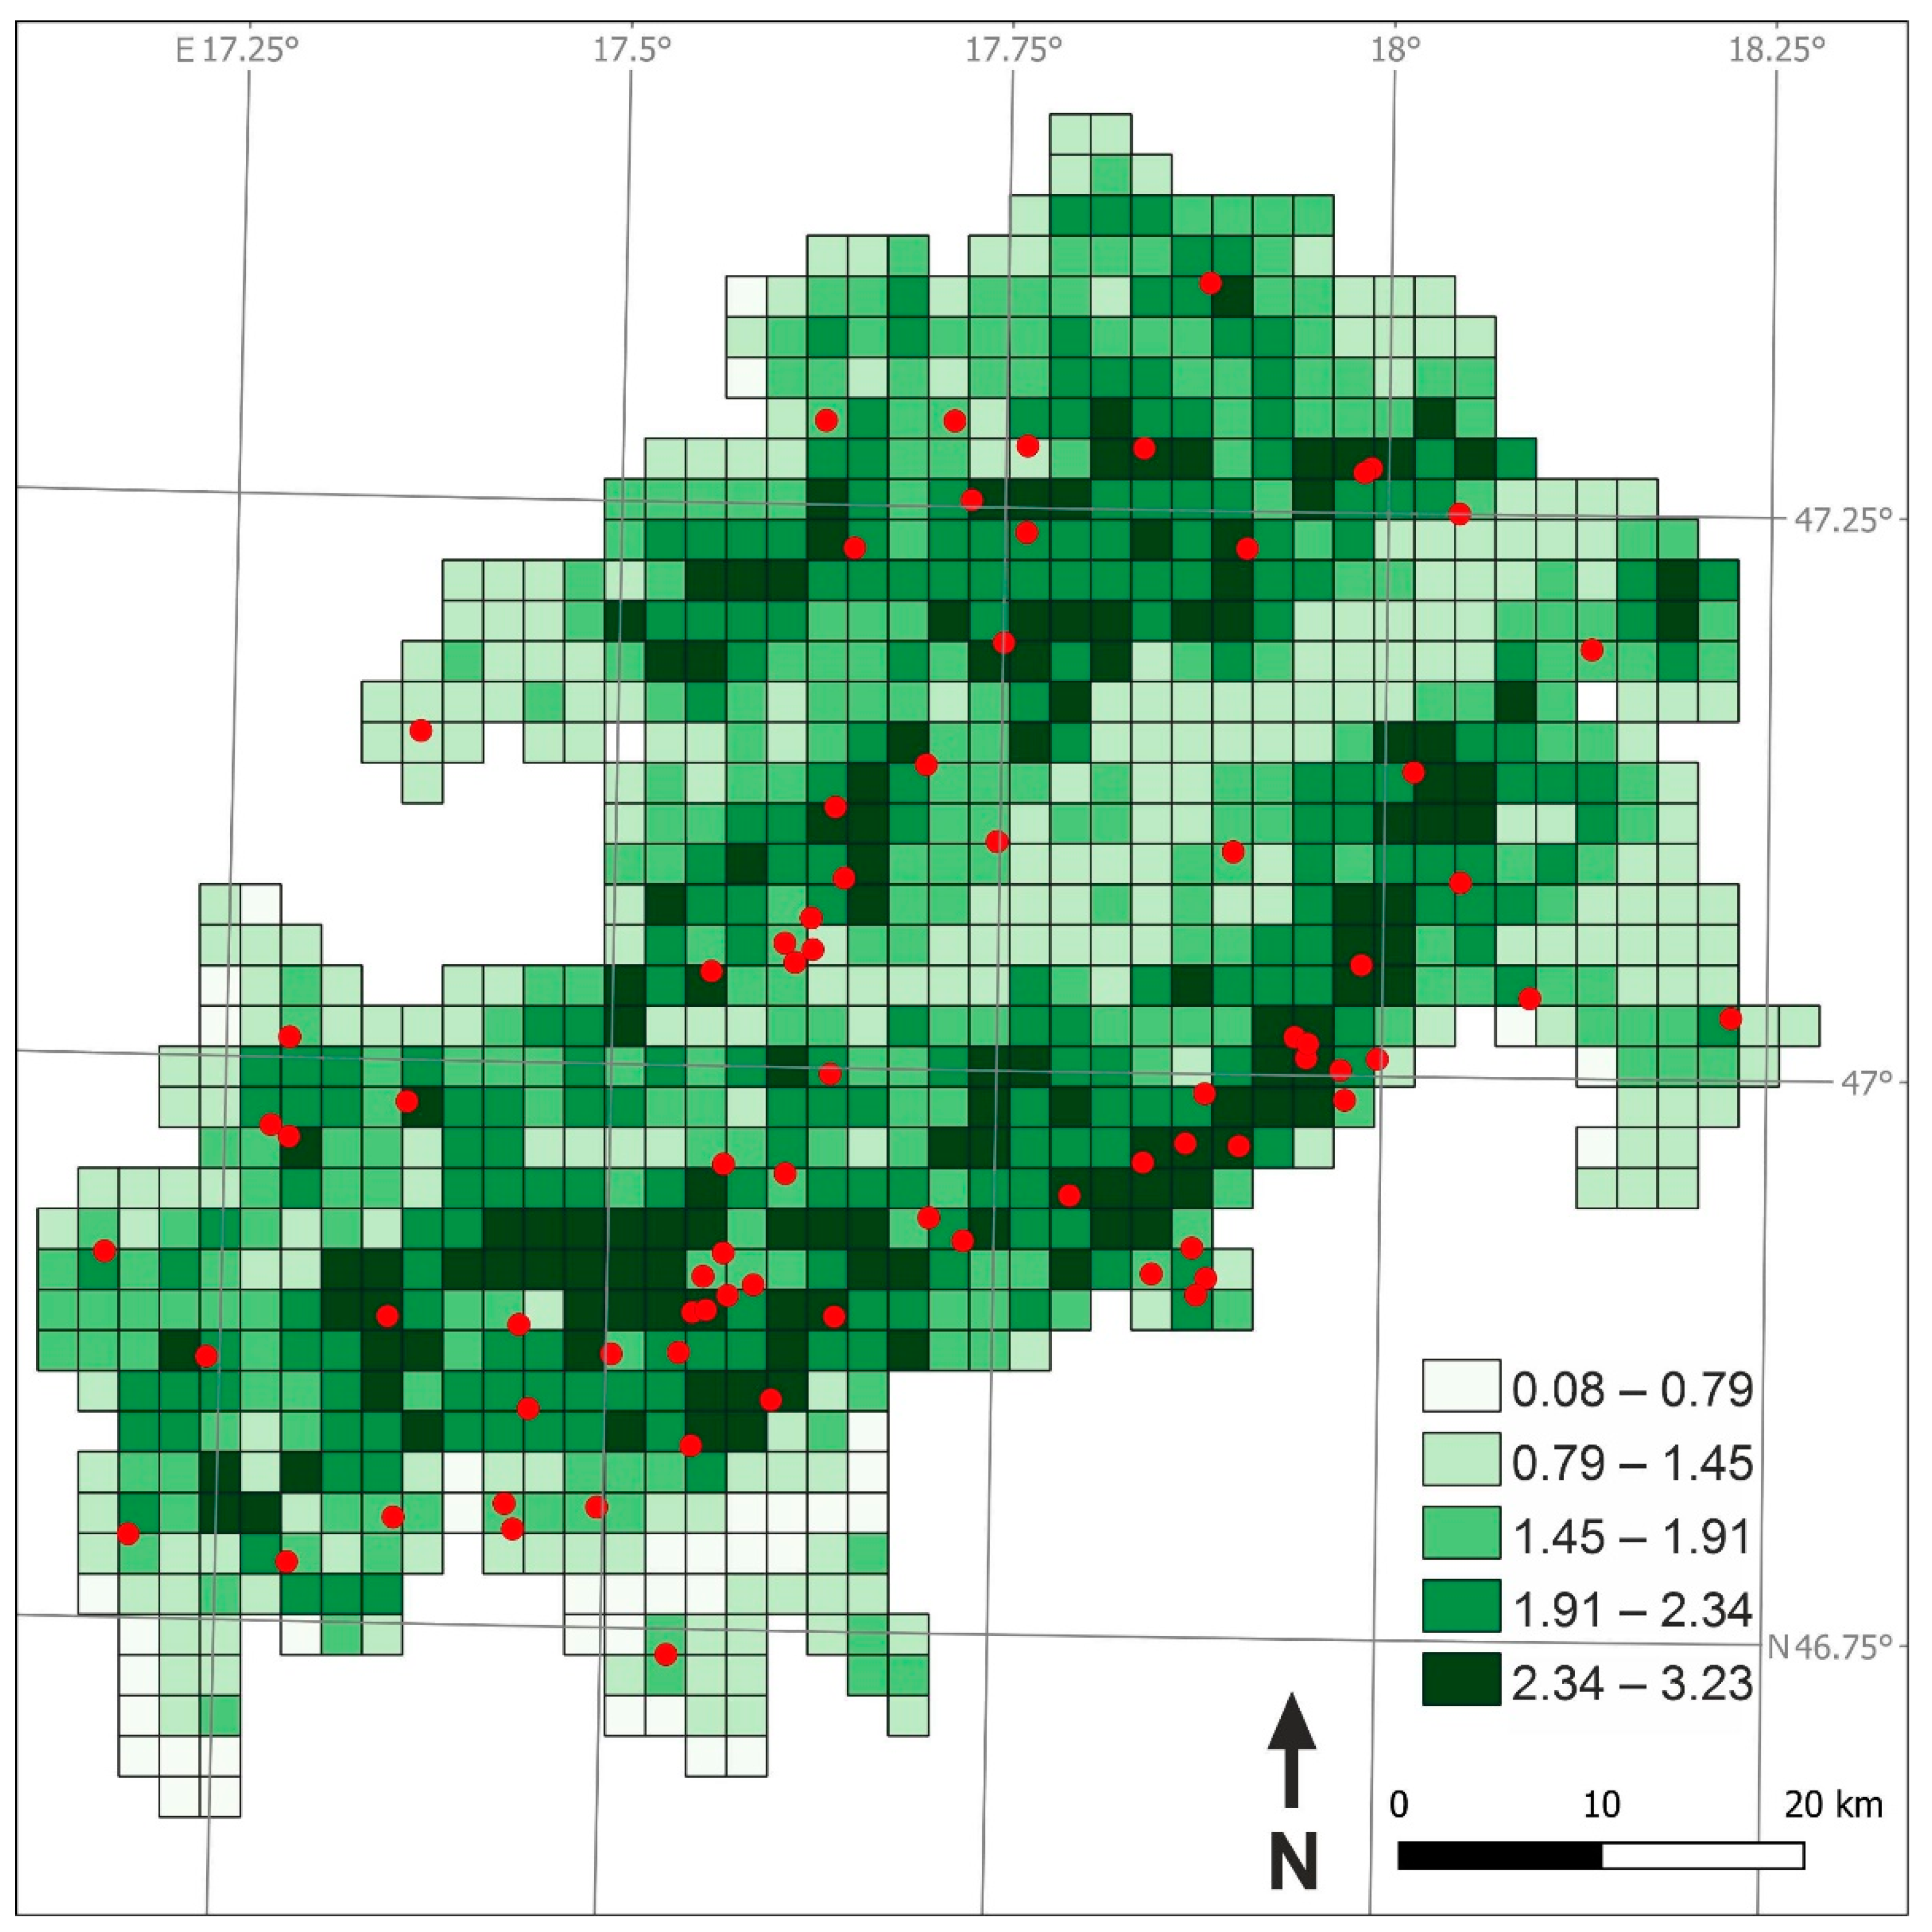
Figure 10 supports this correlation. The location of the 77 most important geosites can be examined in it: most of them are in ‘highlighted’, diverse areas.
Undoubtedly, the best practice would be to use consistent data from one single source with similar complexity. However, even in countries with well-developed science and policy, this is quite difficult, but researchers working in more difficult areas have a much harder task.
6. Conclusions
In this study, the refined geodiversity assessment of Bakony–Balaton UNESCO Global Geopark was presented. This was the first application of geodiversity quantification models in Hungary. The five thematic sub-indices (geological, pedological, geomorphological, palaeontological, and mineral occurrences) were determined by using digital maps and data sources (
Figure 7). Only open-source software solutions were involved: QGIS, GRASS GIS and SAGA GIS.
This research applied a widely used model of the Portuguese school [
10], but the calculation of the geomorphological sub-index is different in our case. In the case of geomorphological sub-index, a digital elevation model was used to conduct both relief (
Figure 5) and hydrological (
Figure 6) evaluation. Although the remaining sub-indices require more country-specific data, the choice of worldwide available data sources makes it easier to compare geodiversity values in different areas.
Our modified model uses the statistical method of normalisation that has two important impacts on the assessment data:
This kind of quantification holds the possibility to discover highly diverse cells with unexplored values—especially in new areas to be protected. Nevertheless, it is also useful for regions with active nature conservation since new elements and aspects can be found that enrich scientific message and stimulate tourism activities.
Geodiversity assessment is the initial step before establishing any infrastructure of geoheritage and geoconservation. Although this has been done before in the study area using other methods, no numerical survey has yet been carried out prior to this study. It was confirmed that tourist destinations with tourism and nature protection potential related to earth sciences are mainly located in cells with high diversity value. Through the methods presented, this paper helps researchers to conduct a thematically balanced assessment. Yet, the real contribution of the presented model to conservation and sustainable development needs to be tested in other areas.


