Distribution of Lightning Accidents in Sri Lanka from 1974 to 2019 Using the DesInventar Database
Abstract
1. Introduction
2. Data Collection
3. Data Analysis
4. Results
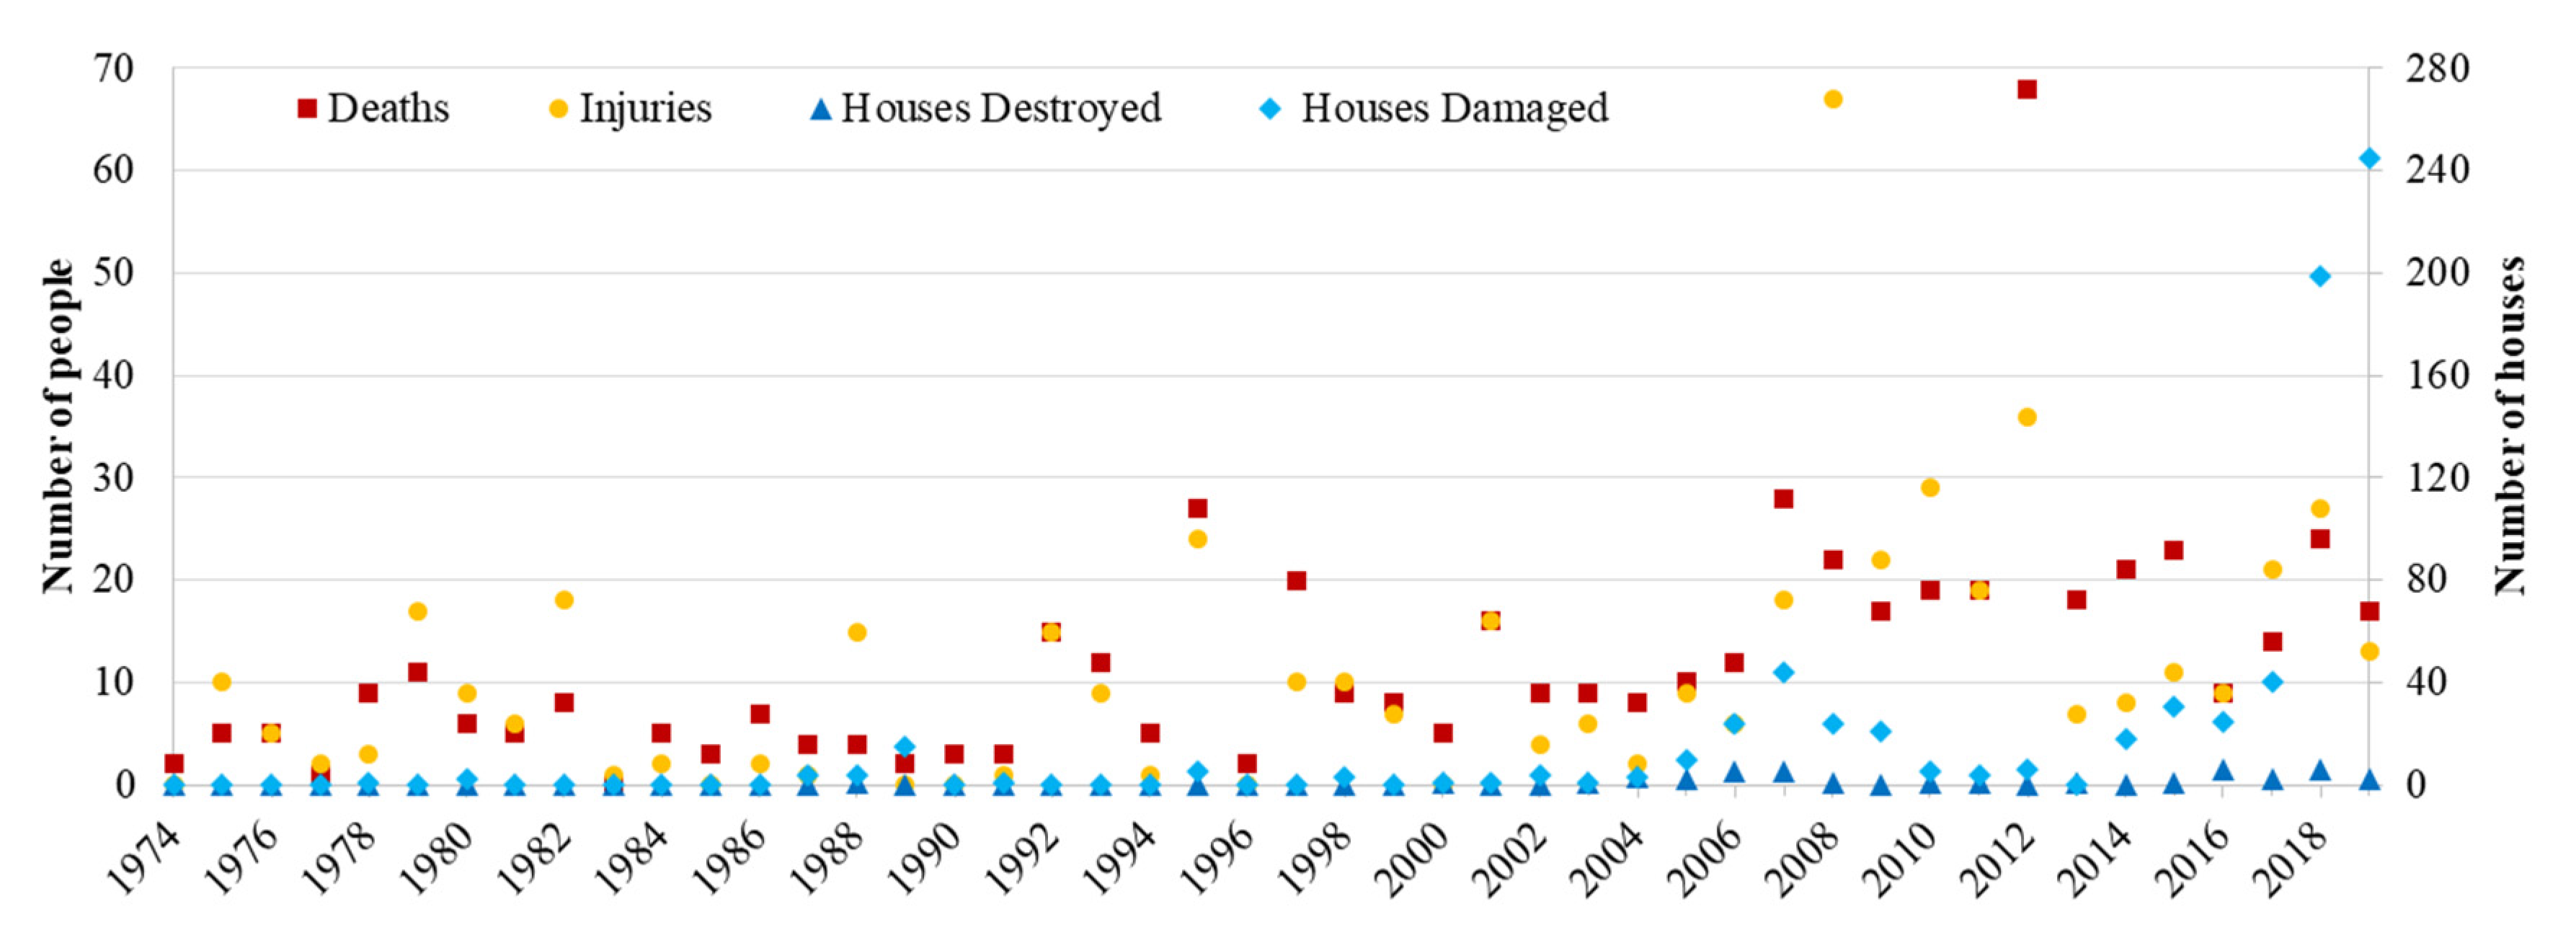
4.1. Temporal Distribution of the Lightning Accidents
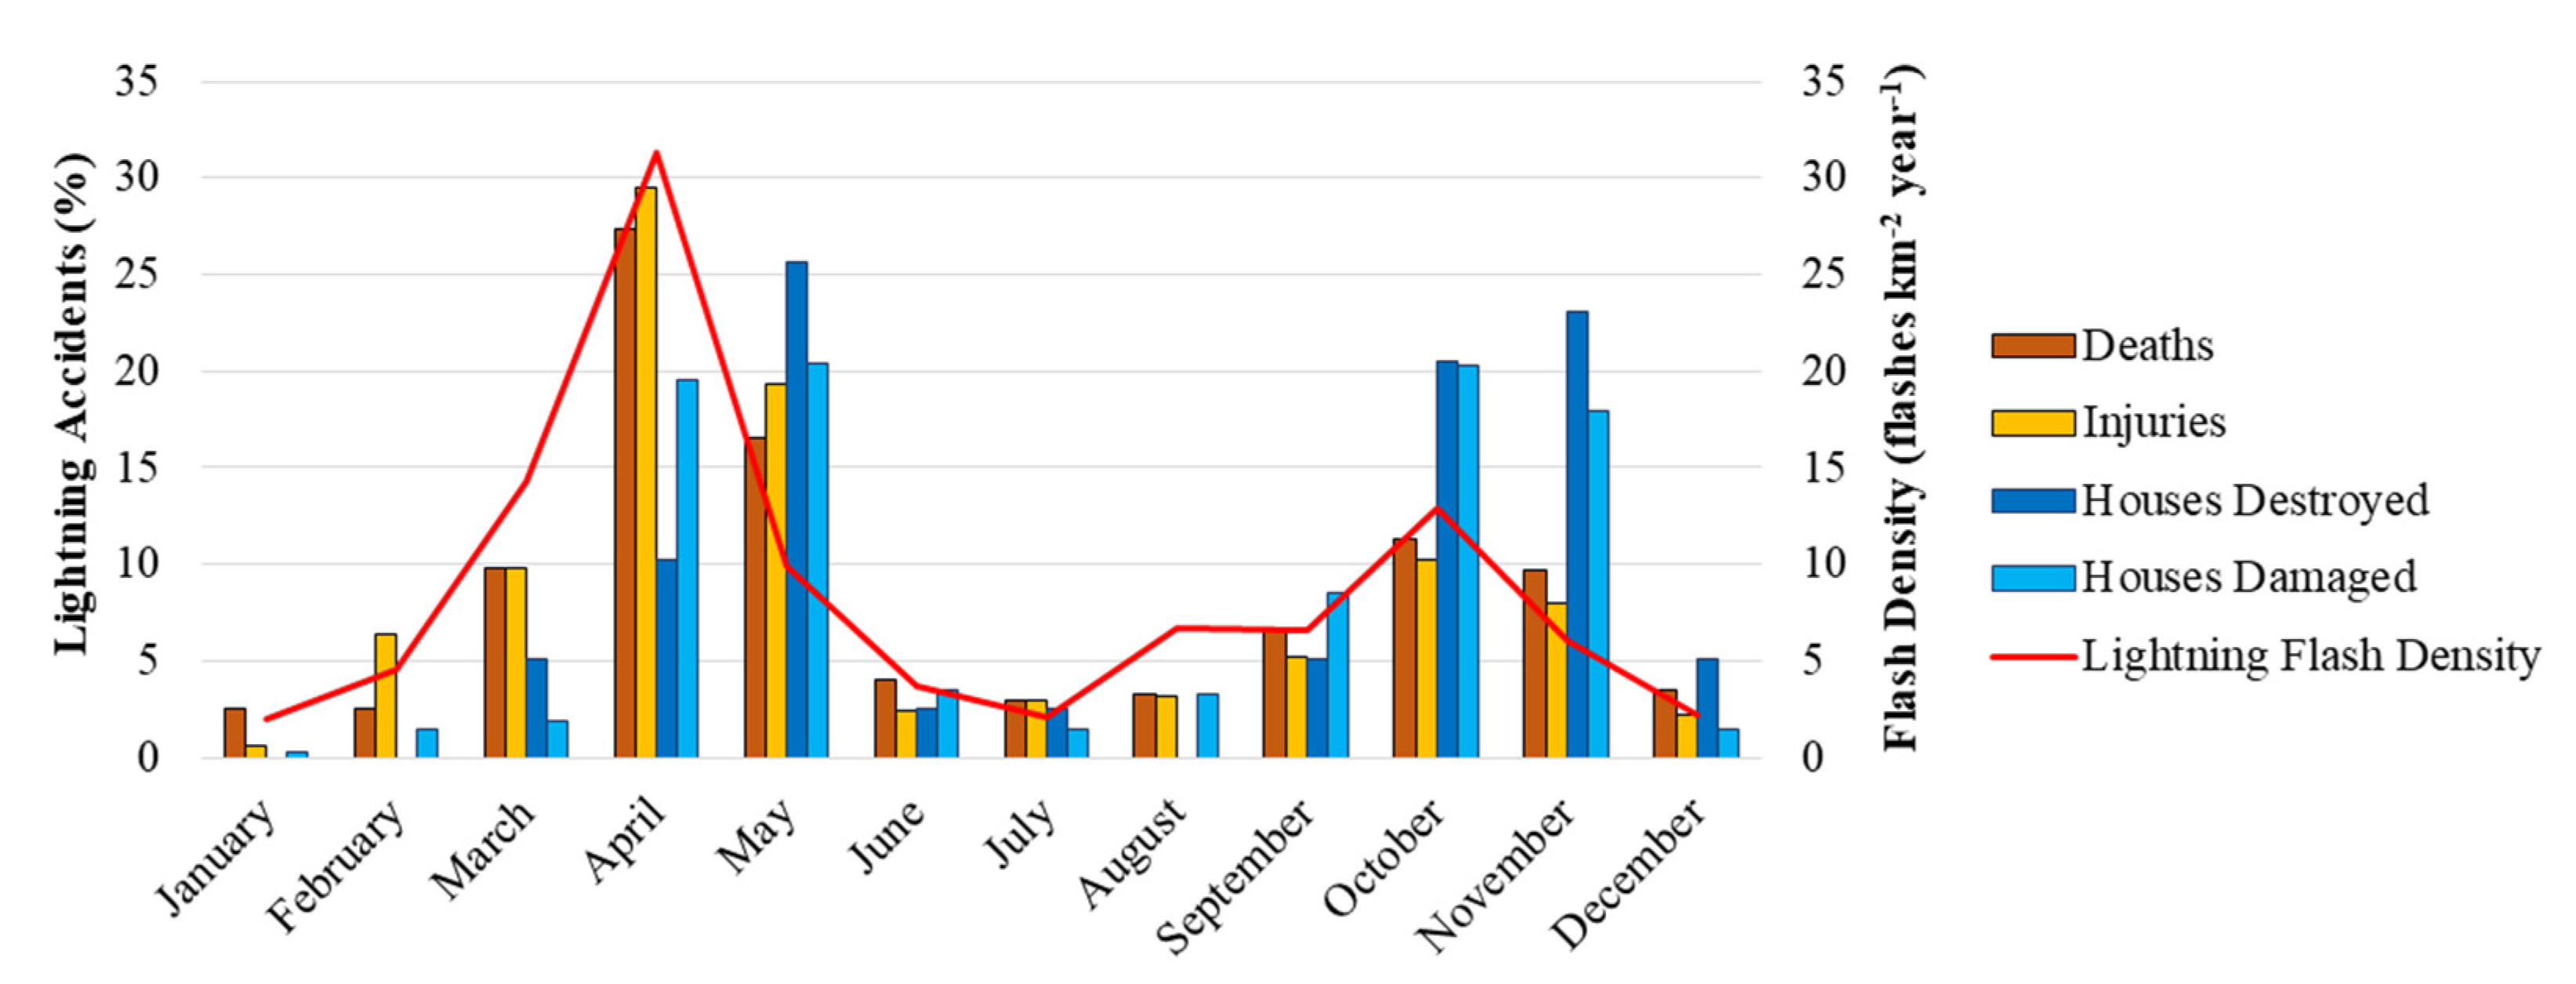
4.2. Monthly Variation of Lightning Accidents
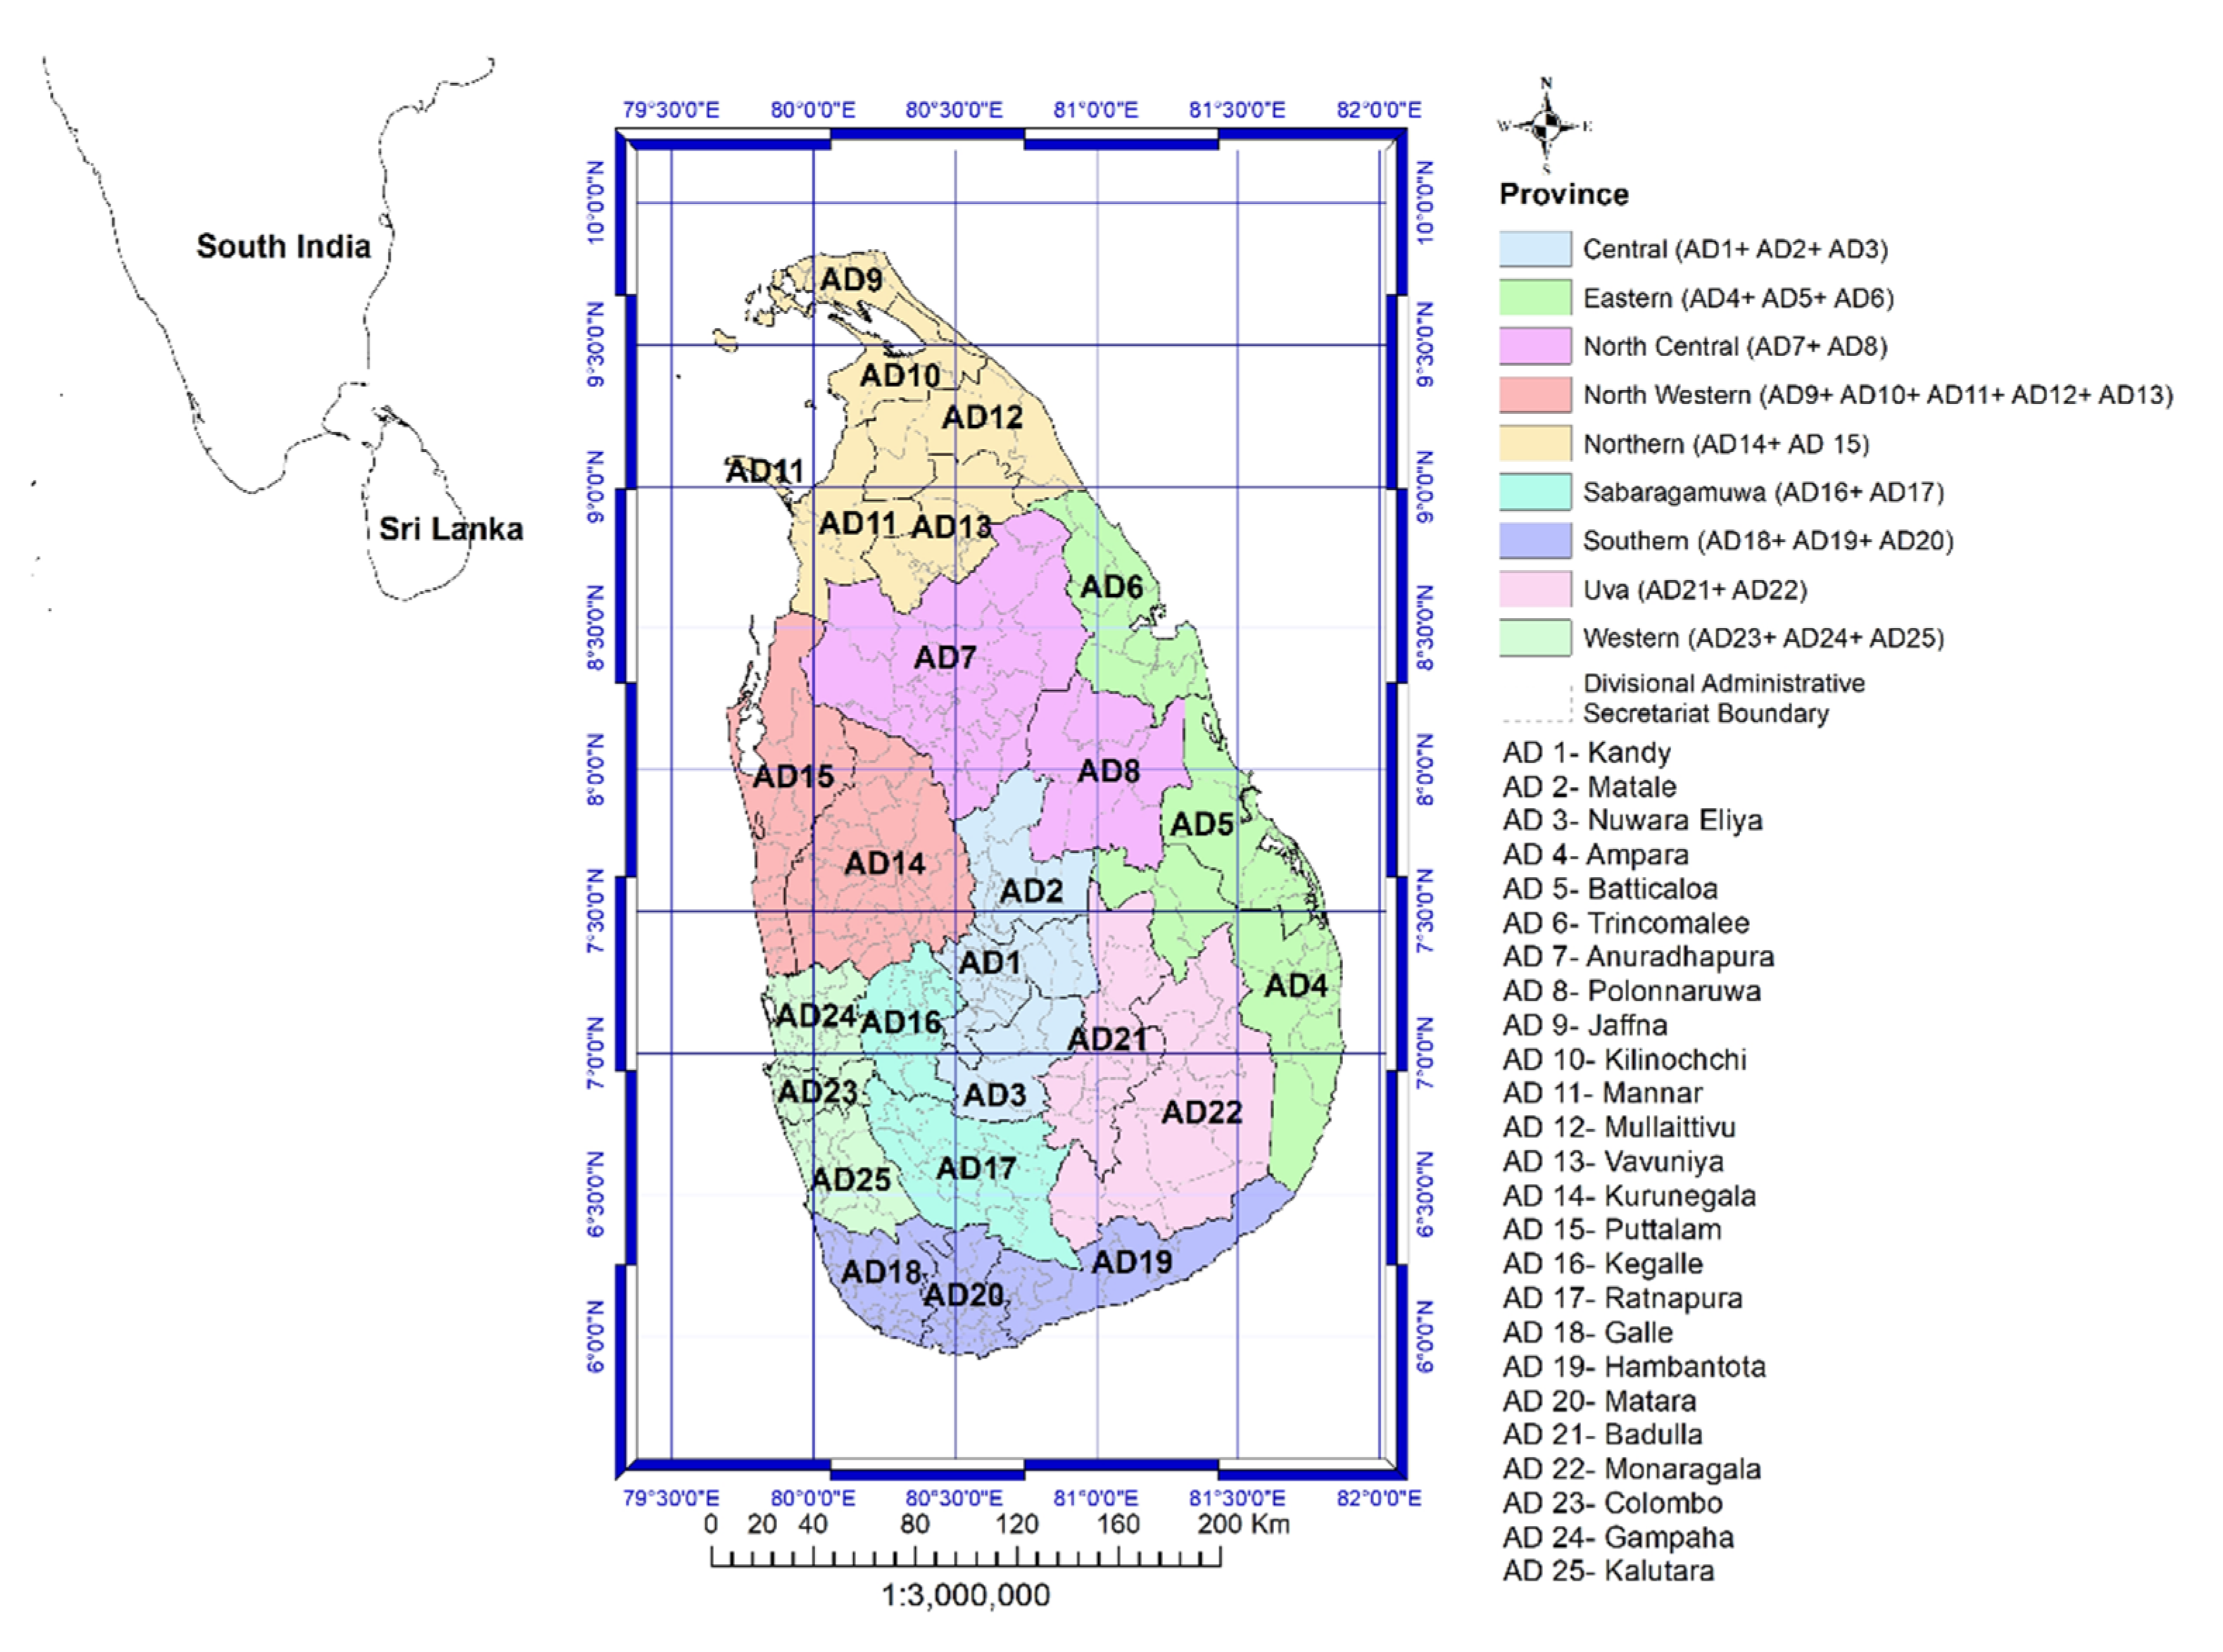
4.3. Geographical Distribution of Lightning Accidents
4.4. Statistical Analysis of the Lightning Accidents
5. Discussion
6. Conclusions
Author Contributions
Funding
Informed Consent Statement
Data Availability Statement
Acknowledgments
Conflicts of Interest
Appendix A
| District Number | District | Number of Deaths | Number of Injuries | ||||||
|---|---|---|---|---|---|---|---|---|---|
| Average | Maximum | Minimum | Standard Deviation | Average | Maximum | Minimum | Standard Deviation | ||
| AD 1 | Kandy | 0.59 | 5 | 0 | 1.27 | 0.83 | 10 | 0 | 2.10 |
| AD 2 | Matale | 0.15 | 3 | 0 | 0.60 | 0.17 | 6 | 0 | 0.93 |
| AD 3 | Nuwara Eliya | 0.20 | 3 | 0 | 0.54 | 0.15 | 3 | 0 | 0.63 |
| AD 4 | Ampara | 0.43 | 4 | 0 | 0.86 | 0.41 | 7 | 0 | 1.33 |
| AD 5 | Batticaloa | 0.37 | 4 | 0 | 1.00 | 0.20 | 4 | 0 | 0.72 |
| AD 6 | Trincomalee | 0.17 | 2 | 0 | 0.49 | 0.11 | 2 | 0 | 0.43 |
| AD 7 | Anuradhapura | 0.67 | 6 | 0 | 1.37 | 0.41 | 6 | 0 | 1.29 |
| AD 8 | Polonnaruwa | 0.87 | 5 | 0 | 1.51 | 1.63 | 62 | 0 | 9.15 |
| AD 9 | Jaffna | 0.30 | 3 | 0 | 0.76 | 0.17 | 4 | 0 | 0.68 |
| AD 10 | Kilinochchi | 0.17 | 2 | 0 | 0.49 | 0.28 | 11 | 0 | 1.64 |
| AD 11 | Mannar | 0.02 | 1 | 0 | 0.15 | 0.07 | 2 | 0 | 0.33 |
| AD 12 | Mullaittivu | 0.11 | 2 | 0 | 0.38 | 0.11 | 2 | 0 | 0.43 |
| AD 13 | Vavuniya | 0.15 | 3 | 0 | 0.56 | 0.09 | 2 | 0 | 0.41 |
| AD 14 | Kurunegala | 0.67 | 8 | 0 | 1.43 | 0.30 | 6 | 0 | 1.03 |
| AD 15 | Puttalam | 0.57 | 5 | 0 | 1.11 | 0.39 | 5 | 0 | 1.02 |
| AD 16 | Kegalle | 0.85 | 8 | 0 | 1.40 | 1.11 | 17 | 0 | 2.95 |
| AD 17 | Ratnapura | 1.02 | 6 | 0 | 1.63 | 0.78 | 7 | 0 | 1.80 |
| AD 18 | Galle | 0.59 | 4 | 0 | 1.05 | 0.78 | 17 | 0 | 2.76 |
| AD 19 | Hambantota | 0.35 | 3 | 0 | 0.77 | 0.17 | 3 | 0 | 0.57 |
| AD 20 | Matara | 0.37 | 7 | 0 | 1.16 | 0.41 | 12 | 0 | 1.89 |
| AD 21 | Badulla | 0.54 | 6 | 0 | 1.17 | 0.57 | 13 | 0 | 2.07 |
| AD 22 | Moneragala | 0.76 | 9 | 0 | 1.61 | 0.43 | 7 | 0 | 1.42 |
| AD 23 | Colombo | 0.39 | 4 | 0 | 0.77 | 0.13 | 4 | 0 | 0.62 |
| AD 24 | Gampaha | 0.67 | 4 | 0 | 1.03 | 0.43 | 10 | 0 | 1.63 |
| AD 25 | Kalutara | 0.93 | 6 | 0 | 1.34 | 0.67 | 8 | 0 | 1.69 |
| District Number | District | Number of Deaths | Number of Injuries | ||||||
|---|---|---|---|---|---|---|---|---|---|
| Average | Maximum | Minimum | Standard Deviation | Average | Maximum | Minimum | Standard Deviation | ||
| AD 1 | Kandy | 0.00 | 0 | 0 | 0.00 | 1.00 | 15 | 0 | 3.14 |
| AD 2 | Matale | 0.00 | 0 | 0 | 0.00 | 0.07 | 1 | 0 | 0.25 |
| AD 3 | Nuwara Eliya | 0.15 | 4 | 0 | 0.67 | 0.22 | 9 | 0 | 1.33 |
| AD 4 | Ampara | 0.00 | 0 | 0 | 0.00 | 0.13 | 1 | 0 | 0.34 |
| AD 5 | Batticaloa | 0.04 | 1 | 0 | 0.21 | 0.30 | 6 | 0 | 1.17 |
| AD 6 | Trincomalee | 0.00 | 0 | 0 | 0.00 | 0.13 | 6 | 0 | 0.88 |
| AD 7 | Anuradhapura | 0.00 | 0 | 0 | 0.00 | 0.35 | 11 | 0 | 1.72 |
| AD 8 | Polonnaruwa | 0.00 | 0 | 0 | 0.00 | 0.07 | 2 | 0 | 0.33 |
| AD 9 | Jaffna | 0.00 | 0 | 0 | 0.00 | 0.11 | 2 | 0 | 0.43 |
| AD 10 | Kilinochchi | 0.02 | 1 | 0 | 0.15 | 0.09 | 4 | 0 | 0.59 |
| AD 11 | Mannar | 0.02 | 1 | 0 | 0.15 | 0.09 | 2 | 0 | 0.35 |
| AD 12 | Mullaittivu | 0.00 | 0 | 0 | 0.00 | 0.09 | 4 | 0 | 0.59 |
| AD 13 | Vavuniya | 0.00 | 0 | 0 | 0.00 | 0.22 | 2 | 0 | 0.59 |
| AD 14 | Kurunegala | 0.15 | 5 | 0 | 0.76 | 0.91 | 23 | 0 | 3.49 |
| AD 15 | Puttalam | 0.02 | 1 | 0 | 0.15 | 0.80 | 16 | 0 | 3.11 |
| AD 16 | Kegalle | 0.09 | 1 | 0 | 0.28 | 6.09 | 110 | 0 | 20.98 |
| AD 17 | Ratnapura | 0.02 | 1 | 0 | 0.15 | 0.78 | 11 | 0 | 2.33 |
| AD 18 | Galle | 0.00 | 0 | 0 | 0.00 | 0.61 | 13 | 0 | 2.26 |
| AD 19 | Hambantota | 0.04 | 1 | 0 | 0.21 | 0.59 | 14 | 0 | 2.21 |
| AD 20 | Matara | 0.00 | 0 | 0 | 0.00 | 0.30 | 5 | 0 | 0.84 |
| AD 21 | Badulla | 0.04 | 1 | 0 | 0.21 | 0.80 | 29 | 0 | 4.32 |
| AD 22 | Moneragala | 0.00 | 0 | 0 | 0.00 | 0.48 | 11 | 0 | 1.92 |
| AD 23 | Colombo | 0.09 | 3 | 0 | 0.46 | 0.15 | 3 | 0 | 0.56 |
| AD 24 | Gampaha | 0.02 | 1 | 0 | 0.15 | 0.72 | 15 | 0 | 2.52 |
| AD 25 | Kalutara | 0.13 | 2 | 0 | 0.40 | 1.02 | 21 | 0 | 3.80 |
| Annual Lightning Flash Density (flashes km−2 year−1) | |||
|---|---|---|---|
| Average | Maximum | Minimum | Standard Deviation |
| 8.26 | 28.05 | 0.84 | 3.88 |
| Month | (flashes km−2 year−1) | |||
|---|---|---|---|---|
| Average | Maximum | Minimum | Standard Deviation | |
| January | 2.00 | 22.78 | 0.00 | 3.84 |
| February | 4.61 | 65.88 | 0.00 | 7.62 |
| March | 14.35 | 85.67 | 0.00 | 12.23 |
| April | 31.33 | 146.76 | 0.02 | 23.31 |
| May | 9.93 | 58.20 | 0.00 | 6.76 |
| June | 3.74 | 57.27 | 0.00 | 5.29 |
| July | 2.08 | 25.16 | 0.00 | 2.60 |
| August | 6.66 | 59.61 | 0.00 | 7.37 |
| September | 6.55 | 49.55 | 0.00 | 5.78 |
| October | 12.87 | 59.77 | 0.00 | 8.60 |
| November | 6.09 | 45.64 | 0.00 | 6.47 |
| December | 2.20 | 20.44 | 0.00 | 2.75 |
| Climate Season | (flashes km−2 year−1) | |||
|---|---|---|---|---|
| Average | Maximum | Minimum | Standard Deviation | |
| FIM | 22.25 | 85.88 | 0.79 | 15.09 |
| SWM | 5.67 | 23.66 | 0.16 | 3.51 |
| SIM | 9.29 | 35.65 | 0.40 | 5.32 |
| NEM | 2.99 | 31.99 | 0.26 | 3.91 |
| District Number | District | (flashes km−2 year−1) | |||
|---|---|---|---|---|---|
| Average | Maximum | Minimum | Standard Deviation | ||
| AD 1 | Kandy | 7.29 | 16.61 | 3.18 | 1.95 |
| AD 2 | Matale | 8.38 | 10.47 | 6.45 | 0.74 |
| AD 3 | Nuwara Eliya | 6.18 | 14.06 | 2.10 | 2.01 |
| AD 4 | Ampara | 6.40 | 14.74 | 1.06 | 3.50 |
| AD 5 | Batticaloa | 5.54 | 10.93 | 1.12 | 1.92 |
| AD 6 | Trincomalee | 5.98 | 8.07 | 3.58 | 0.80 |
| AD 7 | Anuradhapura | 8.00 | 11.73 | 5.12 | 1.08 |
| AD 8 | Polonnaruwa | 8.81 | 13.93 | 5.48 | 1.06 |
| AD 9 | Jaffna | 1.87 | 3.01 | 0.84 | 0.45 |
| AD 10 | Kilinochchi | 3.46 | 6.54 | 1.87 | 1.03 |
| AD 11 | Mannar | 5.93 | 9.83 | 1.51 | 1.78 |
| AD 12 | Mullaittivu | 6.67 | 11.98 | 1.98 | 2.16 |
| AD 13 | Vavuniya | 8.88 | 11.47 | 6.09 | 0.82 |
| AD 14 | Kurunegala | 11.94 | 20.32 | 5.24 | 2.99 |
| AD 15 | Puttalam | 5.73 | 10.95 | 2.51 | 1.42 |
| AD 16 | Kegalle | 17.27 | 27.19 | 7.53 | 3.39 |
| AD 17 | Ratnapura | 10.22 | 21.22 | 3.03 | 3.70 |
| AD 18 | Galle | 10.82 | 16.58 | 4.73 | 1.83 |
| AD 19 | Hambantota | 3.61 | 7.68 | 1.53 | 1.23 |
| AD 20 | Matara | 5.27 | 11.28 | 1.77 | 1.80 |
| AD 21 | Badulla | 8.45 | 14.84 | 3.36 | 1.63 |
| AD 22 | Moneragala | 8.21 | 16.25 | 1.94 | 2.62 |
| AD 23 | Colombo | 15.50 | 28.05 | 9.11 | 3.82 |
| AD 24 | Gampaha | 16.74 | 27.94 | 5.72 | 3.21 |
| AD 25 | Kalutara | 14.84 | 19.96 | 9.38 | 2.31 |
References
- Mistovich, J.J.; Krost, W.S.; Limmer, D.D. Beyond the basics: Lightning-strike injuries. EMS Mag. 2008, 37, 82–87. [Google Scholar] [PubMed]
- Aslar, A.K.; Soran, A.; Yildiz, Y.; Isik, Y. Epidemiology, morbidity, mortality and treatment of lightning injuries in a Turkish burns units. Int. J. Clin. Pract 2001, 55, 502–504. [Google Scholar] [PubMed]
- Islam, S.; Schmidlin, T.W. Lightning hazard safety measures and awareness. Nat. Hazards 2020. [Google Scholar] [CrossRef]
- Mary, A.K.; Gomes, C. Lightning safety of under-privileged communities around Lake Victoria. Geomat. Nat. Hazards Risk 2015, 6, 669–685. [Google Scholar] [CrossRef]
- TRMM Lightning Imaging Sensor (LIS) Data Sets NASA. Available online: https://lightning.nsstc.nasa.gov/data/data_lis.html (accessed on 5 June 2018).
- Maduranga, U.G.D.; Edirisinghe, C.M.; Gamage, L.V. Annual Variation Trend of Lightning Flash Activities over Sri Lanka. World Sci. News 2018, 114, 256–264. [Google Scholar]
- Maduranga, U.G.D.; Edirisinghe, C.M.; Gamage, L.V. Spatiotemporal Variability of Lightning Flash Distribution over Sri Lanka. Int. Lett. Chem. Phys. Astron. 2019, 82, 1–13. [Google Scholar] [CrossRef]
- Holton, J.R.; Curry, J.A.; Pyle, J.A. Encyclopedia of Atmospheric Sciences; Academic Press: Cambridge, MA, USA, 2003; ISBN 9780122270901. [Google Scholar]
- Huffines, G.R.; Orville, R.E. Lightning Ground Flash Density and Thunderstorm Duration in the Continental United States: 1989–96. J. Appl. Meteorol. 1999, 38, 1013–1019. [Google Scholar] [CrossRef]
- Jeyanthiran, V.; Edirisinghe, C.M.; Fernando, M.; Cooray, V. Study of Lightning Activity over Sri Lanka. In Proceedings of the 29th International Conference on Lightning Protection, Uppsala, Sweden, 23–26 June 2008. [Google Scholar]
- Jayawardena, W.; Fernando, M.; Sonnadara, D.U.J. Satellite Observation of Lightning Activities Over Sri Lanka. Sri Lankan J. Phys. Inst. Phys. 2014, 30, 61–66. [Google Scholar]
- Sonnadara, U.; Jayawardena, W.; Fernando, M. Climatology of lightning flash activities over Sri Lanka. Theor. Appl. Climatol. 2019, 113, 3173–3182. [Google Scholar] [CrossRef]
- Kumar, P.; Manish, Y.; Sunita, S.; Kumar, H. The major lightning regions and associated casualties over India. Nat. Hazards 2020. [Google Scholar] [CrossRef]
- Jayaratne, K.P.S.C.; Gomes, C. Public perceptions and lightning safety education in Sri Lanka Public Perceptions and Lightning Safety Education in Sri Lanka. In Proceedings of the 2012 International Conference on Lightning Protection (ICLP), Vienna, Austria, 2–7 September 2012. [Google Scholar] [CrossRef]
- Disaster Management Centre, Asia Pacific Alliance for Disaster Management Sri Lanka. Impact of Disasters in Sri Lanka in 2016; The Consortium of Humanitarian Agencies (CHA): Colombo, Sri Lanka, 2016; ISBN 9789951041540. [Google Scholar]
- Disaster Information Management system in Sri Lanka. Available online: http://www.desinventar.lk:8081/DesInventar/main.jsp (accessed on 23 January 2020).
- Undrr, L.R. ”DesInventar—Profile”, Desinventar.net. Available online: https://www.desinventar.net/DesInv,entar/profiletab.jsp?countrycode=lka (accessed on 23 January 2020).
- United Nations Population Fund (UNFPA). Census of Population and Housing 2012 Key Findings; Department of Census and Statistics Sri Lanka: Battaramulla, Sri Lanka, 2014; ISBN 9789555779067. [Google Scholar]
- Pédeboy, S. Introduction to the IEC 62858: Lightning density based on Lightning Locating Systems. In Proceedings of the ILPS 2018—International Lightning Protection Symposium, Shenzhen, China, 24–27 October 2018. [Google Scholar]
- International Standard IEC 62305-2 Edition 2, Protection against Lightning—Part 2: Risk Management; International Electrotechnical Commission: London, UK, 2010; ISBN 978-2-88912-281-3.
- Schmitt, S.; Rousseau, A. Thunderstorm Warning Systems: IEC 62793 Standard. In Proceedings of the 33rd International Conference on Lightning Protection (ICLP), Estoril, Portugal, 25–30 September 2016. [Google Scholar]

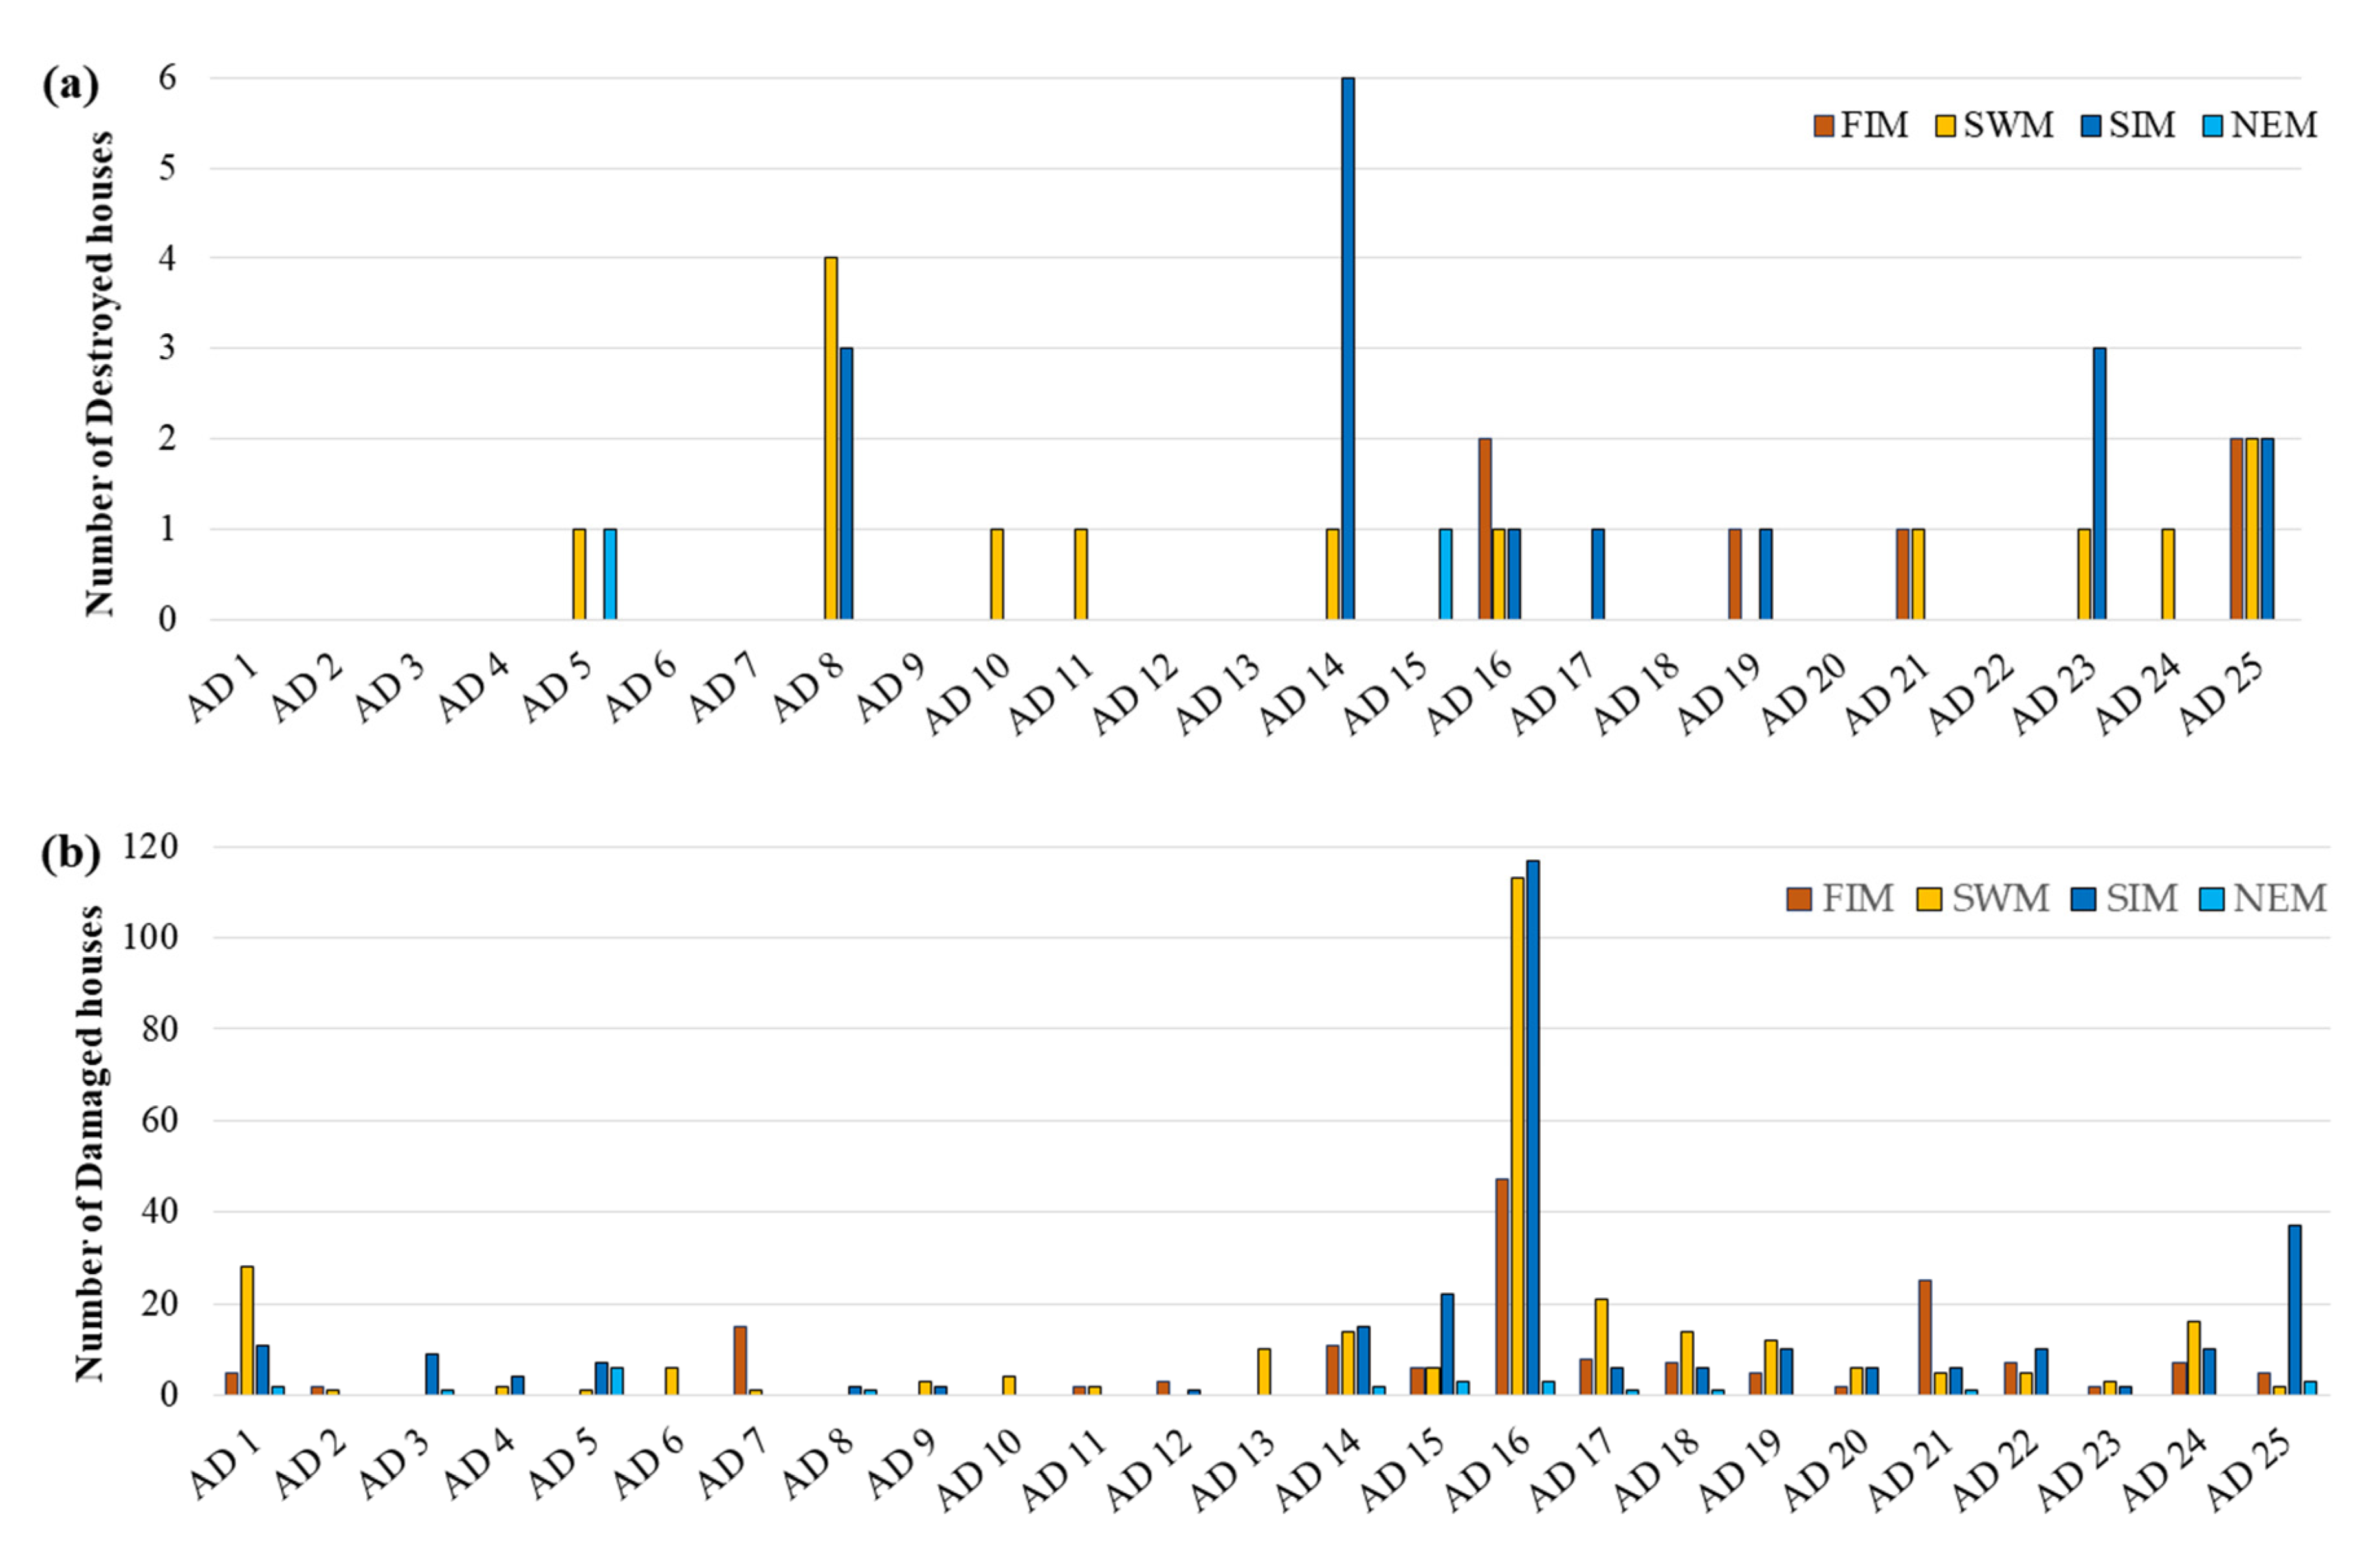


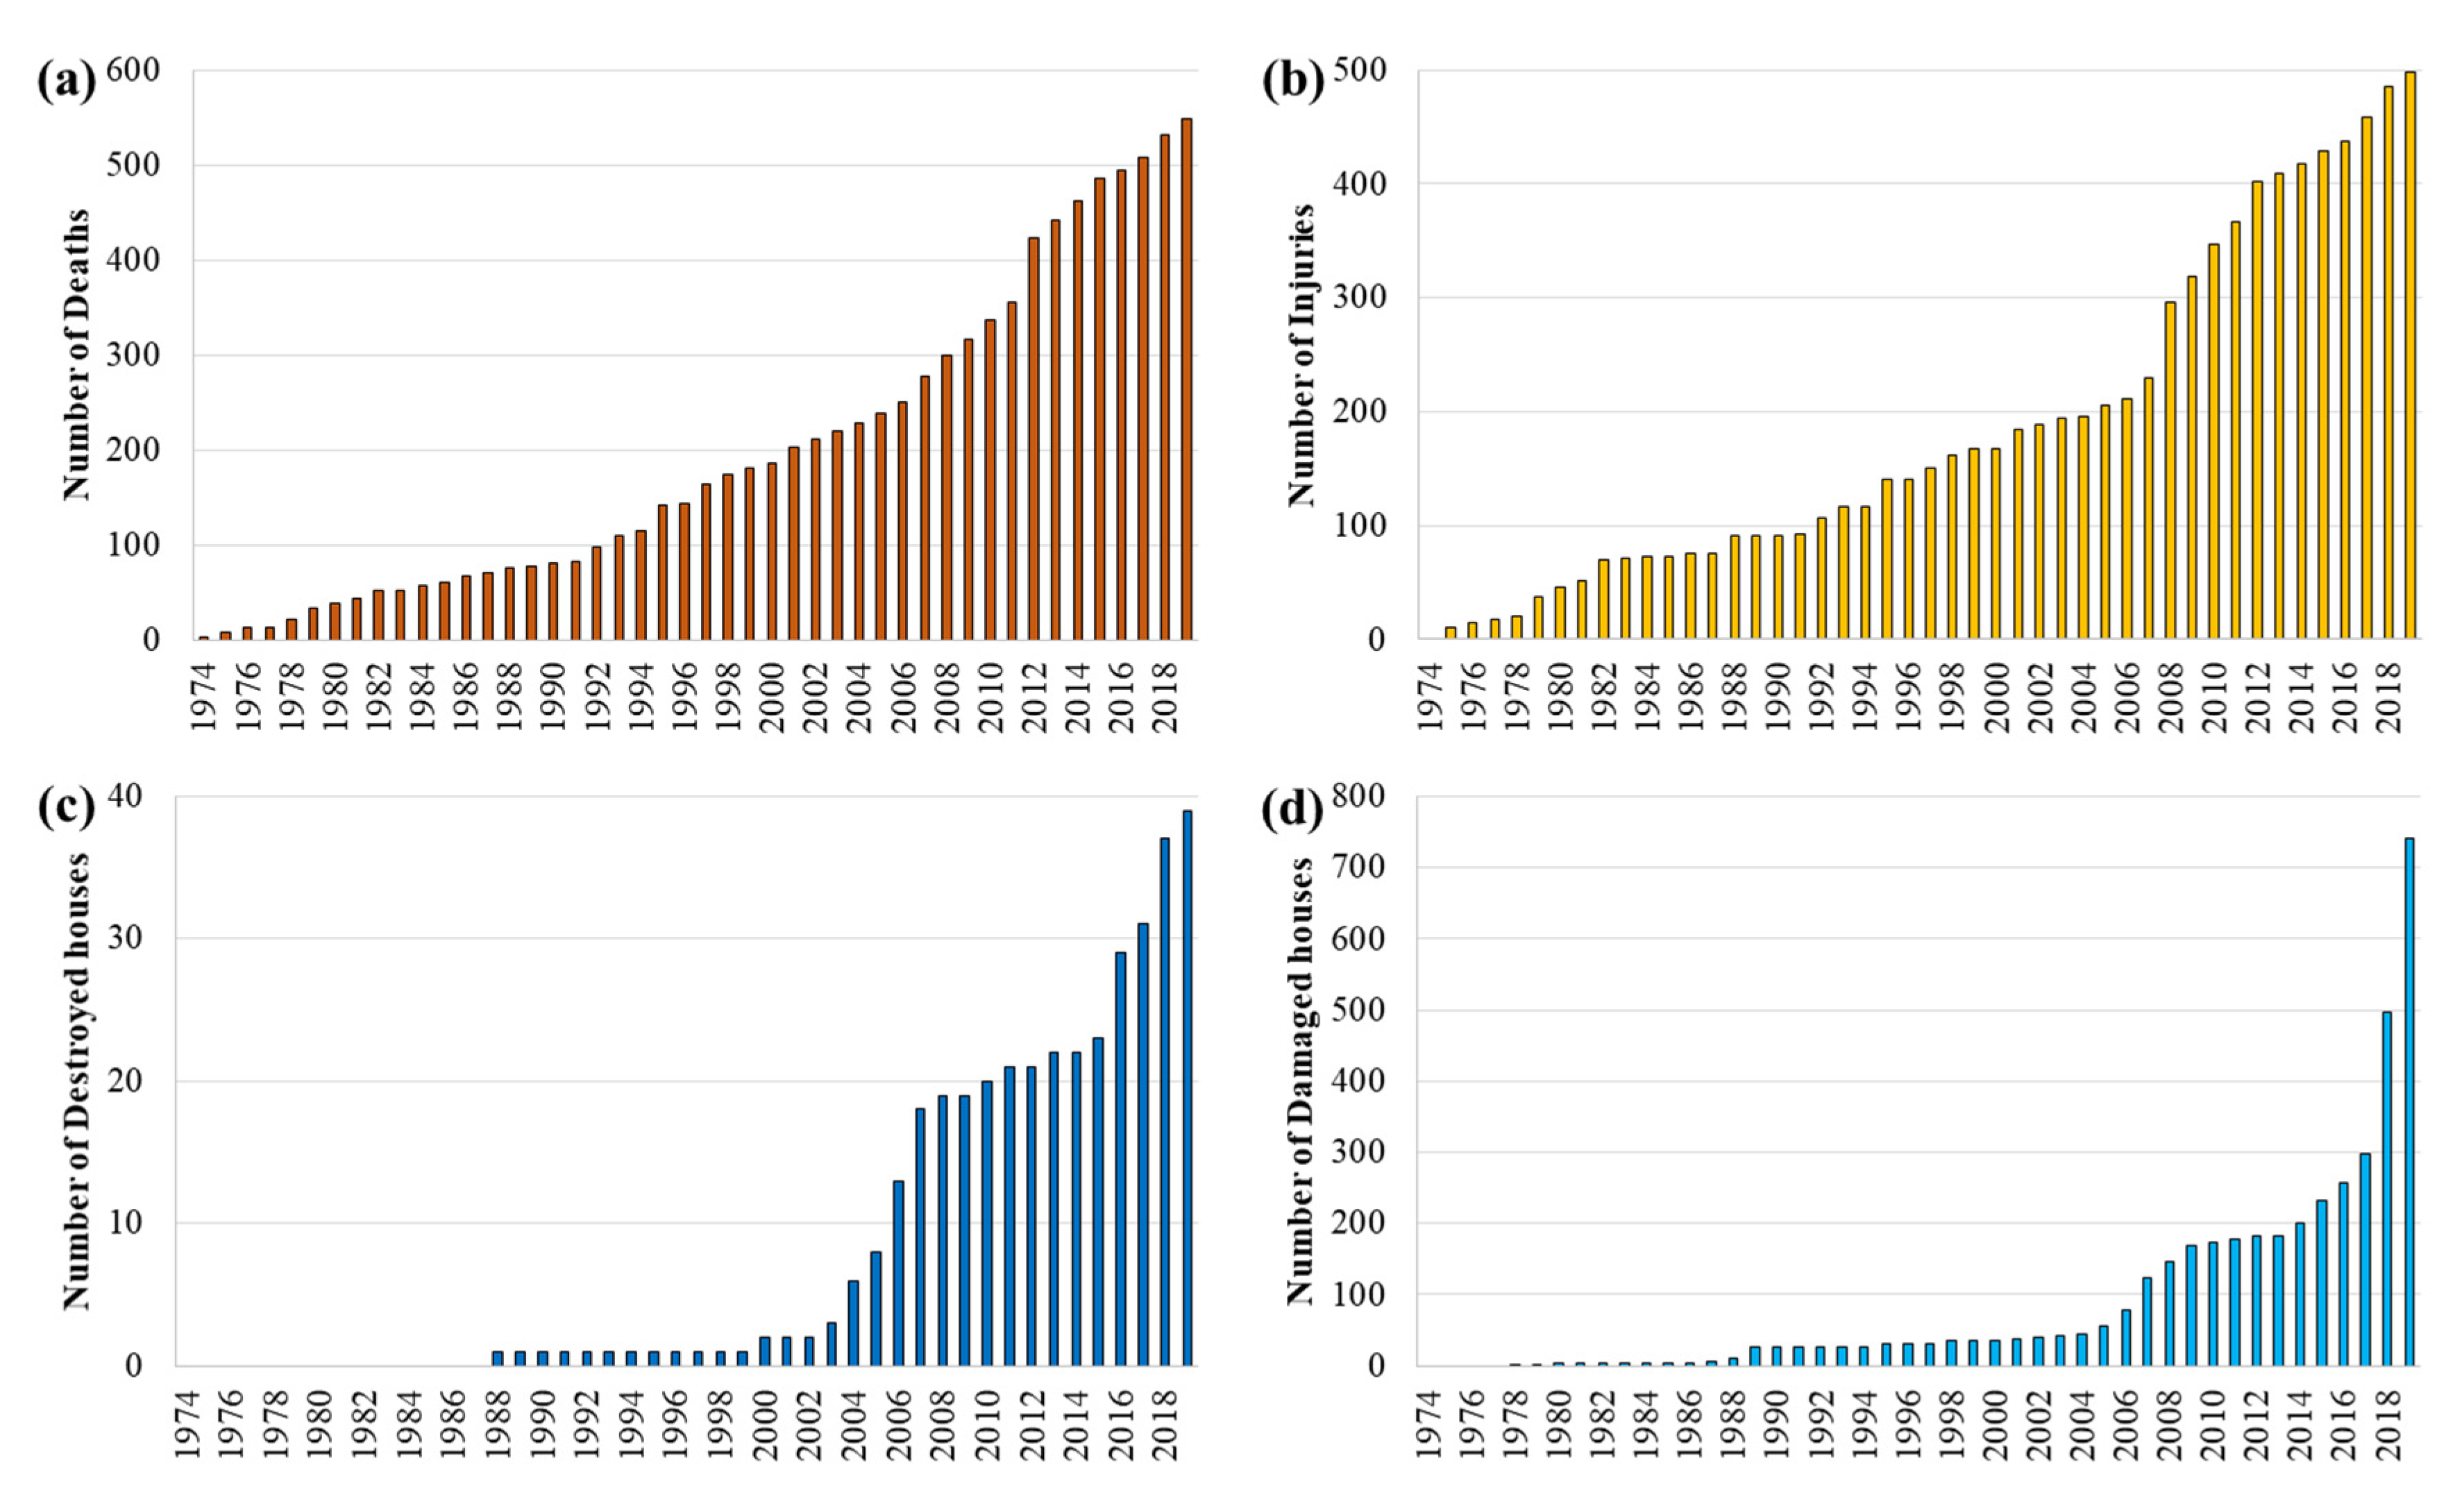
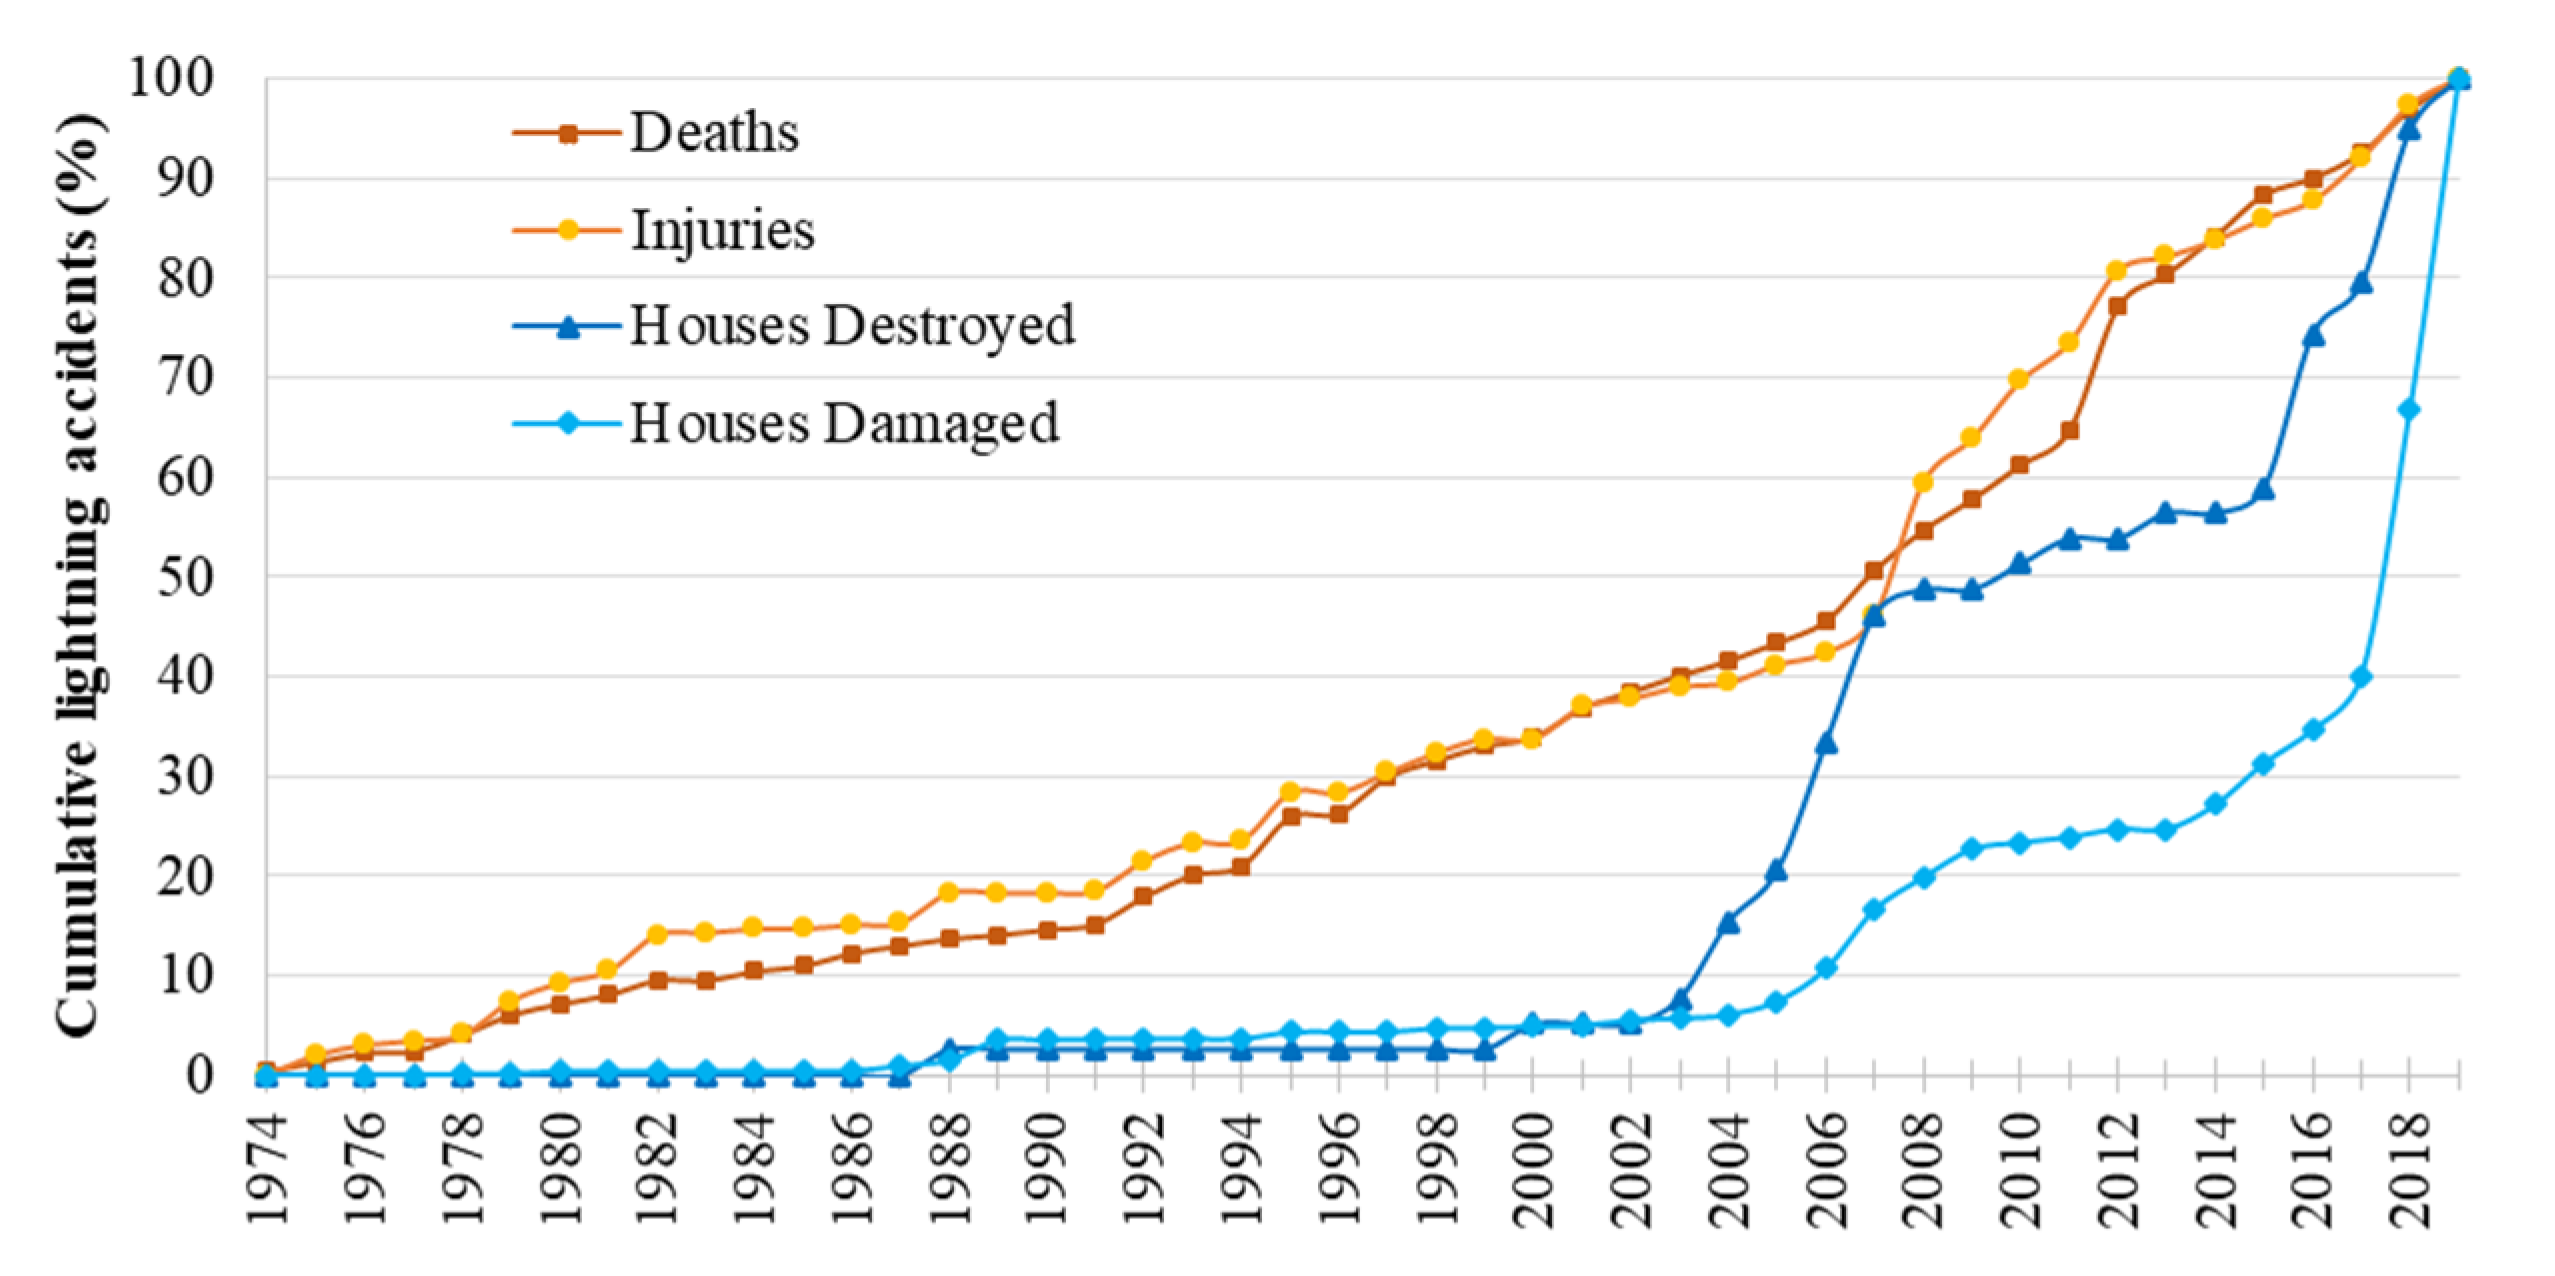
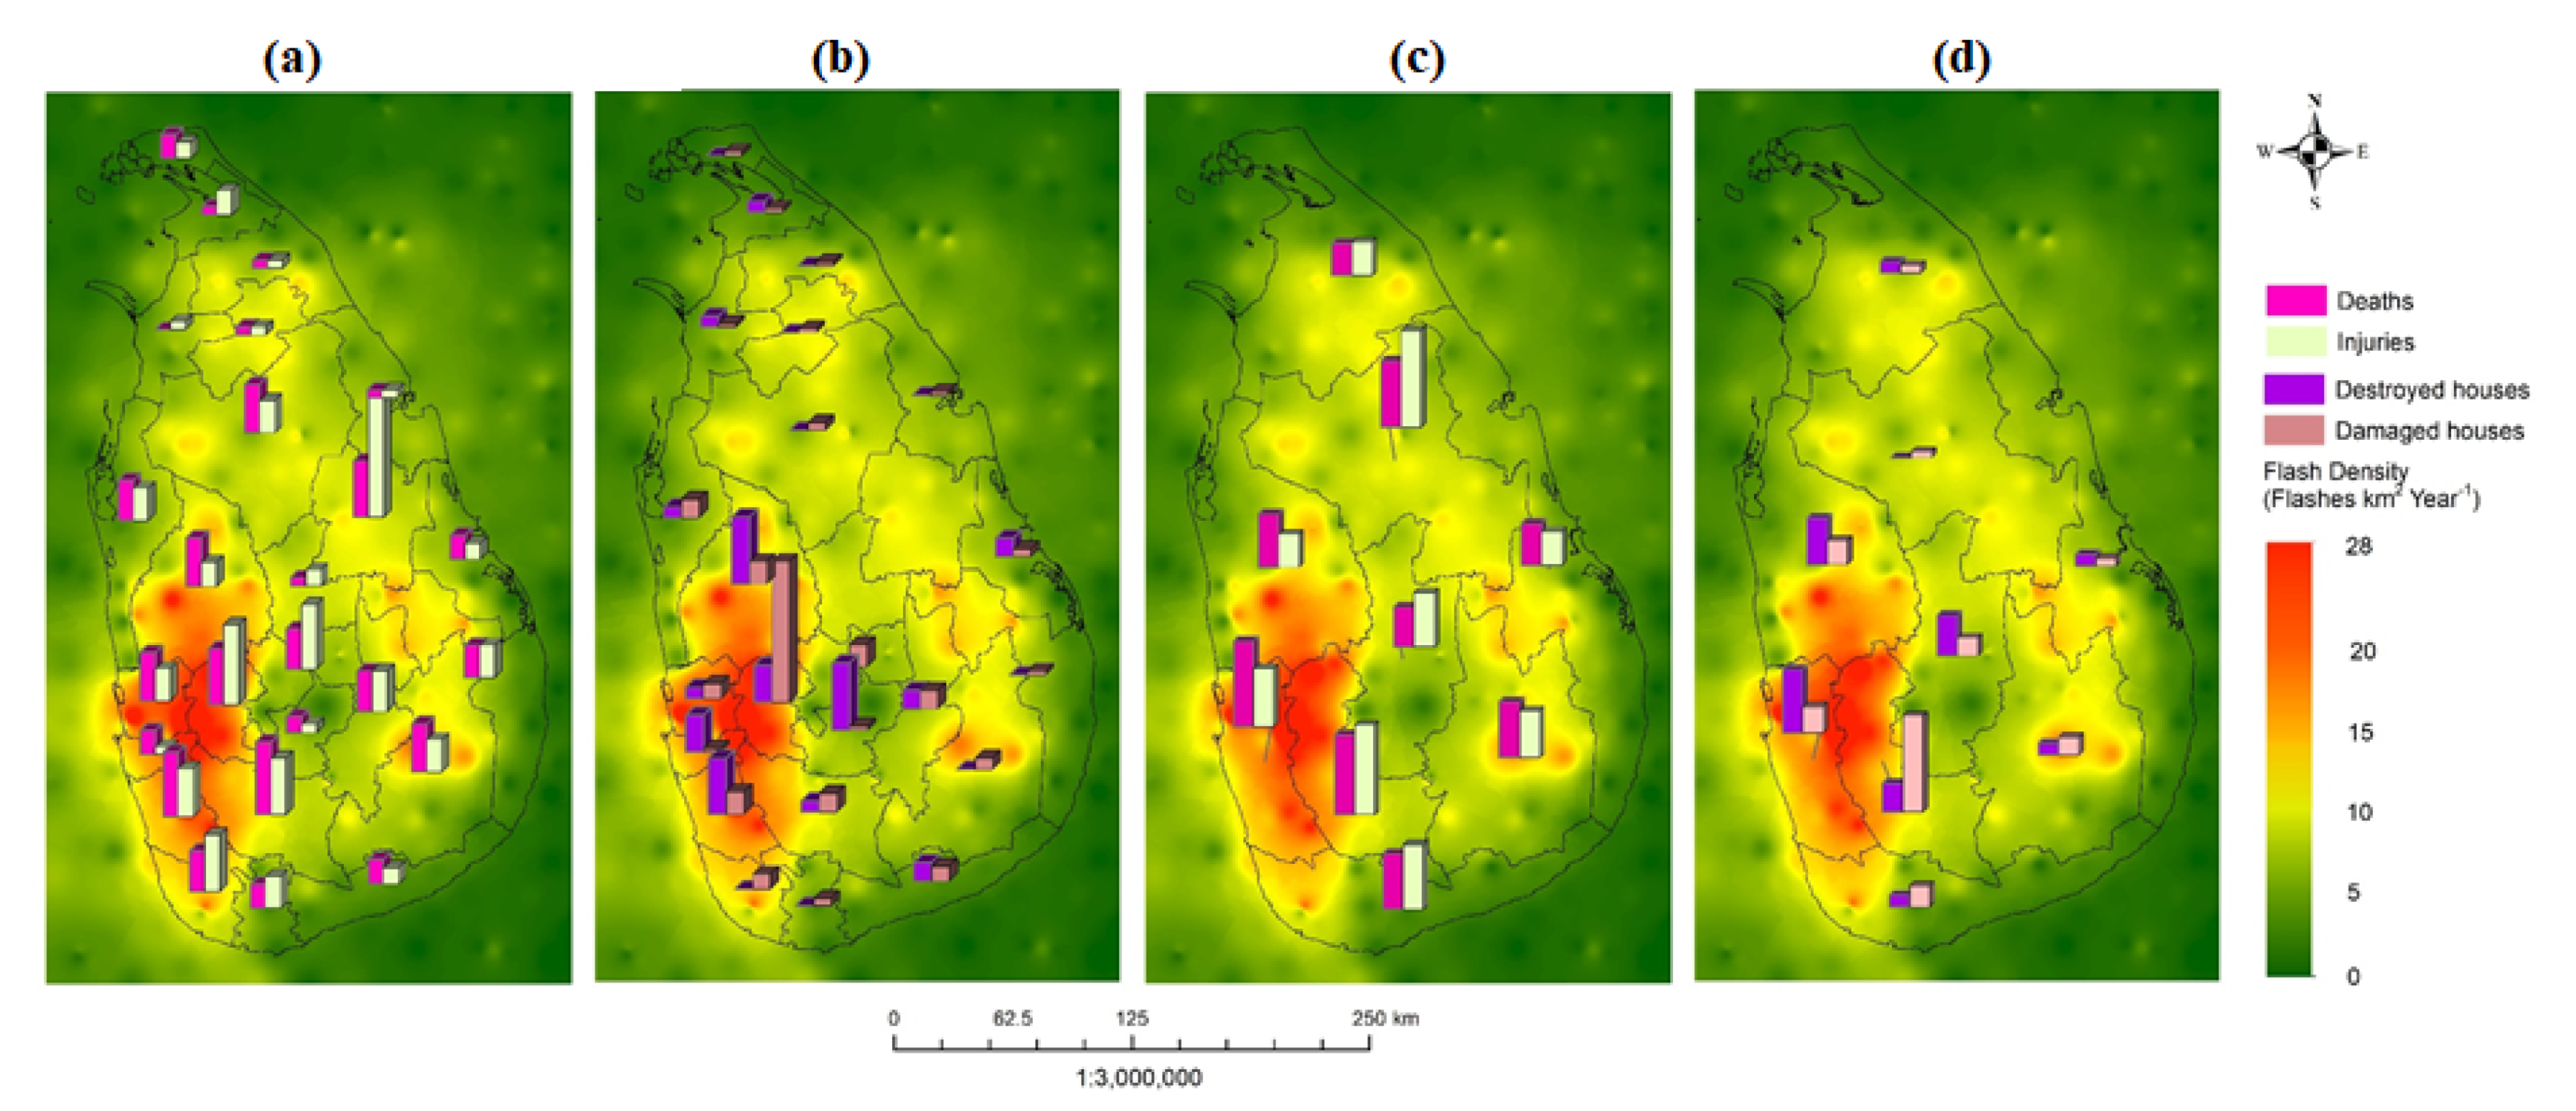
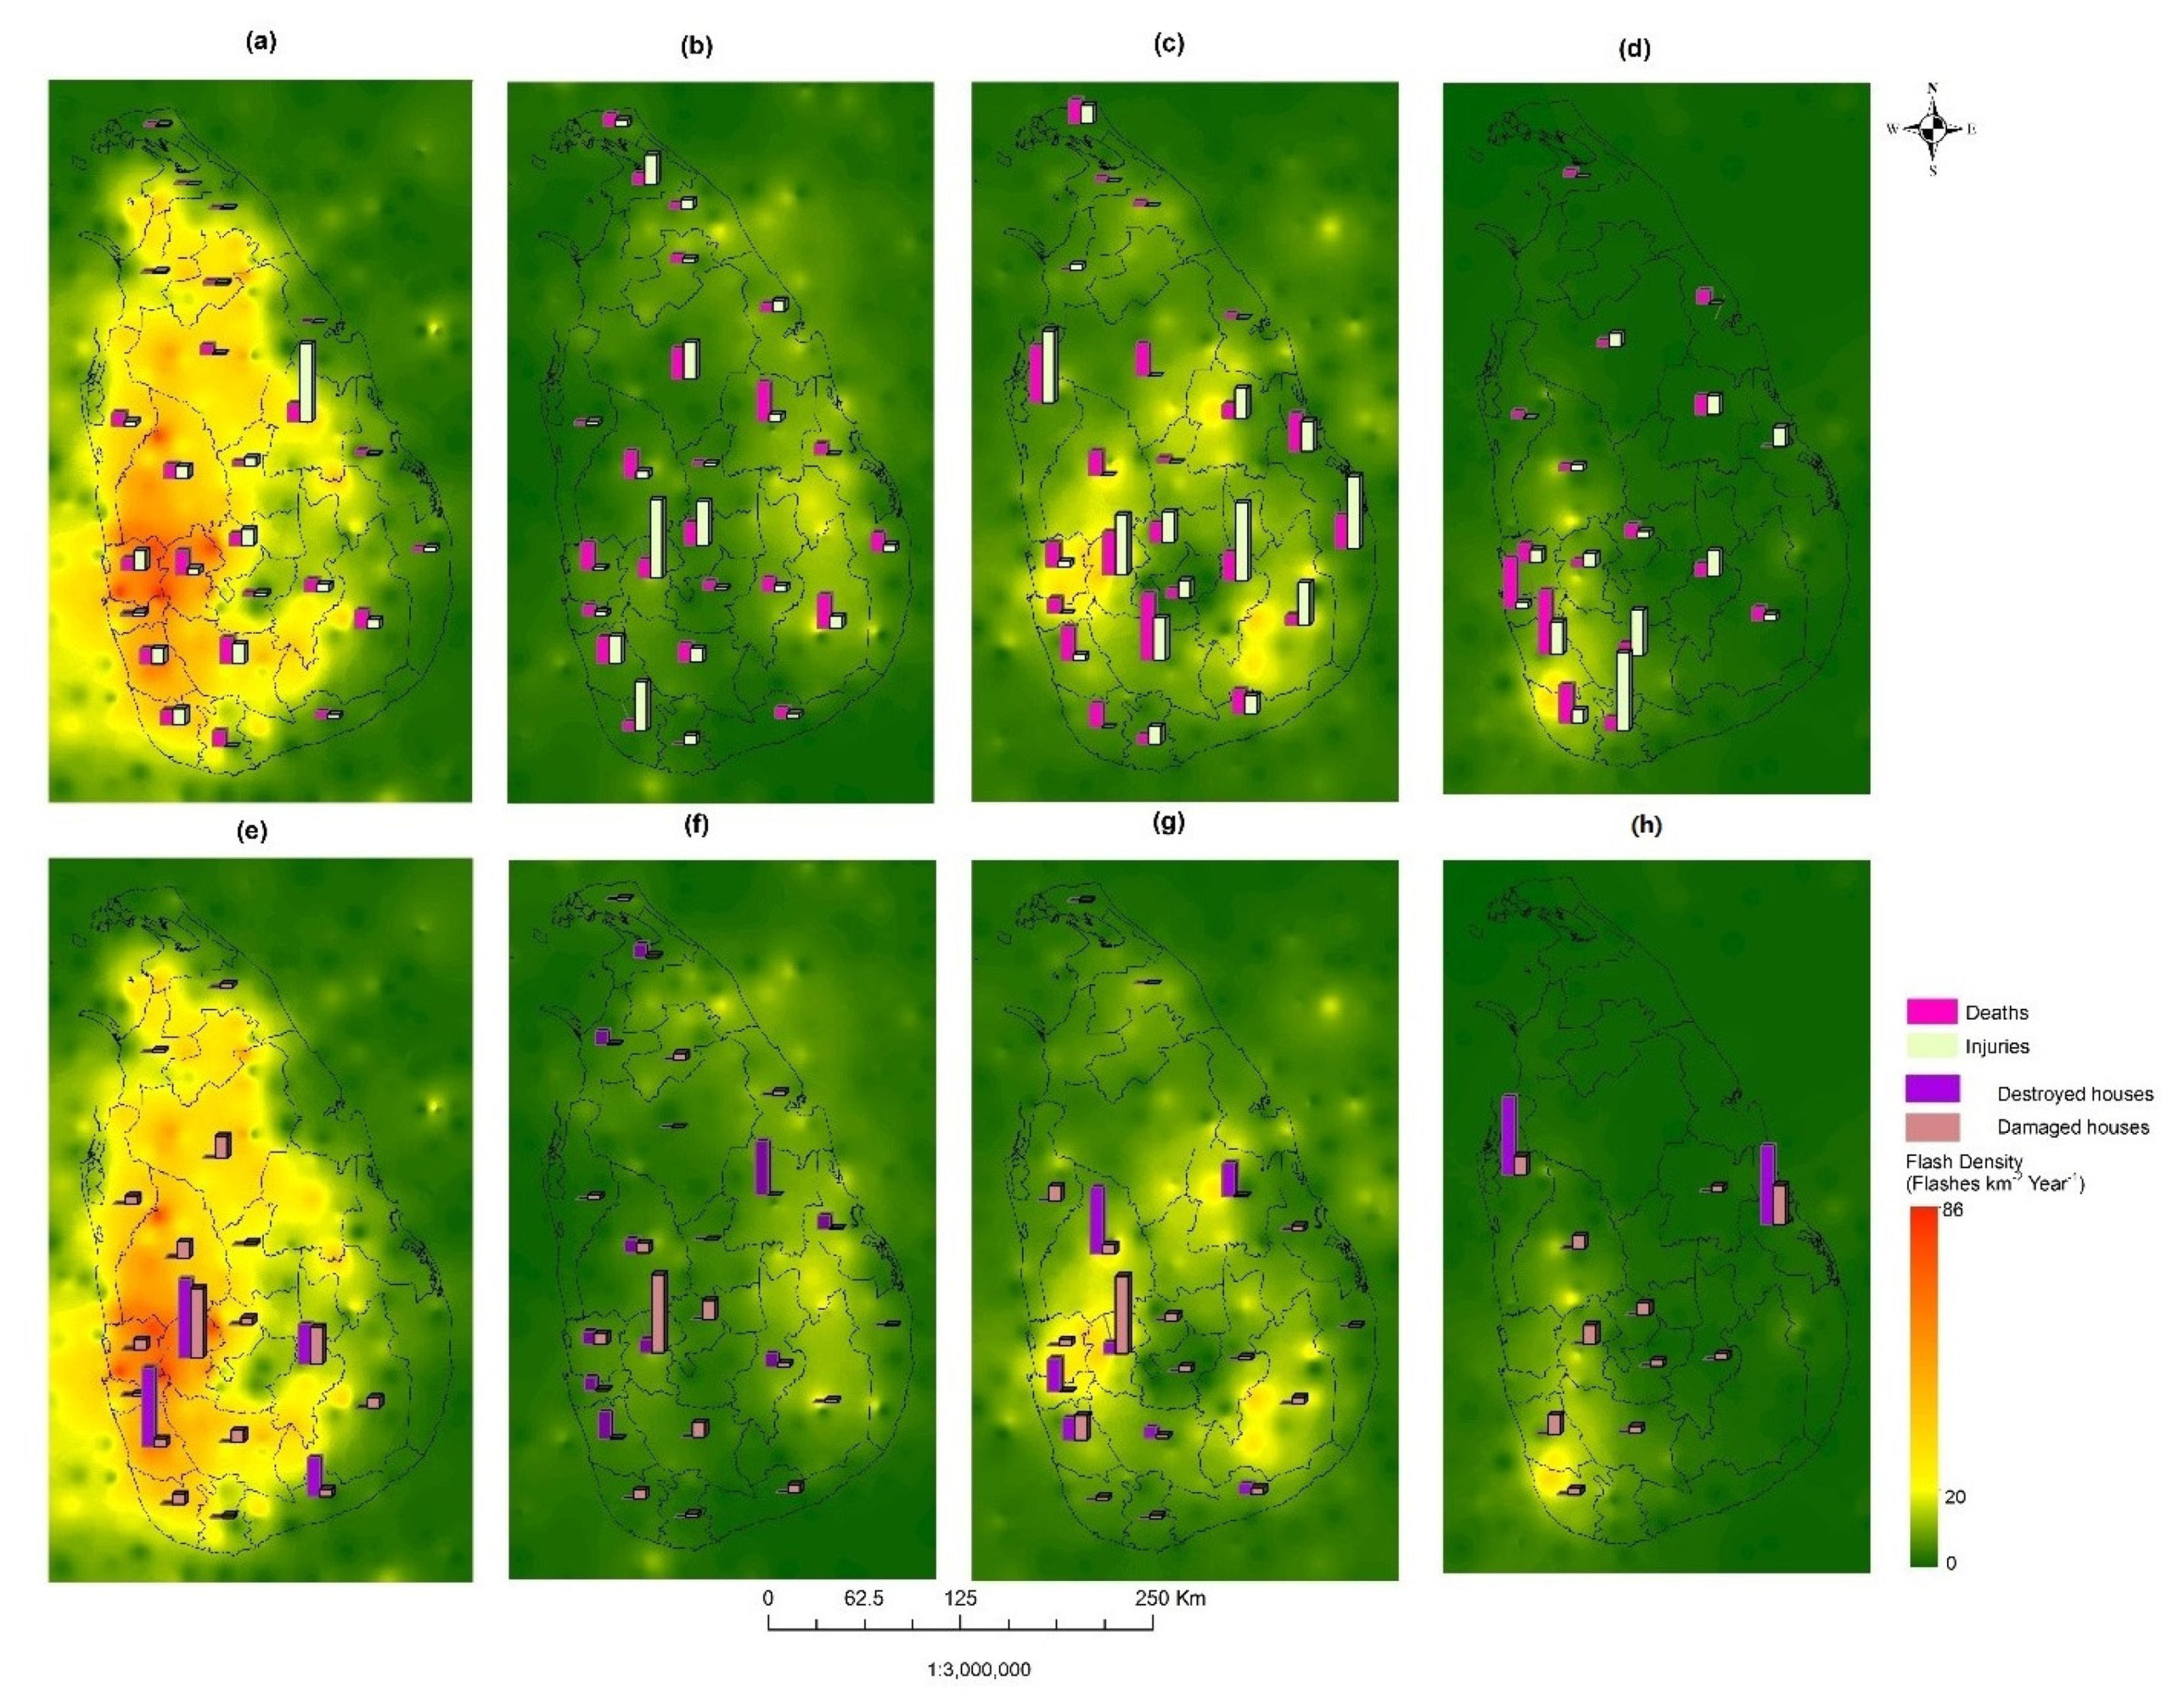

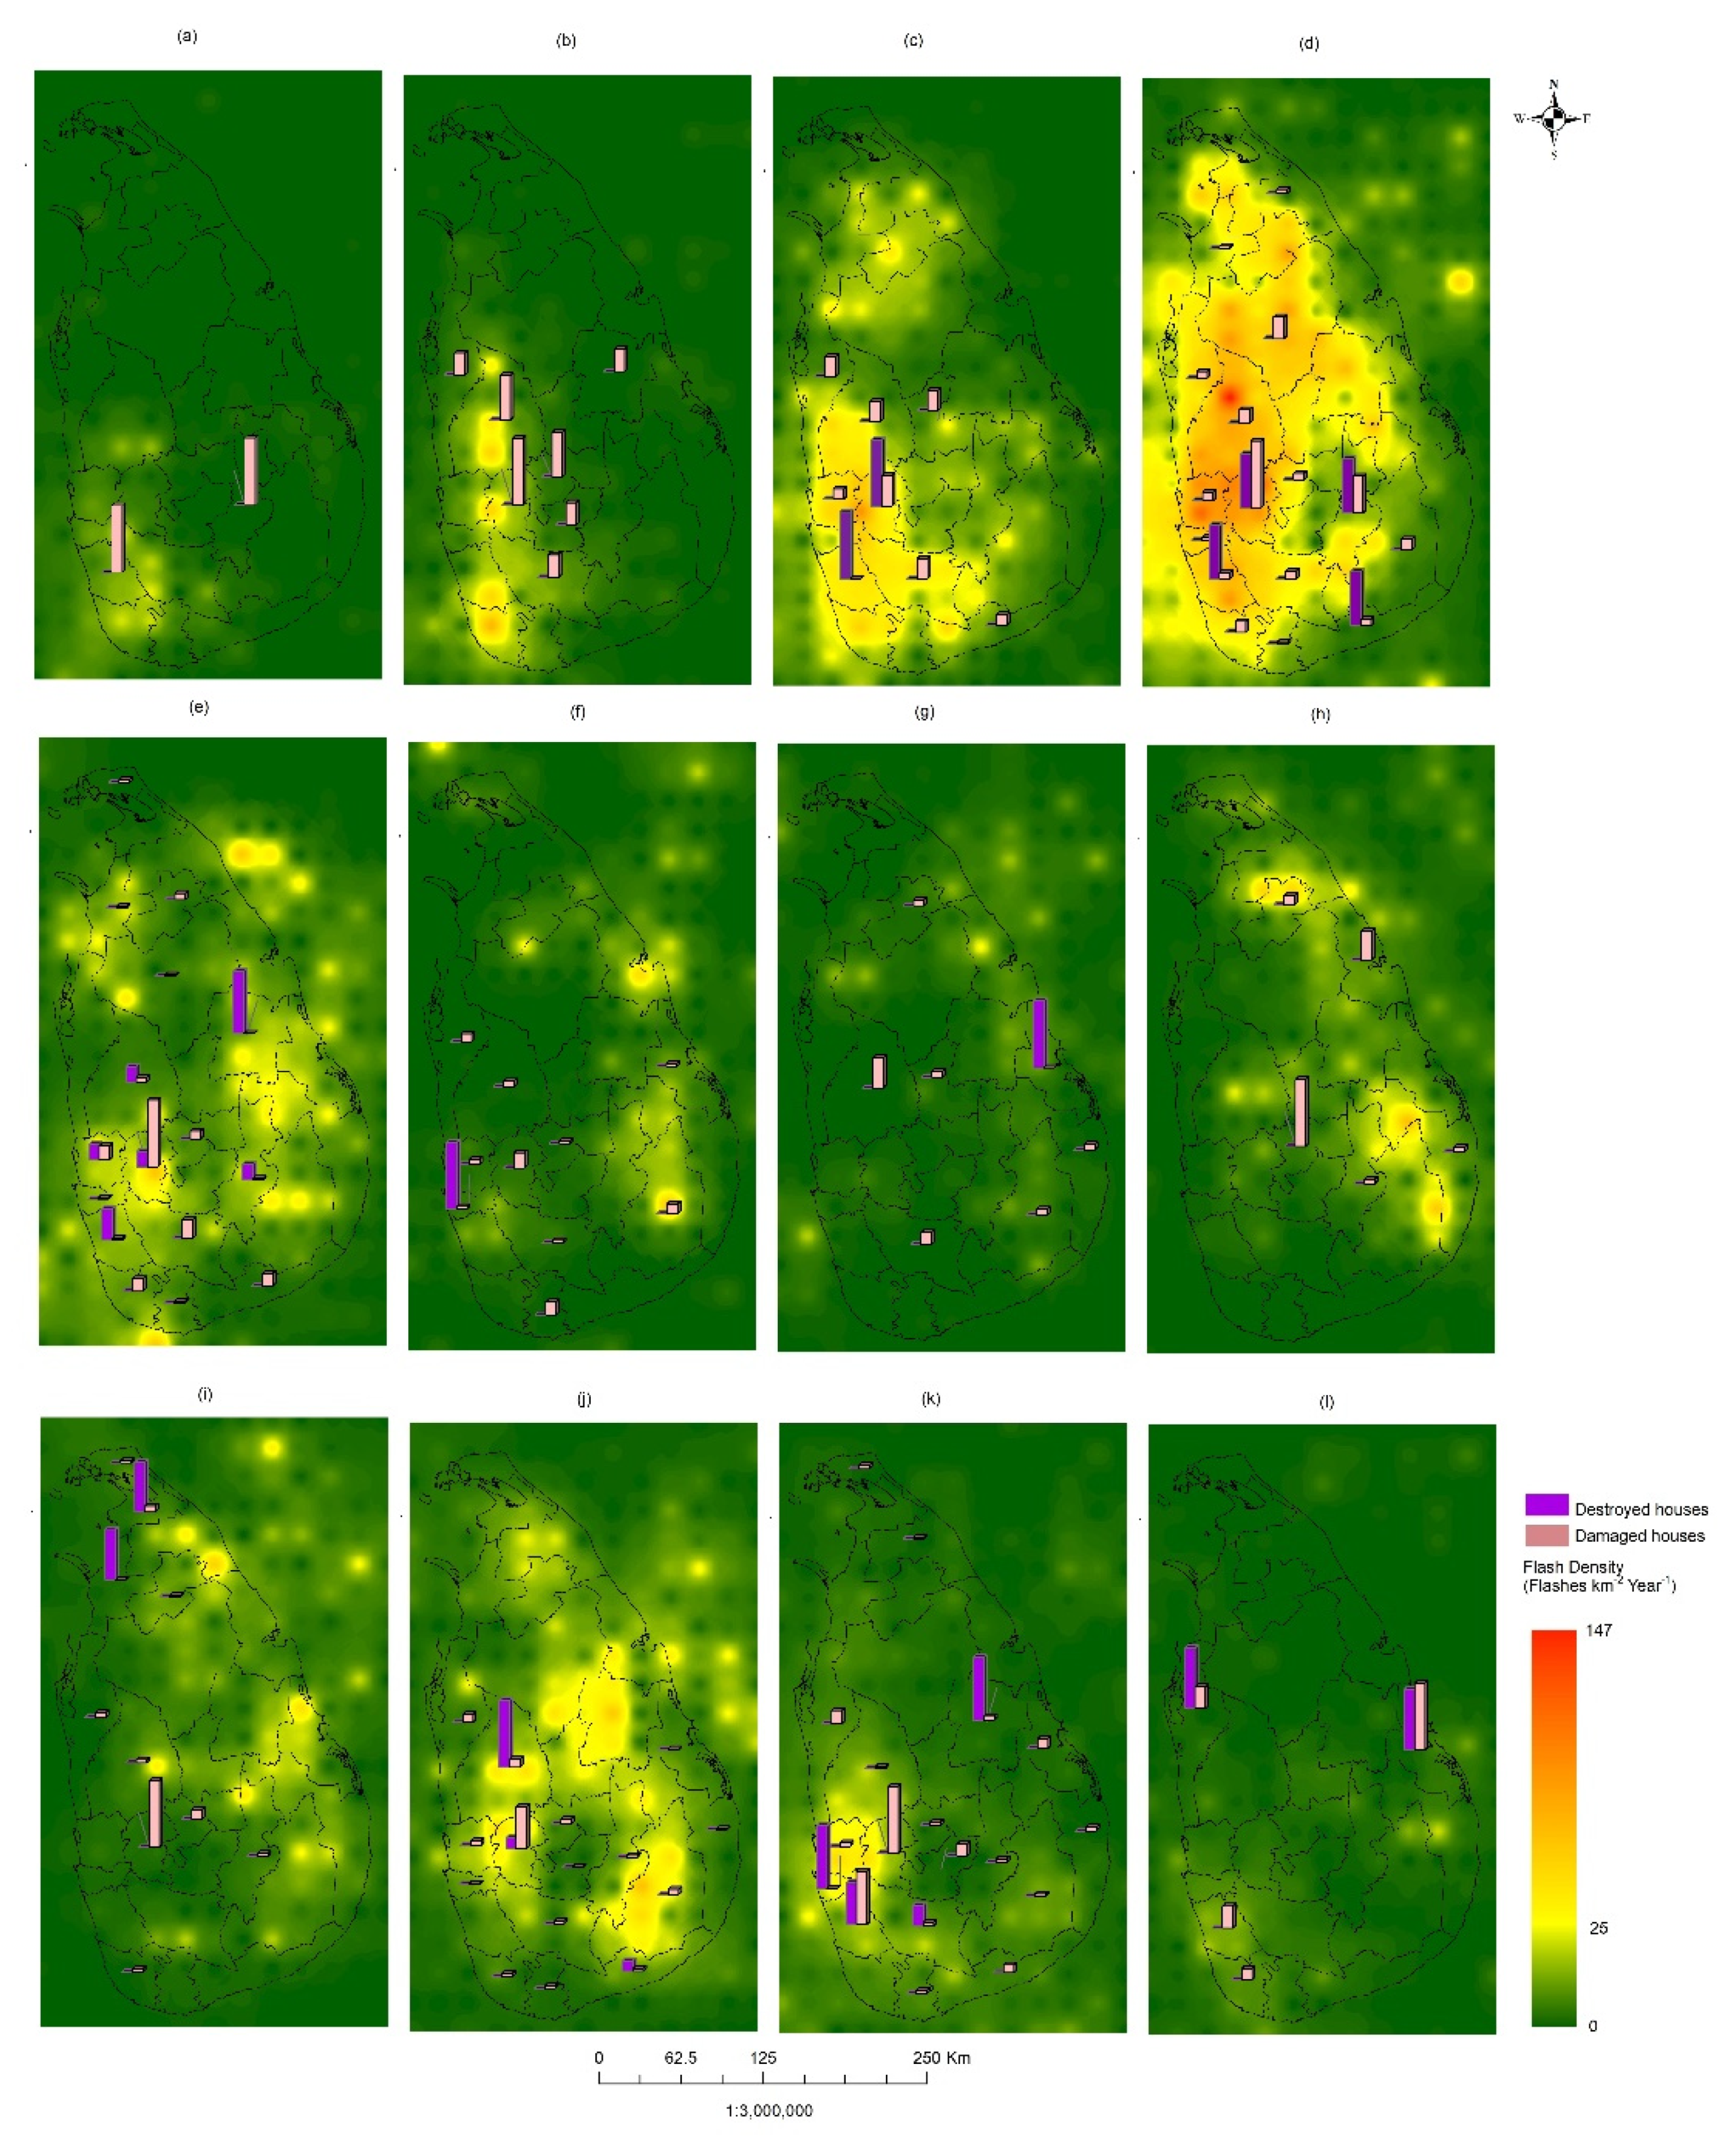
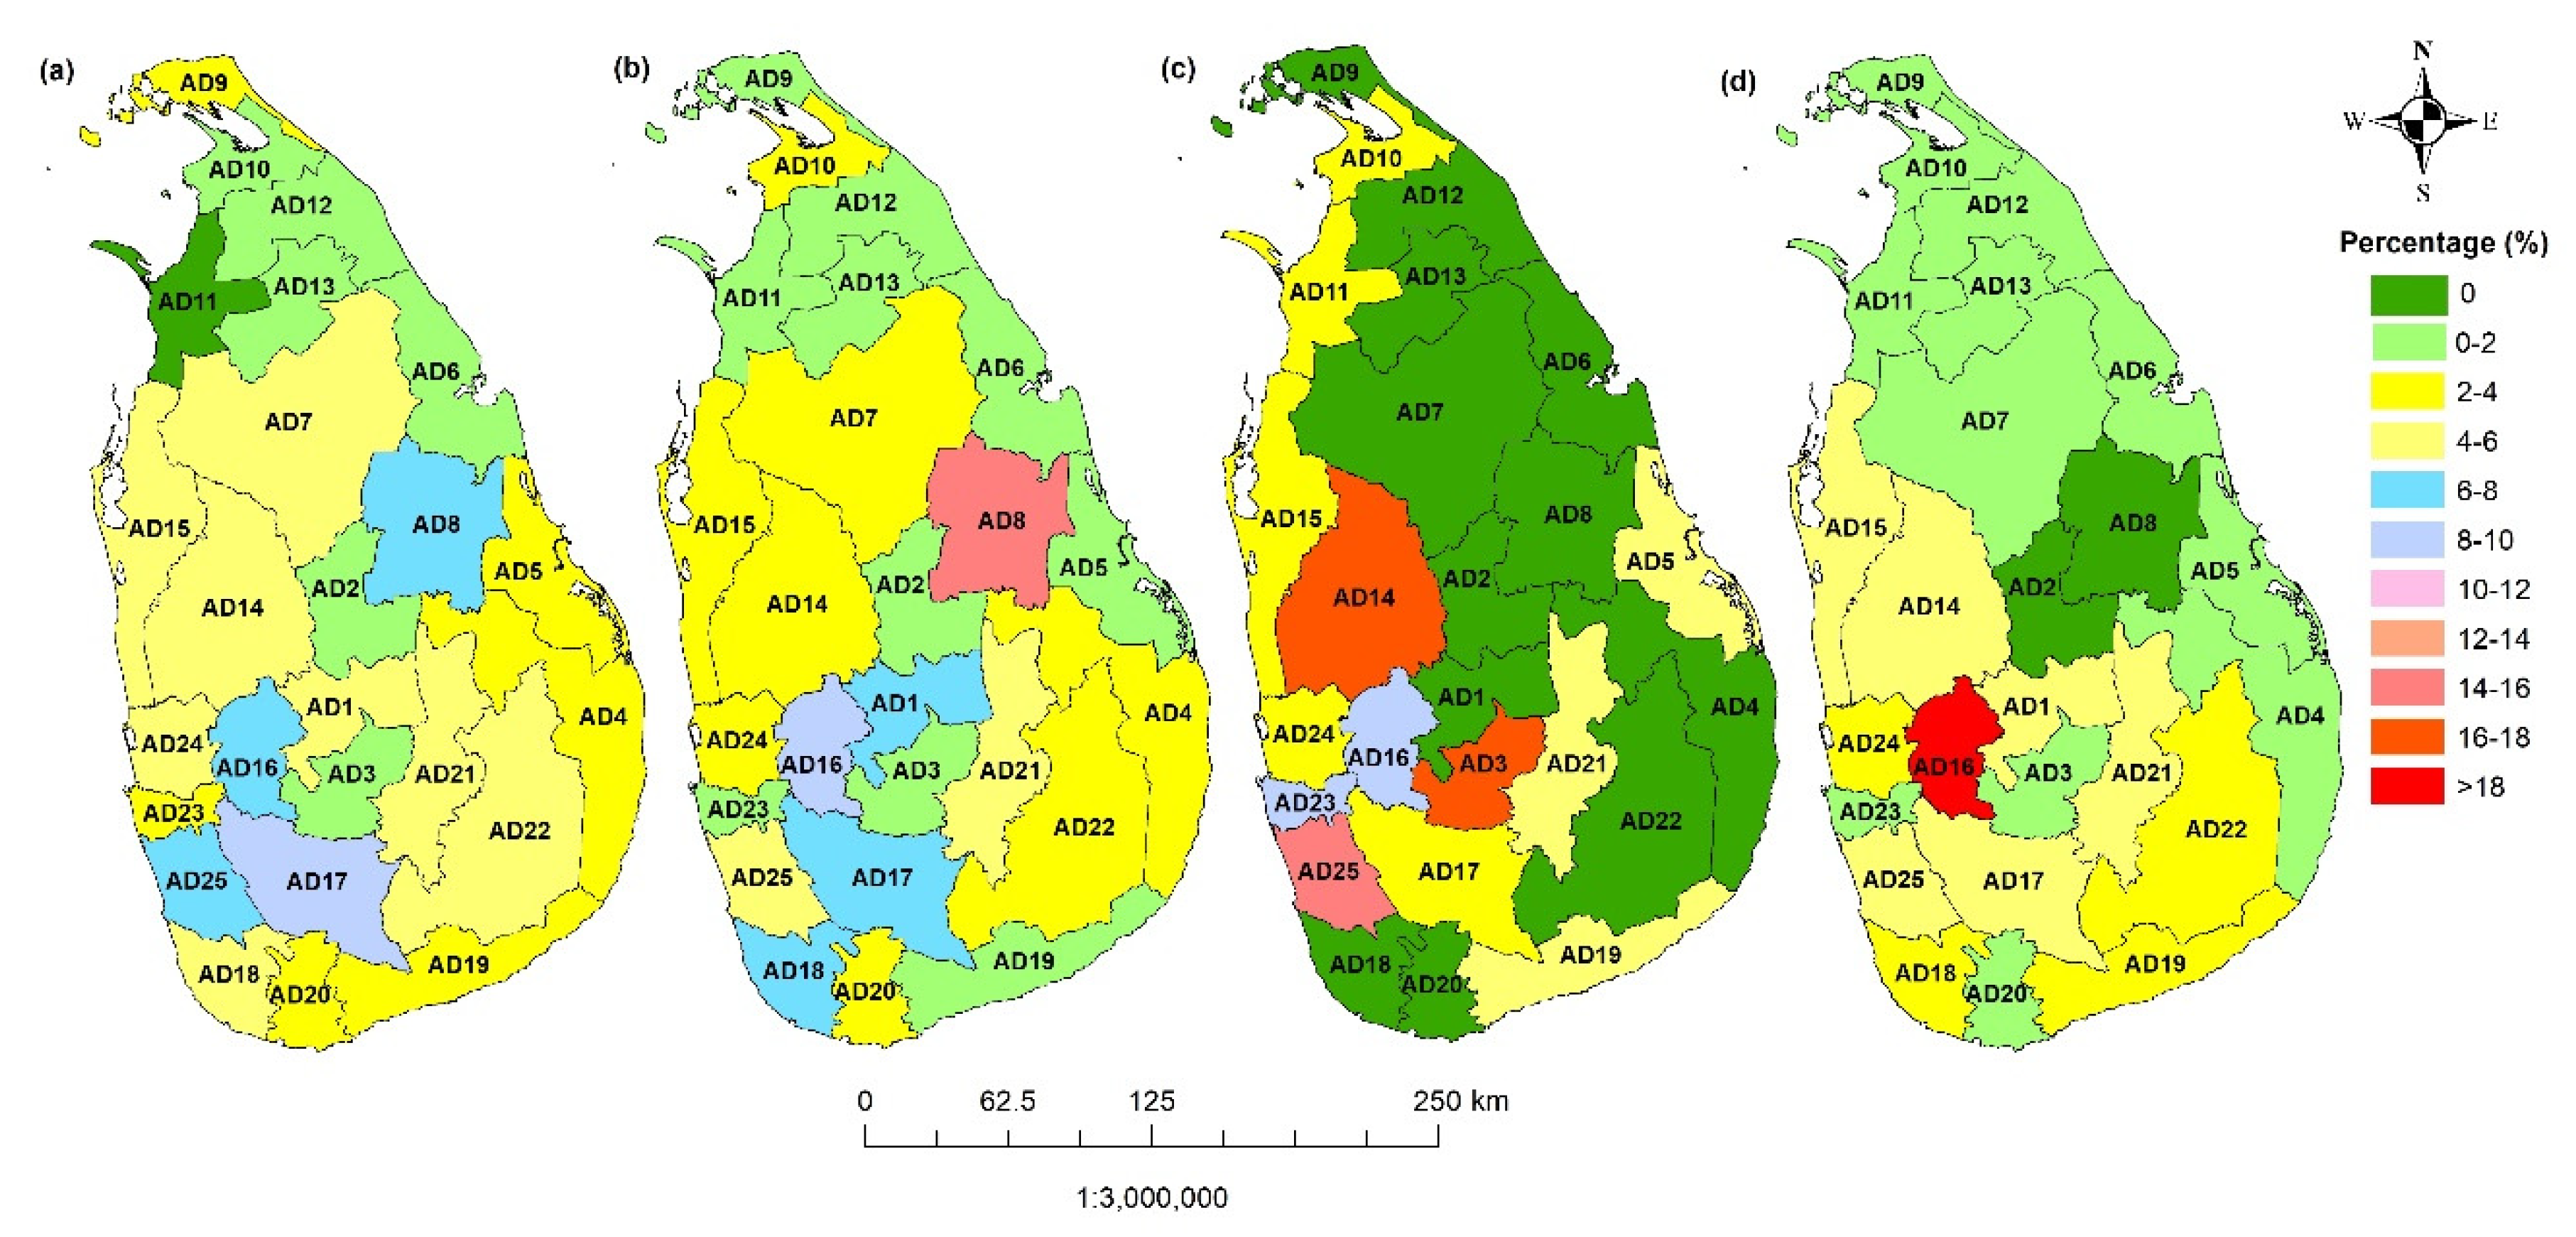
| District Number | District | FIM | SWM | SIM | NEM | ||||||||||||
|---|---|---|---|---|---|---|---|---|---|---|---|---|---|---|---|---|---|
| Deaths | Injuries | Houses Destroyed | Houses Damaged | Deaths | Injuries | Houses Destroyed | Houses Damaged | Deaths | Injuries | Houses Destroyed | Houses Damaged | Deaths | Injuries | Houses Destroyed | Houses Damaged | ||
| AD 1 | Kandy | 10 | 13 | 0 | 5 | 11 | 19 | 0 | 28 | 4 | 5 | 0 | 11 | 2 | 1 | 0 | 2 |
| AD 2 | Matale | 4 | 7 | 0 | 2 | 2 | 1 | 0 | 1 | 1 | 0 | 0 | 0 | 0 | 0 | 0 | 0 |
| AD 3 | Nuwara Eliya | 3 | 3 | 0 | 0 | 4 | 1 | 0 | 0 | 2 | 3 | 0 | 9 | 0 | 0 | 0 | 1 |
| AD 4 | Ampara | 4 | 4 | 0 | 0 | 9 | 3 | 0 | 2 | 7 | 12 | 0 | 4 | 0 | 0 | 0 | 0 |
| AD 5 | Batticaloa | 4 | 1 | 0 | 0 | 5 | 0 | 1 | 1 | 8 | 5 | 0 | 7 | 0 | 3 | 1 | 6 |
| AD 6 | Trincomalee | 1 | 0 | 0 | 0 | 4 | 5 | 0 | 6 | 1 | 0 | 0 | 0 | 2 | 0 | 0 | 0 |
| AD 7 | Anuradhapura | 8 | 1 | 0 | 15 | 15 | 16 | 0 | 1 | 7 | 0 | 0 | 0 | 1 | 2 | 0 | 0 |
| AD 8 | Polonnaruwa | 15 | 64 | 0 | 0 | 19 | 3 | 4 | 0 | 3 | 5 | 3 | 2 | 3 | 3 | 0 | 1 |
| AD 9 | Jaffna | 3 | 2 | 0 | 0 | 6 | 3 | 0 | 3 | 5 | 3 | 0 | 2 | 0 | 0 | 0 | 0 |
| AD 10 | Kilinochchi | 1 | 0 | 0 | 0 | 5 | 13 | 1 | 4 | 1 | 0 | 0 | 0 | 1 | 0 | 0 | 0 |
| AD 11 | Mannar | 1 | 2 | 0 | 2 | 0 | 0 | 1 | 2 | 0 | 1 | 0 | 0 | 0 | 0 | 0 | 0 |
| AD 12 | Mullaittivu | 1 | 1 | 0 | 3 | 3 | 4 | 0 | 0 | 1 | 0 | 0 | 1 | 0 | 0 | 0 | 0 |
| AD 13 | Vavuniya | 3 | 2 | 0 | 0 | 4 | 2 | 0 | 10 | 0 | 0 | 0 | 0 | 0 | 0 | 0 | 0 |
| AD 14 | Kurunegala | 12 | 10 | 0 | 11 | 13 | 3 | 1 | 14 | 5 | 0 | 6 | 15 | 1 | 1 | 0 | 2 |
| AD 15 | Puttalam | 11 | 4 | 0 | 6 | 2 | 2 | 0 | 6 | 12 | 12 | 0 | 22 | 1 | 0 | 1 | 3 |
| AD 16 | Kegalle | 20 | 5 | 2 | 47 | 9 | 34 | 1 | 113 | 9 | 10 | 1 | 117 | 1 | 2 | 0 | 3 |
| AD 17 | Ratnapura | 22 | 16 | 0 | 8 | 9 | 6 | 0 | 21 | 14 | 7 | 1 | 6 | 2 | 7 | 0 | 1 |
| AD 18 | Galle | 12 | 13 | 0 | 7 | 4 | 21 | 0 | 14 | 5 | 0 | 0 | 6 | 6 | 2 | 0 | 1 |
| AD 19 | Hambantota | 6 | 3 | 1 | 5 | 5 | 2 | 0 | 12 | 5 | 3 | 1 | 10 | 0 | 0 | 0 | 0 |
| AD 20 | Matara | 13 | 0 | 0 | 2 | 0 | 4 | 0 | 6 | 2 | 3 | 0 | 6 | 2 | 12 | 0 | 0 |
| AD 21 | Badulla | 10 | 6 | 1 | 25 | 7 | 3 | 1 | 5 | 6 | 13 | 0 | 6 | 2 | 4 | 0 | 1 |
| AD 22 | Moneragala | 15 | 7 | 0 | 7 | 16 | 5 | 0 | 5 | 2 | 7 | 0 | 10 | 2 | 1 | 0 | 0 |
| AD 23 | Colombo | 2 | 3 | 0 | 2 | 5 | 2 | 1 | 3 | 3 | 0 | 3 | 2 | 8 | 1 | 0 | 0 |
| AD 24 | Gampaha | 10 | 16 | 0 | 7 | 13 | 1 | 1 | 16 | 5 | 1 | 0 | 10 | 3 | 2 | 0 | 0 |
| AD 25 | Kalutara | 13 | 13 | 2 | 5 | 13 | 12 | 2 | 2 | 7 | 1 | 2 | 37 | 10 | 5 | 0 | 3 |
| Total | 204 | 196 | 6 | 159 | 183 | 165 | 14 | 275 | 115 | 91 | 17 | 283 | 47 | 46 | 2 | 24 | |
| Month | Number of Deaths | Number of Injuries | Number of Houses | |||||
|---|---|---|---|---|---|---|---|---|
| Destroyed | Damaged | |||||||
| No. | % | No. | % | No. | % | No. | % | |
| January | 14 | 2.6 | 3 | 0.6 | 0 | 0.0 | 2 | 0.3 |
| February | 14 | 2.6 | 32 | 6.4 | 0 | 0.0 | 11 | 1.5 |
| March | 54 | 9.8 | 49 | 9.8 | 2 | 5.1 | 14 | 1.9 |
| April | 150 | 27.3 | 147 | 29.5 | 4 | 10.3 | 145 | 19.6 |
| May | 91 | 16.6 | 96 | 19.3 | 10 | 25.6 | 151 | 20.4 |
| June | 22 | 4.0 | 12 | 2.4 | 1 | 2.6 | 26 | 3.5 |
| July | 16 | 2.9 | 15 | 3.0 | 1 | 2.6 | 11 | 1.5 |
| August | 18 | 3.3 | 16 | 3.2 | 0 | 0.0 | 24 | 3.2 |
| September | 36 | 6.6 | 26 | 5.2 | 2 | 5.1 | 63 | 8.5 |
| October | 62 | 11.3 | 51 | 10.2 | 8 | 20.5 | 150 | 20.2 |
| November | 53 | 9.7 | 40 | 8.0 | 9 | 23.1 | 133 | 17.9 |
| December | 19 | 3.5 | 11 | 2.2 | 2 | 5.1 | 11 | 1.5 |
| Total | 549 | 100 | 498 | 100 | 39 | 100 | 741 | 100 |
| District Number | District | Number of Deaths | Number of Injuries | Number of Houses | |||||
|---|---|---|---|---|---|---|---|---|---|
| Destroyed | Damaged | ||||||||
| No. | % | No. | % | No. | % | No. | % | ||
| AD 1 | Kandy | 27 | 4.9 | 38 | 7.6 | 0 | 0.0 | 46 | 6.2 |
| AD 2 | Matale | 7 | 1.3 | 8 | 1.6 | 0 | 0.0 | 3 | 0.4 |
| AD 3 | Nuwara Eliya | 9 | 1.6 | 7 | 1.4 | 7 | 17.9 | 10 | 1.3 |
| AD 4 | Ampara | 20 | 3.6 | 19 | 3.8 | 0 | 0.0 | 6 | 0.8 |
| AD 5 | Batticaloa | 17 | 3.1 | 9 | 1.8 | 2 | 5.1 | 14 | 1.9 |
| AD 6 | Trincomalee | 8 | 1.5 | 5 | 1.0 | 0 | 0.0 | 6 | 0.8 |
| AD 7 | Anuradhapura | 31 | 5.6 | 19 | 3.8 | 0 | 0.0 | 16 | 2.2 |
| AD 8 | Polonnaruwa | 40 | 7.3 | 75 | 15.1 | 0 | 0.0 | 3 | 0.4 |
| AD 9 | Jaffna | 14 | 2.6 | 8 | 1.6 | 0 | 0.0 | 5 | 0.7 |
| AD 10 | Kilinochchi | 8 | 1.5 | 13 | 2.6 | 1 | 2.6 | 4 | 0.5 |
| AD 11 | Mannar | 1 | 0.2 | 3 | 0.6 | 1 | 2.6 | 4 | 0.5 |
| AD 12 | Mullaittivu | 5 | 0.9 | 5 | 1.0 | 0 | 0.0 | 4 | 0.5 |
| AD 13 | Vavuniya | 7 | 1.3 | 4 | 0.8 | 0 | 0.0 | 10 | 1.3 |
| AD 14 | Kurunegala | 31 | 5.6 | 14 | 2.8 | 7 | 17.9 | 42 | 5.7 |
| AD 15 | Puttalam | 26 | 4.7 | 18 | 3.6 | 1 | 2.6 | 37 | 5.0 |
| AD 16 | Kegalle | 39 | 7.1 | 51 | 10.2 | 4 | 10.3 | 280 | 37.8 |
| AD 17 | Ratnapura | 47 | 8.6 | 36 | 7.2 | 1 | 2.6 | 36 | 4.9 |
| AD 18 | Galle | 27 | 4.9 | 36 | 7.2 | 0 | 0.0 | 28 | 3.8 |
| AD 19 | Hambantota | 16 | 2.9 | 8 | 1.6 | 2 | 5.1 | 27 | 3.6 |
| AD 20 | Matara | 17 | 3.1 | 19 | 3.8 | 0 | 0.0 | 14 | 1.9 |
| AD 21 | Badulla | 25 | 4.6 | 26 | 5.2 | 2 | 5.1 | 37 | 5.0 |
| AD 22 | Moneragala | 35 | 6.4 | 20 | 4.0 | 0 | 0.0 | 22 | 3.0 |
| AD 23 | Colombo | 18 | 3.3 | 6 | 1.2 | 4 | 10.3 | 7 | 0.9 |
| AD 24 | Gampaha | 31 | 5.6 | 20 | 4.0 | 1 | 2.6 | 33 | 4.5 |
| AD 25 | Kalutara | 43 | 7.8 | 31 | 6.2 | 6 | 15.4 | 47 | 6.3 |
| Month | Number of Deaths | Number of Injuries | ||||||
|---|---|---|---|---|---|---|---|---|
| Average | Maximum | Minimum | Standard Deviation | Average | Maximum | Minimum | Standard Deviation | |
| January | 0.30 | 2 | 0 | 0.66 | 0.07 | 2 | 0 | 0.33 |
| February | 0.30 | 4 | 0 | 0.84 | 0.70 | 16 | 0 | 2.93 |
| March | 1.17 | 8 | 0 | 1.90 | 1.07 | 13 | 0 | 2.64 |
| April | 3.26 | 29 | 0 | 4.83 | 3.20 | 61 | 0 | 9.31 |
| May | 1.98 | 10 | 0 | 2.34 | 2.09 | 17 | 0 | 4.03 |
| June | 0.48 | 4 | 0 | 0.98 | 0.26 | 2 | 0 | 0.61 |
| July | 0.35 | 5 | 0 | 0.90 | 0.33 | 10 | 0 | 1.49 |
| August | 0.39 | 3 | 0 | 0.83 | 0.35 | 6 | 0 | 1.20 |
| September | 0.78 | 7 | 0 | 1.49 | 0.57 | 11 | 0 | 1.73 |
| October | 1.35 | 16 | 0 | 2.72 | 1.11 | 13 | 0 | 2.71 |
| November | 1.15 | 10 | 0 | 1.89 | 0.87 | 11 | 0 | 2.17 |
| December | 0.41 | 4 | 0 | 0.88 | 0.24 | 3 | 0 | 0.79 |
| Number of Houses Destroyed | Number of Houses Damaged | |||||||
|---|---|---|---|---|---|---|---|---|
| Average | Maximum | Minimum | Standard Deviation | Average | Maximum | Minimum | Standard Deviation | |
| January | 0.00 | 0 | 0 | 0.00 | 0.04 | 1 | 0 | 0.21 |
| February | 0.00 | 0 | 0 | 0.00 | 0.24 | 8 | 0 | 1.20 |
| March | 0.04 | 1 | 0 | 0.21 | 0.30 | 4 | 0 | 0.81 |
| April | 0.09 | 2 | 0 | 0.35 | 3.15 | 38 | 0 | 8.00 |
| May | 0.22 | 5 | 0 | 0.81 | 3.28 | 84 | 0 | 12.82 |
| June | 0.02 | 1 | 0 | 0.15 | 0.57 | 12 | 0 | 2.20 |
| July | 0.02 | 1 | 0 | 0.15 | 0.24 | 5 | 0 | 0.82 |
| August | 0.00 | 0 | 0 | 0.00 | 0.52 | 14 | 0 | 2.23 |
| September | 0.04 | 1 | 0 | 0.21 | 1.37 | 29 | 0 | 4.95 |
| October | 0.17 | 5 | 0 | 0.77 | 3.26 | 83 | 0 | 0 |
| November | 0.20 | 3 | 0 | 0.58 | 2.89 | 64 | 0 | 10.20 |
| December | 0.04 | 2 | 0 | 0.29 | 0.24 | 6 | 0 | 0.97 |
| Range | Statistics | Nature of Accidents | |||
|---|---|---|---|---|---|
| Number of Deaths | Number of Injuries | Number of Houses Destroyed | Number of Houses Damaged | ||
| 1974–2019 (46 years) | Mean | 11.93 | 10.83 | 0.85 | 16.11 |
| Maximum | 68 | 67 | 6 | 245 | |
| Minimum | 0 | 0 | 0 | 0 | |
| Standard Deviation | 11.28 | 12.22 | 1.62 | 46.00 | |
| 1980–2019 (40 years) | Mean | 12.90 | 11.53 | 0.98 | 18.50 |
| Maximum | 68 | 67 | 6 | 245 | |
| Minimum | 0 | 0 | 0 | 0 | |
| Standard Deviation | 11.73 | 12.78 | 1.70 | 48.96 | |
| 1990–2019 (30 years) | Mean | 15.73 | 13.57 | 1.27 | 23.83 |
| Maximum | 68 | 67 | 6 | 245 | |
| Minimum | 2 | 0 | 0 | 0 | |
| Standard Deviation | 12.25 | 13.76 | 1.87 | 55.67 | |
| 2000–2019 (20 years) | Mean | 18.40 | 16.50 | 1.90 | 35.30 |
| Maximum | 68 | 67 | 6 | 245 | |
| Minimum | 5 | 0 | 0 | 0 | |
| Standard Deviation | 13.22 | 15.27 | 2.02 | 65.67 | |
| 2010–2019 (10 years) | Mean | 23.20 | 18.00 | 2.00 | 57.30 |
| Maximum | 68 | 36 | 6 | 245 | |
| Minimum | 9 | 7 | 0 | 0 | |
| Standard Deviation | 16.33 | 10.07 | 2.21 | 88.43 | |
| Number of Deaths | Number of Injuries | Number of Houses | ||||||
|---|---|---|---|---|---|---|---|---|
| Destroyed | Damaged | |||||||
| No. | % | No. | % | No. | % | No. | % | |
| FIM | 204 | 37.2 | 196 | 39.4 | 6 | 15.4 | 159 | 21.5 |
| SWM | 183 | 33.3 | 165 | 33.1 | 14 | 35.9 | 275 | 37.1 |
| SIM | 115 | 20.9 | 91 | 18.3 | 17 | 43.6 | 283 | 38.2 |
| NEM | 47 | 8.6 | 46 | 9.2 | 2 | 5.1 | 24 | 3.2 |
| Deaths | Injured | Houses Destroyed | Houses Damaged | Deaths | Injured | Houses Destroyed | Houses Damaged | |||
|---|---|---|---|---|---|---|---|---|---|---|
| Mean | 2.22 | 2.13 | 0.07 | 1.73 | FIM | 0.80 | 0.72 | 0.06 | 1.20 | SWM |
| Maximum | 29 | 61 | 2 | 38 | 10 | 17 | 5 | 84 | ||
| Minimum | 0 | 0 | 0 | 0 | 0 | 0 | 0 | 0 | ||
| Standard Deviation | 3.80 | 6.89 | 0.29 | 5.83 | 1.54 | 2.25 | 0.39 | 6.36 | ||
| Mean | 1.25 | 0.99 | 0.18 | 3.08 | SIM | 0.44 | 0.56 | 0.01 | 0.25 | NEM |
| Maximum | 16 | 13 | 5 | 83 | 14 | 32 | 2 | 11 | ||
| Minimum | 0 | 0 | 0 | 0 | 0 | 0 | 0 | 0 | ||
| Standard Deviation | 2.33 | 2.44 | 0.68 | 11.56 | 1.40 | 3.21 | 0.17 | 1.28 |
Publisher’s Note: MDPI stays neutral with regard to jurisdictional claims in published maps and institutional affiliations. |
© 2021 by the authors. Licensee MDPI, Basel, Switzerland. This article is an open access article distributed under the terms and conditions of the Creative Commons Attribution (CC BY) license (http://creativecommons.org/licenses/by/4.0/).
Share and Cite
Edirisinghe, M.; Maduranga, U.G.D. Distribution of Lightning Accidents in Sri Lanka from 1974 to 2019 Using the DesInventar Database. ISPRS Int. J. Geo-Inf. 2021, 10, 117. https://doi.org/10.3390/ijgi10030117
Edirisinghe M, Maduranga UGD. Distribution of Lightning Accidents in Sri Lanka from 1974 to 2019 Using the DesInventar Database. ISPRS International Journal of Geo-Information. 2021; 10(3):117. https://doi.org/10.3390/ijgi10030117
Chicago/Turabian StyleEdirisinghe, Mahesh, and Uruvitiya Gamage Dilaj Maduranga. 2021. "Distribution of Lightning Accidents in Sri Lanka from 1974 to 2019 Using the DesInventar Database" ISPRS International Journal of Geo-Information 10, no. 3: 117. https://doi.org/10.3390/ijgi10030117
APA StyleEdirisinghe, M., & Maduranga, U. G. D. (2021). Distribution of Lightning Accidents in Sri Lanka from 1974 to 2019 Using the DesInventar Database. ISPRS International Journal of Geo-Information, 10(3), 117. https://doi.org/10.3390/ijgi10030117


