1. Introduction
Along with the rapid development of information and communications technology, social media has played a growing part in people’s daily lives [
1,
2,
3]. A massive amount of social media data generated by users have boosted the analysis of large-scale online social networks (OSNs) and promoted our understanding of the sociological phenomena and complex social interactions over the past two decades [
4,
5]. Simultaneously, because of its unique ability to assemble various information, social media is considered to be a critical tool and data source to support timely natural disaster management [
6,
7,
8].
In the context of climate change, natural disasters’ negative impact on society and the economy continues to grow. The United Nations (U.N.) reports that 7348 natural disasters caused 1.23 million deaths, affected 4.03 billion people, and cost USD 2.97 trillion in economic losses between 2000 and 2019. These records compare with 4121 natural disasters, which accounted for 1.19 million deaths, 3.25 billion affected people, and USD 1.63 trillion in economic losses from 1980 to 1999 [
9]. In contrast to the slight increase in mortality, the number of affected people and the disaster-induced economic loss have significantly grown over the past two decades. Disaster response and risk reduction have been a core challenge in achieving the U.N.’s sustainable development goals [
10].
The emerging social media can help natural disaster emergency response and risk reduction, particularly given its ability to transmit information leveraged by the government, rescue agencies, and citizens [
11,
12,
13]. Social media has been a vital channel for communication before, during, and after a natural disaster [
14]. Now, information related to natural disasters generally is likely to appear on social media first [
8,
15]. The government utilizes social media to deliver disaster warnings, share helpful information, and improve situational awareness [
16,
17,
18]. Relief-operating organizations and agencies coordinate relief supplies through social media platforms like Twitter, Instagram, and Facebook [
12,
19,
20]. Local people also used social media to request help and contact their families at home and abroad [
20,
21]. In addition, citizens can provide an extensive social sensor network by reporting first-hand disaster-related information and supporting near-real-time situational awareness by posting texts, images, and videos through social media platforms [
7,
14]. For instance, major natural disaster events, such as the Great East Japan Earthquake and Tsunami, the Haiti earthquake, Typhoon Haiyan, and Hurricane Sandy, attracted large-scale social media user engagement [
14,
19,
20,
22]. Given the significant information propagation capability of social media and its worldwide user base, the social impact of natural disasters has expanded from locally affected areas to the whole world [
23]. Consequently, social media has provided a valuable source of information to support natural disaster management and mitigation planning.
Therefore, the applications and analysis of social media data for natural disaster management have attracted significant attention from various disciplines, including computational social science and geographical information science [
7,
8,
24,
25,
26]. Social media has become a critical source for detecting real-time events [
27], understanding user behavior and mobility, and inferring people’s location [
28]. Among the literature, a significant amount of effort has been put toward revealing the OSN’s characteristics and patterns [
13,
29,
30,
31], user activities [
20,
22,
23,
25,
31,
32,
33,
34], and social media content mining [
35,
36,
37,
38,
39,
40]. The detailed description and review regarding the research on these three topics can be found in the related work section.
Despite this progress in recent decades, research gaps still exist in the literature. Studies on the large-scale geographical spatiotemporal pattern evolution of OSNs are rare. Previous research mainly focused on statistical characteristics of the OSN and paid substantial attention to digging out valuable information from social media content and user activities for supporting disaster management. In contrast, the OSN’s spatial patterns and its spatiotemporal evolution have not been explored or analyzed. Although a few studies have explored the dynamic spatial evolution of the OSN after disasters [
41,
42], they are limited in small coverage areas, such as cities and the surrounding areas of the epicenter. Additionally, the user activities, such as posting and forwarding in the OSN, are usually collected from regional or national scales and calculated directly from the social media data. Global-scale user activities patterns from the viewpoint of the complex network need more investigation and understanding.
This paper, therefore, aims to illustrate the spatiotemporal evolution of the geographical patterns of the OSN to explore the connections between users and users’ activities after a natural disaster. We proposed an approach to analyzing the large-scale spatiotemporal geographical pattern of the OSN by integrating geocoding, geovisualization, and complex networks. First, well-documented social media data and a well-constructed complex network are needed to map the virtual OSN to the physical world. Hence, we constructed the retweeting network and the being-retweeted network based on the retweeting connections in the aftermath of a disaster. Then, we also investigated the networks’ dynamic evolution in the period following the disaster.
Next, the critical issue in illustrating the large-scale spatiotemporal pattern evolution and user activities of OSN is how to locate the posted messages (i.e., tweets, in our research). We presented a geocoding method to locate tweets to illustrate the spatiotemporal evolution of OSN’s geographical patterns and user activities globally. 2013 super typhoon Haiyan was selected as the case study because this disaster event attracted global interest and was widely reported by the international news media [
20]. Therefore, the results of this study will provide global spatiotemporal evolution of the geographical patterns of OSN after a natural disaster. This pattern provides a global landscape of user activities, interactions, connections, and information flows after a disaster. Governments, professional organizations, and emergency response agencies can use this to improve disaster relief by collecting, organizing, aggregating, and providing helpful disaster information more effectively. Moreover, social media platforms improve the features of existing social network sites.
The rest of this paper is organized as follows.
Section 2 presents previous related works.
Section 3 describes the selected case study of Typhoon Haiyan and the data for the tweets used in this study. The indices and methods, including geovisualization, complex network properties, and probability analysis, are also introduced in this section.
Section 4 presents the detailed results of the spatiotemporal evolution of OSNs.
Section 5 provides a discussion.
Section 6 concludes the principal works of this study and presents potential future directions.
2. Related Works
Given the significant role of the OSN in disaster management, the studies on the OSN continue to grow. Most research on the OSN after a natural disaster can be mainly concluded into three types: OSN’s characteristics and patterns, user activities, and social content mining.
Exploring the OSN’s network characteristics and patterns is the essential and critical mission that can help identify critical roles or information in the OSN. Kim and Hastak take the 2016 Louisiana Flood as an example to analyze Facebook user connections and patterns in the city of Baton Rouge in Louisiana [
13]. They found that the OSN consisted of individuals, emergency agencies, and organizations. Numerous individuals, however, are the core of the network. Li et al. constructed a reposting network after the Yiliang earthquake, divided it into five types based on their contents, and then explored the changes in the scale topological features of these networks [
29]. They concluded that information types play a critical role in the propagation and diffusion of disaster-related information. Niles et al. characterized the online social network by the network size [
31]. Page-Tan performed statistical analysis on the changes of social network characteristics (i.e., average degree, path length, network diameter, and clustering) before and after Hurricane Harvey and indicated that OSN experienced significant change during a disaster. These changes will shortly affect the network structural properties [
30].
A different line of research on the OSN is on how the user activities are. Miyabe et al. explored the user activity after the Great East Japan Earthquake and revealed the different preferences between people within and outside the disaster area [
25]. People in the disaster area preferred direct reply tweets, whereas people outside the area preferred forwarding tweets. Kryvasheyeu et al. examined and compared the performance of user activity in the United States before, during, and after Hurricane Sandy and revealed that geolocations of users have a significant impact on the disaster awareness advantage [
34]. Kryvasheyeu et al. also used two social media user activity indices (the total number of active users and the number of messages posted) in fifty metropolitans in the United States to verify their effectiveness for rapidly assessing the disaster damage [
22]. They found that disaster-related user activities are significantly associated with proximity to the pathway of hurricanes and a strong correlation between the per capita user activity and per capita economic loss. David et al. focused on the retweeting behavior after the super typhoon Haiyan and found that the temporal development of retweeting proportion differs according to their contents and sources [
20]. Takahashi et al. also examined Twitter user activity after Typhoon Haiyan and found that the time of use, geographical location, and user types impact Twitter usage [
23]. Niles et al. employed five meteorological disasters to investigate relationships between social media activity and social network size, which concluded that the tweet volume increases by the network size but differs with disaster types [
31]. Guan et al. examined users’ repost behavior of eleven events, including the 2011 East Japan Earthquake, on Weibo and found that messages with pictures and posted by verified users are more likely to be reposted [
33]. Qu et al. classified and investigated the trend and reposting of various messages on Weibo after the 2010 Yushu earthquake and discovered that different topics have different trends and propagation patterns [
32]. Eyre et al. neatly estimated small businesses’ recovery status by analyzing the times series of posting activity in online social networks [
37].
A significant body of research on the OSN after a natural disaster is mining social media content for disaster management. For example, Cheng et al. constructed a normalized affected population index, which can effectively estimate the impacted population of a disaster by extracting the mentions of damaged places from social media messages [
36]. Zhang et al. proposed a sophisticated framework that employed a topic model to identify the people’s demand and geocoding method to map the distribution [
39]. Social media content can also be applied to assess the damage of a disaster. Ahadzadeh and Malek utilized the Support Vector Machine method to figure out damage mentions in social media messages and then create the earthquake damage map [
40]. Bhoi et al. introduced a hybrid deep-learning model with Long Short-Term Memory and a Convolutional Neural Network to identify needs tweets and available tweets for optimal resource transfer and utilization [
38]. Geng et al. mapped four different types of user comments (attention, cognition, response, and trust) distribution using text analysis and evaluated social media users’ perception by the index system of the Likert scale [
42]. They identified that users in the disaster area demonstrated more cognitive comments and responses than users outside. Ysbe et al. developed a Random Forest model by using sentimental information and user account types to evaluate the influence of social media on people’s decision to stay or return home. An interesting result is that people’s mobility decisions after a disaster are more influenced by the information posted by the crowd, not the official account [
43]. Another research of Yabe also demonstrated that tweets posted around individuals’ residential places and online contacts could marginally influence the evacuees’ decisions to return home or not [
44]. More detailed and comprehensive summaries on the OSN content mining can be seen in the reviews of Vongkusolkit and Huang [
45] and Said et al. [
46].
In summary, the network characteristics of the OSN often ignore the geographical location information of users, whereas they concentrate on statistical features (e.g., the network size, path length, degrees distribution) and their development. Although a part of studies regarding the social media user activity and social media content noticed the vital role of users’ or messages’ locations, they usually focused on a regional or national scale. Hence, we are motivated to illustrate the geographical patterns of OSN and user activities at a global scale and analyze the potential application of these patterns to disaster management.
3. Materials and Methods
3.1. Study Area
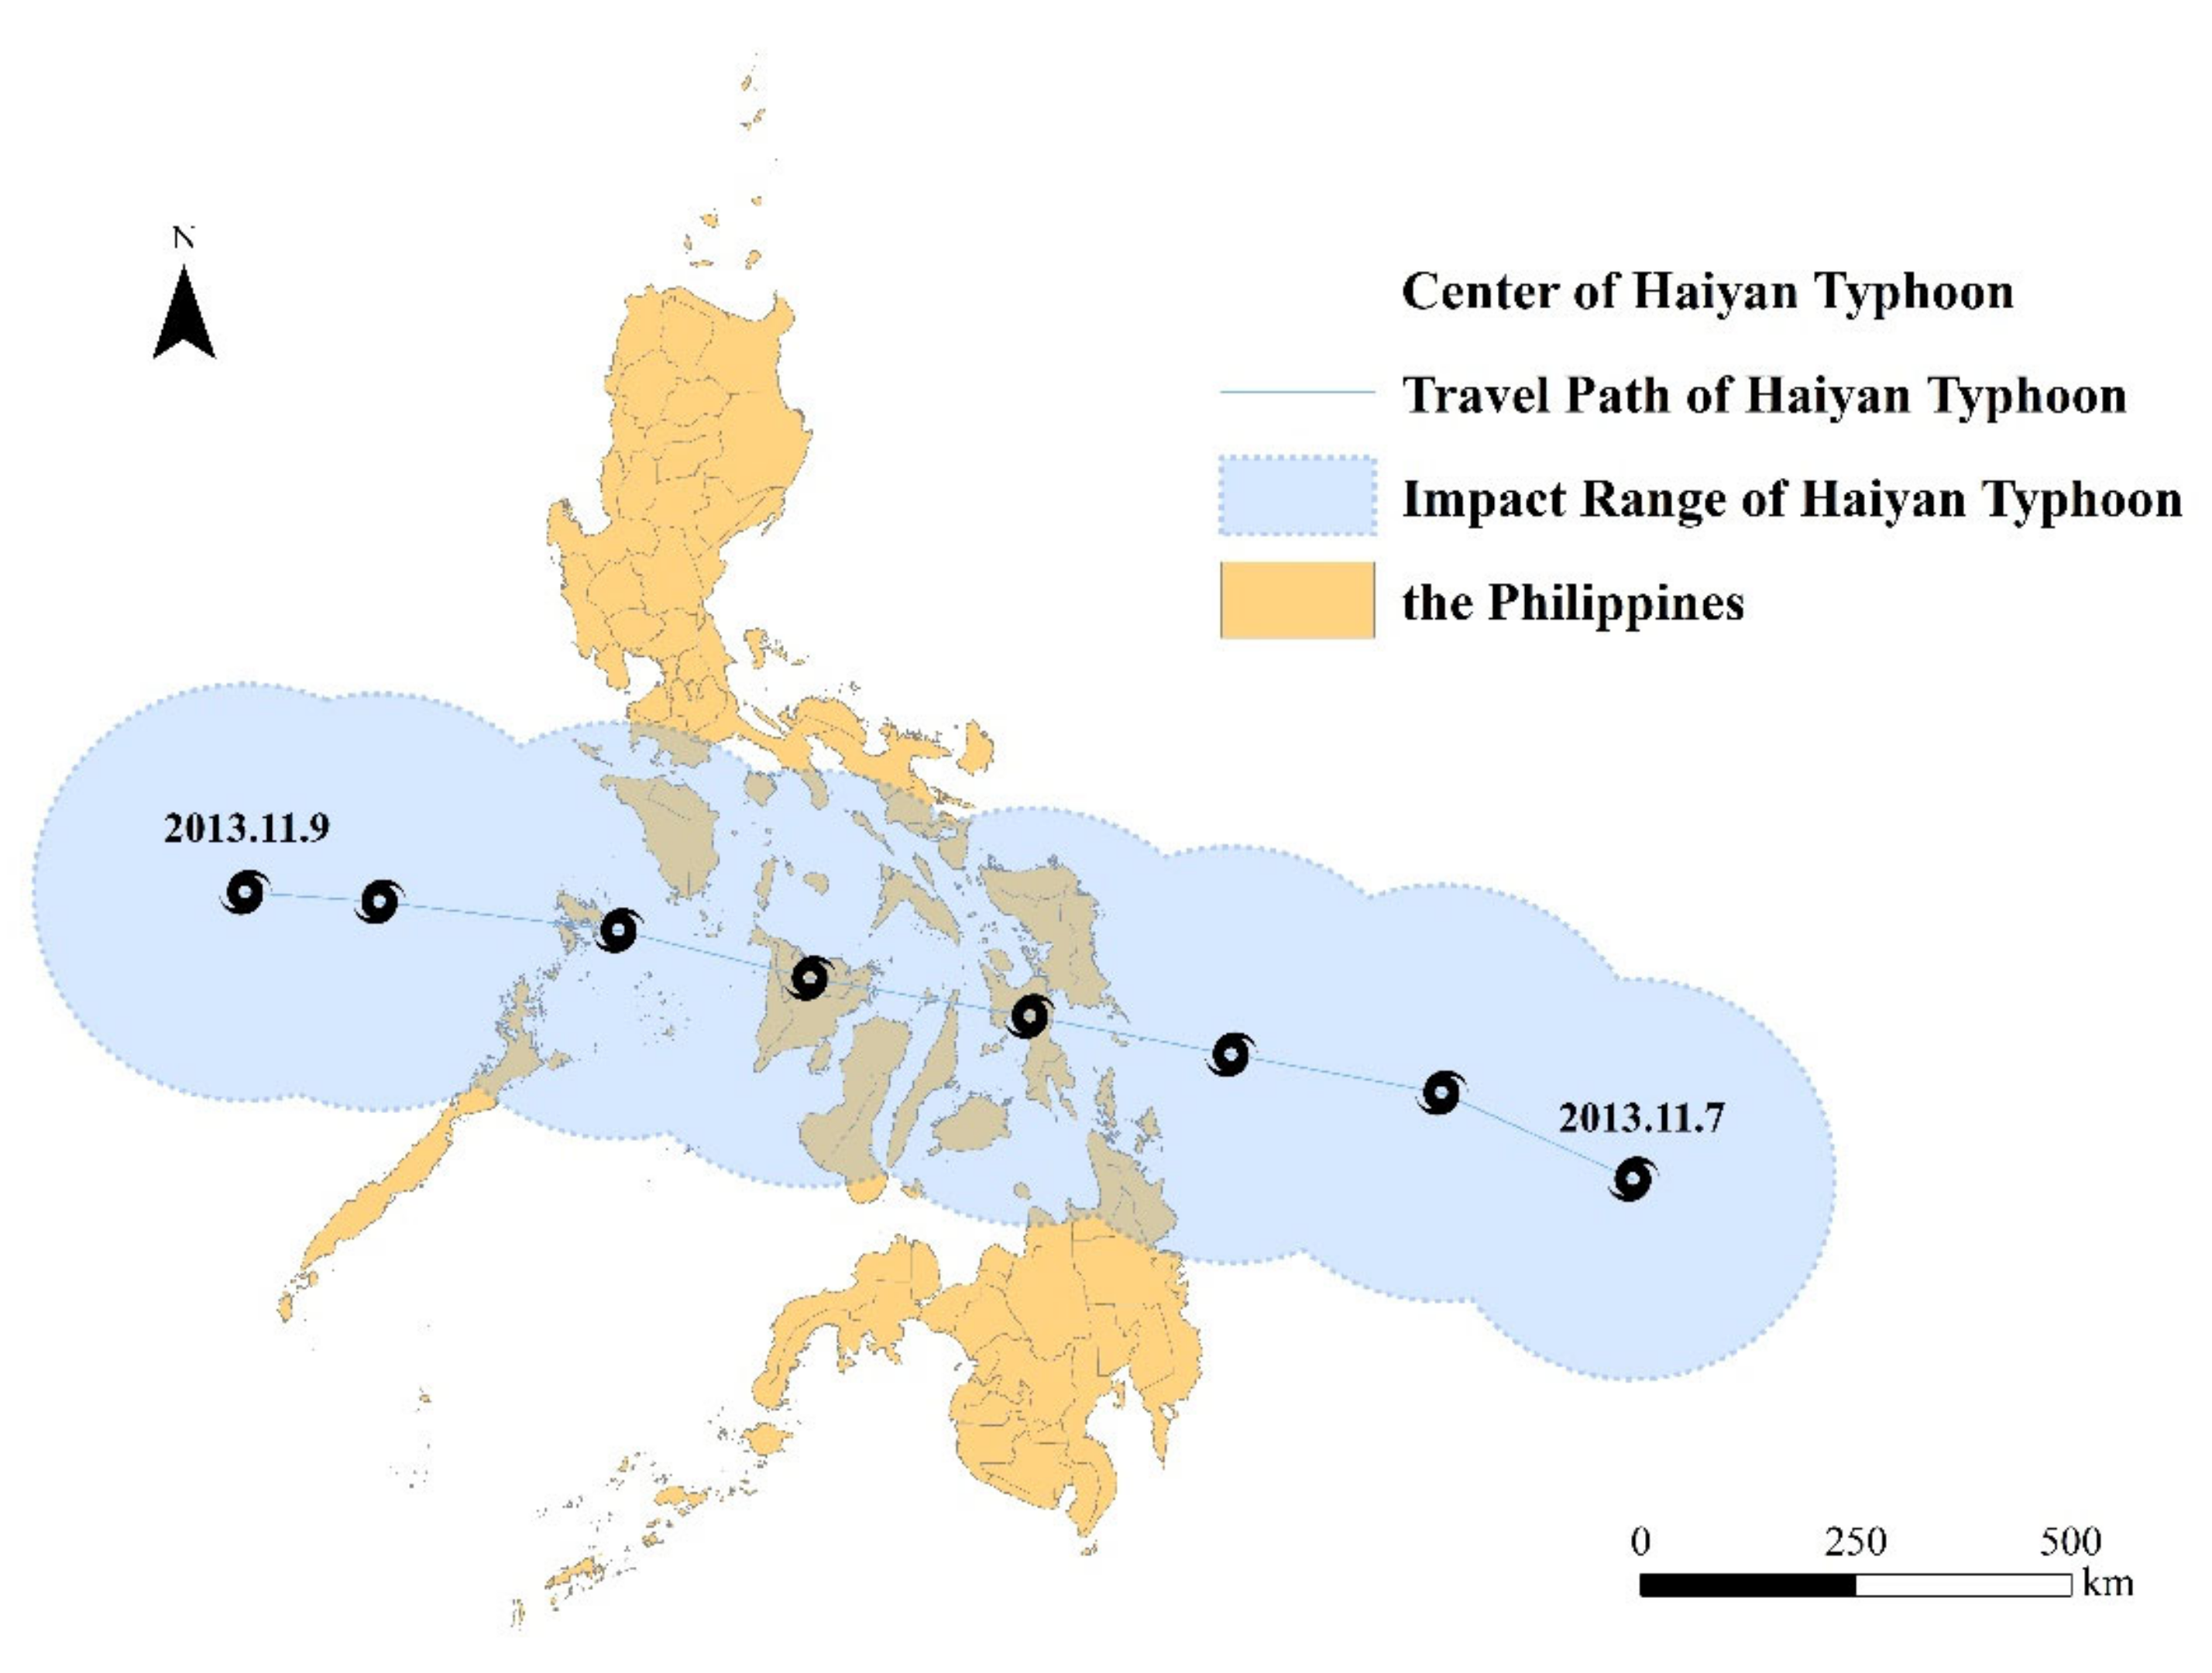
Because of its location in the tropical Pacific, archipelago (i.e., a group of islands) topography, and dense coastal population, the Philippines (
Figure 1) is one of the most vulnerable countries to climate change and typhoon disasters [
20,
39,
47,
48]. The Philippines also has a large share of Twitter users in the world.
3.2. Case Description
Typhoon Haiyan, also locally known as Yolanda, was a category five super typhoon that struck the Philippines in 2013 [
39]. It formed in the West Pacific on 3 November 2013, made its first landfall on November 8 in Guiuan, Eastern Samar, and exited the Philippines on 9 November (
Figure 1). It had maximum sustained winds of 215 kph near the epicenter. In terms of damage to properties, moving speed, and intensity, Haiyan is the strongest typhoon ever to have hit the Philippines and made landfall in the Western North Pacific, causing 6300 total deaths and cost USD 957 million in economic loss [
49].
Haiyan’s enormous damage and impact attracted considerable global attention. After the disaster, massive international news media tracked and reported the situation on time [
20]. Celebrities and influencers actively reposted and spread messages related to the disasters. Relief organizations provided substantial relief supplies to the Philippines. Additionally, 10% of the Filipino population lives outside the Philippines, and these people rely on social media to stay in touch with family and be notified of communities at home [
23].
3.3. Data Collection and Preprocessing
We grabbed and took screenshots of tweets about Typhoon Haiyan from the Twitter website using a crawler program based on our previous research [
36,
39,
50,
51]. We downloaded 572,760 tweets, filtered by excluding messages that did not include the 21 hashtags listed in
Table 1.
The hashtags in
Table 1 were grabbed and filtered out according to (1) having a high frequency (i.e., 50 times in our research), (2) not having appeared before the disaster event, (3) being classified as the disaster hashtag using a support vector machine model, and (4) not being universal hashtags (e.g., #flood, #storm).
By removing duplicate tweets and users and tweets without time information, we finally obtained 411,738 unique tweets that appeared between 2013 and 2016. From 7 November to 1 December 2013 (from the day before the landfall of Typhoon Haiyan to the end of the month) is selected as the study period. There were 375,245 tweets posted during this period. Following the previous similar approaches [
36,
39], we employed the Biterm Topic Model (BTM) to extract the tweets’ primary topic (e.g., ‘reconstruction,’ ‘disaster situation,’ ‘demand,’ ‘praying,’ and ‘others’). Then, we invited experts with natural disaster knowledge to identify topics related to Typhoon Haiyan. We excluded non-related topics and the corresponding tweets, after which we identified 301,746 related tweets.
Note that one tweet may contain multiple hashtags. Additionally, the Chinese mainland was excluded from the following analysis because it could not access Twitter directly. However, we did not include registered users and tweets geolocated in the Chinese mainland. Additionally, there are non-English tweets in the resultant, and they were converted to English using the Google translation service.
The resultant tweets included information about the location (i.e., geotagged or geolocated information), time of posting tweets, hashtags, and whether the post was a retweet. In addition to the tweets, we also collected public user profiles, including user ID, the user registered location, user location, and screen name, from Twitter. The users were anonymized to protect privacy.
3.4. Construction of the OSN
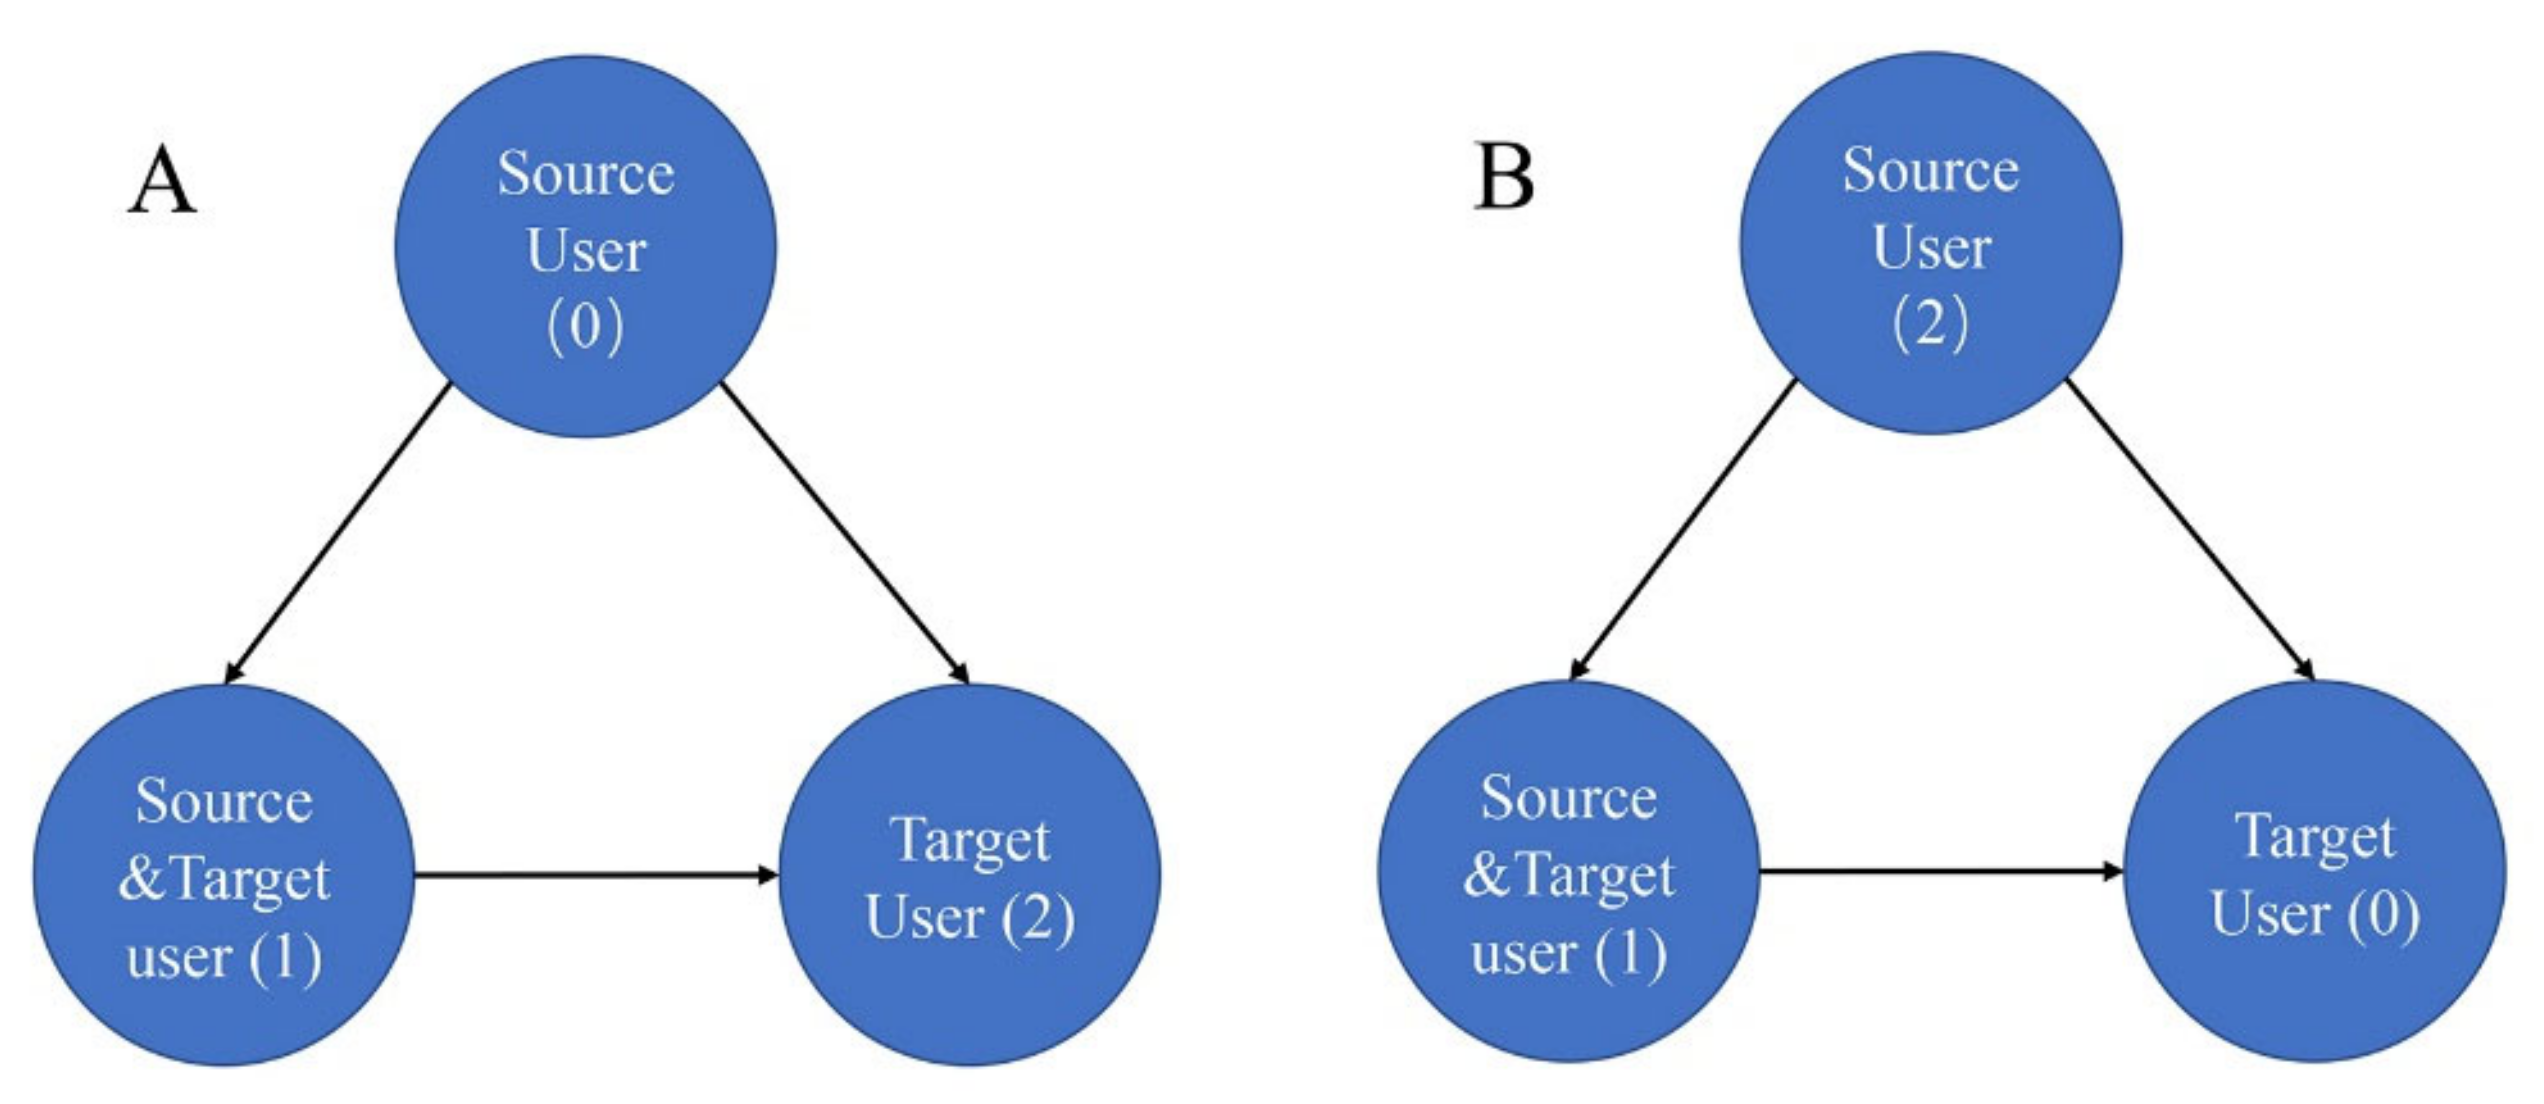
The OSN was constructed according to the retweeting and being-retweeted relationships. Retweeting relationships demonstrate social media users’ behavior of forwarding other users’ tweets (
Figure 2).
Figure 2 illustrates the conceptual structure of a retweeting network. The vertices represent users, and the arrow lines indicate the retweeting relation. The arrow lines point from the source vertices to the target vertices. Source vertices are the users who forward tweets, whereas target vertices are the users who post tweets and have their tweets forwarded. The numbers of vertices in
Figure 2A,B depict in-degree and out-degree, respectively. The vertices’ out-degrees present how many times the users forward the tweets from the source users. Accordingly, the in-degrees indicate the number of times the tweets were forwarded from the source users.
The out-degree distributions depict the enthusiasm of participants in the OSN for forwarding the information from other users. The in-degree distributions demonstrate the influence of the messages in the OSN. The edges between vertices represent the retweeting relations. The network software Gephi [
52] was used for network visualization and analysis.
Even though social media user relationships usually come in different forms, we focused on relationships between users who forwarded tweets and had their tweets forwarded because this type of retweeting behavior demonstrated the influence of the source tweets and the connections between the two users. Additionally, retweeting behavior may be more meaningful and practical than direct replies to the original tweets. Retweeting indicates that users prefer to read one tweet over another [
53], and we could determine whether a tweet has been read when a user retweets that particular tweet. Therefore, more active users can see more new tweets and thus interact with more tweets [
54]. For instance, foreign citizens or organizations forward information about local disasters to reveal their interests and interactions with the disaster and its location.
Unlike other research examining initial tweeting networks [
13,
20,
41,
55], which retained only those links that appear once daily on a social network, our method retains the edges of the retweeting network from the date it was created to the end of the study period (1 December 2013). In this manner, this research showed that social networks could demonstrate the cumulative influence of tweets and reflect practical OSN patterns.
Therefore, the constructed OSN consists of the vertices representing a social media user, and the links (edges) represent the retweeting relation. Usually, the retweeting social network is also a directed graph. Formally, a directed graph G is defined as an ordered pair , where V is the set of vertices and E is the set of directed edges. Vertices had an out-degree and an in-degree distribution.
3.5. Geocoding and Geovisualization of the OSN
Before geovisualizing the OSN, we first geocoded (i.e., translated the description of locations to geographic coordinates) the tweets. If the tweets included coordinates, we could locate them directly. The tweets that did not have coordinates but that had geotagged information (i.e., tags with specific location names) or toponym (i.e., a place, location, or the region name in the tweets) could be located through the geocoding program.
Because only a few tweets directly contained specific location information (e.g., geographic coordinates, geotagged information, or geolocated information), we identified the users’ geographical location as the tweets’ locations. The resulting dataset contained 176,382 unique Twitter users, of which 113,099 (64%) included geographic location information. We determined users’ specific geographic locations according to where the tweet was released or registered the user’s account. Hence, the same user’s tweets could be located by decoding the user’s geographic information using the Python package “geopy” and the Google Geocoding Application Programming Interface (
Figure 3). Google Geocoding API provides a web service for geocoding, which is the process of handling the textural location descriptions (e.g., the address or the name of a place) to return geographic coordinates.
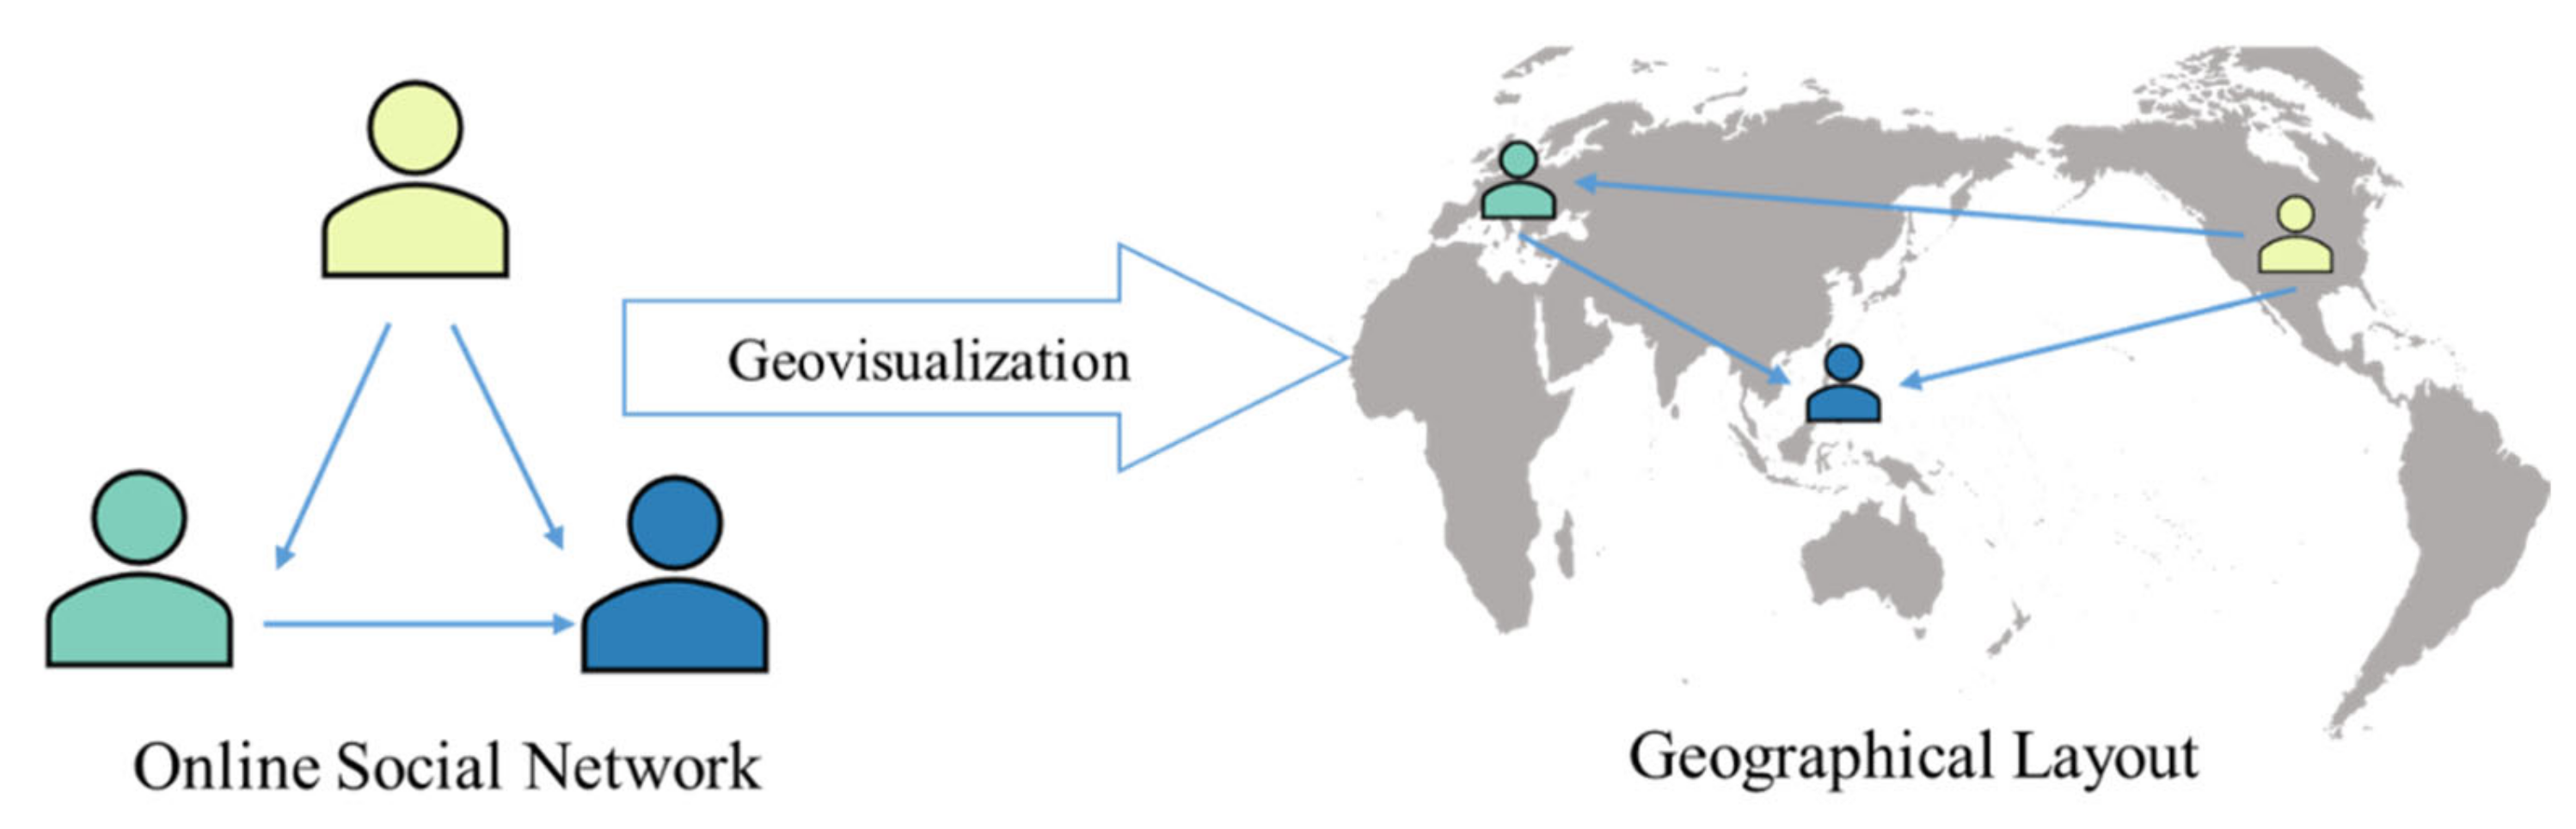
If the users had precise geographic locations, then the retweeting network for each day could be projected into the physical world (
Figure 4). This process is called geovisualization. We located the directed social network’s vertices and drew them onto the geographic layout based on the geocoded Twitter users using Quantum Geographic Information System (QGIS) VERSION 3.16. The arrows represent directed edges, which indicate the relationship between retweeting users and original users, which also could be mapped by connecting two vertices. For example, the directed arrow pointing from the yellow user to the blue user and the green user demonstrated that the yellow user forwarded the source tweets from the blue and green users.
3.6. Network Analysis
The probability distributions of the vertices’ degrees reflected the retweeting network structure. The degree of a complex network indicates the number of edges linked to a vertex in the network. When the edges of a network have directions, the network becomes a directed network, and the degree of a vertex could be divided into in-degree and out-degree. The in-degree was the number of edges to a vertex from other vertices. The out-degree was the number of edges from a vertex to other vertices. For a complex network, if its degrees’ probability distribution followed a power law, the complex network was called a scale-free network [
56]. The complementary cumulative distribution function (CCDF) characterizes random variables’ probability distribution, which exceeds a given threshold. Because CCDF is robust to outliers and detects power-law distribution accurately, we selected CCDF to investigate the network characteristics.
If the retweeting network was a scale-free network, the degrees followed a power-law distribution [
56] (Equation (1)):
where d is the Twitter users’ degree, and α is the scaling exponent. When α < 2, the distribution has an infinite variance; when α ≤ 1, the mean of the distribution also diverges.
4. Results
4.1. The Temporal Changes of OSN User Activities
The out-degree distributions showed power-law distributions (see
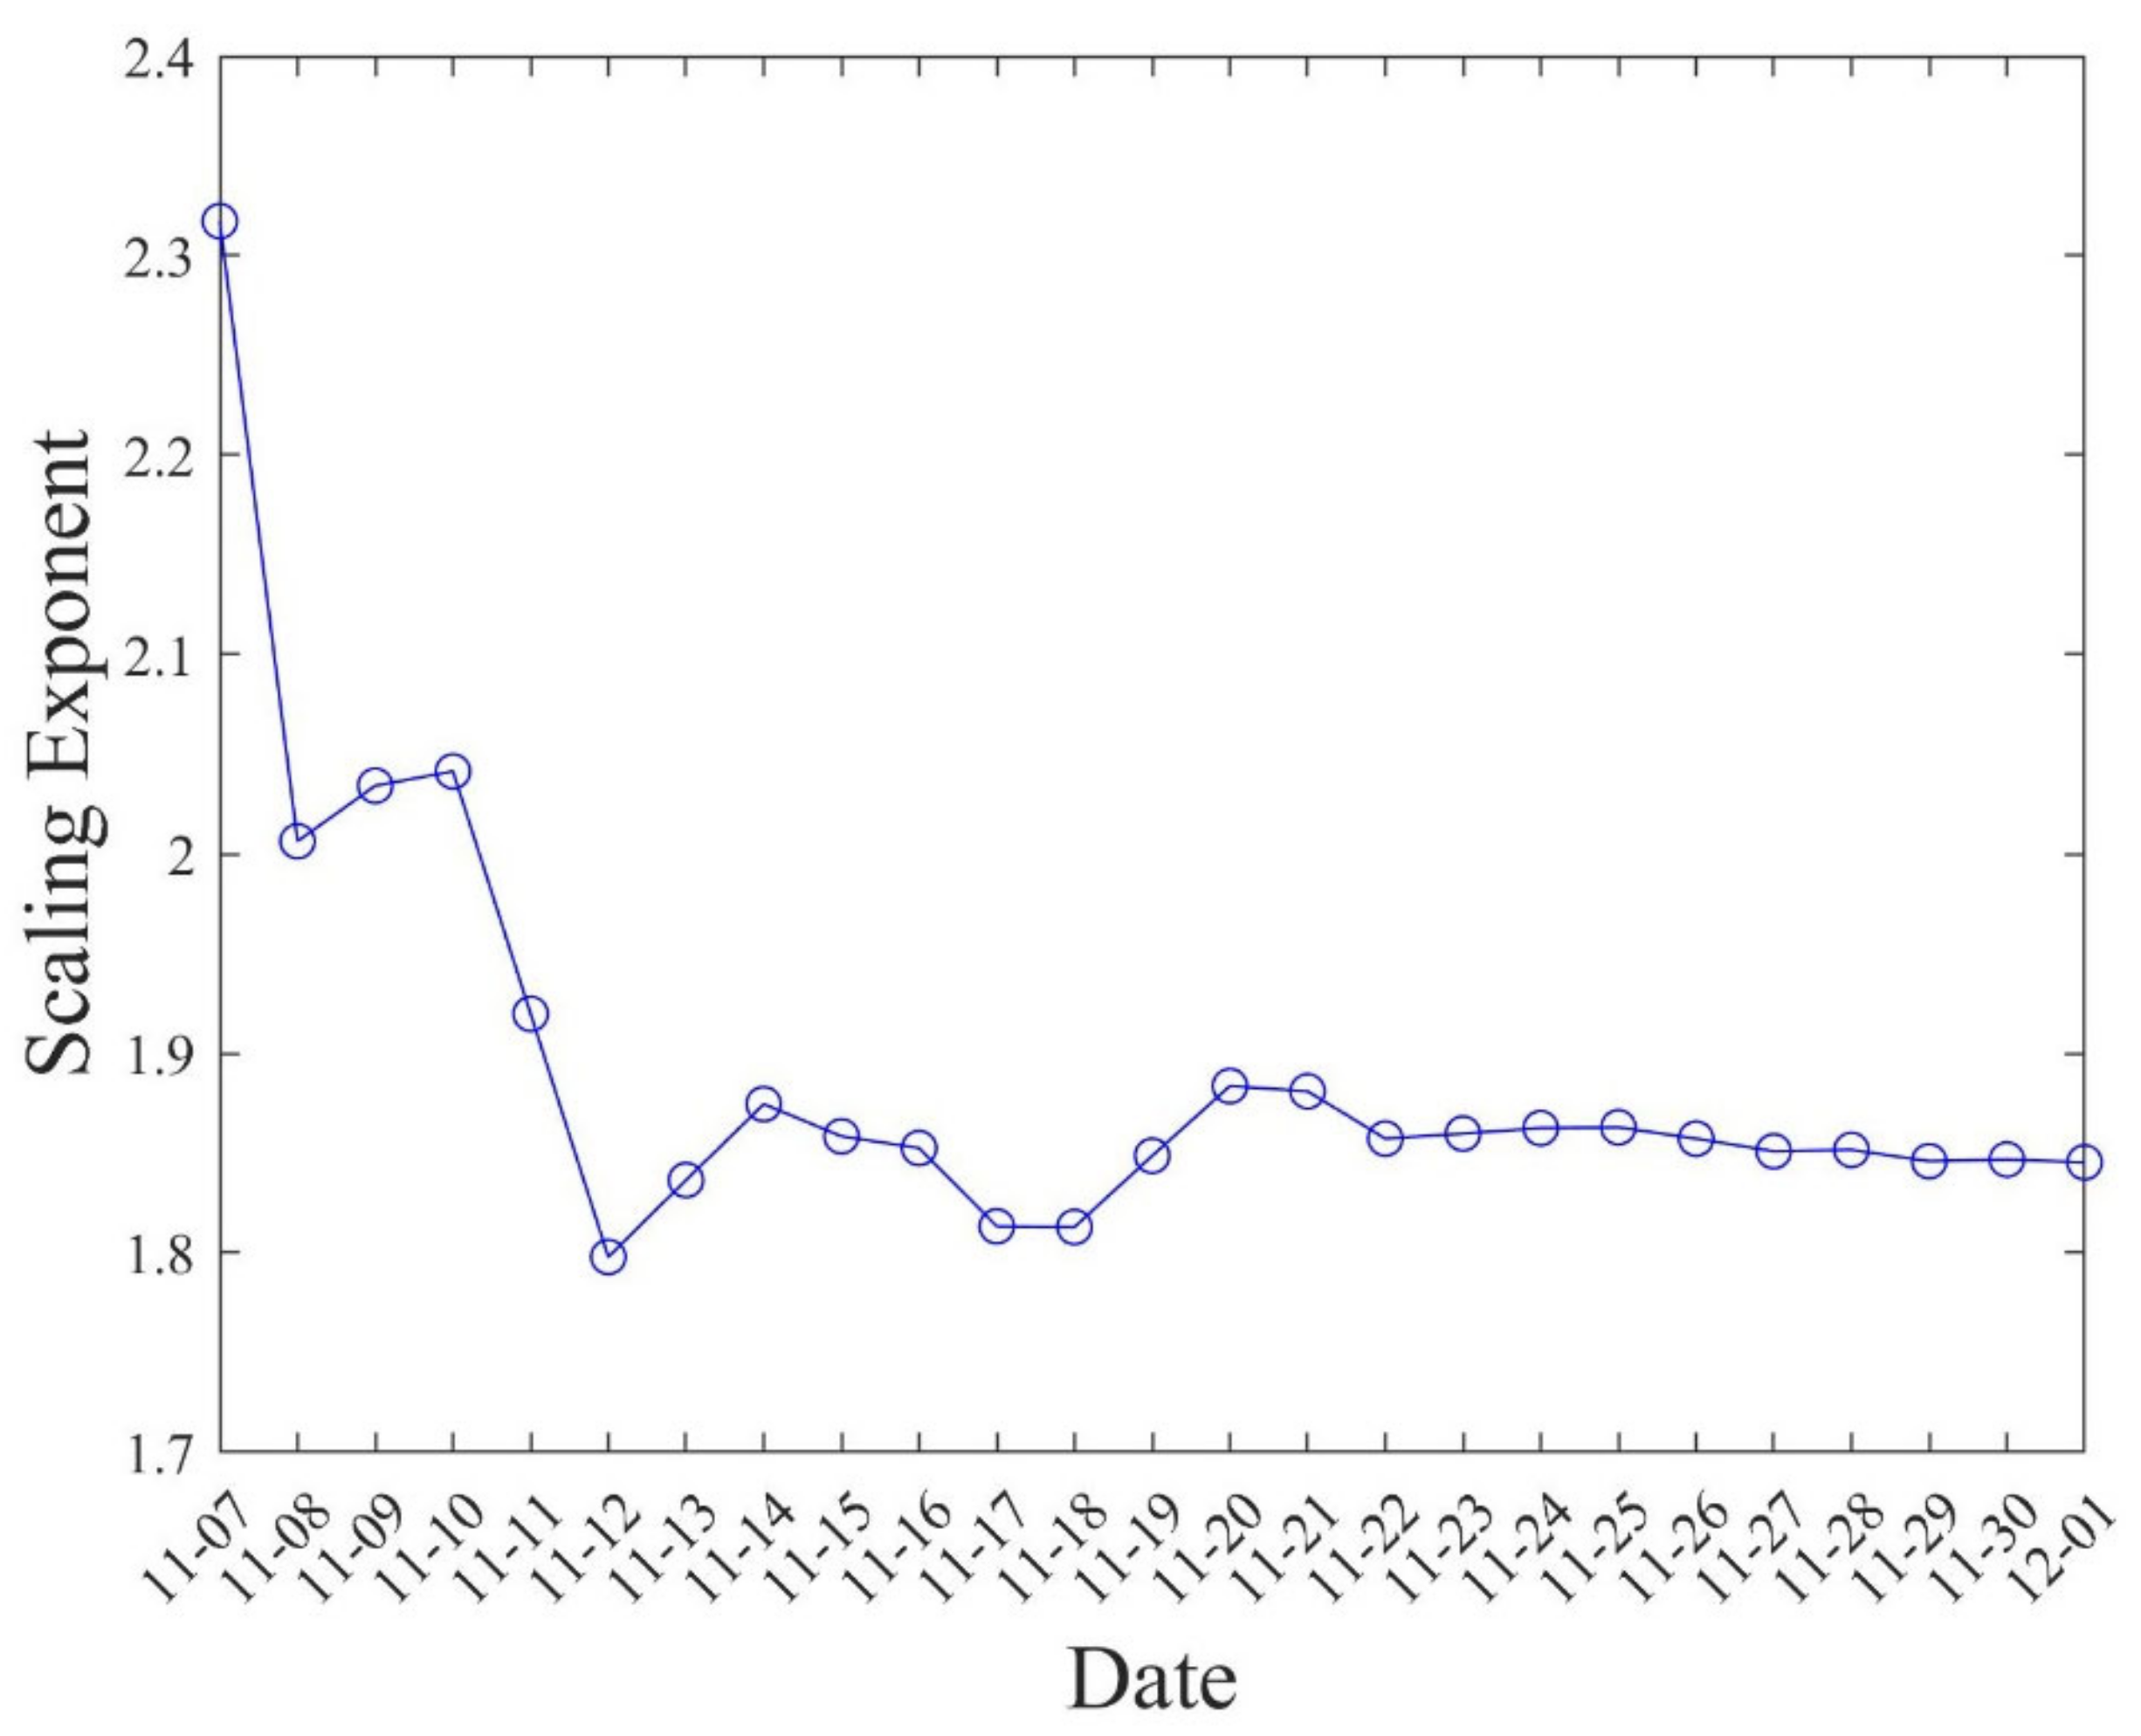
Supplementary Material), indicating that the retweeting network was scale-free. We generally divided the out-degree development into three phases (
Figure 5). The first phase, the initial period for the retweeting network, was from 7 November to 10 November 2013. The scaling exponents during this period were more significant than two, indicating that the retweeting behavior varied significantly because of people’s different concerns regarding the typhoon.
The second phase was from 11 November to 20 November 2013. The scaling exponents fluctuated between one and two, showing that the devastating impact of the typhoon attracted the broad attention of OSN users. In addition, calls for rescue supplies and operations increased along with the number of messages and reports of the disaster.
The third phase was after 20 November 2013; during this period, the scaling exponents remained stable and were greater than one, indicating that the disaster was under control, and the OSN users maintained active retweeting behavior.
The in-degree distribution illustrated the characteristics of the being-retweeted network and indicated the influence of messages posted by social media users. The in-degree distributions also showed power-law distributions (see
Supplementary Material), which meant that the being-retweeted network also was a scale-free network. This result indicated that the most influential users (the so-called head users) accounted for a small part of the network, and most ordinary users had limited and weak influence.
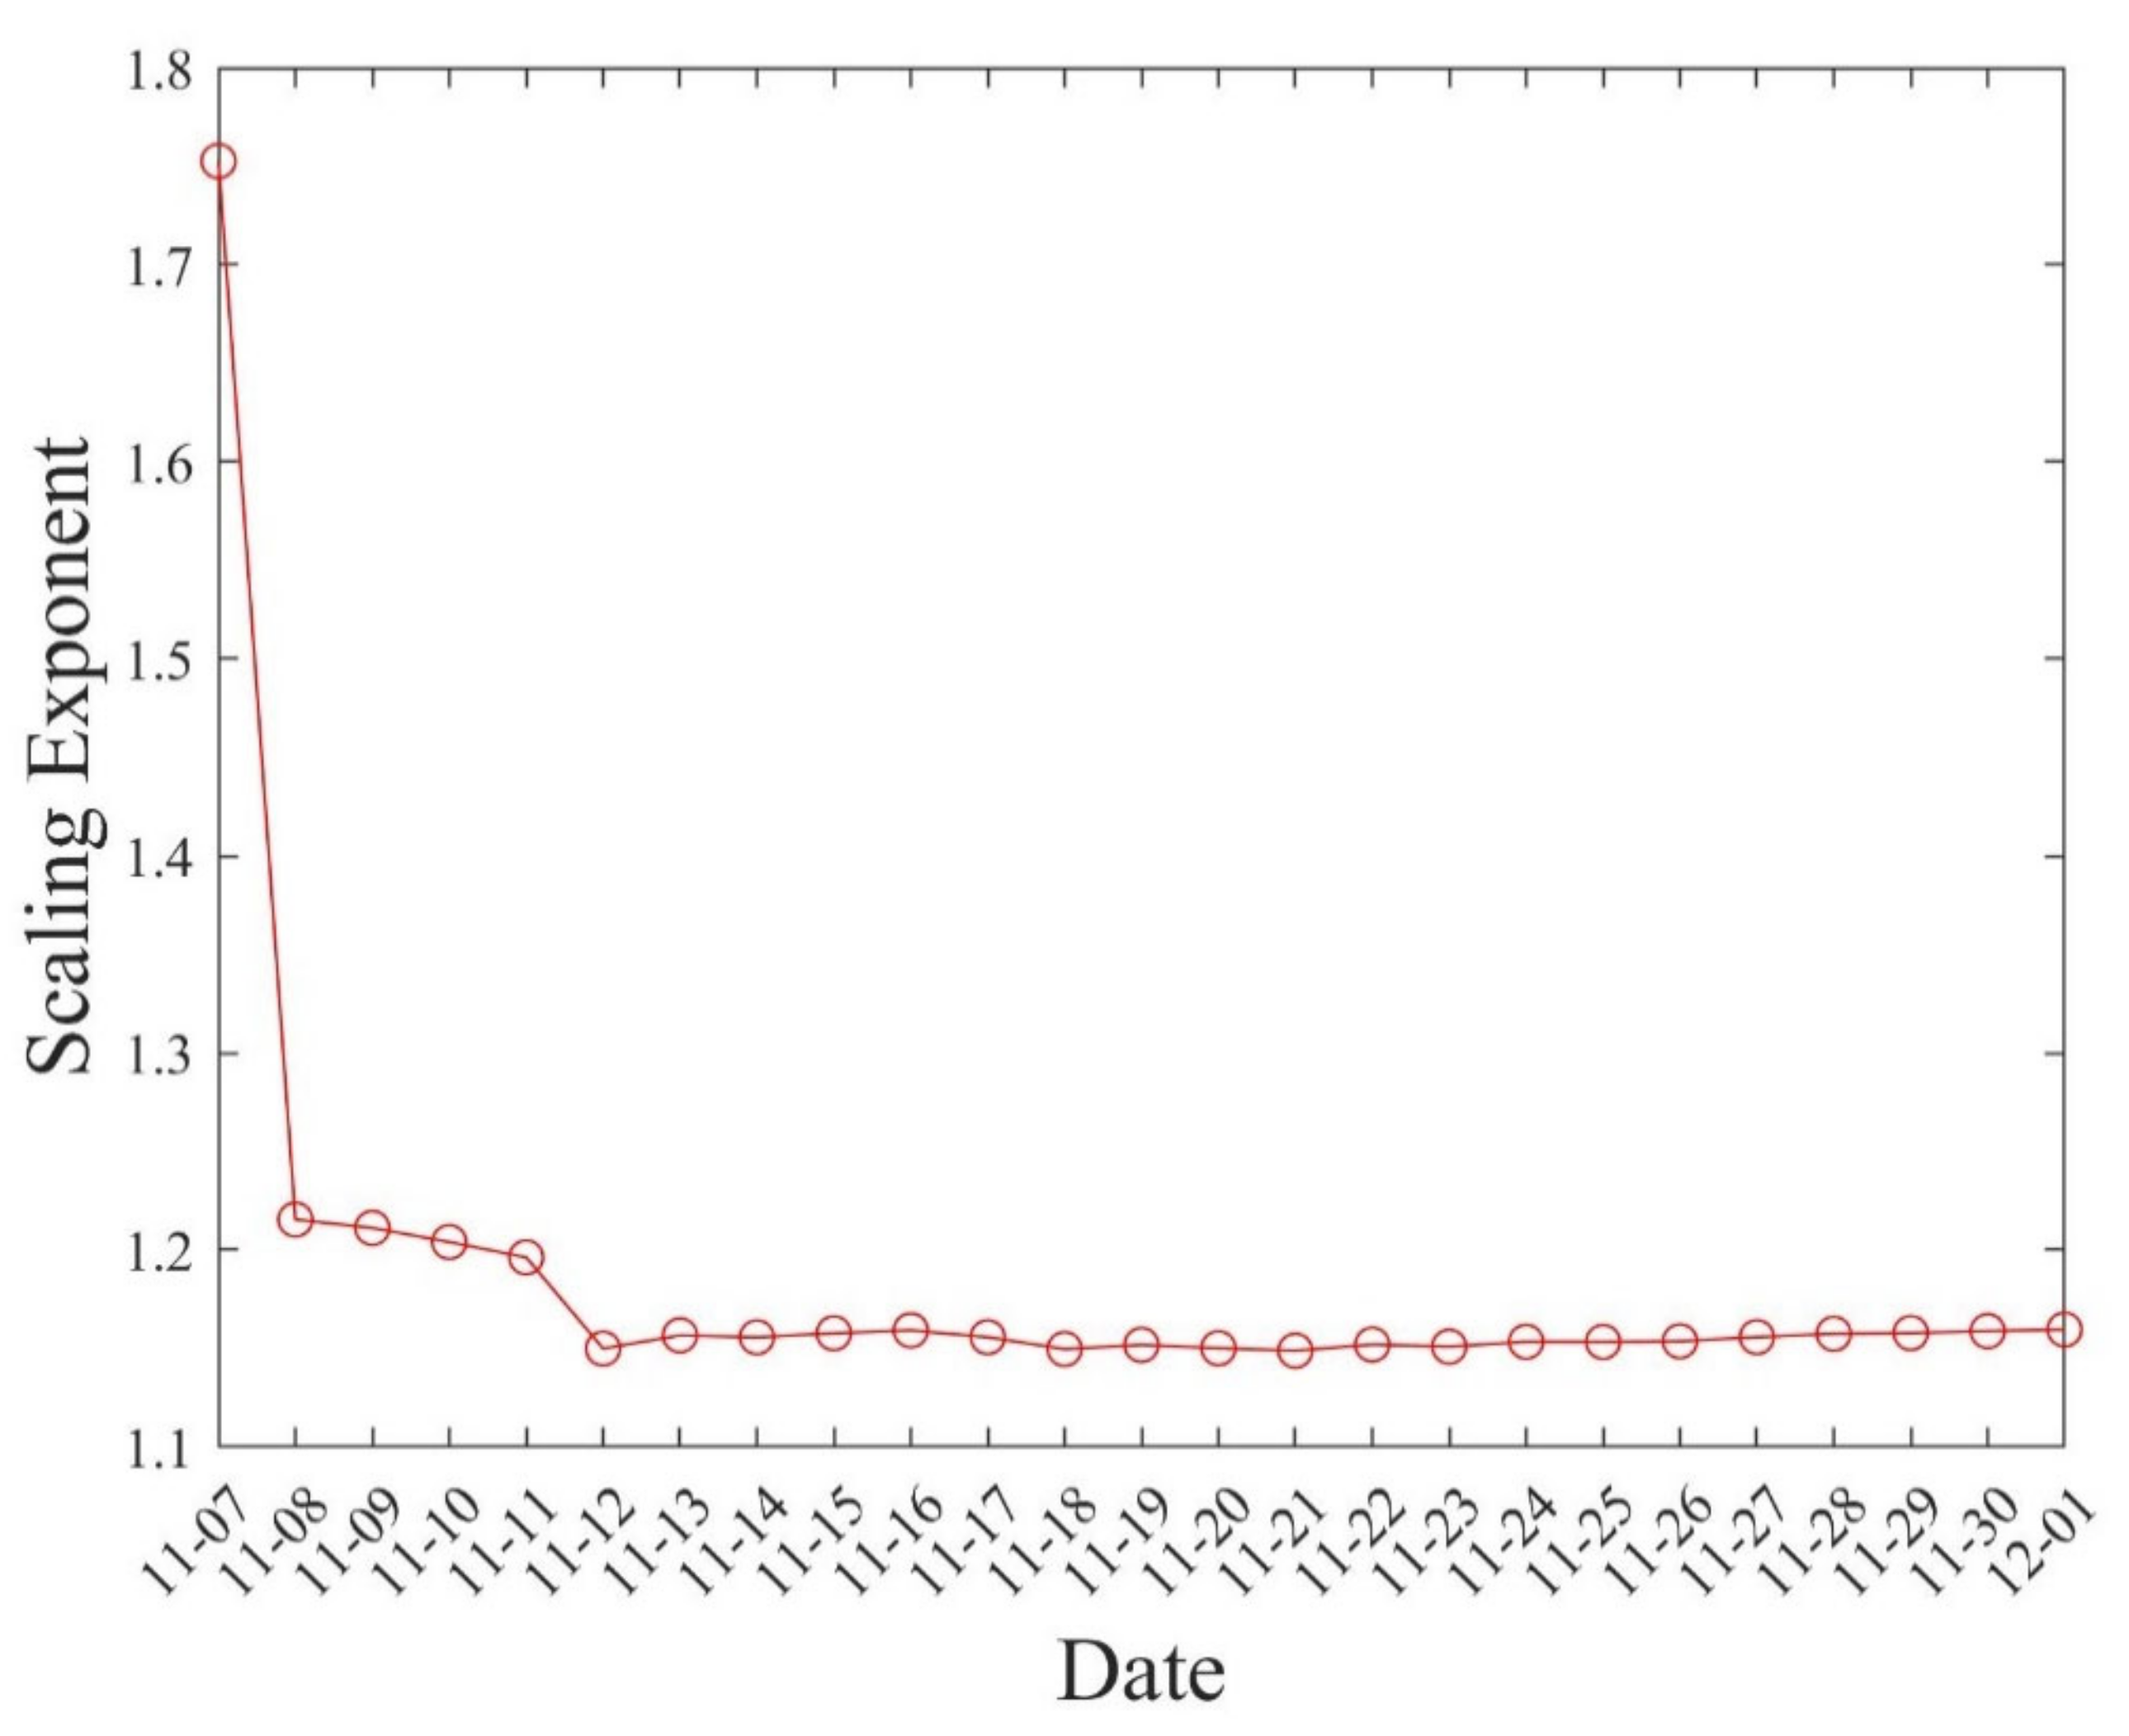
In contrast to the development of the out-degree distribution, the in-degree distribution’s temporal pattern was stable after the disaster (
Figure 6). The temporal pattern of the being-retweeted network also had three stages.
The first stage was 7 November before the landfall of the typhoon. The scaling exponents of the in-degrees were obviously higher, which showed that the source messages received little attention from the broad social media users.
The second stage was from 8 November to 12 November. During the second period, the scaling exponents of the in-degrees dramatically reduced to 1.22 and then gradually decreased, indicating that many of the messages about typhoon warnings and changes appeared on the OSN after Typhoon Haiyan had landed in the Philippines at 4:40 a.m. on 8 November, and the influences of source messages continuously increased as the disaster unfolded.
The third stage was after 12 November. The scaling exponents of the in-degrees reduced to 1.15 and then remained stable, demonstrating that more influencing source messages had arisen, especially messages seeking help and rescue.
4.2. The Spatial Pattern Changes of OSN Users Activities
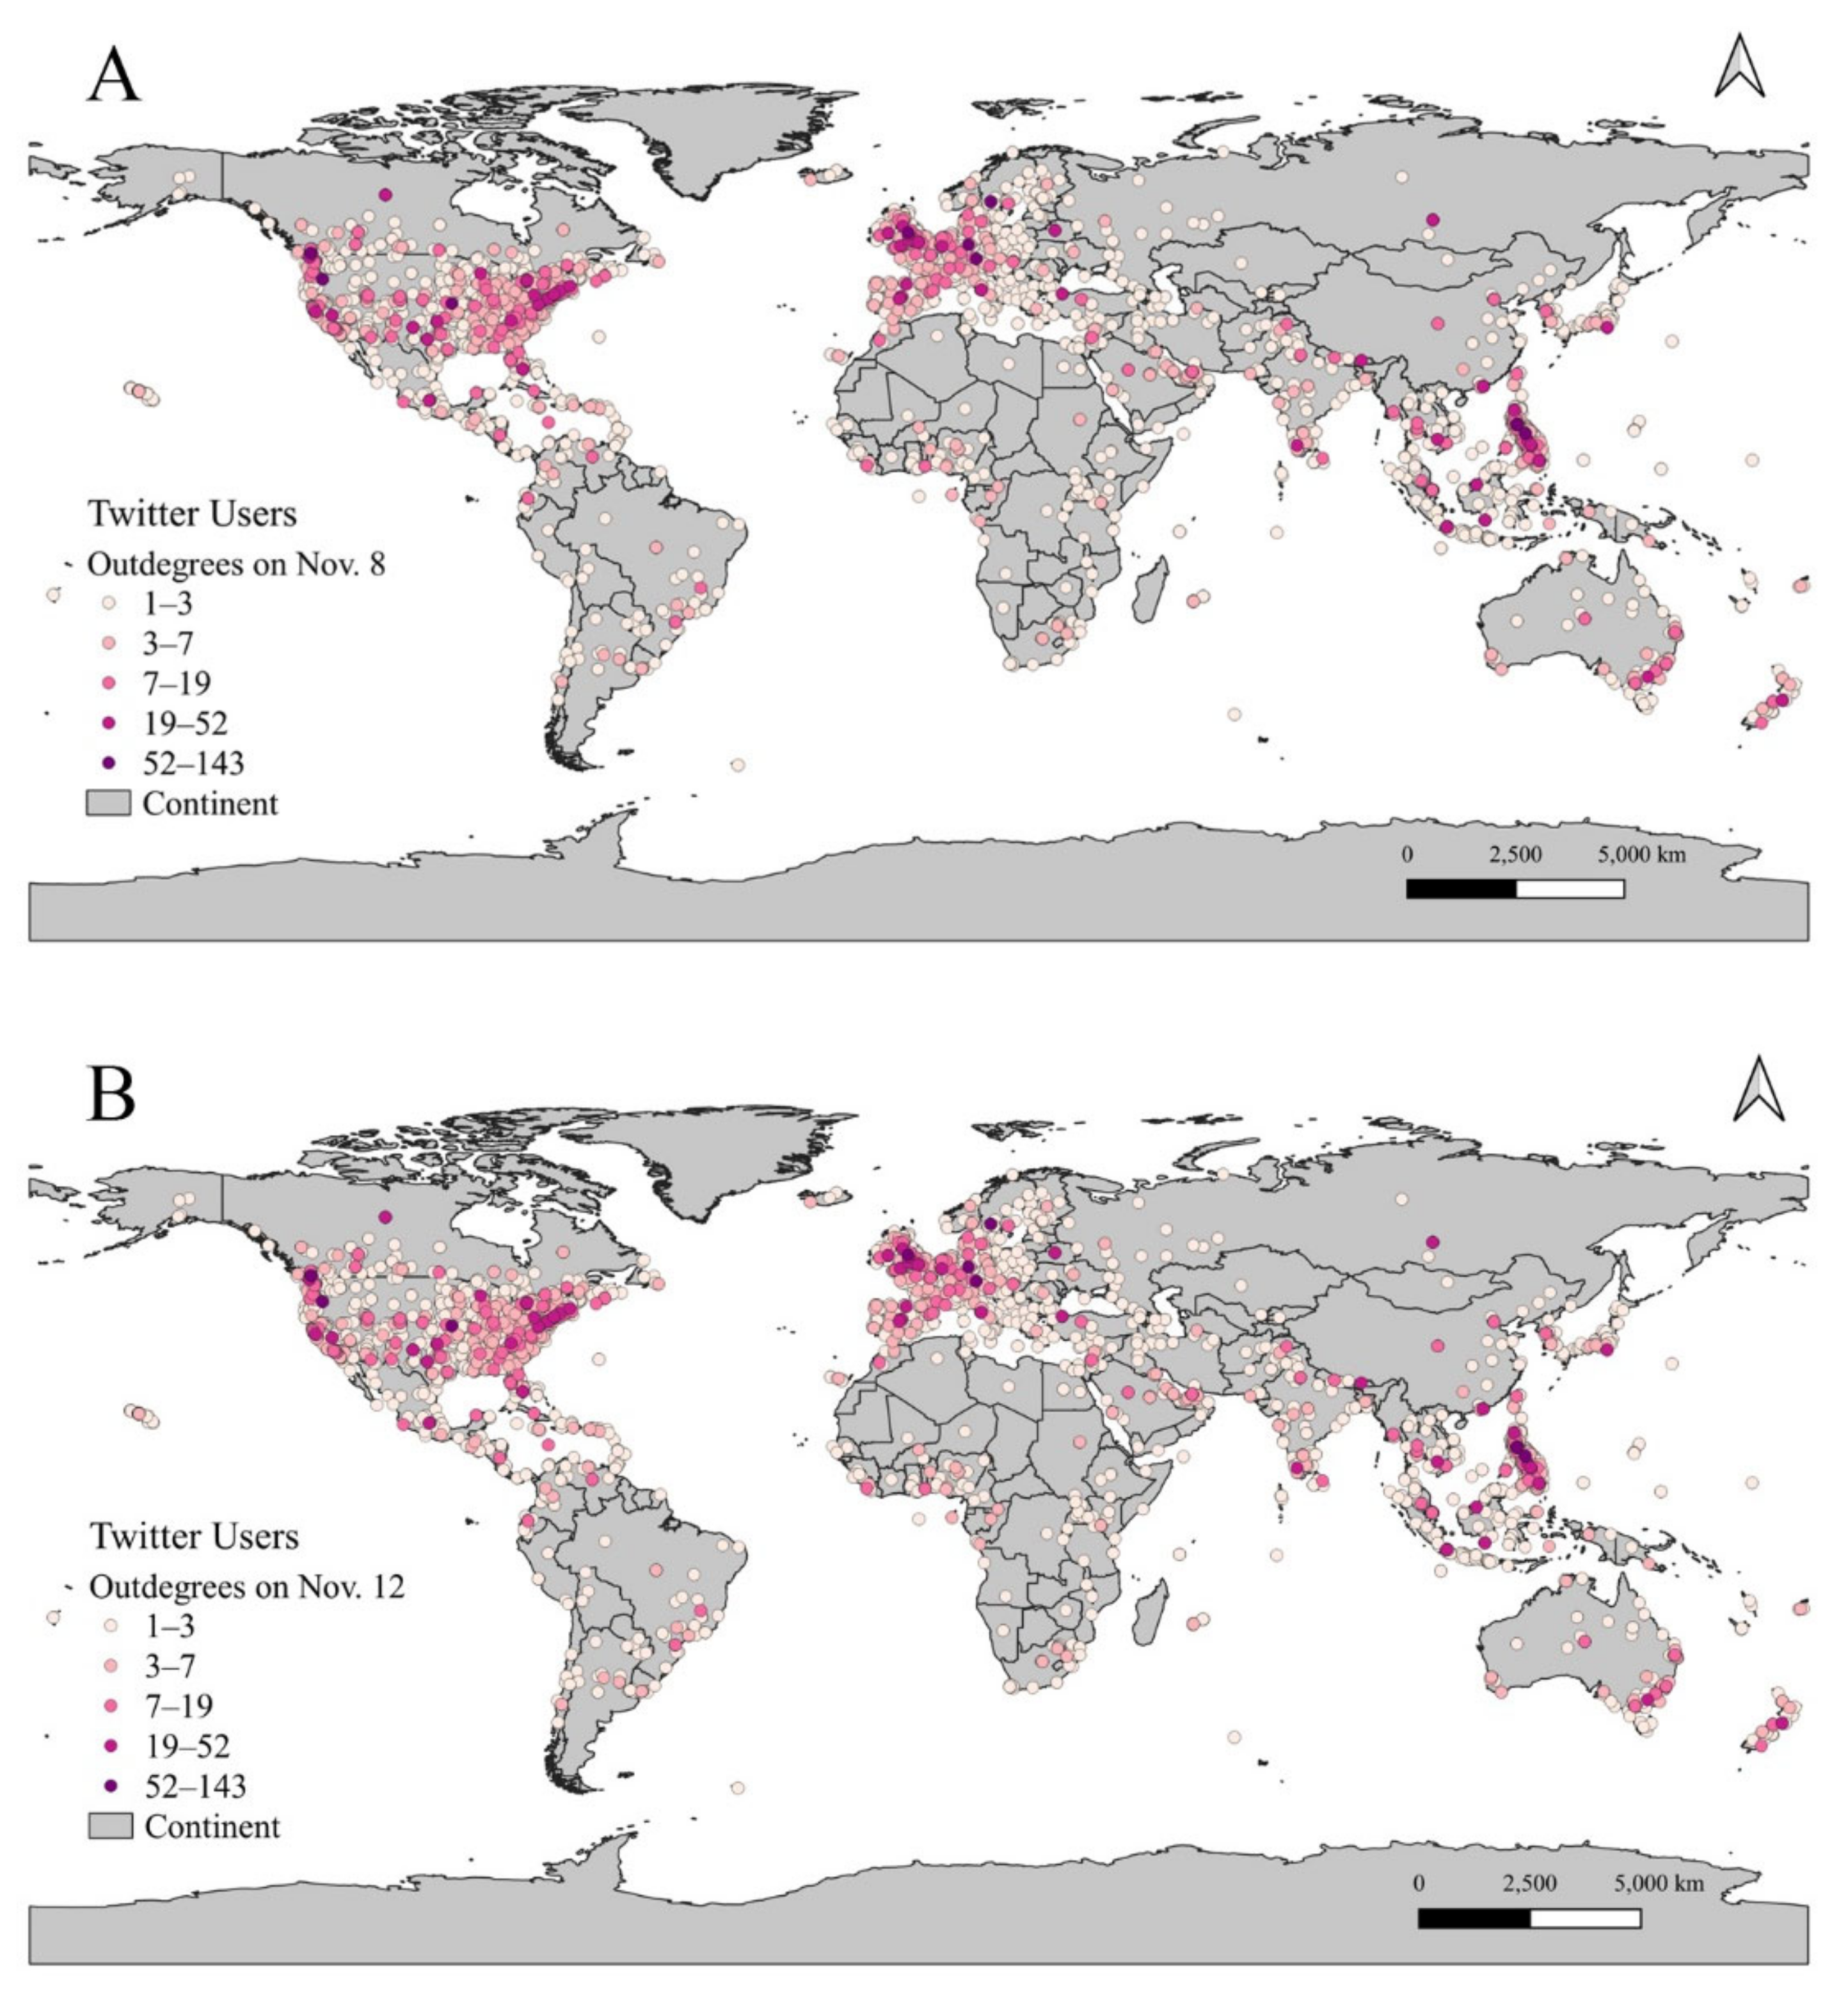
Because the out-degrees follow the power-law distribution, we equally divided the logarithm in 10 bases of out-degrees into five intervals.
Figure 7 illustrates the global geographic distribution of OSN users’ out-degrees on 8 November (
Figure 7A) and 12 November (
Figure 7B). The darkness of the vertices shows the out-degree values.
On 8 November, the users with high out-degrees (>19) were distributed mainly in the Philippines. This phenomenon clearly showed that people in the Philippines cared more about this typhoon than people outside the Philippines at the beginning. On 12 November, however, more users with higher out-degrees (>19) appeared in the United States, Europe, Southeast Asia, Australia, and New Zealand.
Two explanations can be applied to this phenomenon. First, news agencies and various non-government organizations broadcast the impact of the disaster. As a result, a large number of Twitter users in the United States, Europe, Australia, and New Zealand put great efforts into retweeting messages. Second, Twitter users in Southeast Asia actively retweeted messages because of geographic proximity and the severe consequences of the disaster.
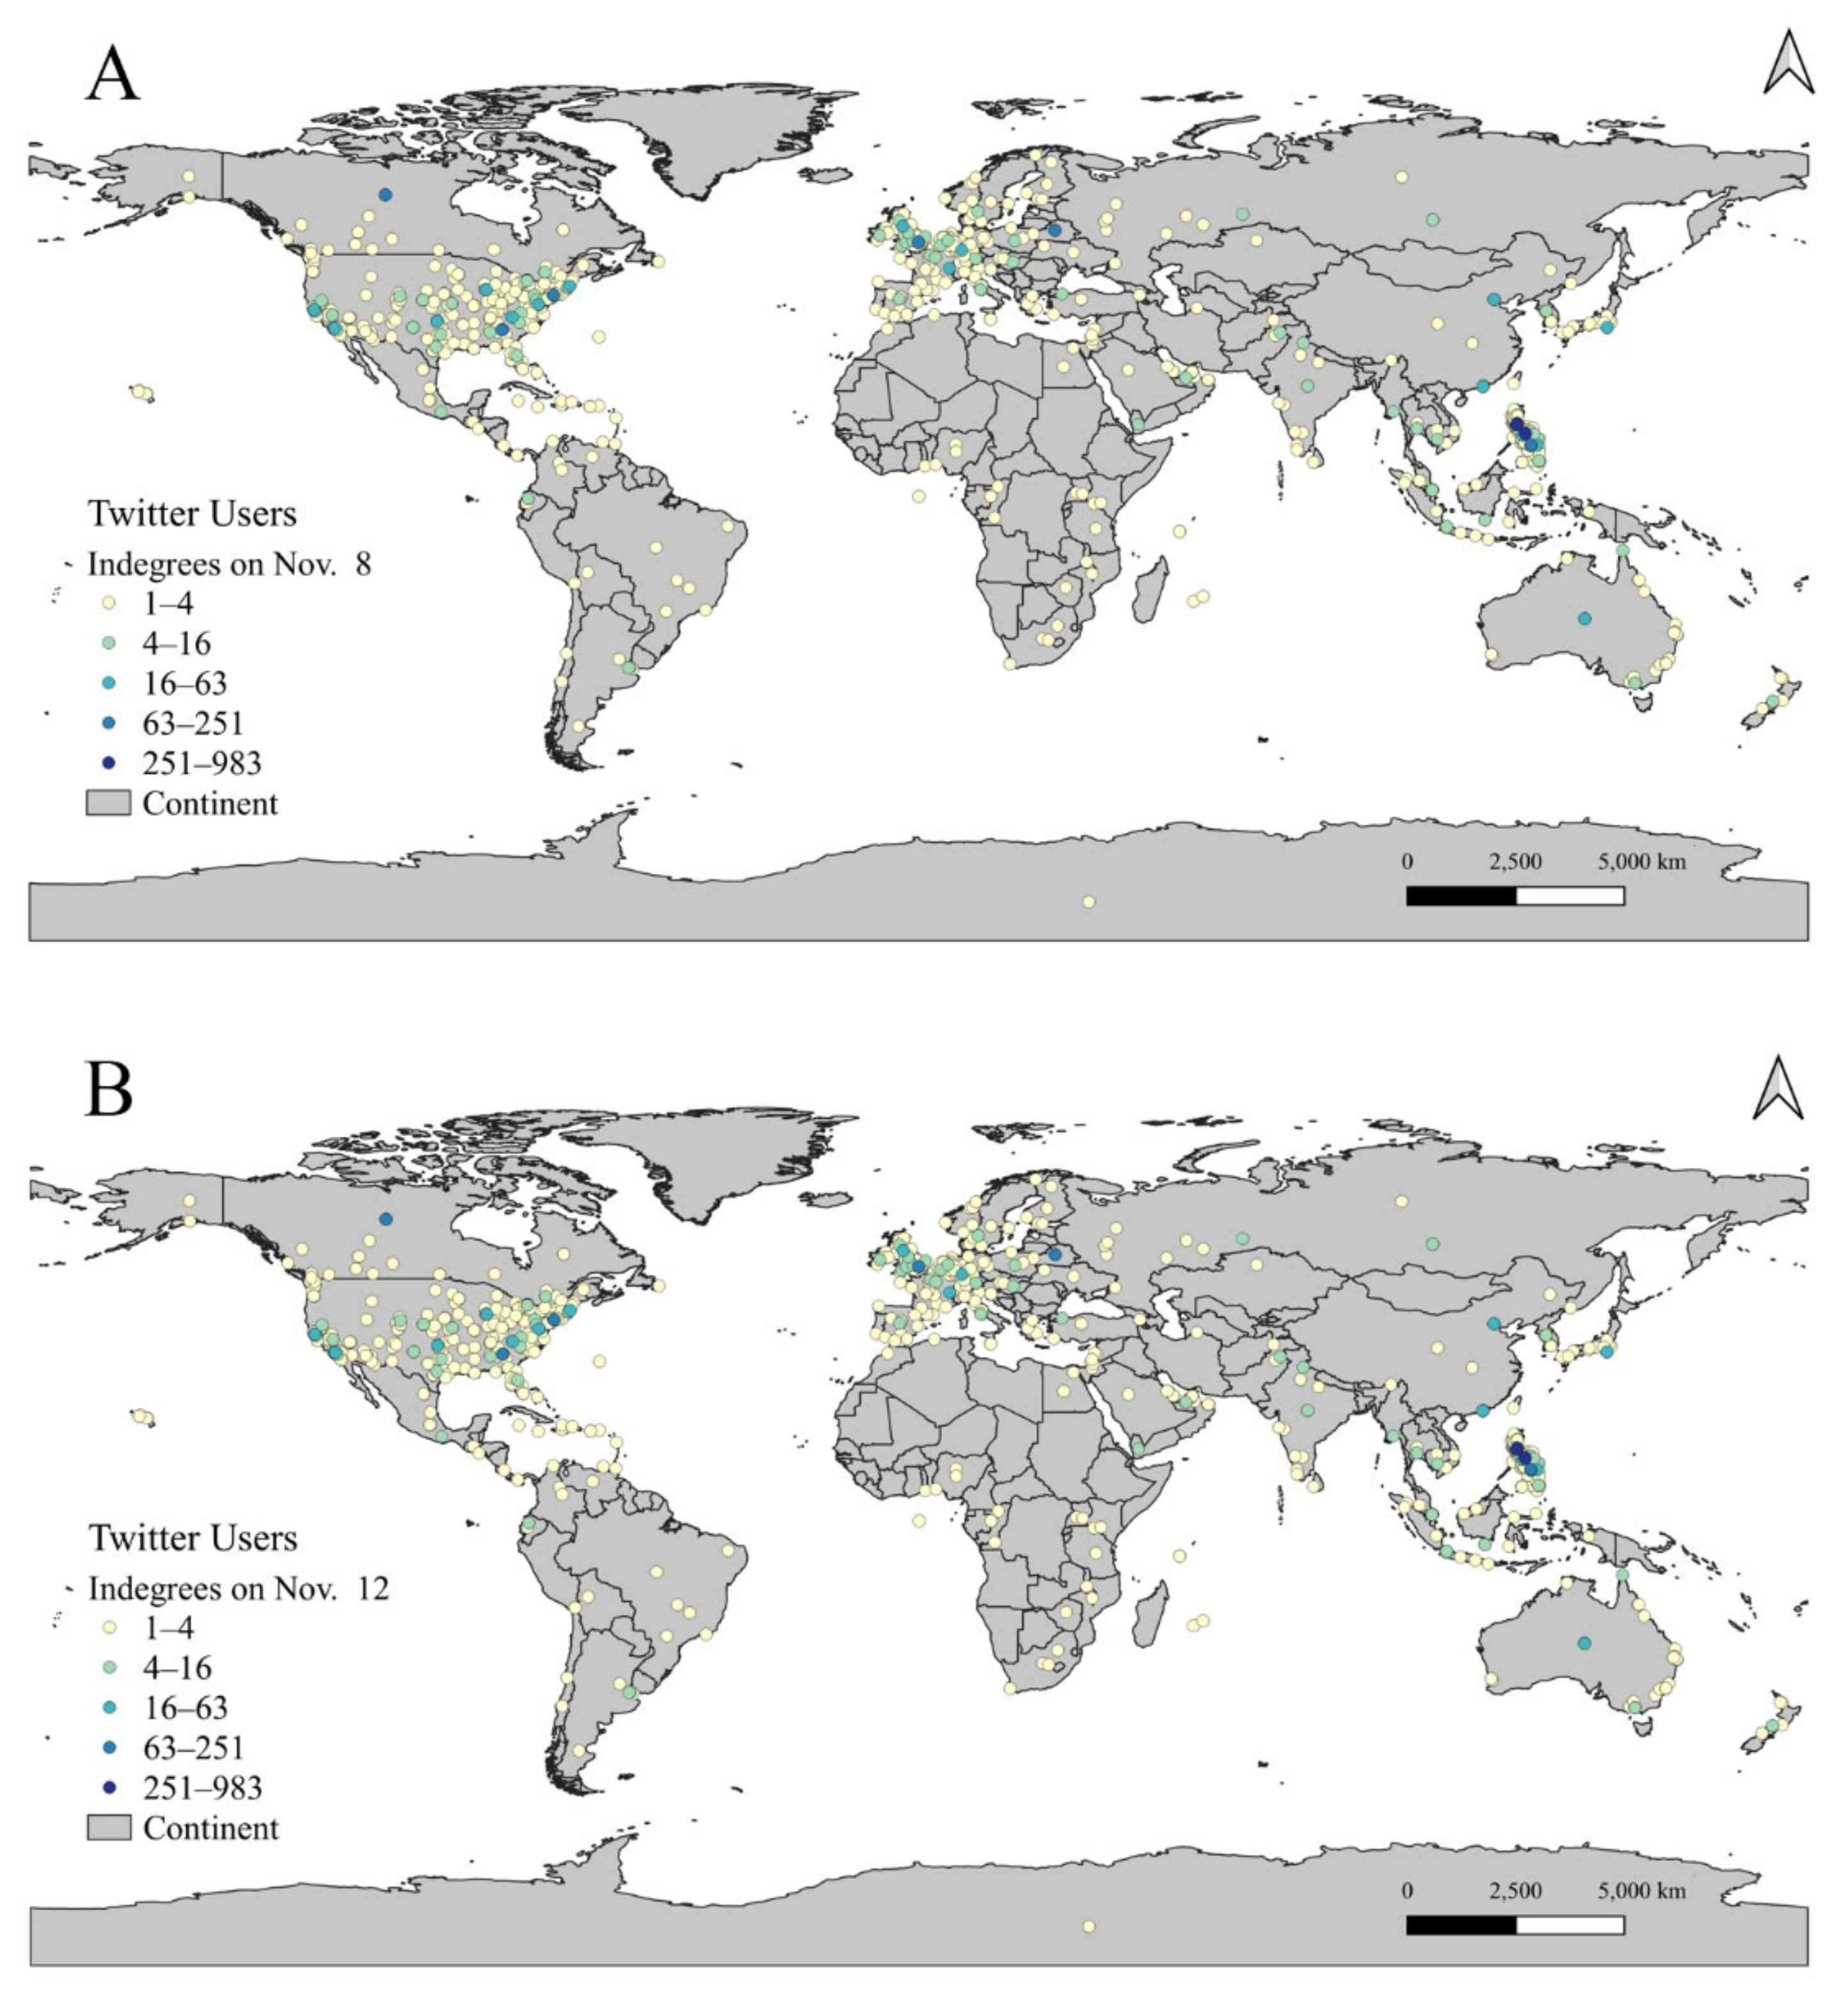
Figure 8 shows the users’ in-degree geographic distribution on 8 November (
Figure 8A) and 12 November (
Figure 8B). Like the out-degrees, because the in-degrees follow the power-law distribution, we equally divided the logarithm in 10 bases of in-degrees into five intervals. The darkness of the vertices indicates the in-degree values.
On 8 November, most users with a high in-degree (>63) appeared in the Philippines, United States, and Europe. Because the Philippines was the typhoon landfall location, it was inevitable that the numerous influential users on the OSN would post critical information about the typhoon, including the official Twitter account of the Philippines’ national disaster management agencies. Meanwhile, news and broadcasting organizations and weather forecasting agencies in the United States and Europe also reported information on Typhoon Haiyan.
On 12 November, more influential users (in-degrees > 63) appeared in the United States and Europe. OSN users in the Philippines still had the most significant influence on the disaster, but many new influential users emerged in the United States and Europe. This change was the result of the global attention generated by Typhoon Haiyan’s catastrophic impact. The tremendous casualties and economic losses from the disaster increased the attention received from people, relief agencies, and non-government organizations located in other countries. The news agencies’ reports regarding the disaster also increased on social media.
4.3. The Spatial Pattern Changes of OSN Users Connections and Interactions
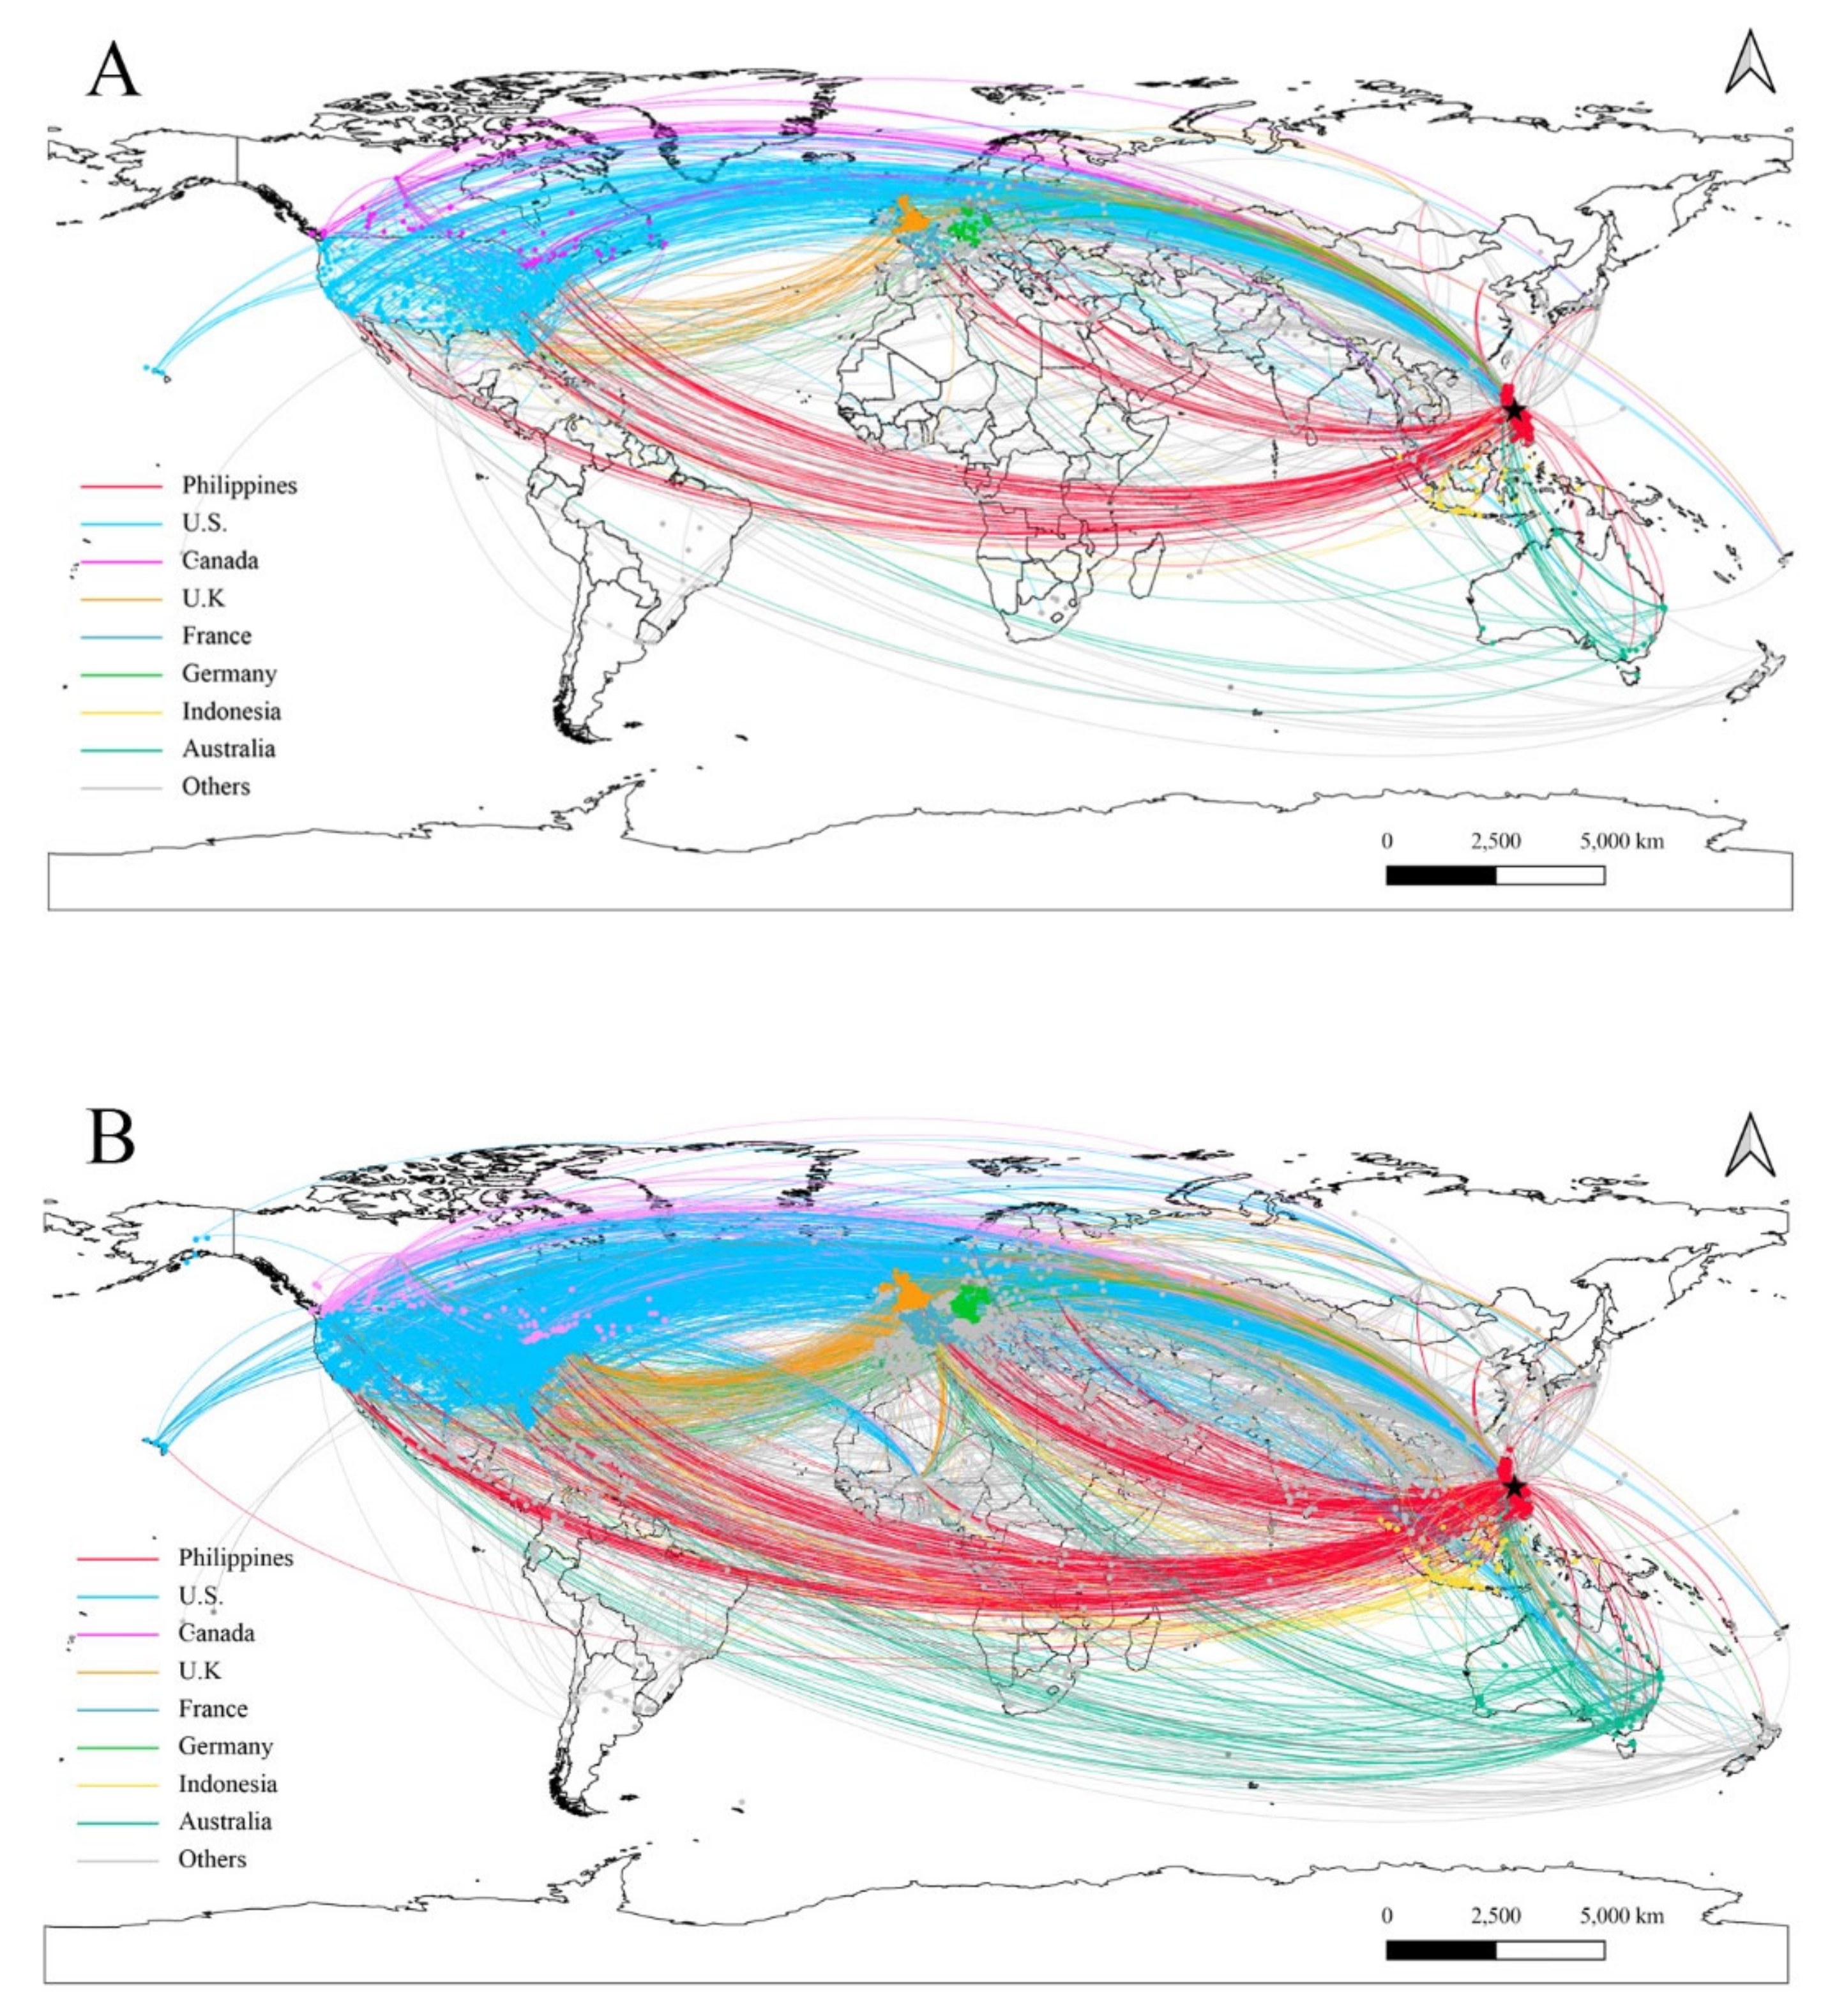
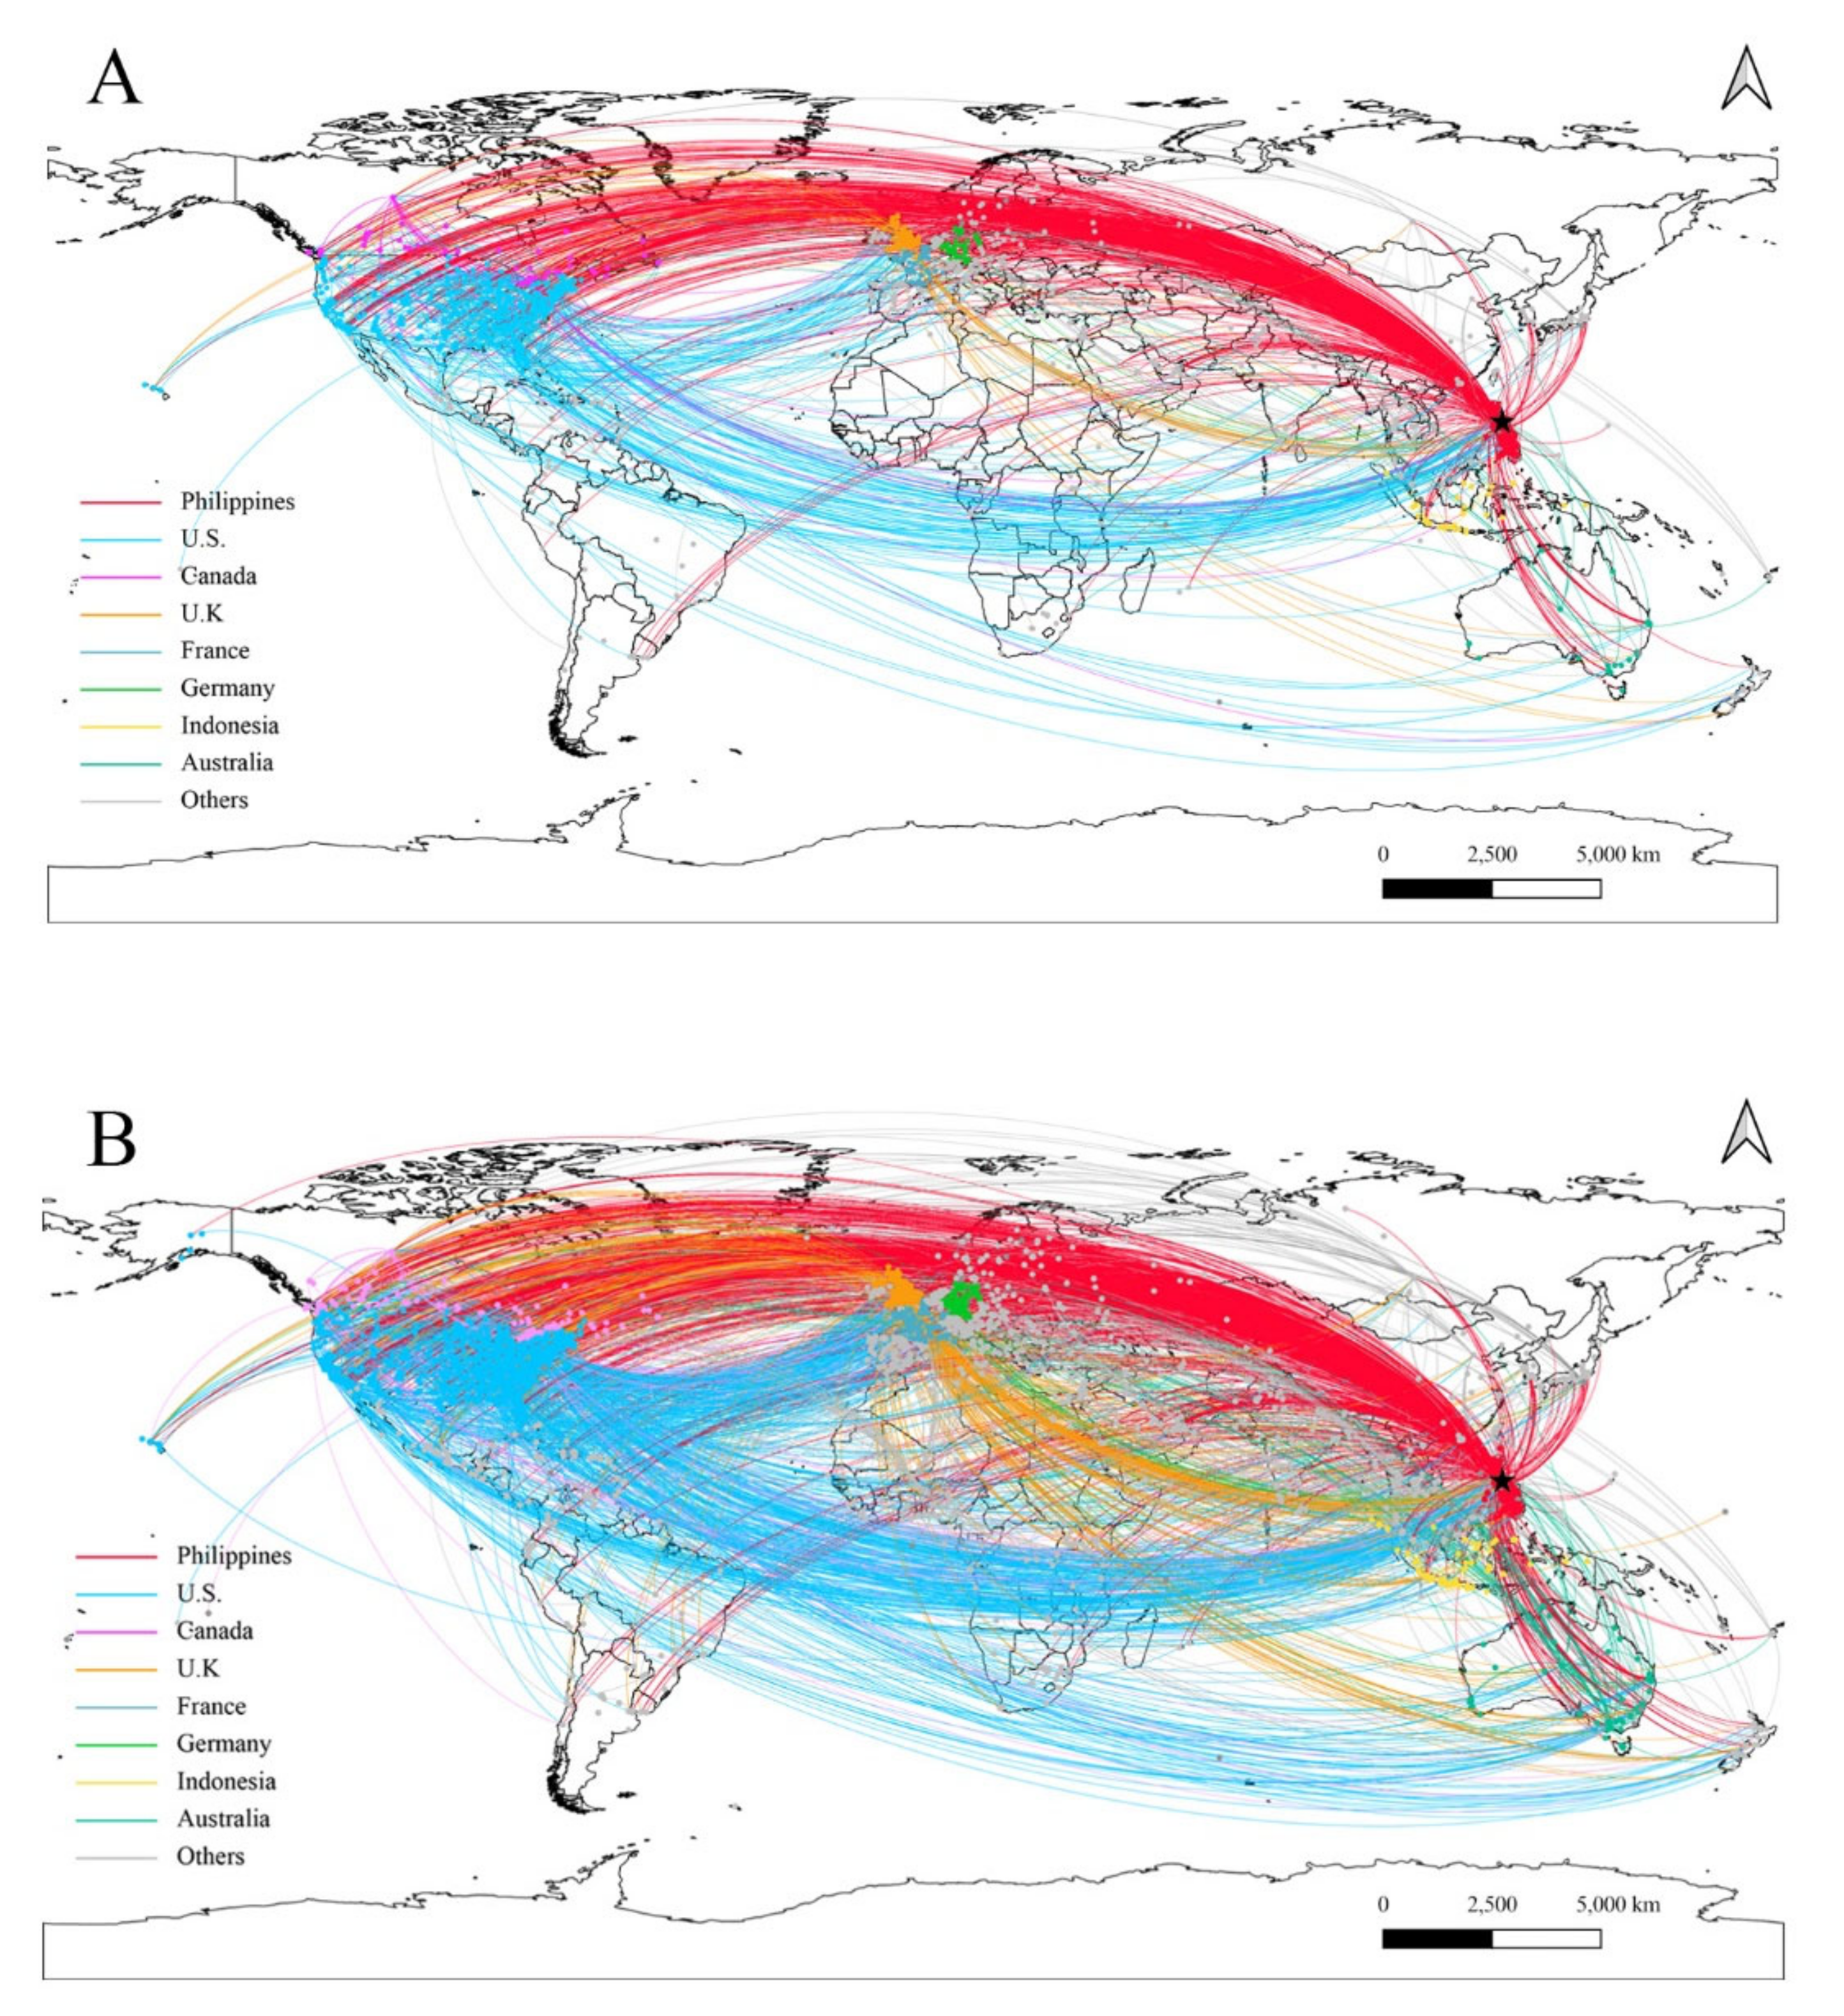
The geographic retweeting network is mapped and shown in
Figure 9. The vertices are colored based on their country. The links between two users are colored according to the source vertices’ locations. The links in the OSN depict the interactions between social media users and illustrate the perspective of user interactions as well as civil relations between countries.
By comparing the retweeting network geographic distribution on 8 November (
Figure 9A), we can see a significant growth of links on 12 November (
Figure 9B). The geographic connection patterns, however, are still similar. This result demonstrated that the retweeting network had a stable geographic structure.
From the perspective of civil relations, we observed four primary retweeting interaction circles. The first type of interaction circle (Circle 1) was between users in the Philippines and the United States, which are the red links and blue links between these two countries. The second type circle (Circle 2) was between users in the Philippines and Europe, which are the red links and orange, green, and dark blue links between the Philippines and the U.K., France, and Germany. The third type circle (Circle 3) was between users in the Philippines and Australia, which are the red links and jade links between the two countries. The fourth type circle (Circle 4) was between users in Western countries and the United States, which are the blue links and orange, dark blue, green, and jade links between the United States and the U.K., France, Germany, and Australia.
Circles 1–3 can be attributed to the fact that the social media users in major Western countries (i.e., the United States, Europe, and Australia) are large communities, and they actively retweeted information originating from the Philippines to help reduce damage and provide useful assistance to the local people in the Philippines. Meanwhile, because many international humanitarian organizations, disaster relief agencies, and supplies were from these wealthy Western countries, users in the Philippines preferred to retweet related information from these countries to seek help.
Interestingly, the fourth type of interaction, Circle 4, emerged between the United States and other Western countries (e.g., the U.K., France, Germany, and Australia). This can be explained by the fact that the United States has the most active Twitter users and worldwide influential media agencies, which lead to its dominating position in Western social media. Consequently, other Western countries’ users would naturally forward information from the United States. A large number of United States users also like retweeting information from other information sources from Western countries with similar languages, economic development levels, religions, or cultures.
Like
Figure 9, the links of the being-retweeted networks are illustrated in
Figure 10. The vertices are colored based on their country, and the links are colored according to the target vertices.
From 8 November to 12 November, the pattern of being retweeted remained steady. The users in the Philippines and the United States were the most influential in the OSN. As the epicenter of the disaster, most countries had links to the Philippines. In contrast, OSN users in the United States largely influenced the Western countries (e.g., Europe, Australia, New Zealand) and the Philippines because of its significant number of OSN users, global socioeconomic impact, and international social media platform dominator.
5. Discussions
5.1. Global OSN Demonstrates a Power Law
We analyzed the temporal pattern of the global OSNs following Typhoon Haiyan. Notably, the out-degree distributions and the in-degree distributions showed power-law distributions, indicating that the retweeting and the being-retweeted network under the disasters were scale-free. This result differed from Huang et al. [
55], which found that the retweeting network was scale-free, whereas the being-tweeted network was not. There are two differences between our study and Huang et al. First, we used the network under a natural disaster with global influence, whereas the other research focused on a local social event in a city/country. Second, we used a different method for the dynamic network, and we constructed a cumulative OSN in contrast to other research that had considered the relations retained only over a short period (e.g., one day) and then constructed the daily OSN.
5.2. The Spatiotemporal Evolution of OSN Follows the Disaster Development
Meanwhile, the temporal analysis of OSN revealed the changes in OSN users’ attentions and impact patterns as the disaster unfolded. The scaling exponents of both out- degrees and in-degrees showed a trend that rapidly decreased when the typhoon landed, and fluctuating declined within a few days of the typhoon’s landfall and then remained stable, which indicated that the OSN users’ attention, a small number of high-impact patterns, and most users’ small-impact patterns quickly formed as the typhoon landed. As the disaster developed, the attention and patterns slightly changed and then remained stable.
The spatial pattern of OSN showed that the influential global users significantly increased from 8 November to 12 November, which was consistent with the temporal analysis and previous research [
20]. The Philippines, as the location of the typhoon landfall, had numerous influential users since 8 November, whereas a time lag existed in the response of users in other countries. Public sentiment can partially explain this. According to the previous study [
57], on 8 November, the sentiment at that time was relatively positive because the users actively prepared for Typhoon Haiyan, and it had not caused severe losses yet. Whereas the most active users appeared in the Philippines, users in other regions paid little attention to this event. Dramatically, due to the typhoon’s tremendous damage, the sentiment changed to highly negative on 12 November. Meanwhile, more social media users around the world worried about the damage and were motivated to publish and retweet disaster situations and pray for the local people.
However, it should be noted that since the collected data were between 2013 and 2016, the regional population or spatial pattern may slightly differ from that of 2021.
5.3. Explanation of the Strong Users’ Activities and Connection
Except for the Philippines, the users in the United States and Europe showed higher out-degree and in-degree distributions than the users in other countries, which indicated that the civil relations between these countries were close. The links of these citizens indicate that they are likely to be the connection and cooperation between agencies and countries. This phenomenon could be because there is a massive amount of Filipinos living in the United States and Europe and because around 10% of Filipinos live overseas and need to depend on social media to screen the circumstance in their home and stay in contact with their friends and family [
23]. Besides, the vast power of American and European news agencies strengthens their interconnections. News organizations and journalists play critical roles in obtaining secondhand reports [
23]. In addition, the billions of rescue funds, disaster experts, and military personnel from Western countries [
20] also lead to their strong connection.
5.4. Comparison to Previous Works
Comparing previous studies which focused on event detecting [
14], location inference [
15], situation awareness [
17,
18,
45], social media user activity [
19,
20,
23,
25,
31,
32,
33,
37,
42], and damage assessment [
21,
22,
36,
40] using social media data, this study integrated geocoding, geovisualization, and complex network analysis to explore the spatiotemporal geographical patterns of user interactions. Those works mainly contributed to digging out disaster-related information to help emergency response agencies make relief plans or damage assessments. However, our work provides a geographical view of the social media user interactions, which showed the geolocated social network pattern after a natural disaster. Based on this, the emergency response agencies and social media companies can improve and optimize their disaster-related information collecting, propagation, and aggregation. They can then provide more helpful and accurate information for the local people in the disaster area.
On the other hand, a few existing works [
41,
42] described the statistical features of the OSN after a natural disaster or social events, but few works illustrate geographical user interaction patterns, especially the global user spatiotemporal patterns. These works faced issues in collecting, geolocating and geovisualizing, and analyzing massive social media data (i.e., tweets). Our work combined three methods: geolocating and geovisualizing and a complex network to demonstrate the geographical large-scale social network. This integrated method can be extended to more extensive situations.
5.5. Potential Benefits and Implications
The emergency response agencies and social media have different benefits from or implement our results. For the emergency response agencies, on the one hand, emergency agencies can improve the organization of disaster response information according to users’ locations. For example, agencies can update social media users in active and strongly connected countries about the situation in a disaster area. Individuals and organizations in these countries are more likely to raise awareness of the impact of a disaster and then facilitate more donations to determine how they can help. Therefore, the emergency response agencies can seek more help from the countries where users are active since these users may have a greater willingness to donate and provide help to the people in need. Meanwhile, the agencies can take advantage of these active users to propagate and deliver news coverage of the disaster to help people outside the disaster area follow up on the disaster situation and keep in touch with friends and family in need.
On the one hand, emergency response agencies can improve collecting, organizing, aggregating, and providing useful global information on the disaster. Our findings indicate that a catastrophe can attract global interest, and, hence, emergency response agencies can collect relief information (e.g., request for relief supplies, calls for assistance, the places where people are in danger or need) from the global users rather than being limited to the people in the disaster area. This is because there may be many requests or demands posted by friends, families, or associates outside the disaster area of the people in need.
On the other hand, social media platforms can tremendously and quickly expand users and amplify influence in specific countries and regions by better organizing disaster-related information. For example, social media platforms can organize a particular channel which aggregates disaster-related information (e.g., early warning signals, relief resources, self-rescue knowledge) and push it to the users in disaster areas and users in countries with high activity and strong connections. As a result, people in need can receive timing disaster relief information, and the platform can improve more OSN activities by evoking users’ enthusiasm for forwarding information. On the other hand, providing timing disaster-related information is also a significant contribution of the social media platform to the public good and can effectively improve their public image and relations.
6. Conclusions
In this study, we proposed a geovisualization method to illustrate the spatial pattern of the OSN by combining geocoding and the complex network. The application of the proposed method on Typhoon Haiyan demonstrated its feasibility and effectiveness.
The further analysis of the spatiotemporal evolution of the OSN shows that
- (1)
The temporal changes of the OSN users’ attentions and impact patterns were consistent with Typhoon Haiyan’s development.
- (2)
The spatial pattern of the users’ out-degree distribution indicated that the local natural disasters could attract significant global interest through the social media platform.
- (3)
The network featured a significant number of active users and links from the United States and Europe. This phenomenon indicated that the user connections between the Philippines, United States, and Europe were more substantial than in other countries. Furthermore, this is partly due to the Filipinos living in the United States and Europe and because of the strong communication ability of European and American news agencies.
This research contributes to the social media data research by presenting a geovisualization method and provides a new global-scale OSN geographic spatiotemporal pattern. This pattern offers a global social media user’s activities, interactions, and connections knowledge, which can assist disaster relief organizations in improving valuable and helpful information on disaster efficiency.
However, this study’s method and analysis had some limitations, including social media users’ biases and the psychological influence of the disaster. Long-term responses, such as years after a natural disaster event, need more investigation.


 ,
, 

