Abstract
Room segmentation is a basic task for the semantic enrichment of point clouds. Recent studies have mainly projected single-floor point clouds to binary images to realize two-dimensional room segmentation. However, these methods have difficulty solving semantic segmentation problems in complex 3D indoor environments, including cross-floor spaces and rooms inside rooms; this is the bottleneck of indoor 3D modeling for non-Manhattan worlds. To make full use of the abundant geometric and spatial structure information in 3D space, a novel 3D room segmentation method that realizes room segmentation directly in 3D space is proposed in this study. The method utilizes volumetric representation based on a VDB data structure and packs an indoor space with a set of compact spheres to form rooms as separated connected components. Experimental results on different types of indoor point cloud datasets demonstrate the efficiency of the proposed method.
1. Introduction
The continuous progress of laser scanning technology provides an effective means for the measurement and perception of architectural information. High-density laser-based 3D point clouds captured by stationary terrestrial laser scanners (TLS) [1] or indoor mobile laser scanners (IMLS) [2,3] can provide detailed architectural and geometric information. Laser point clouds are usually unstructured and lack semantic information, while automatic 3D indoor modeling is difficult [4]. Traditional methods for building a detail-rich building information model (BIM) require some basic techniques, including (1) geometric building object modeling, (2) semantic modeling, and (3) topological relationship modeling.
Many studies have been devoted to the development of automated indoor modeling methods [4,5,6,7,8] in the fields of architecture, engineering, and construction (AEC). As a necessary initial step, room segmentation can provide semantic room information as the basic unit of indoor space, which is the premise of further indoor scene understanding, object recognition, and urban computing [9,10]. At the same time, room segmentation is an important research topic in the field of robotics and is the basis for robot task planning and navigation [11]. The purpose of the room segmentation task is to automatically and robustly partition indoor 3D point clouds into rooms. The current methods mainly project single-floor point clouds to two-dimensional occupancy probability images to realize two-dimensional room segmentation [12,13]. However, these methods have difficulty solving semantic segmentation problems in complex 3D indoor environments, including cross-floor spaces [14] and rooms inside rooms [15]; this is the bottleneck of indoor 3D modeling for non-Manhattan worlds.
Some researchers [16] have applied trajectory information to the semantic classification of indoor spaces. By combining trajectories with point cloud data, they realized the subdivision of indoor spaces into floors, stairs, porches, and rooms. This type of method can conduct room segmentation for point clouds in three-dimensional space. However, this approach relies on the loop-closing strategy during the data acquisition process to form trajectory clusters in the rooms. When a room contains more than one door and the distances between the trajectory points passing through two doors are large, such methods may fail. Therefore, trajectory-based room segmentation methods also require auxiliary information from the associated point cloud to generate more reliable classification results.
It is obvious that realizing room segmentation directly in 3D space has many advantages. For example, 3D space can provide more abundant geometric and spatial structure information and can meet a wider range of application requirements, including those of semantic segmentation for complex indoor environments containing cross-floor spaces and nested rooms [17]. To achieve 3D room segmentation, it is necessary to fully consider the geometric and indoor spatial structure information contained in the given point cloud to obtain more reliable classification results. There are many difficulties in extending a room segmentation algorithm from a 2D grid to a 3D grid [18], including the rapid growth of the memory space and long calculation times.
In this study, we propose a novel 3D room segmentation method that is inspired by the idea that rooms are connected by their interiors and are departed through narrow passages (i.e., doors). This method utilizes volumetric representation based on a VDB (a sparse volumetric data structure with dynamic topology and is a variant of B+ tree) data structure and packs indoor spaces with sets of compact spheres to form rooms as separated connected components.
The remainder of this paper is organized as follows. The works related to this study are reviewed in Section 2. Section 3 describes the details of the proposed 3D room segmentation method. Experiments and discussions are presented in Section 4 and Section 5, respectively. The conclusions are drawn in Section 6.
2. Related Works
Room segmentation based on 3D laser point clouds has been researched in many fields, such as computer vision, robotics, and AEC. It is difficult to comprehensively review the research work in all aspects of these related fields. This study briefly reviews the aspects closely related to this study, including room segmentation and sphere packing.
2.1. Room Segmentation
Room segmentation has been considered by researchers for decades. The commonly used room segmentation algorithms for 2D occupancy probability images include the morphology-based method [19,20], distance transform-based method [21,22], Voronoi-based method [23], and feature-based method [24].
The traditional morphology-based method uses an opening operator (i.e., erosion followed by dilation) to partition an input fuzzy grid map into regions. The premise is that rooms are separated by narrow passages (i.e., doors). Starting from a seed point inside each region, the watershed method then identifies which pixels belong to the same room. The distance transform-based method calculates the distance between each pixel and its nearest occupied point. The local maxima of the distance transforms always lie in the middle of a room. After the extraction of local maxima, each cell is then traced upward to its local maximum, which is generally around the room's center; any cells that travel to a shared local maximum throughout the gradient are grouped together into one room. In practice, distance transform-based segmentation and morphological segmentation have certain similarities; the segmentation results obtained for some maps are fairly comparable, and their computational costs are similar. The morphological segmentation often obtains high recall in empty indoor space [12]. The above methods are widely used for single-floor room segmentation. However, the connectivity of indoor space with furniture cannot be effectively expressed using a 2D occupancy probability image. Besides, these methods often lead to over-segmentation with arbitrarily segmented boundaries. A detailed comparison of existing works can be found in [12,20].
Armeni et al. [25] assume that the rooms are aligned to the Manhattan world frame and parse 3D point clouds of buildings into rooms. The building elements including walls, doors, and objects are further classified. In the AEC field, room segmentation is often transformed into a cluster problem. By initializing projecting point clouds in the XOY plane, room segmentation can be transformed into a clustering problem, and the k-medoids algorithm can be utilized to cluster subsampled pixels [26]. Assuming that every room has at least one scan position, Mura et al. [8] automatically selected the number of room clusters by grouping the viewpoint cells according to their visibility overlaps. This method overcomes the limitations of the 2.5D assumption and allows for the modeling of slanted wall structures. Ochmann et al. [6] ran visibility tests between point patches on surfaces using ray casting and built a visibility graph. The regions of the point cloud with high mutual visibility formed clusters corresponding to the rooms of the building.
Some researchers have further improved upon the traditional methods, and methods utilizing circle packing have emerged. For example, the MAORIS method [27] convolves the input map's distance image with a circular kernel. The pixels with the same value are then grouped into ripple-like patterns in which pixel values change rapidly. Then, room segmentation is achieved by identifying ripple-like patterns and combining neighboring regions with comparable values.
The above methods are mainly based on the projection of a single-floor point cloud to a two-dimensional evidence grid image and the projection of a three-dimensional point cloud to a binary image to realize room segmentation based on a two-dimensional plane grid map, thus meeting the imposed room segmentation requirements based on each floor. However, these methods have difficulty solving room segmentation problems with cross-floor spaces and nested rooms. The restrictive priors such as the 2.5D assumption employed in the above methods can only faithfully model environments with vertical walls and horizontal floors and ceilings. The semantic segmentation of a complex 3D indoor environment, including cross-floor spaces and nested rooms, is the bottleneck of indoor 3D modeling for non-Manhattan worlds.
By utilizing the fact that two places are linked by doors, trajectory information can be employed to semantically enhance indoor environments. Trajectory information is combined with point cloud data and used to decompose an indoor space into stories, rooms, staircases, and doorways [2]. However, this method relies on the loop-closing strategy during the data acquisition process to form the trajectory clusters in the rooms. When a room contains more than one door and the distances between the trajectory points passing through the two doors are large, this method may fail. Therefore, the trajectory-based room segmentation method also requires obtaining auxiliary information from the associated point cloud to obtain more reliable classification results.
2.2. Sphere Packing
The sphere packing problem was first proposed by Kelper in 1961 [28]. The sphere packing problem is a classical problem in mathematics. It is also widely used in many branches of science, engineering, and even in daily life [29]. The problem is generally described as an arrangement of non-overlapping spheres within a container space. In some studies, this problem is generalized to the packing of spheres with unequal diameters [30]. In two dimensions, the problem becomes circle packing, and in higher dimensions, it becomes hypersphere packing. Packing issues may be divided into two categories based on the utilized packing structures: ordered packing and disorderly packing [31]. When considering the differences between space containers, the problem becomes the packing of either regular objects or irregular objects [32,33].
The sphere packing problem in indoor spaces is similar to the problem of sphere packing for arbitrary objects. Wu [34] formulated a min-max sphere packing method to pack predefined 3D regions. The objective is to minimize the number of spheres while maximizing the covered volume. The result is a set of spheres with different radii. The research was restricted to integer radii, and the studied problem was proven to be an NP-completeness problem. Weller [33] proposed a sphere packing method for arbitrary object mesh models. The arbitrary object was voxelized first, and the value of each voxel was set to be the distance to the closest triangle on the surface of the object. The voxel with the largest distance was selected as the center of the sphere. The procedure was repeated until dense sphere packing was achieved for the object.
Another problem closely related to sphere packing is sphere covering [35]. A sphere covering is an arrangement of spheres that completely covers a space. In some applications, overlap is not only permitted but also inevitable. In this situation, the goal is to find a configuration that reduces the overall density (i.e., the total volume of the spheres divided by the volume of the space). The sphere packing problem is generalized and allows each sphere to have a limited amount of overlap with other spheres [35]. The sphere packing algorithm is still hard to use in computer graphics. On the one hand, computer graphics typically involve the visualization of a scene, such as the surfaces of objects, rather than what is inside or behind them. On the other hand, algorithms for computing sphere packing results are computationally expensive, and current research is often limited to simple geometric objects, such as cones, cubes, tetrahedrons, spheres, ellipsoids, and cylinders [29,31]. Sphere packing for indoor spaces is more difficult because their geometric forms are more complex, and their scales are larger. After all, the sphere packing problem is still an open problem, and it is still necessary to further explore its application scope.
To the best of our knowledge, this study is the first to apply sphere packing to indoor space representation and room segmentation. The sphere packing problem becomes even harder for indoor spaces. Because an indoor space is highly complex and has a large scale, solving the problems of memory and efficiency is quite important.
3. Materials and Methods
In this study, an indoor space is classified as either a free space (open space) or an occupied space. A free space is a navigable space, and an occupied space is a non-navigable space. Rooms are connected by narrow passages (doors and junctions). A corridor connecting more than one room is considered a special room in our research. Two types of 3D point clouds are utilized as the inputs of our three-dimensional room segmentation method. One is a point cloud captured by TLS, . Each frame of the scanned point cloud is associated with a viewpoint . The world coordinate system is used to determine the coordinates of point . The other cloud is a point cloud captured by IMLS, . Each scanned point is associated with pose information.
The flowchart of the proposed 3D room segmentation method is depicted in Figure 1. The main steps of the proposed method are summarized in Algorithm 1. The method contains five main steps.
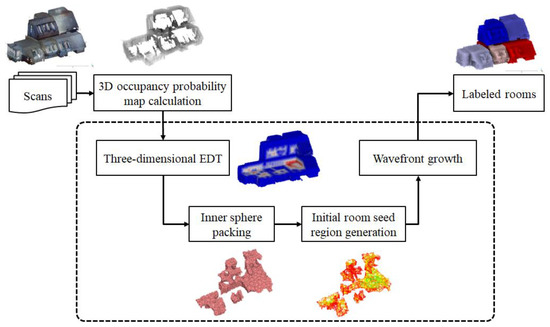
Figure 1.
Flowchart of the proposed 3D room segmentation method.
- (1)
- 3D occupancy probability map calculation: The 3D occupancy probability of the obtained laser scanning point cloud is calculated, and the probability value is stored in the VDB-based 3D grid data structure, which is an efficient and sparse volume data structure.
- (2)
- Three-dimensional Euclidean distance transform (EDT): An EDT is performed to calculate the distance from each voxel to its nearest occupied point.
- (3)
- Inner sphere packing: The distance map obtained after executing the EDT is segmented according to the given distance threshold, and the inner sphere is used to pack the space where the distance value is greater than the given threshold.
- (4)
- Initial room seed region generation: A topological graph is constructed according to the adjacency relationships between the filled interior spheres, and the connected subgraphs of the topological graph are segmented. The initial room seed regions are obtained by superposing the space occupied by each interior sphere in the connected subgraphs.
- (5)
- Wavefront growth: The final 3D room segmentation result is obtained by using the wavefront growth algorithm.
3.1. VDB Data Structure and 3D Occupancy Probability Map
In this study, volumetric representation is used to model occupied space and free space (Figure 2). A 3D occupancy probability grid map is generated to represent the certainty with which a voxel is occupied by obstacles. The dense regular grid data format is straightforward and convenient for volume rendering, fluid simulation, and fracture simulation. However, it has at least one significant flaw: the memory footprint is directly proportional to the size of the embedding space. If numerous instances are required or the 3D data are animated and the grid domain constantly changes, even highly dense and regular grids, both of which are common in simulations, can induce memory constraints [36].
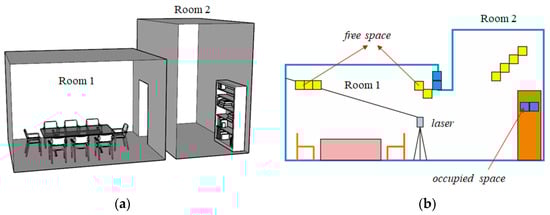
Figure 2.
Illustration of an indoor space: (a) two rooms are separated by a door; (b) the voxels in yellow are free spaces, and the voxels in blue are occupied spaces.
To solve this problem, we use a VDB data structure [36] to store the 3D occupancy map. The VDB data structure builds on B+ trees and is memory efficient. It supports fast, constant-time random access, insertion, and deletion. The VDB data structure has unbounded signed index domains and supports arbitrary grid topologies. It was developed for both dynamic topologies and dynamic values that are typical of time-dependent numerical simulations and animated volumes.
The ray casting method is used to generate 3D occupancy grid maps. The viewpoint of each scan is used to calculate the certainty of each voxel. To simulate the scanning process, a beam model is utilized. As shown in Figure 2, free space is the space between a perspective and an obstacle. When a beam leaves the laser scanner and hits an obstacle, it comes to a complete halt. The voxel size should be properly chosen to make a tradeoff between memory and efficiency. Bresenham's line algorithm [37] is used to decide which voxels in a 3D grid should be chosen to approximate a straight line between two points.
3.2. 3D Euclidean Distance Transform
The distance grid map M represents the distance from each grid voxel to the closest obstacle. Given a grid map M, let p and q be the coordinates of any two voxels in grid M, and the Euclidean distance (ED) between these two voxels can be mathematically expressed as follows.
where p and q are the index coordinates of the grid map voxels in M. The distance between p and q is measured by the function . For each free voxel p, the 3D EDT algorithm calculates the distance and finds the closest occupied voxel q. The EDT is essentially a search-based optimization framework for solving the problem defined in Equation (1).
In this study, the VDB-EDT algorithm [38] is used to provide high-quality and more complete mapping results while consuming less memory and processing time than other methods. The VDB-EDT algorithm is an efficient and robust framework for occupancy grid mapping and EDT. The VDB data structure is also used to represent the distance field hierarchically. Because the VDB adopts efficient memory management, it can access voxels randomly with (O(1)) time complexity, which makes it very suitable for large-scale 3D EDT problems.
The VDB-EDT algorithm maintains a priority queue. An obstacle with added and removed states is put into the queue for initialization. The algorithm iteratively updates the voxel’s distance to its closest obstacle, thus forming two distance propagation processes called raising waves and lowering waves. A raising wave occurs when an obstacle is removed, and the set of grid cells with index s as the nearest obstacle needs to be reset to generate a process similar to a raising wave. A lowering wave occurs when adding obstacles. It checks 26 neighboring voxels around the current voxel and updates the distance values of these voxels to produce a process similar to a descending wave (Figure 3).
| Algorithm 1. Three-Dimensional Room Segmentation. |
| Input: P: a set of unorganized point clouds; : the voxel size of the grid map : distance threshold for distance map segmentation; : overlap ratio threshold for two spheres; : minimum room volume threshold Initialize: ; // 3D occupied map ; // EDT map ; //initial room seed regions ; // room segmentation with labels (1) ; (2) ; // EDT (3) ; (4) = ; (5) (6) return |
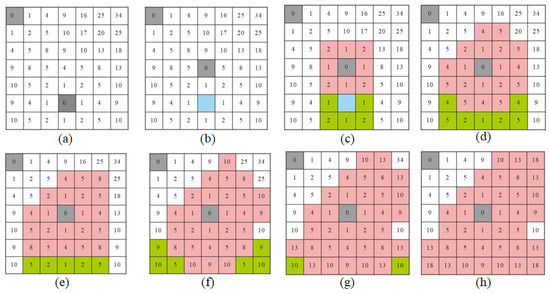
Figure 3.
The VDB-EDT algorithm is performed to calculate the distance from each voxel to its nearest occupied point. The colours gray and blue correspond to occupied, empty values, respectively. The pink and green cells represent lowering and raising waves, respectively. (a) The initial map contains two occupied points; (b) the map contains a new occupied point and a newly cleared point; (c–h) the map contains the lowering and raising wavefronts with the highest current priorities.
3.3. Inner Sphere Packing for Indoor Spaces
In this section, we introduce our packing method for inner spheres with different radii. The objective of sphere packing for an indoor space is to minimize the number of spheres while maximizing the covered volume. This problem is difficult to solve, and an approximate method is adopted in this study to make a tradeoff between accuracy and efficiency. The problem is equivalent to generating a subset of the sphere positions in the indoor space . The placed sphere is centered at position with radius .
If the two packing spheres are disjoint, . If the two spheres are tangential, . If the sphere pair overlaps, . Instead of directly using the function to judge overlap, we adopt an overlapping degree indicator to describe the overlap between two spheres (Figure 4). The overlapping degree is defined as:
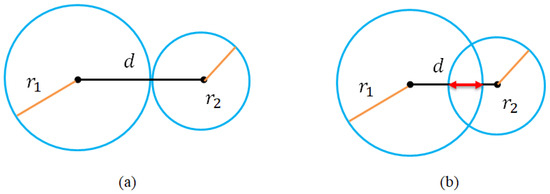
Figure 4.
The relationship between two spheres shown in 2D. (a) The two spheres are tangential; (b) the two spheres overlap.
Algorithm 2 describes the main steps of the sphere packing algorithm. After executing the 3D EDT, a distance transform grid map is obtained. The distance value from each voxel to its nearest obstacle point is stored. First, the voxel with the largest distance transformation value is selected as the center of the sphere, and the largest nearest neighbor distance is selected as the radius to fill the sphere. Let the voxel center be , and let its nearest neighbor distance be . Then, the first packing sphere is defined as .
Next, the voxel center with the largest nearest neighbor distance from the outer voxel set containing all filled balls is selected as the new center of the filled sphere, and the new inner sphere is filled. To reduce the overlap between the inner spheres, the efficiency of the sphere packing algorithm is improved by using a parallel sorting algorithm. The algorithm iterates until all voxels are covered by spheres, and the final result is a set of inner spheres . As the overlap value is important for the sphere packing algorithm, the parameter should make a tradeoff between accuracy and efficiency.
3.4. Initial Room Seed Region Generation
Inner sphere packing is an effective method to determine the boundary and internal shape of an irregular indoor 3D space. The packed inner spheres can closely contact the interior boundary surface of irregular indoor space. As rooms are connected by narrow passages (doors and junctions), the local maxima of DTs always lie in the center of a room (Figure 5). If the spheres are directly packed into the indoor space, the indoor space becomes a large, connected component. By conducting a threshold segmentation process, the distance grid map is partitioned into several distinct connected components, which are treated as the initial seed room regions in this study. The inner sphere packing process does not directly use a DT map but rather a segmented DT map with a distance threshold (Figure 6), which generates the initial room seed regions. The goal of this step is to pack the kernel of the indoor space with a set of spheres, thus determining the distinct connected components with initial room labels. The sphere packing results with different overlap ratios are shown in Figure 7.
| Algorithm 2. Sphere Packing. |
| Input: : a distance transform grid map; : distance threshold for distance map segmentation; : overlap ratio threshold for two spheres; Initialize: ; // distance transform grid map after threshold segmentation ; // cells with distances within the threshold ; // vector for sphere packing (1) ; // segmentation using threshold (2) ; // get distance cells (3) ; (4) = getMaxDistanceCell(P); (5) ; // add a sphere to the vector (6) while (s.Radius > ) (7) b = getBoundingBox (s); (8) for each cell c in b (9) ; (10) if (flag) (11) P.erase(c.pos); (12) end for (13) ; (14) = getMaxDistanceCell(P); (15) if (Overlap(, R) > ) (16) P.erase(s.pos); (17) else if (18) ; // add a sphere to the vector (19) end if (20) end while (21) return |
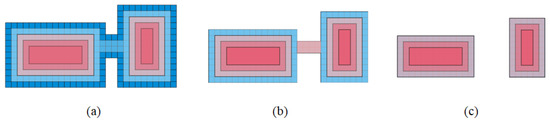
Figure 5.
Segmentation results of a distance map obtained using different thresholds; the local maxima of DTs always lie in the center of a room. (a) Initial DT map; (b) segmentation result of the distance map obtained using small threshold; (c) segmentation result of the distance map obtained using a threshold equivalent to the door width.
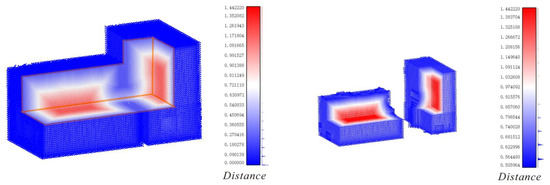
Figure 6.
Visualizations of the EDT and a distance map obtained using a threshold.
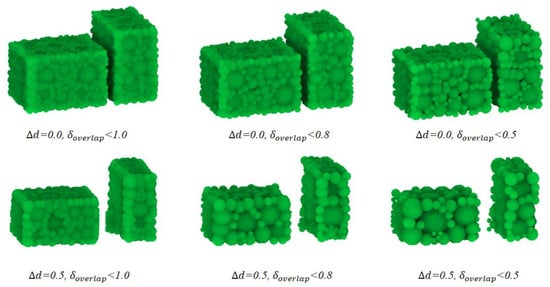
Figure 7.
Sphere packing results obtained with different thresholds and overlap ratios for DT map segmentation.
First, a topologically undirected graph is initialized, which takes the center points of all internal spheres as the nodes V of the graph. At the same time, a KD tree is constructed for the coordinates of all nodes. Then, the center point of each inner sphere is traversed, and its nearest neighboring spherical nodes that satisfy a radius threshold of 2 are searched. If the nearest neighbor sphere and current sphere fulfill , that is, the inner spheres overlap, a new edge is added to the topological graph G. This process iterates until all the center points of the inner spheres are traversed. The connected components of an undirected graph are computed using a depth-first search (DFS)-based approach [39]. A connected component of G is a set of vertices that are all reachable from each other. Finally, the voxels of the grid map located in the spheres of each connected component are assigned initial room labels. The spheres of the components whose volumes are smaller than τ are ignored by the initial seed regions.
3.5. Wavefront Growth
Starting at a seed voxel inside each seed room region, the wavefront growth algorithm is used to determine the unlabeled voxels that belong to the same room. The algorithm is a breadth-first searching method [40]. The label of the current voxel is determined according to the 26 nearest neighbors around it. If one of the twenty-six nearest neighbors is assigned an initial room label, the current voxel is assigned to the same room label. Finally, the seed area of the initial room is extended to the unlabeled free space, and a three-dimensional room segmentation result is obtained.
4. Results
To validate the feasibility of the proposed method, many different types of indoor point cloud data are selected for experiments. Detailed descriptions of the datasets are shown in Table 1. The A1 and A2 datasets are derived from the Floored Panorama RGB-D Dataset [26]. The datasets were acquired with a camera and a depth sensor mounted on a motorized tripod. Four real-world datasets named B1, B2, B3, and B4 used in our experiment are derived from the University of Zurich (UZH) Rooms detection datasets [8]. They correspond to the “Cottage”, “Penthouse”, “Maisonnette” and “House” datasets, which were scanned using a Faro Focus 3D laser range scanner. C1 and C2 depict the datasets “Case study 2” and “Case study 6” from the International Society for Photogrammetry and Remote Sensing (ISPRS) Benchmark on Indoor Modeling [41]. The datasets were captured by IMLS (i.e., Zeb-Revo). These datasets consist of point clouds, corresponding trajectory information, and timestamps. The datasets are preprocessed by aligning the coordinate points and trajectories with timestamps. The exterior points that obviously do not belong to the building are removed.

Table 1.
Detailed descriptions of the experimental datasets.
We implement the algorithm using the C++ language. The dependencies include OpenVDB [42], the point cloud library (PCL) [43] and the boost graph library (BGL) [44]. The experiment is conducted on a Dell PC with a 2.60 Hz Intel Core i7-10750H CPU and 16 GB of RAM. The dataset and source code for this study are available online at https://github.com/yhexie/AxVSPRoomSeg3D.git (accessed on 1 May 2021).
The parameter descriptions and input parameters of the proposed method are listed in Table 2. The proposed method runs in an automatic way and does not require any user intervention except for parameter selection. As the room space labels are hard to obtain, especially for the furniture, we use 3D watertight mesh models as background information. If a detection room overlaps with a background room by more than 85%, the detected room is treated as a true positive (TP) room. If a room is not correctly identified, it is a false negative (FN). A non-room segment that is misclassified is counted as a false positive (FP). Only one-to-one correspondence is considered in our evaluation. The indicators precision and recall [13] are used to evaluate the classification results.
Table 2.
Parameters and descriptions of the proposed method for different datasets.
As shown in Table 3, “point cloud” indicates the original architectural point clouds. The results presented in the table demonstrate that the proposed method successfully models the entire dataset. The room segmentation results obtained with the real-world datasets are shown in different colors.
Table 3.
Indicators and room segmentation results of the proposed method for real-world datasets.
Datasets A1 and A2 employ the restrictive 2.5D assumption and the indoor environments contain vertical walls and horizontal floors and ceilings. Voxel sizes of 0.05 are adopted for these two datasets, resulting in grid maps of 252 × 184 × 47 voxels for the first dataset and 226 × 242 × 44 voxels for the second. In total, 5 TP rooms are detected for dataset A1, and a total of 10 TP rooms are detected for dataset A2. Both datasets yield 100% recall and precision. The execution times are 25.382 s and 85.377 s for A1 and A2, respectively.
We further show the room segmentation results for datasets B1 and B2. These datasets contain laser-scanned point clouds of single-floor building interiors with slanted walls. The discretized grid maps contain 117 × 99 × 45 voxels for dataset B1 and 99 × 156 × 41 voxels for dataset B2. Seven and four rooms are detected for B1 and B2, respectively. The experiments on these datasets prove the effectiveness of 3D room segmentation for indoor environments that contain wall structures with arbitrary orientations. The experimental results on these two datasets also produce 100% recall and precision using the proposed method.
The B3 and B4 datasets contain laser-scanned point clouds of multistore building interiors with slanted walls. B3 represents more complex environments with multiple stories. The discretized grid map contains 100 × 171 × 82 voxels for dataset B3, and five TP rooms are detected in this dataset. The recall and precision are 100%. B4 is a synthetic dataset corresponding to a three-story house containing many rooms and interior details. For B4, the discretized grid map contains 145 × 115 × 104 voxels, and 12 TP rooms are detected. The recall and precision are 100% and 92.3%, respectively. The experimental results demonstrate the ability of the proposed method to address complex building interiors with arbitrary wall arrangements in a multistorey environment.
The C1 dataset contains laser-scanned point clouds of multistorey building interiors. The studied building contains 2 floors with 24 background rooms, and the 2 floors are connected by a staircase. The discretized grid map contains 424 × 169 × 90 voxels for this dataset, and six TP rooms are detected. The C2 dataset contains a non-Manhattan world building that contains 18 background rooms on one floor. The indoor environment is highly cluttered, mostly due to the presence of various artifacts. It has wall structures with arbitrary orientations and curved walls. The discretized grid map contains 212 × 343 × 52 voxels, and 16 TP rooms are detected in this dataset. The experimental results on C1 and C2 are shown in Table 4. The execution times are 461.625 s and 66.667 s for C1 and C2, respectively.
Table 4.
Indicators and room segmentation results of the proposed method for real-world datasets.
5. Discussion
The method proposed in this study can realize 3D room segmentation, but in some cases, over-segmentation and under-segmentation occur. The main reasons for this are as follows. (1) When the corridor width is close to the door width, the long corridor is filtered out during the DT map threshold segmentation process, so the long corridor cannot be generated as an initial seed room. If a small value is set for the threshold , under-segmentation occurs, especially in a long corridor. In addition, two small rooms are segmented into adjacent rooms on the experiment of dataset C1. (2) Due to the existence of dynamic objects in indoor free spaces, heavy occlusion occurs during the laser scan process. Noise and dynamic objects (like pedestrians or small vehicles) in free space have great impacts on the EDT, and small regions are generated. The 3D points in the real datasets are corrupted by mirrors, windows, reflective objects, and calibration errors. Noise points and points on the surfaces of furniture and other structures may also break the connections between rooms.
The roles of viewpoints and trajectories are mainly to distinguish between indoor and outdoor areas during the occupancy probability calculation. During the 3D occupied map calculation step, the outdoor area is marked as an unknown space. Therefore, for point clouds without viewpoint and trajectory information, this method can be used as long as the indoor and outdoor areas are reasonably distinguishable.
Benefiting from the special index and caching mechanism, VDB exhibits high random access speed. The current algorithm needs many traversals and repeated sorting operations, so the efficiency of the current algorithm changes significantly as indoor space range, voxel size, and indoor complexity increase. We find that the sphere packing process occupies more than 85% of the execution time. There is still much room for our method to improve.
As shown in Figure 8, if safety doors are present, the stair area is divided into a separate area. If there is no safety door, the stair area and floors are connected as a whole. A postprocessing step is essential in that the information obtained from separate rooms after 3D room segmentation is used to extract floor information. The floor and cross-floor spaces can be further divided according to the associated elevation histogram.
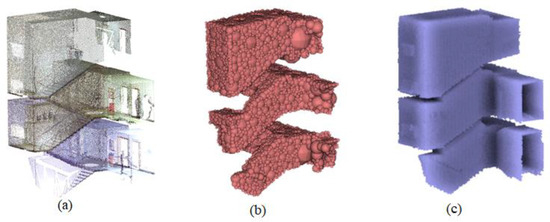
Figure 8.
The sphere packing and segmentation results for stairs; the stair area and floors are connected as a whole. (a) Original point cloud of the stair region; (b) sphere packing result; (c) room segmentation result for the case in which the stair area and floors are connected as a whole.
6. Conclusions
This paper presents a novel 3D room segmentation method. Three-dimensional EDT is performed based on the VDB data structure, and inner spheres are used to pack the indoor free spaces to obtain the initial room seed regions. Room segmentation is realized directly in 3D space, and the developed method utilizes the abundant geometric and spatial structure information in 3D space. The method can be used to solve semantic segmentation problems in complex 3D indoor environments, including cross-floor spaces and nested rooms. This study can improve the application scope of room segmentation and provide a new solution for the segmentation of rooms in a non-Manhattan world.
However, the sphere packing method takes up the majority of the total execution time, which provides room for our algorithm to improve and points the way for future study. Further work will also include the application of the proposed method to the semantic enhancement of indoor 3D modeling.
Author Contributions
Conceptualization, Fan Yang; data curation, Xinkai Zuo; formal analysis, Xinkai Zuo; investigation, Mingliang Che; methodology, Fan Yang and Mingliang Che; project administration, Chi Zhang; resources, Xinkai Zuo and Jiyi Zhang; software, Fan Yang; supervision, Lin Li; writing—original draft, Fan Yang; writing—review and editing, Lin Li and Chi Zhang. All authors have read and agreed to the published version of the manuscript.
Funding
This research was funded by the National Natural Science Foundation of China (no. 42001322), Natural Science Foundation of Anhui Province (No. 2008085QD168), Project of Nantong Science and Technology Bureau (No. JC2020174), and Project of Taizhou Natural Resources and Planning Bureau (No. JSJWZBDL2020-62).
Institutional Review Board Statement
Not applicable.
Informed Consent Statement
Not applicable.
Data Availability Statement
The data presented in this study are openly available in [8,26,41].
Acknowledgments
The authors acknowledge the Visualization and MultiMedia Lab at UZH, Mura, C. [78] and the ISPRS WG IV/5 [41] for the acquisition of 3D point clouds. The authors give special acknowledgment to Zhu, D. [38] for the implementation of the VDB-EDT algorithm.
Conflicts of Interest
The authors declare no conflict of interest.
References
- Kedzierski, M.; Fryskowska, A. Terrestrial and Aerial Laser Scanning Data Integration Using Wavelet Analysis for the Purpose of 3D Building Modeling. Sensors 2014, 14, 12070–12092. [Google Scholar] [CrossRef] [PubMed]
- Elseicy, A.; Nikoohemat, S.; Peter, M.; Elberink, S.O. Space Subdivision of Indoor Mobile Laser Scanning Data Based on the Scanner Trajectory. Remote Sens. 2018, 10, 1815. [Google Scholar] [CrossRef]
- Nikoohemat, S.; Peter, M.; Oude Elberink, S.; Vosselman, G. Semantic Interpretation of Mobile Laser Scanner Point Clouds in Indoor Scenes Using Trajectories. Remote Sens. 2018, 10, 1754. [Google Scholar] [CrossRef]
- Yang, F.; Li, L.; Su, F.; Li, D.; Zhu, H.; Ying, S.; Zuo, X.; Tang, L. Semantic decomposition and recognition of indoor spaces with structural constraints for 3D indoor modelling. Autom. Constr. 2019, 106, 102913. [Google Scholar] [CrossRef]
- Yang, F.; Zhou, G.; Su, F.; Zuo, X.; Tang, L.; Liang, Y.; Zhu, H.; Li, L. Automatic Indoor Reconstruction from Point Clouds in Multi-room Environments with Curved Walls. Sensors 2019, 19, 3798. [Google Scholar] [CrossRef]
- Ochmann, S.; Vock, R.; Klein, R. Automatic reconstruction of fully volumetric 3D building models from oriented point clouds. ISPRS J. Photogramm. Remote Sens. 2019, 151, 251–262. [Google Scholar] [CrossRef]
- Mura, C.; Mattausch, O.; Jaspe Villanueva, A.; Gobbetti, E.; Pajarola, R. Automatic room detection and reconstruction in cluttered indoor environments with complex room layouts. Comput. Graph. 2014, 44, 20–32. [Google Scholar] [CrossRef]
- Mura, C.; Mattausch, O.; Pajarola, R. Piecewise-planar Reconstruction of Multi-room Interiors with Arbitrary Wall Arrangements. Comput. Graph. Forum 2016, 35, 179–188. [Google Scholar] [CrossRef]
- Zhou, T.; Liu, X.; Qian, Z.; Chen, H.; Tao, F. Automatic Identification of the Social Functions of Areas of Interest (AOIs) Using the Standard Hour-Day-Spectrum Approach. ISPRS Int. J. Geo-Inf. 2020, 9, 7. [Google Scholar] [CrossRef]
- Zheng, Y.; Capra, L.; Wolfson, O.; Yang, H. Urban Computing: Concepts, Methodologies, and Applications. ACM Trans. Intell. Syst. Technol. 2014, 5, 1–55. [Google Scholar] [CrossRef]
- Kleiner, A.; Baravalle, R.; Kolling, A.; Pilotti, P.; Munich, M. A Solution to Room-By-Room Coverage for Autonomous Cleaning Robots. In Proceedings of the IEEE/RSJ International Conference on Intelligent Robots and Systems (IROS), Vancouver, BC, Canada, 24–28 September 2017. [Google Scholar]
- Bormann, R.; Jordan, F.; Li, W.; Hampp, J.; Hagele, M. Room Segmentation-Survey, Implementation, and Analysis. In Proceedings of the IEEE International Conference on Robotics and Automation (ICRA), Stockholm, Sweden, 16–21 May 2016. [Google Scholar]
- Ambruş, R.; Claici, S.; Wendt, A. Automatic Room Segmentation from Unstructured 3-D Data of Indoor Environments. IEEE Robot. Autom. Lett. 2017, 2, 749–756. [Google Scholar] [CrossRef]
- Pang, Y.; Zhang, C.; Zhou, L.; Lin, B.; Lv, G. Extracting Indoor Space Information in Complex Building Environments. ISPRS Int. J. Geo-Inf. 2018, 7, 321. [Google Scholar] [CrossRef]
- Zlatanova, S.; Isikdag, U. 3D Indoor Models and Their Applications. In Encyclopedia of GIS; Shekhar, S., Xiong, H., Zhou, X., Eds.; Springer: Cham, Switzerland, 2017; pp. 9–20. [Google Scholar] [CrossRef]
- Lim, G.; Doh, N. Automatic Reconstruction of Multi-Level Indoor Spaces from Point Cloud and Trajectory. Sensors 2021, 21, 3493. [Google Scholar] [CrossRef]
- Xiong, Q.; Zhu, Q.; Du, Z.; Zlatanova, S.; Zhang, Y.; Zhou, Y.; Li, Y. Free multi-floor indoor space extraction from complex 3D building models. Earth Sci. Inform. 2017, 10, 69–83. [Google Scholar] [CrossRef]
- Yang, C.; Sethi, M.; Rangarajan, A.; Ranka, S. Supervoxel-Based Segmentation of 3D Volumetric Images. In Computer Vision—ACCV 2016, Proceedings of the Computer Vision—ACCV 2016, Taipei, Taiwan, 20–24 November 2016; Springer: Cham, Switzerland, 2017; pp. 37–53. [Google Scholar]
- Fabrizi, E.; Saffiotti, A. Augmenting topology-based maps with geometric information. Robot. Auton. Syst. 2002, 40, 91–97. [Google Scholar] [CrossRef]
- Jung, J.; Stachniss, C.; Kim, C. Automatic Room Segmentation of 3D Laser Data Using Morphological Processing. ISPRS Int. J. Geo-Inf. 2017, 6, 206. [Google Scholar] [CrossRef]
- Diosi, A.; Taylor, G.; Kleeman, L. Interactive SLAM using Laser and Advanced Sonar. In Proceedings of the 2005 IEEE International Conference on Robotics and Automation, Barcelona, Spain, 18–22 April 2005; pp. 1103–1108. [Google Scholar]
- Zheng, T.; Duan, Z.; Wang, J.; Lu, G.; Li, S.; Yu, Z. Research on Distance Transform and Neural Network Lidar Information Sampling Classification-Based Semantic Segmentation of 2D Indoor Room Maps. Sensors 2021, 21, 1365. [Google Scholar] [CrossRef]
- Thrun, S.; Bü, A. Integrating grid-based and topological maps for mobile robot navigation. In Proceedings of the Thirteenth National Conference on Artificial Intelligence, Portland, OR, USA, 4–8 August 1996; Volume 2, pp. 944–950. [Google Scholar]
- Martinez Mozos, O.; Rottmann, A.; Triebel, R.; Jensfelt, P.; Burgard, W. Semantic Labeling of Places using Information Extracted from Laser and Vision Sensor Data. In Proceedings of the IEEE/RSJ IROS Workshop: From Sensors to Human Spatial Concepts, Beijing, China, 10 October 2006. [Google Scholar]
- Armeni, I.; Sener, O.; Zamir, A.R.; Jiang, H.; Brilakis, I.; Fischer, M.; Savarese, S. 3D Semantic Parsing of Large-Scale Indoor Spaces. In Proceedings of the 2016 IEEE Conference on Computer Vision and Pattern Recognition (CVPR), Las Vegas, NV, USA, 27–30 June 2016; pp. 1534–1543. [Google Scholar]
- Ikehata, S.; Yang, H.; Furukawa, Y. Structured Indoor Modeling. In Proceedings of the 2015 IEEE International Conference on Computer Vision (ICCV), Santiago, Chile, 7–13 December 2015; pp. 1323–1331. [Google Scholar]
- Mielle, M.; Magnusson, M.; Lilienthal, A.J. A method to segment maps from different modalities using free space layout MAORIS: MAp of RIpples Segmentation. In Proceedings of the IEEE International Conference on Robotics and Automation (ICRA), Brisbane, QLD, Australia, 21–25 May 2018; pp. 4993–4999. [Google Scholar] [CrossRef]
- Hales, T.C.; Ferguson, S.P. A Formulation of the Kepler Conjecture. Discret. Comput. Geom. 2006, 36, 21–69. [Google Scholar] [CrossRef]
- Hifi, M.; M'Hallah, R. A Literature Review on Circle and Sphere Packing Problems: Models and Methodologies. Adv. Oper. Res. 2009, 2009, 150624. [Google Scholar] [CrossRef]
- Kubach, T.; Bortfeldt, A.; Gehring, H. Parallel greedy algorithms for packing unequal circles into a strip or a rectangle. Cent. Eur. J. Oper. Res. 2009, 17, 461–477. [Google Scholar] [CrossRef]
- Li, S.; Zhao, J.; Lu, P.; Xie, Y. Maximum packing densities of basic 3D objects. Chin. Sci. Bull. 2010, 55, 114–119. [Google Scholar] [CrossRef]
- Liu, J.; Li, S.; Chen, Y. A fast and practical method to pack spheres for mesh generation. Acta Mech. Sin. 2008, 24, 439–447. [Google Scholar] [CrossRef]
- Weller, R. Sphere Packings for Arbitrary Objects. In New Geometric Data Structures for Collision Detection and Haptics; Springer Series on Touch and Haptic Systems; Springer: Berlin/Heidelberg, Germany, 2013. [Google Scholar] [CrossRef]
- Wang, J. Medial Axis and Optimal Locations for Min-Max Sphere Packing. J. Comb. Optim. 2000, 4, 487–503. [Google Scholar] [CrossRef]
- Uhler, C.; Wright, S.J. Packing Ellipsoids with Overlap. SIAM Rev. 2013, 55, 671–706. [Google Scholar] [CrossRef][Green Version]
- Museth, K. VDB: High-resolution sparse volumes with dynamic topology. ACM Trans. Graph. 2013, 32, 1–22. [Google Scholar] [CrossRef]
- Bresenham, J.E. Algorithm for computer control of a digital plotter. IBM Syst. J. 1965, 4, 25–30. [Google Scholar] [CrossRef]
- Zhu, D.; Wang, C.; Wang, W.; Garg, R.; Scherer, S.; Meng, M.Q.-H. VDB-EDT: An Efficient Euclidean Distance Transform Algorithm Based on VDB Data Structure. arXiv 2021, arXiv:2105.04419. [Google Scholar]
- Cormen, T.H.; Leiserson, C.E.; Rivest, R.L.; Stein, C. Introduction to Algorithms, 2nd ed.; MIT Press and McGraw-Hill: London, UK, 2001; ISBN 0-262-03293-7. [Google Scholar]
- Zidane, I.M.; Ibrahim, K. Wavefront and A-Star Algorithms for Mobile Robot Path Planning; Springer: Cham, Switzerland, 2018; Volume 639, pp. 69–80. [Google Scholar] [CrossRef]
- Khoshelham, K.; Vilariño, L.D.; Peter, M.; Kang, Z.; Acharya, D. The ISPRS Benchmark on Indoor Modelling. ISPRS-Int. Arch. Photogramm. Remote Sens. Spat. Inf. Sci. 2017, 42, 367–372. [Google Scholar] [CrossRef]
- OpenVDB. Available online: https://www.openvdb.org/ (accessed on 1 May 2021).
- Point Cloud Library. Available online: https://pointclouds.org/ (accessed on 1 May 2021).
- Boost Graph library. Available online: https://www.boost.org/doc/libs/1_77_0/libs/graph/doc/index.html (accessed on 1 May 2021).


Publisher’s Note: MDPI stays neutral with regard to jurisdictional claims in published maps and institutional affiliations. |
© 2021 by the authors. Licensee MDPI, Basel, Switzerland. This article is an open access article distributed under the terms and conditions of the Creative Commons Attribution (CC BY) license (https://creativecommons.org/licenses/by/4.0/).