1. Introduction
Teleoperation allows the remote control of robotic systems by a human operator. In can be used in hazardous environments (
i.e., disaster response and bomb defusing, as well as contaminated places) [
1,
2], as well as in general remote environments difficult or expensive to be physically reached by a trained human operator (
i.e., for inspection and tele-medicine) [
3,
4]. Traditionally, feedback from a robot’s on-board sensors [
5] has been delivered via conventional screens or, more recently, through immersive virtual reality headsets, each with its own trade-offs in terms of latency, the field of view, and user comfort [
3,
6].
In fact, one major challenge is the cognitive load imposed on an operator [
7]. The complexity and diversity of teleoperation systems were recently highlighted in the ANA Avatar XPrize, where international teams developed advanced robotic avatars to perform a variety of remote tasks. Among the finalists, the number of degrees of freedom (DoFs) varied widely, from the 20 DoFs [
8] to the 54 DoFs of iCub3, which even included additional DoFs for realistic facial expressions [
9]. Some teams incorporated additional articulations for torso and waist mobility, with 2–3 extra DoFs [
9,
10,
11]. These examples reflect the complexity of anthropomorphic systems capable of natural and precise interaction with their environments.
Research has turned to supportive visual interfaces to address both the increasing mechanical complexity of high-DoF avatars and the concomitant cognitive load on operators [
12]. In particular, virtual dashboards have emerged as tools for augmenting traditional video feeds with real-time contextual cues—such as object proximity, optimal grasp points, and system status indicators—thereby lightening the cognitive burden and enhancing task precision.
Indeed, interpreting sensory information, often incomplete or inconsistent, and making real-time decisions can lead to fatigue and reduced performance [
12]. In addition, the difference between the operator’s real-world experience and their remote environment perception through virtual reality (VR) headsets can also compromise their precision and effectiveness, especially in dexterity-demanding tasks [
13]. Vision remains a critical component in these systems. All ANA Avatar XPrize finalists employed stereo cameras to enable stereoscopic 3D feedback. Some teams went further by mounting the cameras on linear actuators to dynamically adjust the stereo baseline and match the operator’s interpupillary distance, thus optimizing vergence and gaze control [
9,
14]. On the software side, scalable image resolution was used to adapt to varying bandwidth constraints [
15], while another team implemented spherical rendering to maintain low-latency head tracking and real-time video streaming [
16]. At the operator’s end, VR head-mounted displays were the most common interface, although screen-based setups were also utilized [
8]. These setups were sometimes supplemented with auxiliary camera views such as a waist-level camera feed [
8].
Furthermore, cybersickness, a common issue with VR headsets, can negatively impact operator performance and limit the extended use of immersive teleoperation systems [
17]. Recent works have adopted alternative approaches to reducing cybersickness, including the reconstruction of the remote environment via point clouds and the interactive visualization of the three-dimensional context. Such solutions enable the operator to provide a coherent spatial map, often viewable on conventional screens or desktop interfaces, thereby avoiding the perceptual misalignments typical of immersive virtual reality. In parallel, decoupled control systems (
e.g., rate control or shared control) have been introduced to mitigate the conflict between operator intentional movements and robotic responses, thus reducing the onset of nausea and fatigue. These strategies have been effective in high-precision contexts or during prolonged sessions, as reported in [
13,
17]. For instance, by providing additional information like object proximity, orientation, and other relevant data, virtual dashboards, whose effectiveness has also been demonstrated in training [
18], can also reduce cognitive load and improve the operator’s understanding of the remote environment [
12]. Moreover, integrating contextual information and visual cues can support decision-making and enhance precision [
19]. VR headsets offer a more immersive and intuitive interface, increasing the operator’s sense of connection to the remote environment.
Furthermore, supervised machine learning models—deep convolutional neural networks such as YOLO and MobileNet—have become essential components for improving teleoperation systems [
7,
12,
20,
21,
22]. In our implementation, object recognition and affordance detection are performed using inference from pre-trained deep learning models, which assist operators in identifying and manipulating objects with greater precision.
Indeed, object recognition and distance estimation algorithms can assist operators in identifying and manipulating objects [
21]. Therefore, artificial intelligence can also personalize the user interface and adapt the system to the operator’s specific needs [
13]. Techniques such as modifying the visual display with other features or incorporating additional visual-audio feedback within the VR are important to study for improving operator comfort, robot interaction, and in general, the quality of task execution. Motivated by the above, the paper focuses on the further development and integration of these technologies [
23] for assisting the operator during teleoperation tasks. The goal is to create more intuitive, efficient, and safe teleoperation systems that allow natural and precise interaction with remote environments [
24].
The remainder of this paper is structured as follows.
Section 2 describes the methodology, including the teleoperation system, the virtual dashboard, and the experimental procedure.
Section 3 presents the experimental results and statistical analysis of task performance.
Section 4 discusses the implications of the findings, while
Section 5 highlights the limitations of the current study. Finally,
Section 6 draws the main conclusions and outlines directions for future work.
2. Methods
The methodology focuses on assessing the effects of a virtual dashboard on conventional performance metrics (i.e., time, success rate, fatigue) and on the proposed Quality of Task () index. This study was conducted in a supervised experimental environment. Performance metrics include task time, user fatigue feedback, and task success rate. The virtual dashboard displays contextual data such as object position, distance, and optimal grasping points to enhance decision-making during teleoperation.
2.1. Robotic Teleoperation System
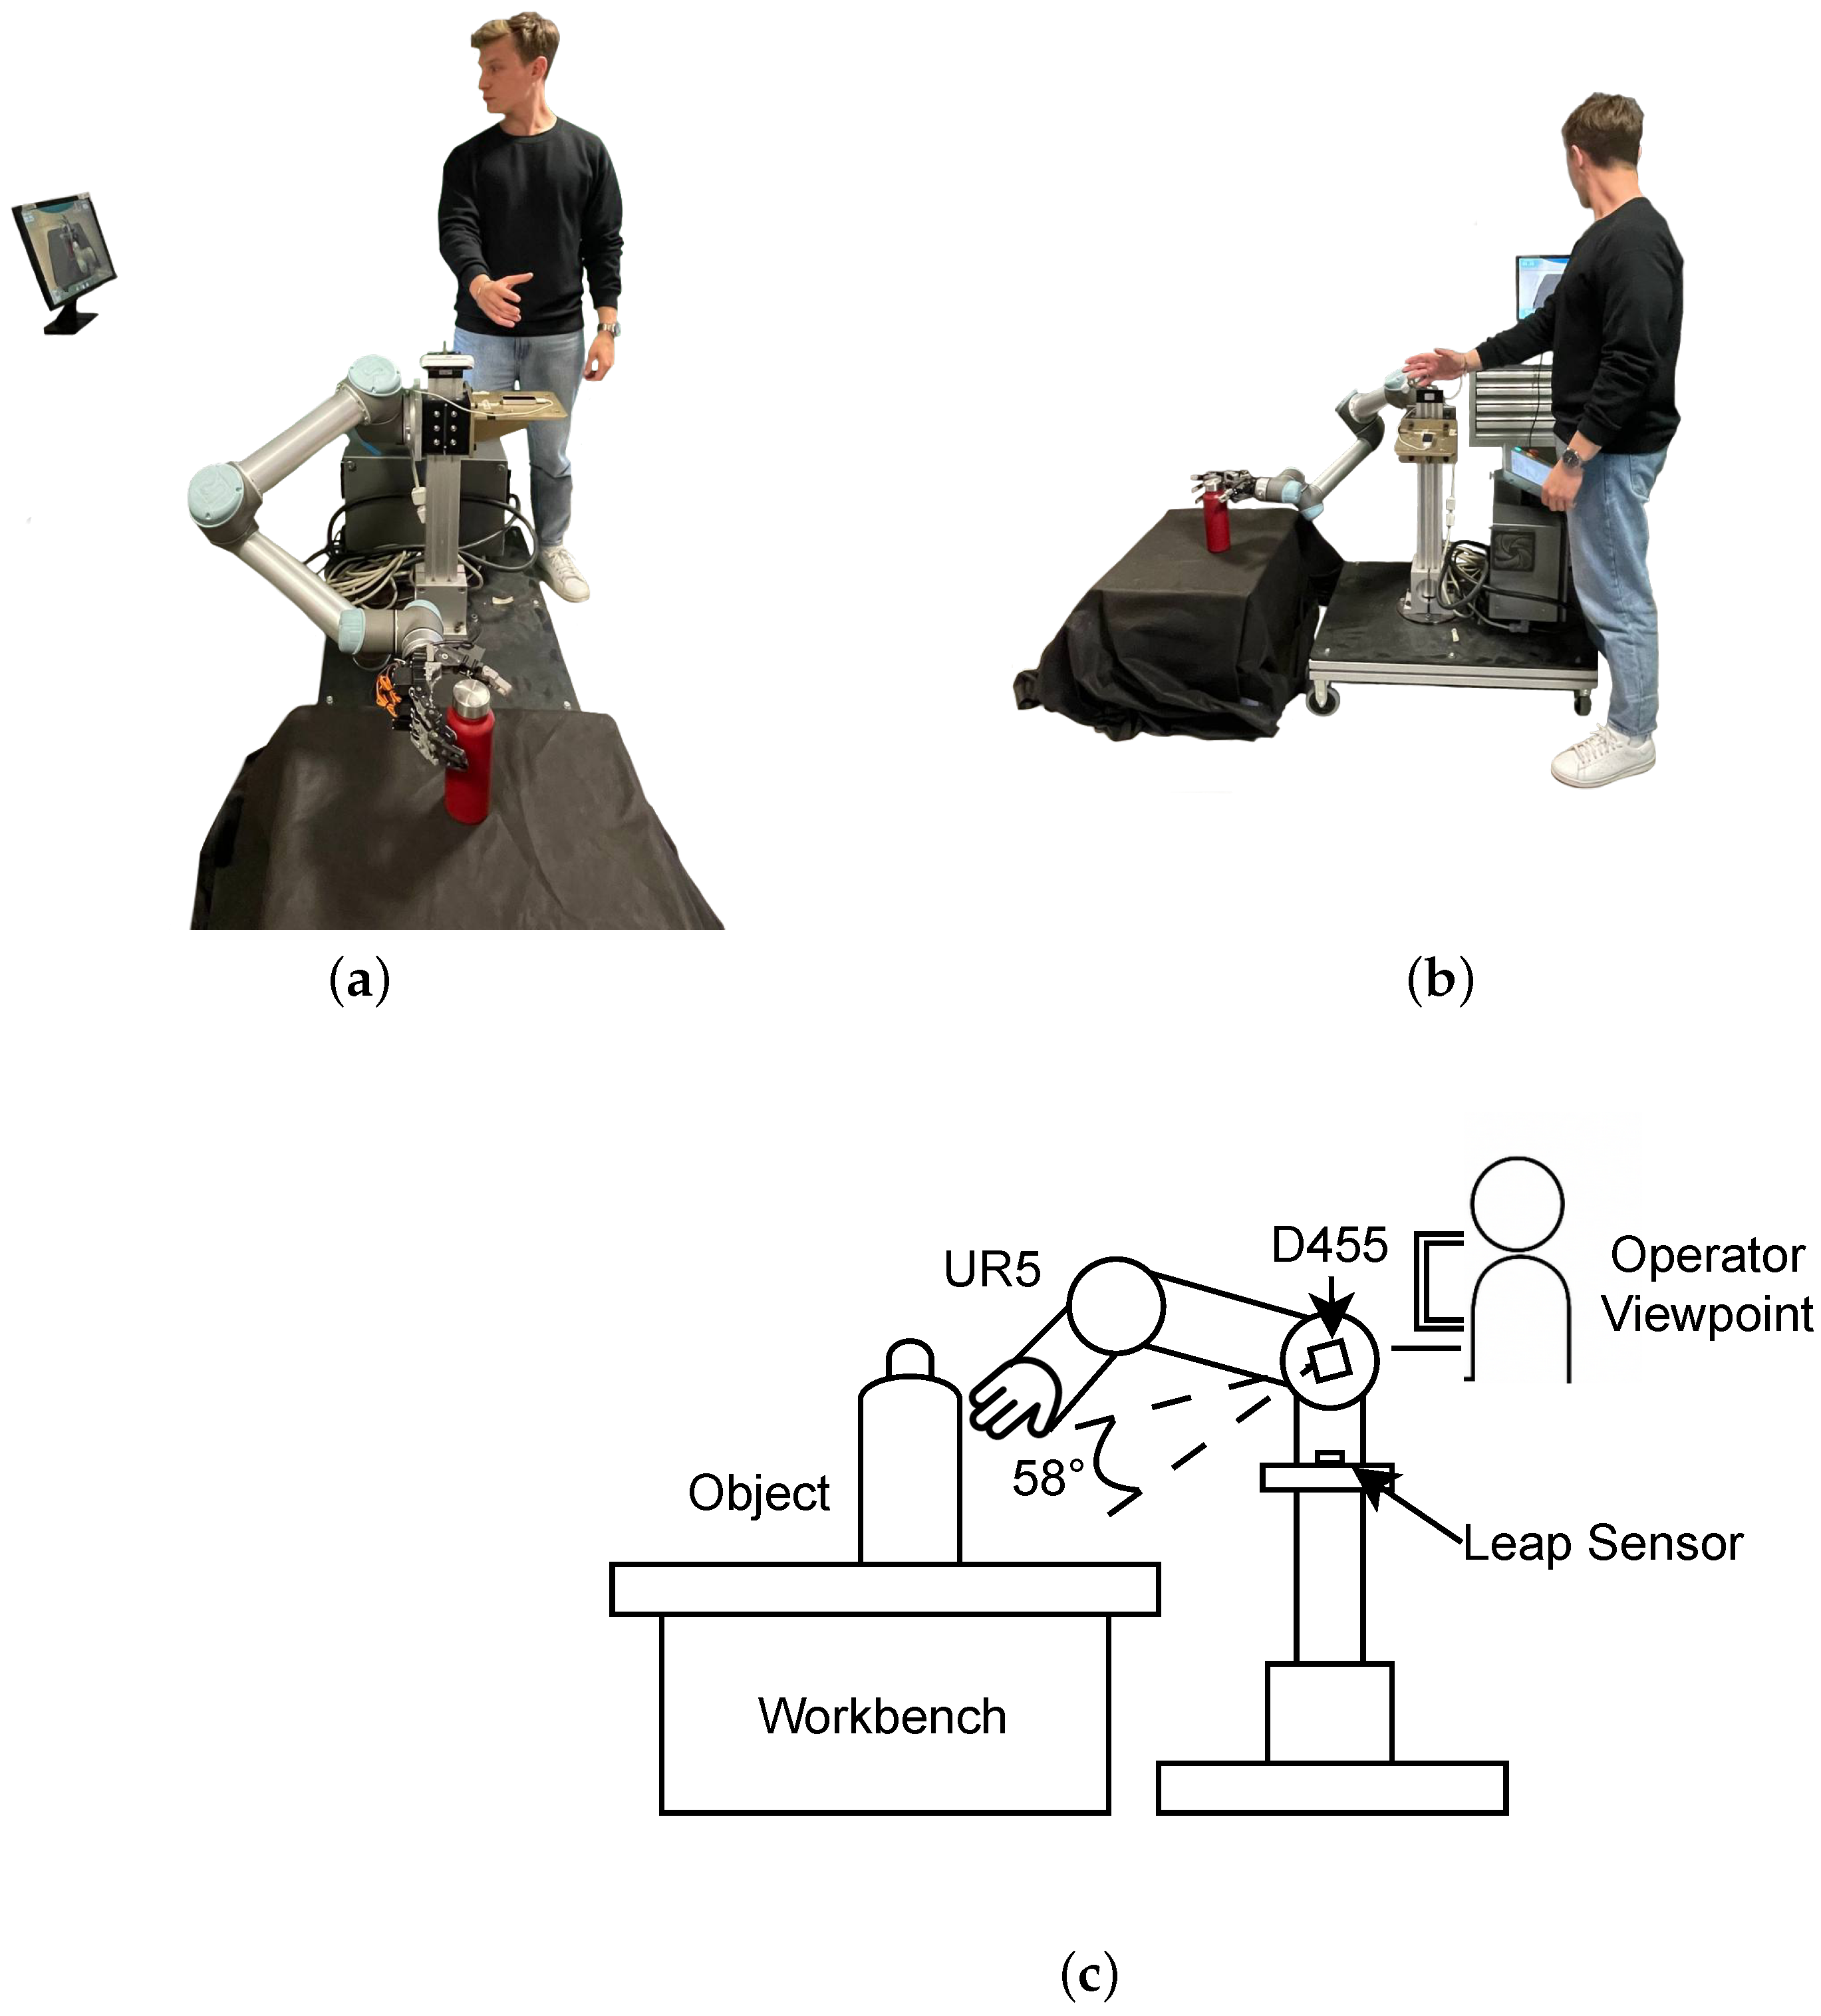
In this study, the experimental setup utilized a robotic teleoperation system, specifically the Universal Robots UR5, designed for executing pick-and-place operations using an anthropomorphic robotic arm under remote control. The system is shown in
Figure 1. The system operated in a position tracking mode, without force feedback at the level of the arm’s joints. On the operator’s side (leader), the vision-based
Leap Motion controller by Ultraleap tracked hand movements, while the remote side included a commercially available robotic arm, a custom-designed robotic hand, and a Realsense D455 RGB-D camera. The camera runs on a computer vision algorithm deployed within the
Intelligent Processing System (IPS) to obtain the object’s bounding box using YOLO11x [
12,
25,
26]. Meanwhile, a network architecture based on the retained version of MobileNetV3 has been used to implement the affordance detection algorithm, associated with the segmentation head as presented in [
22]. When selecting the affordance detection model, we considered other recent methods (LOCATE, WorldAfford, OOAL, UAD). While achieving a similar mIoU (≈0.72 vs. 0.75 for LOCATE), the adopted model counts around 5M parameters and guarantees 30 Hz inference on a CPU. Conversely, estimated maximum delivery rates are 10 Hz on the CPU for LOCATE and a higher value of 40 Hz for WorldAfford, although on high-end GPUs. OOAL and UAD, while flexible in weak learning, require dedicated hardware to maintain comparable performance. Hence, the adopted model [
22] was selected to prioritize real-time execution, considering the requirements of the teleoperation application.
2.2. Virtual Dashboard
Participants performed the teleoperation pick-and-place task by viewing the monitor in
Figure 2. The monitor presented the video stream from the robot’s camera [
12]. Participants were supported with a virtual dashboard as a Head-Up Display (HUD) during the experimentation.
To develop the HUD, a simplified approach was adopted to simulate a VR head-like interface. The dashboard was developed using Python 3.11, which has flexibility and rapid prototyping capabilities through the IPS. So, the graphical interface was created using libraries such as Tkinter and OpenCV, which allowed for the real-time visualization of data streams. This dashboard was designed to reduce cognitive load and improve operator accuracy. It is illustrated in
Figure 3.
Observing the figure at the top of the screen, the elapsed time from the start of the operation is displayed, for example, 01:26, and a percentage indicator represents the probability success rate of the grasp, which is 93%. In addition, an icon such as an Ethernet connection displayed under the time shows the connectivity link between the UR5 robot and PC via the router’s Local Area Network (LAN). Moreover, a semi-circular bar with two circles on the extreme, with the label
Distance, represents the real-time distance in percentage between the end-effector and the object. In particular, when the bar on the right circle becomes blue, the object is grasped. This data allows users to monitor the progress of the activity in real-time. A bounding box in the center of the interface highlights the object to be grasped—a red water bottle—providing a clear and precise visual reference. The bounding box color is green, meaning the probability of grasping the object is over 90%. Thus, the system considers the robotic hand’s position and orientation to the object, updating the distance between the hand and the object itself in real-time. At the bottom-left of the screen, an interactive Radar Screen or, as in gaming, a minimap shows a part of the workbench with a cone of vision from the perspective of the top view from the hand. In this minimap, the yellow circle represents the robot hand, whereas the green circle represents the object that could be grasped. The pose of the robot hand is also displayed at the bottom right of the HUD. So, button options such as Audio, Detect Object, AI Grasping Support (Support), and Warning alerts are illustrated as being activated or deactivated by the operator via the terminal PC. In this case, three options are activated with yellow color; they are the Audio, Detect Object, and Support options, whereas the Warning Alerts option is deactivated. Therefore, indicators shown on the HUD, such as elapsed time, grasp percentage, hand–object distance, and status icons, were updated at 30 Hz during task execution while also considering the UR5 packet flow. Moreover, the virtual dashboard frame was designed with a blue-based color scheme to evoke a sense of calmness and trust in the operator. Indeed, blue is often associated with tranquility and reliability, making it an ideal choice for reducing cognitive load during complex tasks [
27,
28,
29]. Empirical studies in color psychology have associated blue tones with reduced physiological arousal and improved cognitive performance in demanding environments [
27,
28,
29]. Although no formal comparison with other color schemes was conducted, the interface design was iteratively refined through informal pilot sessions with internal lab participants to ensure clarity, comfort, and non-intrusiveness. The choice was also inspired by interface conventions from popular gaming HUDs—such as
Halo,
Call of Duty, and
Diablo—where blue is frequently used to present critical information in a way that is perceptually stable and cognitively unobtrusive. Therefore, the selected color palette aimed to create a digital environment conducive to focused decision-making under operational pressure. Therefore, this color creates a soothing digital environment that facilitates user decision-making and enhances the overall user experience.
2.3. Experimental Procedure
Thirty participants (2 female, 28 male, age ) of PECRO Laboratory were engaged in this study, providing written consent to participate according to the approval of the study from the Joint Ethics Committee of the Scuola Normale Superiore and Sant’Anna School of Advanced Studies (Aut. Prot. No. 62/2024 on 16 January 2025). This number of participants was more than sufficient for statistical analysis.
Participants had a technical or scientific background due to their affiliation with the PECRO Laboratory, but none had prior hands-on experience with robotic teleoperation systems or advanced VR devices with a complex virtual dashboard. To reduce performance bias due to differing familiarity, a standardized Warm-up phase was considered, allowing each participant to become familiar with the devices and the teleoperation interface before beginning the actual experimental tasks.
The experimentation procedure was divided into five phases:
Welcome,
Learning,
Warm-up,
Experiment, and
Conclusion. The procedure is illustrated in
Figure 4. In detail, during the
Welcome phase, the participant was welcomed, and the experimental activity was introduced (
3 min). Then, the
Learning phase followed (
2 min): the participant learned the activity consisted of moving the robot’s arm and its hand using a
Leap Motion controller to pick-and-place an object, also known as the object of interest, looking the workspace throughout a monitor display (
1.5 m distance). Next, the
Warm-up phase followed. The participant was trained to control and move the robot arm and hand to pick and place the object from point A to point B on the workbench in front of the robot (
3–5 min). The distance between points A and B was 35 cm, and they were marked during the experimentation on the workbench. For simplicity, the object was always a 24 cm high per 5 cm diameter bottle. Then, the
Experiment phase began. The
Experiment phase was divided into two sessions. Each session consisted of 10 repetitions, with a total of 20 repetitions. In particular, one session provided virtual dashboard assistance, whereas the other did not. The order of these two sessions was randomized across participants to reduce the risk of learning effects or order-related bias. This ensured that performance improvements were attributable to the dashboard itself rather than task repetition or increased familiarity. So, the time to complete tasks and the success rates on pick-and-place repetitions were noted. In addition, participants replied to this question at the end of each repetition: “
What was your perceived level of fatigue on a scale of 1 (lowest) to 5 (highest)?”. Each session lasted an average of about 10 min between pauses and tasks. In the end, during the
Conclusion phase, the participant was thanked, and another participant was invited. In total, each experiment took around 30 min for each participant.
2.4. Data Collection and Performance Analysis
Data recorded during the experimental sessions are the following:
- 1.
Completion Time (T): Elapsed time from arm motion onset to successful placement, also in case of failure, of an object.
- 2.
Level of Fatigue (F): Self-reported on a 1–5 Likert scale after each repetition.
- 3.
Success Rate (S): Binary flag, 1 means successful grasping, whereas 0 means failure.
The time, fatigue, and success rate distributions without and with the use of the Virtual Dashboard (VD) were analyzed statistically to assert the following hypotheses:
- 1.
(Efficiency): The VD reduces average completion time: .
- 2.
(Fatigue): The participant reported lower fatigue when assisted: .
- 3.
(Reliability): Use of the VD increases success rate: .
Therefore, the Shapiro–Wilk (SW) test with a significance level () of 0.005 was used to verify that the data distribution, or variable, is normally distributed. This significance level represented the threshold for statistical significance. The SW null hypothesis was the following:
Then, if
is not rejected, normal distributions are compared to each other with Paired Student
t-tests. Otherwise, if
is rejected, the Wilcoxon Signed-Rank (WSR) test is used for non-normal distributions because it is more appropriate. To quantify the overall effects on the operator performance in teleoperated grasping, the Quality of Task (
) index is proposed, defined as follows:
where
S corresponds to the success rate as the mean percentage of correct tasks, that is, pick-and-place in this study,
T corresponds to the completion time, and
F corresponds to the mean fatigue reported by the participant. This index is useful because it measures the reliability, efficiency, and operator effort in a single scalar [
30,
31,
32], allowing a holistic comparison between dashboard conditions. In detail,
and
are measured for each participant
i, with
, to compare these two experimental sessions. The
and
are the set of
and
data, respectively. To assert normal distributions, the SW test is also applied on
and
. Then, also in this case, if the SW null hypothesis is not rejected, the
t-test is measured, as follows:
where
and
are the variables’ mean of
and
, respectively,
K is the number of participants in the experimentation (
i.e., 30), and
is the pooled standard deviation of measurements, calculated as
where
and
are the standard deviations of variables
and
, respectively,
n and
m are the sample sizes corresponding to the number of participants, both equal to 30.
4. Discussion
The experimental results demonstrate the advantages of integrating a virtual dashboard in teleoperation systems. The dashboard’s real-time feedback and visual guidance contributed to more accurate and efficient grasping, as confirmed by the experimental results. Specifically, the average task completion time was reduced by approximately 22%, decreasing from 32 s without the dashboard to 25 s with it. Additionally, the average self-reported fatigue score dropped from 3.86 to 1.65, indicating a 57% reduction in perceived operator effort. The task success rate also increased significantly, improving from 80% to 92%, demonstrating enhanced grasp reliability and performance with the support of the virtual dashboard. Moreover, by minimizing cognitive load, the dashboard enabled users to focus on task precision and control, leading to a more intuitive and effective manipulation experience. The time analysis revealed that the dashboard’s assistance reduced task time, suggesting that the visual support accelerates decision-making and improves reaction time. In addition, the reduced fatigue levels declared by participants highlight the dashboard’s potential in prolonged tasks, where cognitive and physical effort appear to be more critical to performance. The increased success rate in pick-and-place operations and the improved confirm the dashboard’s value in improving operator awareness and control. Moreover, to the quantitative results, participant feedback was collected during the experimental conclusion phase to assess the usability and intuitiveness of the virtual dashboard. Most participants highlighted the grasp probability indicator and the distance bar as particularly useful for coordinating the grasping action. Several also appreciated the clarity of the top-down radar (minimap), which improved spatial understanding of the robot’s position. The overall interface layout was generally perceived as intuitive and non-intrusive. However, a few users reported confusion regarding the function of certain icons—such as the Ethernet connectivity indicator—suggesting that brief onboarding or legend explanations may improve the user experience in future iterations. Therefore, this study demonstrates that integrating a virtual dashboard can be a transformative approach in teleoperation, offering benefits in precision, efficiency, and user experience. Future research should explore adaptive interfaces, multimodal feedback, and more complex manipulations in working environments to further validate these findings.
5. Limitations
A limitation of this study is the gender imbalance in our sample (2 females and 28 males, or 9% male participants). Although the sample size was statistically adequate, this demographic imbalance may have influenced the results, favoring behavioral and ergonomic characteristics typically associated with male operators. Previous studies in Human-Robot Interaction (HRI) contexts have shown that variables such as hand size, spatial reasoning strategies, and perception of cognitive load can differ between genders [
33,
34]. Therefore, future investigations should aim for a more balanced sample to assess whether the results related to performance, perceived effort, and dashboard usability vary significantly between different demographic groups.
Another limitation is the use of a single cylindrical object (the bottle) rather than a standardized set, such as the YCB [
35], commonly used to benchmark robotic manipulation tasks. This choice ensured experimental rigor in focusing on the effectiveness of the interface, but it limits the scope of the results with respect to scenarios with objects of more heterogeneous shapes, sizes, and materials. In industrial and service applications, grasping tasks often require non-trivial path planning, obstacle avoidance, and adaptation to dynamic environments. Future studies will integrate standardized objects and more complex environments to validate the generalization of the dashboard.
The third limitation is that the current experimental setup is optimized for small-sized objects. Extending the system to larger workloads will require: (1) a synchronized RGB-D sensor network or a mobile camera mounted on the robotic arm to cover a larger area; (2) real-time calibration procedures and spatial alignment techniques to maintain accuracy over different depths and object sizes; (3) adaptive viewpoint selection and field of view optimization algorithms to ensure reliability in large scenarios. Such extensions will be essential for large-scale industrial or warehouse deployments.
Finally, another limitation concerns the
Leap Motion controller used for hand tracking. Although it offers high-frequency, markerless tracking with acceptable accuracy in controlled conditions [
36], it introduces limitations in the allowed hand workspace as related to the limits of the tracked volume and occlusions of the pose of the fingers. On the other hand, within these limits, the solutions show consistent performance if compared to other hand tracking systems [
37]. In the experimentation protocol, the workspace was kept within the optimal zone, and the task did not involve hand rotations, thus reducing the impact of these criticalities. Hybrid systems (
e.g., integration of IMU and visual data) or alternative controllers could be explored in the future to increase robustness.
6. Conclusions
This research study presents the Quality of Task () index to verify the benefit of virtual dashboards in robotic teleoperation tasks. It considers different metrics such as mean task time, operator fatigue, and the number of completed tasks. The index was measured by supporting operators using a virtual dashboard. In addition, it was also measured when the operator was not supported by a virtual dashboard. Thus, indexes were compared. After statistical analysis, the Student t-test revealed that there is a difference between these indexes. Therefore, the virtual dashboard is a powerful tool for teleoperation tasks. The dashboard offers real-time visual guidance, an intuitive interface, and spatial awareness tools to create a more immersive and efficient user experience for the operator. The research results highlight reduced mean task time, lower mean operator fatigue, and improved mean success rate in completing tasks. However, the study also identifies potential areas for virtual dashboard tuning and future development, considering various challenges regarding network conditions (low bandwidth, high packet traffic, and so forth), different objects to grasp, and integration in virtual reality (VR) headsets. Also, virtual dashboards may be adapted based on user expertise and task complexity, thereby enhancing usability across a broader range of work environments. Multimodal feedback may also be used, including haptic and physiological operator information. Thus, developing machine learning algorithms for predictive assistance, fatigue, and task optimization can lead to more support for operators and/or more independent teleoperation systems. In conclusion, this research study presented the advantages of using virtual dashboards in teleoperation tasks and defined future targets for remote manipulation using VR headsets.


