Chemical Fingerprint of ‘Oblačinska’ Sour Cherry (Prunus cerasus L.) Pollen


 ,
, 
Abstract
:
1. Introduction
2. Materials and Methods
2.1. Sample Collection
2.2. Chemicals
2.3. Sample Preparation
2.4. Analysis of Carbohydrate Content
2.5. Determination of Individual Polyphenols
2.6. Statistical Analysis
3. Results and Discussion
3.1. Carbohydrate Profile
3.2. Phenolic Profile
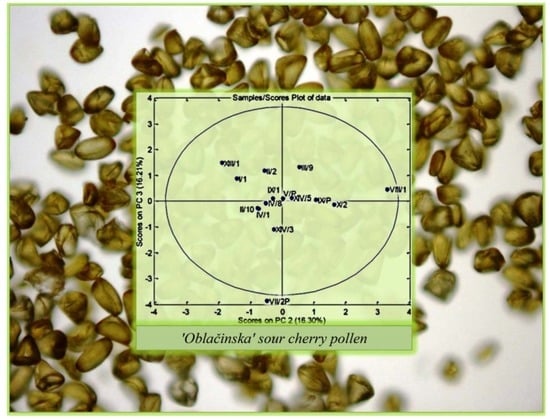
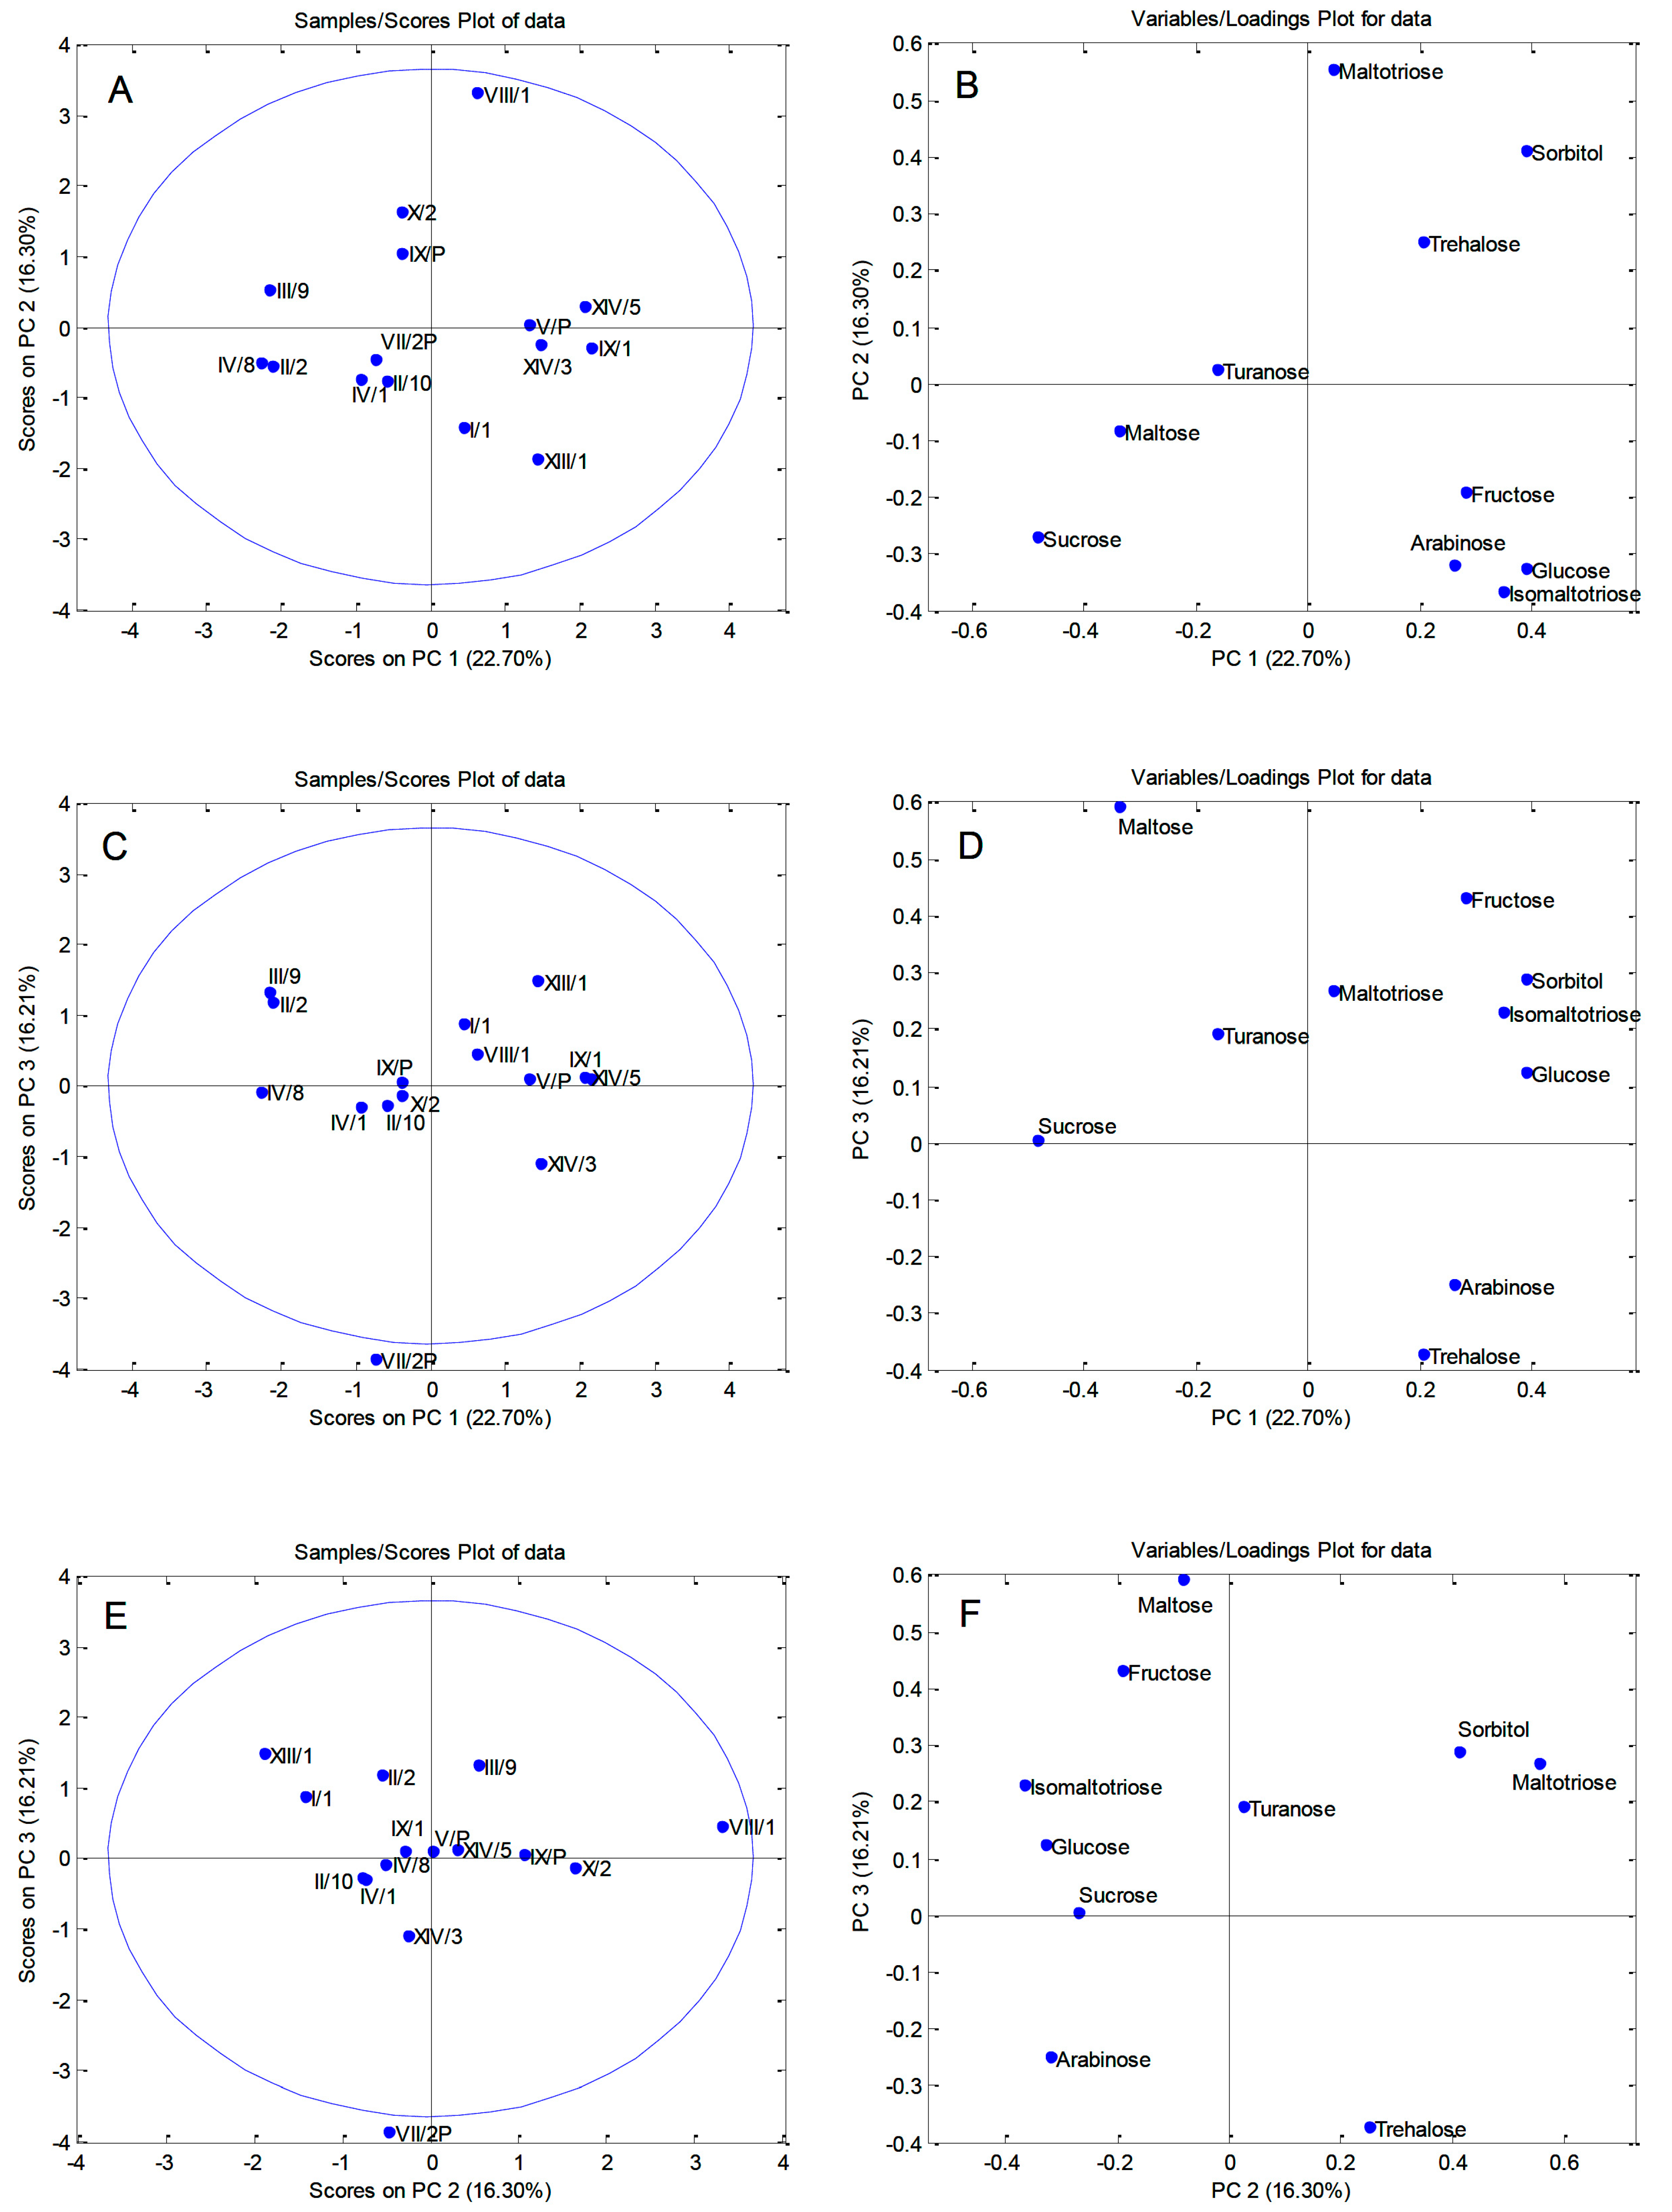
3.3. Principal Component Analysis
4. Conclusions
Author Contributions
Funding
Conflicts of Interest
References
- Castro, A.J.; Clément, C. Sucrose and starch catabolism in the anther of Lilium during its development: A comparative study among the anther wall, locular fluid and microspore/pollen fractions. Planta 2007, 225, 1573–1582. [Google Scholar] [CrossRef] [PubMed]
- Edlund, A.F.; Swanson, R.; Preuss, D. Pollen and stigma structure and function: The role of diversity in pollination. Plant Cell 2004, 16, S84–S97. [Google Scholar] [CrossRef] [PubMed]
- Hafidh, S.; Fíla, J.; Honys, D. Male gametophyte development and function in angiosperms: A general concept. Plant Reprod. 2016, 29, 31–51. [Google Scholar] [CrossRef] [PubMed]
- Almaraz-Abarca, N.; Campos, M.G.; Avila-Reyes, J.A. Variability of antioxidant activity among honeybee-collected pollen of different botanical origin. J. Sci. Technol. Am. 2004, 29, 574–578. [Google Scholar]
- Stanley, R.G.; Linskens, H.F. Pollen: Biology Biochemistry Management; Springer Science Business Media: Heidelberg, Germany, 1974. [Google Scholar]
- Rzepecka-Stojko, A.; Stojko, J.; Kurek-Górecka, A.; Górecki, M.; Kabała-Dzik, A.; Kubina, R.; Moździerz, A.; Buszman, E. Polyphenols from Bee Pollen: Structure, Absorption, Metabolism and Biological Activity. Molecules 2015, 20, 21732–21749. [Google Scholar] [CrossRef] [PubMed] [Green Version]
- Nepi, M.; Franchi, G.G.; Pacini, E. Pollen hydration status at dispersal: Cytophysiological features and strategies. Protoplasma 2001, 216, 171–180. [Google Scholar] [CrossRef]
- Bogdanov, S. Pollen: Collection, harvest, composition, quality. The Pollen Book. 2012. Chapter 1. Available online: http://www.bee-hexagon.net/ (accessed on 23 January 2019).
- Nicolson, S.W.; Human, H. Chemical composition of the ‘low quality’ pollen of sunflower (Helianthus annuus L., Asteraceae). Apidologie 2013, 44, 144–152. [Google Scholar] [CrossRef]
- Li, C.; Xu, B.; Wang, Y.; Feng, Q.; Yang, W. Effects of dietary crude protein levels on development, antioxidant status, and total midgut protease activity of honey bee (Apis mellifera ligustica). Apidologie 2012, 43, 576–586. [Google Scholar] [CrossRef]
- Manning, R. Fatty acids in pollen: A review of their importance for honeybees. Bee World 2001, 82, 60–75. [Google Scholar] [CrossRef]
- Singh, S.; Saini, K.; Jain, K.L. Quantitative comparison of lipids in some pollens and their phagostimulatory effects in honey bees. J. Apic. Res. 1999, 38, 87–92. [Google Scholar] [CrossRef]
- Szczesna, T. Long chain fatty acids composition of honeybee-collected pollen. J. Apic. Sci. 2006, 50, 65–79. [Google Scholar]
- Zhang, H.; Wang, X.; Wang, K.; Li, C. Antioxidant and tyrosinase inhibitory properties of aqueous ethanol extracts from monofloral bee pollen. J. Apic. Sci. 2015, 59, 119–128. [Google Scholar] [CrossRef]
- Irwin, R.E.; Adler, L.S.; Brody, A.K. The dual role of floral traits: Pollinator attraction and plant defense. Ecology 2004, 85, 1503–1511. [Google Scholar] [CrossRef]
- Richardson, L.L.; Adler, L.S.; Leonard, A.S.; Andicoechea, J.; Regan, K.H.; Anthony, W.E.; Manson, J.S.; Irwin, R.E. Secondary metabolites in floral nectar reduce parasite infections in bumblebees. Proc. R. Soc. Lond. B Biol. Sci. 2015, 282, 20142471. [Google Scholar] [CrossRef]
- Lecocq, A.; Green, A.A.; Pinheiro De Castro, É.C.; Olsen, C.E.; Jensen, A.B.; Zagrobelny, M. Honeybees Tolerate Cyanogenic Glucosides from Clover Nectar and Flowers. Insects 2018, 9, 31. [Google Scholar] [CrossRef]
- Palmer-Young, E.C.; Sadd, B.M.; Stevenson, P.C.; Irwin, R.E.; Adler, L.S. Bumble bee parasite strains vary in resistance to phytochemicals. Sci. Rep. 2016, 6, 37087. [Google Scholar] [CrossRef]
- Firon, N.; Nepi, M.; Pacini, E. Water status and associated processes mark critical stages in pollen development and functioning. Ann. Bot. 2012, 109, 1201–1214. [Google Scholar] [CrossRef] [Green Version]
- Almeida-Muradian, L.B.; Pamplona, L.C.; Coimbra, S.; Barth, O.M. Chemical composition and botanical evaluation of dried bee pollen pellets. J. Food Compos. Anal. 2005, 18, 105–111. [Google Scholar] [CrossRef]
- Brodschneider, R.; Crailsheim, K. Nutrition and health in honey bees. Apidologie 2010, 41, 278–294. [Google Scholar] [CrossRef]
- Morgano, M.A.; Martins, M.C.T.; Rabonato, L.C.; Milani, R.F.; Yotsuyanagi, K.; Rodriguez-Amaya, D.B. A comprehensive investigation of the mineral composition of Brazilian bee pollen: Geographic and seasonal variations and contribution to human diet. J. Braz. Chem. Soc. 2012, 23, 727–736. [Google Scholar] [CrossRef]
- Dötterl, S.; Vereecken, N.J. The chemical ecology and evolution of bee-flower interactions: A review and perspectives. Can. J. Zool. 2010, 88, 668–697. [Google Scholar] [CrossRef]
- Dyer, A.G.; Paulk, A.C.; Reser, D.H. Colour processing in complex environments: Insights from the visual system of bees. Proc. Biol. Sci. 2011, 278, 952–959. [Google Scholar] [CrossRef]
- Sedivy, C.; Muüller, A.; Dorn, S. Closely related pollen generalist bees differ in their ability to develop on the same pollen diet: Evidence for physiological adaptations to digest pollen. Funct. Ecol. 2011, 25, 718–725. [Google Scholar] [CrossRef]
- Vanderplanck, M.; Vereecken, N.J.; Grumiau, L.; Esposito, F.; Lognay, G.; Wattiez, R.; Michez, D. The importance of pollen chemistry in evolutionary host shifts of bees. Sci. Rep. 2017, 7, 43058. [Google Scholar] [CrossRef]
- Morais, M.; Moreira, L.; Feás, X.; Estevinho, L.M. Honeybee-collected pollen from five Portuguese Natural Parks: Palynological origin, phenolic content, antioxidant properties and antimicrobial activity. Food Chem. Toxicol. 2011, 49, 1096–1101. [Google Scholar] [CrossRef] [Green Version]
- Alaux, C.; Dantec, C.; Parrinello, H.; Le Conte, Y. Nutrigenomics in honey bees: Digital gene expression analysis of pollen’s nutritive effects on healthy and varroa-parasitized bees. BMC Genom. 2011, 12, 496. [Google Scholar] [CrossRef]
- Degrandi-Hoffman, G.; Chen, Y.; Huang, E.; Huang, M.H. The effect of diet on protein concentration, hypopharyngeal gland development and virus load in worker honey bees (Apis mellifera L.). J. Insect Physiol. 2010, 56, 1184–1191. [Google Scholar] [CrossRef]
- Vásquez, A.; Olofsson, T.C. The lactic acid bacteria involved in the production of bee pollen and bee bread. J. Apic. Res. Bee World 2009, 48, 189–195. [Google Scholar] [CrossRef]
- Khider, M.; Elbanna, K.; Mahmoud, A.; Owayss, A.A. Egyptian honeybee pollen as antimicrobial, antioxidant agents, and dietary food supplements. Food Sci. Biotechnol. 2013, 22, 1–9. [Google Scholar] [CrossRef]
- Solgajová, M.; Ivanišová, E.; Nôžkova, J.; Frančáková, H.; Tóth, Ž.; Dráb, Š. Antioxidant activity and polyphenol content of malt beverages enriched with bee pollen. J. Microbiol. Biotech. Food Sci. 2014, 3, 281–284. [Google Scholar]
- Mărgăoan, R.; Mărghitaş, L.A.; Dezmirean, D.; Mihai, C.M.; Bobiş, O. Bee collected pollen-general aspects and chemical composition. Bull. Univ. Agric. Sci. Vet. 2010, 67, 254–259. [Google Scholar]
- Haro, A.; López-Aliaga, I.; Lisbona, F.; Barrionuevo, M.; Alférez, M.J.; Campos, M.S. Beneficial effect of pollen and/or propolis on the metabolism of iron, calcium, phosphorus, and magnesium in rats with nutritional ferropenic anemia. J. Agric. Food Chem. 2000, 48, 5715–5722. [Google Scholar] [CrossRef]
- Denisow, B.; Denisow-Pietrzyk, M. Biological and therapeutic properties of bee pollen: A review. J. Sci. Food Agric. 2016, 96, 4303–4309. [Google Scholar] [CrossRef]
- Komosinska-Vassev, K.; Olczyk, P.; Kaźmierczak, J.; Mencner, L.; Olczyk, K. Bee pollen chemical composition and therapeutic application. J. Evid. Based Complement. Altern. Med. 2015, 2015, 297425. [Google Scholar] [CrossRef]
- Hamamoto, R.; Ishiyama, K.; Yamaguchi, M. Inhibitory effects of bee pollen Cistus ladaniferus extract on bone resorption in femoral tissues and osteoclast-like cell formation in bone marrow cells in vitro. J. Health Sci. 2006, 52, 268–275. [Google Scholar] [CrossRef]
- Estevinho, L.M.; Rodrigues, S.; Pereira, A.P.; Feaás, X. Portuguese bee pollen: Palynological study nutritional and microbiological evaluation. Int. J. Food Sci. Technol. 2012, 47, 429–435. [Google Scholar] [CrossRef]
- Park, H.K.; Kim, S.K.; Lee, S.W.; Chung, J.H.; Lee, B.C.; Na, S.W.; Park, C.G.; Kim, Y.O. A herbal formula, comprising Panax ginseng and bee–pollen, inhibits development of testosterone induced benign prostatic hyperplasia in male Wistar rats. Saudi J. Biol. Sci. 2017, 24, 1555–1561. [Google Scholar] [CrossRef]
- Al–Salem, H.S.; Bhat, R.S.; Al–Ayadhi, L.; El-Ansary, A. Therapeutic potency of bee pollen against biochemical autistic features induced through acute and sub–acute neurotoxicity of orally administered propionic acid. BMC Complement. Altern. Med. 2016, 16, 120. [Google Scholar] [CrossRef]
- Spulber, R.; Vladu, M.G.; Popa, O.; Băbeanu, N. Phenolic content and potential inhibitory activity of Romanian bee pollen on different plant pathogenic strains. Sci. Bull. Ser. F Biotechnol. 2017, 21, 104–108. [Google Scholar]
- Food and Agriculture Organization Corporate Statistical Database. 2019. Available online: http://www.fao.org/faostat/en/#data/QC (accessed on 23 June 2019).
- Rakonjac, V.; Fotirić Akšić, M.; Nikolić, D.; Milatović, D.; Čolić, S. Morphological characterization of ‘Oblačinska’ sour cherry by multivariate analysis. Sci. Hortic. 2010, 125, 679–684. [Google Scholar] [CrossRef]
- Alrgei, H.O.; Dabić, D.; Natić, M.; Rakonjac, V.; Milojković-Opsenica, D.; Tešić, Ž.; Fotirić Akšić, M. Chemical profile of major taste- and health-related compounds of (Oblačinska) sour cherry. J. Sci. Food Agric. 2016, 63, 7476–7486. [Google Scholar] [CrossRef]
- Guffa, B.; Nedić, N.; Dabić Zagorac, D.; Tosti, T.; Gašić, U.; Natić, M.; Fotirić Akšić, M. Characterization of Sugar and Polyphenolic Diversity in Floral Nectar of Different ‘Oblacinska’ Sour Cherry Clones. Chem. Biodivers. 2017, 14, e1700061. [Google Scholar] [CrossRef]
- Meier, U.; Graf, H.; Hack, H.; Hess, M.; Kennel, W.; Klose, R.; Mappes, D.; Seipp, D.; Stauß, R.; Streif, J.; et al. Phanologische Entwicklungsstadien des Kernobstes (Malus domestica Borkh. und Pyrus communis L.), des Steinobstes (Prunus-Arten), der Johannisbeere (Ribes-Arten) und der Erdbeere (Fragaria × ananassa Duch.). Nachr. Des. Dtsch. Pflanzenschutzd. 1994, 46, 141–153. [Google Scholar]
- Yadav, S.K.; Singh, V.; Jyothi Lakshmi, N.; Vanaja, M.; Maheswari, M.; Tiwari, Y.K.; Patil, A.; Nagendram, E.; Venkateswarlu, B. Carbohydrates and Sucrose Metabolizing Enzymes in the Leaves of Vigna mungo Genotypes as Influenced by Elevated CO2 Concentration. J. Agric. Sci. Technol. 2013, 15, 1107–1120. [Google Scholar]
- Taha, E.K.A. Chemical Composition and Amounts of Mineral Elements in Honeybee-Collected Pollen in Relation to Botanical Origin. J. Apic. Sci. Vol. 2015, 59, 75–81. [Google Scholar] [CrossRef]
- Nicholls, E.K.; Ehrendreich, D.; de Ibarra, N.H. Differences in color learning between pollen- and sucrose-rewarded bees. Commun. Integr. Biol. 2015, 8, e1052921. [Google Scholar] [CrossRef] [Green Version]
- Figueroa, C.G.; Iturriaga, G.; Valenzuela, E.M. Actividad de trehalosa 6-fosfato sintasa en plantas de selaginella lepidophylla en respuesta a hidratación y desecación. Rev. Fitotec. Mex. 2004, 27, 17–22. [Google Scholar]
- Bogdanov, S. Contaminants of bee products. Apidologie 2006, 37, 1–18. [Google Scholar] [CrossRef]
- Negri, G.; Teixeira, E.W.; Alves, M.L.; Moreti, A.C.; Otsuk, I.P.; Borguini, R.G.; Salatino, A. Hydroxycinnamic acid amide derivatives, phenolic compounds and antioxidant activities of extracts of pollen samples from Southeast Brazil. J. Agric. Food Chem. 2011, 59, 5516–5522. [Google Scholar] [CrossRef]
- Serra Bonvehí, J.; Soliva Torrentó, M.; Centelles Lorente, E. Evaluation of polyphenolic and flavonoid compounds in honeybee-collected pollen produced in Spain. J. Agric. Food Chem. 2001, 49, 1848–1853. [Google Scholar] [CrossRef]
- Tajik, N.; Tajik, M.; Mack, I.; Enck, P. The potential effects of chlorogenic acid, the main phenolic components in coffee, on health: A comprehensive review of the literature. Eur. J. Nutr. 2017, 56, 2215–2244. [Google Scholar] [CrossRef]
- Magnani, C.; Isaac, V.L.B.; Correa, M.A.; Salgado, H.R.N. Caffeic acid: A review of its potential use in medications and cosmetics. Anal. Methods 2014, 6, 3203–3210. [Google Scholar] [CrossRef]
- Akdemir, M.; Okulu, K.; Kösemehmetoglu, K.; Ener, K.; Topal, F.; Evirgen, O.; Gürleyik, E.; Avci, A. Evaluation of the protective effect of quercetin against cisplatin-in-duced renal and testis tissue damage and sperm parameters in rats. Andrologia 2014, 46, 1089–1097. [Google Scholar] [CrossRef]
- Dias, L.G.; Tolentino, G.; Pascoal, A.; Estevinho, L.M. Effect of processing conditions on the bioactive compounds and biological properties of bee pollen. J. Apic. Res. 2016, 55, 357–365. [Google Scholar] [CrossRef] [Green Version]
- Ganeshpurkar, A.; Saluja, A.K. The Pharmacological Potential of Rutin. Saudi Pharm. J. 2017, 25, 149–164. [Google Scholar] [CrossRef]
- Graikou, K.; Kapeta, S.; Aligiannis, N.; Sotiroudis, G.; Chondrogianni, N.; Gonos, E.; Chinou, I. Chemical analysis of Greek pollen–Antioxidant, antimicrobial, and proteasome activation properties. Chem. Cent. J. 2011, 5, 33. [Google Scholar] [CrossRef]
- Al-Samarrai, R.R.H.; Al–Samarrai, A.M.H.; Al-Salihi, F.G. Identification of Flavonoids in Iraqi Date Palm Pollen by HPLC. Orient. J. Chem. 2017, 33, 985–988. [Google Scholar] [CrossRef]
- Tattini, M.; Di Ferdinando, M.; Brunetti, C.; Goti, A.; Pollastri, S.; Bellasio, C.; Giordano, C.; Fini, A.; Agati, G. Esculetin and esculin (esculetin 6-O-glucoside) occur as inclusions and are differentially distributed in the vacuole of palisade cells in Fraxinus ornus leaves: A fluorescence microscopy analysis. J. Photochem. Photobiol. B 2014, 140, 28–35. [Google Scholar] [CrossRef]


| Name | tR (min) | LOD × 10−3 (µg/mL) | LOQ × 10−3 (µg/mL) | R (%) |
|---|---|---|---|---|
| Sorbitol | 2.76 | 0.19 | 0.57 | 102 |
| Trehalose | 3.55 | 0.25 | 0.76 | 109 |
| Arabinose | 4.85 | 0.19 | 0.58 | 98 |
| Glucose | 5.55 | 0.06 | 0.17 | 103 |
| Fructose | 6.41 | 0.08 | 0.24 | 104 |
| Isomaltose | 8.70 | 0.12 | 0.35 | 97 |
| Sucrose | 9.20 | 0.09 | 0.26 | 99 |
| Turanose | 14.90 | 0.05 | 0.16 | 105 |
| Maltose | 17.89 | 0.10 | 0.30 | 101 |
| Maltotriose | 23.12 | 0.15 | 0.48 | 95 |
| No | Compound | Parent Ion, m/z | Product Ion, m/z (CE, eV) | tR, min | LOD | LOQ | R2 |
|---|---|---|---|---|---|---|---|
| Benzoic Acid Derivatives | |||||||
| 1 | Protocatechuic acid | 153.013 | 108.09 (23); 109.10 (14) | 4.44 | 0.10 | 0.34 | 0.9980 |
| 2 | p-Hydroxybenzoic acid | 137.057 | 93.19 (19); 108.33 (22) | 4.68 | 0.14 | 0.48 | 0.9934 |
| 3 | Vanillic acid | 167.034 | 153.00 (15); 108.00 (21) | 5.67 | 0.02 | 0.08 | 0.9957 |
| 4 | Syringic acid | 197.046 | 153.02 (16); 182.02 (21) | 6.07 | 0.04 | 0.13 | 0.9968 |
| 5 | Ellagic acid | 300.98 | 284.00 (32); 300.04 (30) | 6.76 | 0.11 | 0.37 | 0.9938 |
| Cinnamic Acid Derivatives | |||||||
| 6 | Chlorogenic acid | 353.103 | 191.28 (25) | 5.33 | 0.08 | 0.27 | 0.9980 |
| 7 | Caffeic acid | 179.004 | 134.00 (13); 135.00 (16) | 5.82 | 0.11 | 0.38 | 0.9951 |
| 8 | p-Coumaric acid | 163.031 | 93.12 (39); 119.09 (16) | 6.67 | 0.12 | 0.41 | 0.9947 |
| 9 | Ferulic acid | 193.057 | 134.00 (18); 178.00 (15) | 6.93 | 0.15 | 0.50 | 0.9933 |
| 10 | Sinapic acid | 223.082 | 149.21 (36) | 6.95 | 0.08 | 0.26 | 0.9984 |
| 11 | Cinnamic acid | 147.050 | 103.00 (10); 129.00 (10) | 8.73 | 0.07 | 0.22 | 0.9991 |
| Flavonoid Glycosides | |||||||
| 12 | Rutin | 609.197 | 299.98 (42); 301.20 (32) | 6.42 | 0.09 | 0.31 | 0.9976 |
| 13 | Hyperoside | 463.100 | 300.00 (30); 271.00 (43) | 6.67 | 0.10 | 0.34 | 0.9976 |
| 14 | Cynaroside | 447.090 | 285.00 (30) | 6.91 | 0.12 | 0.40 | 0.9975 |
| 15 | Apiin | 563.140 | 465.00 (25); 269.00 (46) | 6.97 | 0.11 | 0.38 | 0.9956 |
| 16 | Naringin | 579.241 | 151.42 (43); 217.26 (33) | 7.01 | 0.16 | 0.53 | 0.9937 |
| 17 | Astragalin | 447.090 | 284.00 (33) | 7.03 | 0.14 | 0.46 | 0.9975 |
| Flavonoid Aglycones | |||||||
| 18 | Catechin | 289.094 | 203.00 (23); 245.03 (31) | 5.41 | 0.14 | 0.45 | 0.9953 |
| 19 | Luteolin | 285.035 | 133.05 (30); 150.95 (24) | 8.45 | 0.10 | 0.32 | 0.9958 |
| 20 | Apigenin | 269.032 | 117.24 (43); 149.00 (24) | 9.12 | 0.11 | 0.36 | 0.9981 |
| 21 | Naringenin | 271.036 | 119.10 (25); 151.07 (19) | 9.22 | 0.09 | 0.28 | 09974 |
| 22 | Kaempferol | 285.074 | 211.00 (32); 227.00 (32) | 9.39 | 0.04 | 0.13 | 0.9961 |
| Other Phenolics | |||||||
| 23 | Aesculin | 339.080 | 133.09 (44); 177.06 (25) | 4.95 | 0.01 | 0.05 | 0.9999 |
| 24 | Phlorizin | 435.149 | 273.16 (20); 167.16 (34) | 7.37 | 0.05 | 0.15 | 0.9978 |
| 25 | Coniferyl aldehyde | 177.060 | 162.00 (17); 97.00 (14) | 7.70 | 0.03 | 0.08 | 0.9968 |
| 26 | Aesculetin | 176.992 | 133.28 (19); 105.25 (20) | 7.71 | 0.10 | 0.34 | 0.9969 |
| Carbohydrates/Clones | I/1 | II/2 | II/10 | III/9 | IV/1 | IV/8 | V/P | VII/2P | VIII/1 | IX/1 | IX/P | X/2 | XIII/1 | XIV/3 | XIV/5 |
|---|---|---|---|---|---|---|---|---|---|---|---|---|---|---|---|
| Sorbitol | 16.00 e | 14.03 d | 9.87 b | 11.28 c | 7.22 a | 8.01 a | 17.41 f | 7.12 a | 22.38 h | 16.68 e,f | 21.03 g | 14.96 d | 14.83 d | 17.30 f | 17.24 f |
| Trehalose | 4.03 e | 0.93 a | 1.58 b | 2.36 c | 3.54d e | 3.19 c,d | 2.98 c | 4.73 f | 5.31 g | 2.50 c | 1.84 b | 2.36 c | 1.52 b | 4.23 e,f | 4.56 f |
| Arabinose | 0.35 b | 0.48 c | 0.30 b | 0.23 a,b | 0.46 c | 0.20 a | 0.64 d | 0.49 c | 0.17 a | 0.34 b | 0.28 b | 0.18 a | 0.38 b | 0.74 e | 0.49 c |
| Glucose (G) | 136.71 k | 89.77 b | 116.71 h | 86.44 a | 95.69 d | 91.46 c | 95.44 d | 102.38 e | 107.47 f | 132.49 j | 92.61 c | 85.83 a | 129.51 i | 95.42 d | 110.68 g |
| Fructose (F) | 92.73 j | 68.57 b | 83.52 f,g | 85.04 h | 87.45 i | 71.60 c | 91.69 j | 56.72 a | 74.70 d | 82.17 e,f | 67.25 b | 81.31 e | 86.96 i | 82.46 e,f | 84.45 g,h |
| Sucrose | 66.40 j | 75.11 k | 56.12 g | 73.97 k | 50.75 f | 59.38 h | 38.58 b | 63.84 i | 38.64 b | 31.92 a | 36.68 b | 42.58 c | 41.83 c | 46.88 e | 44.78 d |
| Isomaltotriose | 0.91 e | 1.16 f | 0.49 a | 0.78 d | 0.67 c | 0.94 e | 0.92 e | 0.69 c,d | 0.48 a | 1.34 g | 0.65 c | 0.56 b | 1.92 i | 1.20 f | 1.81 h |
| Turanose | 0.38 c | 0.39 c,d | 0.16 a | 0.44 d | 0.60 f | 0.85 g | 0.27 b | 0.28 b | 0.47 d,e | 0.35 b,c | 0.60 f | 0.36 b,c | 0.54 e,f | 0.38 c | 0.55 e,f |
| Maltose | 7.17 e | 8.60 f | 5.27 c | 7.48 e | 6.27 d | 6.54 d | 5.64 c | 2.31 a | 6.05 c | 3.84 b | 5.61 c | 4.23 b | 5.94 c | 4.36 b | 4.02 b |
| Maltotriose | 0.18 a | 0.38 c | 0.26 b | 0.47 d | 0.24 b | 0.18 a | 0.32 c | 0.19 a | 0.54 e | 0.30 b,c | 0.20 a | 0.40 c,d | 0.22 a,b | 0.28 b,c | 0.44 d |
| G/F ratio | 1.47 | 1.31 | 1.40 | 1.02 | 1.09 | 1.28 | 1.04 | 1.81 | 1.44 | 1.61 | 1.38 | 1.06 | 1.49 | 1.16 | 1.31 |
| Total | 324.86 | 259.42 | 274.28 | 268.49 | 252.89 | 242.35 | 253.89 | 238.75 | 256.21 | 271.93 | 226.75 | 232.77 | 283.65 | 253.25 | 269.02 |
| No | Phenolic Compounds/Clones | I/1 | II/2 | II/10 | III/9 | IV/1 | IV/8 | V/P | VII/2P | VIII/1 | IX/1 | IX/P | X/2 | XIII/1 | XIV/3 | XIV/5 | ||
|---|---|---|---|---|---|---|---|---|---|---|---|---|---|---|---|---|---|---|
| Benzoic Acid Derivatives | ||||||||||||||||||
| 1 | Protocatechuic acid | 0.42 d | – | – | – | – | 0.10 b | – | 0.11 b | 0.54 e | 0.04 a | 0.12 b | 0.08 a,b | 0.34 c | 0.64 f | 0.04 a | ||
| 2 | p-Hydroxybenzoic acid | 4.45 e | 1.70 b | 2.91 c | 3.62 d | 2.37 c | 5.57 f | 0.75 a | 3.63 d | 7.80 g | 2.46 c | 3.62 d | 2.86 c | 7.85 g | 5.50 f | 3.81 d,e | ||
| 3 | Vanillic acid | 10.68 g | 1.52 b | 1.75 b | 2.16 c | 2.58 c | 3.47 d | 0.57 a | 4.54 e | 10.68 g | 1.35 b | 2.16 c | 1.39 b | 10.92 g | 7.74 f | 2.82 c | ||
| 4 | Syringic acid | 0.65 b | 0.58 b | 0.61 b | 0.95 e | 0.64 b | 1.22 f | 0.20 a | 0.55 b | 0.65 b | 0.54 b | 0.73 c | 0.80 d | 0.72 c | 0.72 c | 0.59 b | ||
| 5 | Ellagic acid | – | 0.37 d | – | – | – | – | 0.02 a | 0.04 a | 1.75 e | 0.17 b | 0.08 a | 0.28 c | – | 0.06 a | – | ||
| Total | 16.20 | 4.17 | 5.27 | 6.73 | 5.59 | 10.36 | 1.54 | 8.87 | 21.42 | 4.56 | 6.71 | 5.41 | 19.83 | 14.66 | 7.26 | |||
| Cinnamic Acid Derivatives | ||||||||||||||||||
| 6 | Chlorogenic acid | 43.70 f | 29.28 c | 23.64 b | 59.93 j | 34.24 d | 42.57 f | 7.27 a | 37.23 e | 58.93 j | 33.21 d | 38.46 e | 47.66 g | 53.33 h | 56.85 i | 24.92 b | ||
| 7 | Caffeic acid | 5.51 c | 1.99 a | 3.56 b | 5.03 c | 3.18 b | 15.95 f | 1.36 a | 3.78 b | 15.35 f | 2.99 b | 3.98b c | 4.23 c | 6.17 d | 12.94 e | 3.46 b | ||
| 8 | p-Coumaric acid | 29.89 e | 10.52 b | 19.84 c | 26.54 d | 18.19 c | 51.20 h | 4.82 a | 24.58 d | 53.99 h | 18.60 c | 23.49 d | 18.45 c | 42.94 g | 39.03 f | 24.29 d | ||
| 9 | Ferulic acid | 35.22 g | 10.68 b | 19.01 d | 24.83 f | 16.81 c | 56.70 i | 7.11 a | 21.99 e | 43.93 h | 16.87 c | 18.71 d | 21.68 e | 43.60 h | 42.46 h | 20.76 d,e | ||
| 10 | Sinapic acid | 1.79 d,e | – | – | 1.59 c,d | – | 5.21 f | 0.22 a | – | – | – | – | 0.83 b | 1.42 c | 2.28 e | – | ||
| 11 | Cinnamic acid | 2.44 g | 0.59 b | 0.90 c | 1.04 c | 1.22 d | 1.61 e | 0.19 a | 1.18 d | 2.75 h | 0.99 c | 1.00 c | 1.00 c | 1.95 f | 1.54 e | 1.16 d | ||
| Total | 118.55 | 53.06 | 66.95 | 118.96 | 73.64 | 173.24 | 20.97 | 88.76 | 174.95 | 72.66 | 81.66 | 93.85 | 149.41 | 155.10 | 74.59 | |||
| Flavonoid Glycosides | ||||||||||||||||||
| 12 | Rutin | 92.96 b | 93.51 b | 118.96 e | 181.12 i | 113.01 d | 157.95 h | 50.28 a | 114.38 d | 112.89 d | 106.34 c | 117.42 e | 139.47 f | 119.42 e | 144.43 g | 107.03 c | ||
| 13 | Hyperoside | 9.68 b | 9.44 b | 11.07 c | 18.10 d | 11.08 c | 17.85 b | 4.82 a | 12.07 c | 11.05 c | 10.44 c | 12.15 c,d | 13.31 d | 11.66 c | 13.91 d | 11.03 c | ||
| 14 | Cynaroside | 6.14 f | 0.34 a | – | 1.15 c | 0.76 a,b | 5.22 e | – | 0.91 b | – | 2.41 d | – | – | 5.83 e,f | 2.58 d | 0.91 b | ||
| 15 | Apiin | 0.08 c | 0.01 a | 0.04 b | 0.04 b | – | 0.09 c | – | 0.05 b | 0.16 d | 0.04 b | 0.05 b | 0.03 a,b | – | 0.06 b | 0.05 b | ||
| 16 | Naringin | 0.22 c | 0.08 a | 0.14 b | 0.17 b | 0.13 b | 0.28 d | 0.05 a | 0.15 b | 0.34 e | 0.14 b | 0.16 b | 0.17 b | 0.24 c | 0.21 c | 0.15 b | ||
| 17 | Astragalin | 15.04 b | 14.05 b | 18.32 d | 22.82 e | 14.17 b | 31.17 f | 7.40 a | 15.38 b | 16.90 b | 14.75 b | 16.98 b | 20.42 d,e | 16.86 b | 19.10 d | 14.84 b | ||
| Total | 124.12 | 117.43 | 148.53 | 223.40 | 139.15 | 212.56 | 62.55 | 142.94 | 141.34 | 134.12 | 146.76 | 173.40 | 154.01 | 180.29 | 134.01 | |||
| Flavonoid Aglycones | ||||||||||||||||||
| 18 | Catechin | 5.07 bc | 4.98 bc | 4.47 b | 8.87 d | 4.63 b | 5.99 c | – | 5.62 c | 5.07 bc | 4.57 b | 4.90 bc | 5.58 c | 5.20 bc | 5.21 bc | 3.11 a | ||
| 19 | Luteolin | 0.26 b | 0.35 d | 0.40 e | 0.44 e | – | 0.31 c | 0.20 a | 0.34 d | – | 0.30 c | – | 0.43 e | 0.40 e | – | 0.32 c | ||
| 20 | Apigenin | 0.08 a | 0.10 b | 0.11 b | 0.17 d | 0.11 b | 0.17 d | 0.07 a | 0.18 d | 0.16 cd | 0.12 b | 0.07 a | 0.11 b | 0.15 c | 0.15 c | 0.17 d | ||
| 21 | Naringenin | 0.07 b | 0.13 d | 0.12 d | 0.18 ef | 0.10 c | 0.18 ef | 0.16 de | 0.21 f | 0.13 d | 0.12 d | 0.04 a | 0.13 d | 0.13 d | 0.15 de | 0.10 c | ||
| 22 | Kaempferol | 0.97 b | 0.95 b | 1.53 g | 1.59 g | 1.16 bc | 27.01 h | 0.68 a | 1.09 bc | 1.24 d | 0.97 b | 1.18 c | 1.32 e | 1.18 c | 1.31 e | 1.38 f | ||
| Total | 6.45 | 6.51 | 6.63 | 11.25 | 6.00 | 33.66 | 1.11 | 7.44 | 6.60 | 6.08 | 6.19 | 7.57 | 7.06 | 6.82 | 4.76 | |||
| Other Phenolics | ||||||||||||||||||
| 23 | Aesculin | 9.53 c | 7.61 b | 9.74 c | 12.61 d | 9.93 c | 13.45 d | 3.43 a | 11.31 d | 29.25 f | 9.31 c | 10.52 c | 10.17 c | 12.50 d | 17.14 e | 9.38 c | ||
| 24 | Phlorizin | 0.51 b | 0.78 c | 0.75 c | 1.63 f | 1.00 de | 0.99 de | 0.25 a | 0.94 d | 0.89 d | 0.51 b | 0.59 b | 1.04 e | 0.93 d | 1.08 e | 0.79 c | ||
| 25 | Coniferyl aldehyde | 0.42 d | 0.16 b | 0.39 cd | 0.56 e | 0.31 c | 0.75 f | 0.08 a | 0.39 cd | 1.19 g | 0.27 bc | 0.51 e | 0.23 b | 1.13 g | 0.26 bc | 0.53 e | ||
| 26 | Aesculetin | 0.32 d | 0.14 b | 0.30 d | 0.47 e | 0.25 cd | 0.59 f | 0.07 a | 0.32 d | 0.98 g | 0.24 cd | 0.44 e | 0.16 b | 0.94 g | 0.20 bc | 0.43 e | ||
| Total | 10.78 | 8.69 | 11.18 | 15.27 | 11.49 | 15.78 | 3.80 | 12.96 | 32.31 | 10.33 | 12.06 | 11.60 | 15.50 | 18.68 | 11.13 | |||
| Total of all | 276.09 | 189.84 | 238.55 | 375.62 | 235.87 | 445.57 | 89.98 | 260.96 | 376.62 | 227.73 | 257.34 | 291.83 | 345.78 | 375.53 | 232.07 | |||
© 2019 by the authors. Licensee MDPI, Basel, Switzerland. This article is an open access article distributed under the terms and conditions of the Creative Commons Attribution (CC BY) license (http://creativecommons.org/licenses/by/4.0/).
Share and Cite
Fotirić Akšić, M.; Gašić, U.; Dragana, D.Z.; Sredojević, M.; Tosti, T.; Natić, M.; Meland, M. Chemical Fingerprint of ‘Oblačinska’ Sour Cherry (Prunus cerasus L.) Pollen. Biomolecules 2019, 9, 391. https://doi.org/10.3390/biom9090391
Fotirić Akšić M, Gašić U, Dragana DZ, Sredojević M, Tosti T, Natić M, Meland M. Chemical Fingerprint of ‘Oblačinska’ Sour Cherry (Prunus cerasus L.) Pollen. Biomolecules. 2019; 9(9):391. https://doi.org/10.3390/biom9090391
Chicago/Turabian StyleFotirić Akšić, Milica, Uroš Gašić, Dabić Zagorac Dragana, Milica Sredojević, Tomislav Tosti, Maja Natić, and Mekjell Meland. 2019. "Chemical Fingerprint of ‘Oblačinska’ Sour Cherry (Prunus cerasus L.) Pollen" Biomolecules 9, no. 9: 391. https://doi.org/10.3390/biom9090391
APA StyleFotirić Akšić, M., Gašić, U., Dragana, D. Z., Sredojević, M., Tosti, T., Natić, M., & Meland, M. (2019). Chemical Fingerprint of ‘Oblačinska’ Sour Cherry (Prunus cerasus L.) Pollen. Biomolecules, 9(9), 391. https://doi.org/10.3390/biom9090391