Article

N-glycomic Profile in Combat Related Post-Traumatic Stress Disorder

1
Laboratory for Molecular Neuropsychiatry, Division of Molecular Medicine, Rudjer Boskovic Institute, 10000 Zagreb, Croatia
2
Department for Biological Psychiatry and Psychogeriatrics, University Hospital Vrapce, 10000 Zagreb, Croatia
3
School of Medicine, Josip Juraj Strossmayer University of Osijek, 31000 Osijek, Croatia
4
Psychiatry and Behavioral Neurosciences, Wayne State University Detroit, MI 48202, USA
5
Genos Ltd., Glycobiology Laboratory, 10000 Zagreb, Croatia
*
Author to whom correspondence should be addressed.
Biomolecules 2019, 9(12), 834; https://doi.org/10.3390/biom9120834
Submission received: 22 October 2019 / Revised: 2 December 2019 / Accepted: 3 December 2019 / Published: 6 December 2019
(This article belongs to the Special Issue 2019 Feature Papers by Biomolecules’ Editorial Board Members)

Abstract

:
Post-traumatic stress disorder (PTSD) develops in a portion of individuals exposed to extreme trauma. Glycosylation is a post-translational modification that affects protein functions and is altered in various pathophysiological states and aging. There are still no validated biomarkers of PTSD. The aim of this study was to evaluate the N-glycomic profile in 543 male Caucasian individuals (299 veterans with PTSD and 244 control subjects). The study included discovery (N = 233) and replication (N = 310) cohort. Hydrophilic interaction HPLC and ultra-performance liquid chromatography were used to separate and detect 39 plasma and 24 IgG N-glycan species, respectively. All results were corrected for the effects of age and multiple testing. Significant results included only significantly altered N-glycans in cases/controls in both cohorts, in the same direction. Results showed that six plasma N-glycans (four increased and two decreased) were altered in PTSD vs. controls in both cohorts, but IgG N-glycans were similar between groups. The severity of PTSD was not associated with different plasma N-glycans. This is the first study detecting alterations in plasma N-glycans in PTSD. These N-glycans are also associated with other neuropsychiatric disorders and inflammation, suggesting possible shared glycosylation mechanisms.

1. Introduction

Post-traumatic stress disorder (PTSD) is a trauma- and stressor-related disorder [1] that develops in a portion of individuals who show distress and functional impairment after experiencing or witnessing a traumatic event. PTSD symptom clusters include re-experiencing, avoidance, negative thoughts, negative mood, and hyperarousal [1]. The prevalence of PTSD differs according to differences in trauma exposure and trauma types worldwide and can be regionally specific. Combat and war-related traumas are associated with 11–20% prevalence in United States combat veterans [2], whereas in Croatian combat exposed veterans, the estimated prevalence of PTSD ranges from 14 to 40% [3]. PTSD is associated with different somatic comorbidities such as metabolic syndrome, increased inflammatory processes, pulmonary, cardiovascular and autoimmune diseases [4,5,6,7], and it is recognized as systemic disease [8]. Due to its complex etiology, the biological underpinning of PTSD is still not clear, validated and clinically useful biomarkers have not been identified, and various potential suggested biomarkers were not replicated [9].
N-glycans are complex carbohydrate chains linked by N-glycosidic bonds to various proteins or lipids. Glycosylation is a post-translational modification that affects diverse protein functions such as cell adhesion, signal transduction, receptor activation, molecular trafficking, and systemic clearance [10]. N-glycans affect different cellular processes and biological functions [11]. Altered glycosylation in plasma, serum, and cerebrospinal fluid (CSF) is found in cancer, autoimmune, infectious and chronic inflammatory diseases [11,12] and aging [12,13,14]. N-glycans attached to IgG, constituting 10–20% of plasma proteins, have been associated with the pathogenesis and progression of different diseases, and biological age [12]. Beside these somatic disorders, changes in plasma, serum and CSF glycosylation patterns were found in different neuropsychiatric diseases, such as schizophrenia [15], major depressive disorder (MDD) [16], attention-deficit hyperactivity disorder (ADHD) [17], dementia [14] and Alzheimer’s disease (AD) [18]. To date, only one study evaluated 9 N-glycan structures and accelerated aging in a small number of trauma exposed subjects [19]. An association between particular protein glycosylation in highly stressed groups, such as in professional soldiers was detected in earlier study [20]. Although the authors did not use highly specific and robust N-glycosylation profiling, they reported a significantly higher concentration of the highly-sialylated glycoprotein stressin whose concentration was positively correlated with stress intensity [20].
PTSD is a severe disorder that significantly impairs normal functioning and quality of life of affected persons and their families [9]. Therefore, better understanding of the biological basis of PTSD is extremely important. The exact biological factors associated with vulnerability or resilience to PTSD are still unknown, but vulnerability is presumably the result of the complex interplay between environmental, biological, and genetic factors. Clinically useful and validated biomarkers of PTSD, that will enable insight into the biological alterations in PTSD, are missing [9]. N-glycans are usually considered as mediators between environmental stimuli and genetic background that are highly responsible for crucial physiological processes and are strongly affected by age [14], sex [21], and ethnicity [22]. Therefore, the aim of this study was to compare the N-glycosylation profile between war veterans with PTSD and age-, sex-, and ethnicity- matched healthy control subjects. The goal of the study was to identify validated and clinically useful biomarkers of PTSD. The hypothesis of this study was that alterations in plasma/IgG N-glycome will be associated with PTSD and/or severity of PTSD symptoms. We also predicted, based on the preliminary results of the accelerated aging in PTSD [19] that veterans with PTSD will have higher values on the GlycoAge Test than control subjects, indicating faster aging in PTSD.

2. Methods

2.1. Participants

The study design included two cohorts: discovery and replication, which together comprise 543 age-matched unrelated male Caucasian individuals of Croatian origin: 299 with combat-related PTSD and 244 age-matched control subjects, not exposed to combat trauma. Discovery cohort was enrolled in the period between autumn of 2015 and spring of 2016, whereas the samples for the replication cohort were collected in the period between autumn of 2016 and the spring of 2017. Individuals had current and chronic PTSD, diagnosed using the Structured Clinical Interview (SCID) based on DSM-5 criteria [1]. At the time of sampling, individuals with PTSD did not receive psychiatric medication for at least 30 days. Control (N = 73) and subjects with PTSD (N = 160) in the discovery cohort (N = 233) were sampled from October 2015 to January 2016, whereas control (N = 171) and subjects with PTSD (N = 139) in the replication cohort (N = 310) were sampled from October 2016 to February 2017. Individuals with PTSD were 39–77 years old, with exposure to warzone trauma during the Homeland war in Croatia (1991–1995). The median age (25th; 75th percentile) of PTSD patients was 55 (50; 59) and 56 (52; 53) in the discovery and replication cohort, respectively, whereas the median age (25th; 75th percentile) of control subjects was 53 (48; 58) and 57 (49; 63) in the discovery and replication cohort, respectively. The Clinician Administered PTSD Scale (CAPS) [23] was used to assess severity of PTSD. According to the CAPS severity, individuals with PTSD were subdivided into those with moderate (range: 66–95 CAPS scores) and severe (range: 96–136 CAPS scores) PTSD symptoms. There were no individuals with mild PTSD symptoms (range: 46–65 CAPS scores). Median number of CAPS scores (25th; 75th percentile) was 86 (78; 88) in the discovery cohort and 85 (78; 86) in the replication cohort. The median BMI (25th; 75th percentile) of healthy control subjects was 27.4 (25.7; 30.0) and 29.0 (27.2; 31.2) in the discovery and replication cohort, respectively; whereas median BMI (25th; 75th percentile) of individuals with PTSD was 27.7 (25.8; 30.3) and 28.1 (25.7; 30.5) in the discovery and replication cohort, respectively.
Exclusion criteria were chronic drug abuse, alcohol dependence or pathophysiological changes in the liver, MDD, schizophrenia, bipolar disorder, adult ADHD, AD, current or recent (previous 3 months) use of lipid lowering agents, antihypertensive, and antidiabetic medication. All participants were additionally evaluated according to the International Classification of Diseases (ICD-10) to exclude potential somatic disease such as fibrosis, sclerosis, cirrhosis and malignant liver disease (alcoholic liver cirrhosis (K70.3), alcoholic liver fibrosis and sclerosis (K70.2), and hepatocellular carcinoma (C22.0)) that might affect N-glycan levels.
Healthy control subjects were evaluated with the same diagnostic instruments and followed the same inclusion/exclusion criteria. The aims and procedures of the study were explained in detail to all participants. Written informed consent was obtained from all subjects/patients. The authors assert that all procedures contributing to this work comply with the ethical standards of the relevant national and institutional committees on human experimentation and with the Helsinki Declaration of 1975, as revised in 2008. All procedures involving human subjects/patients were approved by the Ethics Committee of the University Psychiatric Hospital Vrapce, Zagreb, Croatia.

2.2. Blood Sampling

Blood samples were collected between 7:30 and 8:00 a.m., after overnight fasting, using BD Vacutainer™ glass blood collection tubes (Becton, Dickinson and Company, Franklin Lakes, NJ, USA) with acid citrate dextrose (ACD). Immediately after blood sampling, platelet poor plasma was separated by series of centrifugation and stored at −80 °C. Plasma samples, in both cohorts, were randomized and blinded prior to N-glycan determination to avoid bias.

3. N-glycan Determination in Plasma

3.1. Glycan Release and Labelling in Plasma

Plasma N-glycans were determined as described previously [24]. Plasma samples (10 μL) were mixed with 20 μL of 2% (w/v) SDS (Invitrogen, Camarillo, CA, USA) for 10 min at 65 °C in order to achieve protein denaturation in the samples, followed by addition of 4% (v/v) Igepal CA630 (SigmaAldrich, St. Louis, MO, USA) to the mixture. N-glycans were released by digestion with 1.2 U PNGase F (Promega, San Luis Obispo, CA, USA) overnight, at 37 °C. Following extraction, glycans were fluorescently labeled with 2-aminobenzamide (2-AB) after 2 h incubation at 65 °C. To prepare the labeling solution, 2-AB (19.2 mg/mL; SigmaAldrich, St. Louis, MO, USA) and 2-picoline borane (44.8 mg/mL; SigmaAldrich) were dissolved in a mixture of dimethylsulfoxide (SigmaAldrich, St. Louis, MO, USA) and glacial acetic acid (Merck, Darmstadtd, Germany) (70:30 v/v).

3.2. Hydrophilic Interaction High Performance Liquid Chromatography (HILIC)

Released glycans were subjected to HILIC, Acquity UPLC instrument (Waters, Milford, MA, USA), on a Waters BEH Glycan chromatography column, 150 × 2.1 mm i.d., 1.7 μm BEH particles at 25 °C with 100 mM ammonium formate adjusted to pH 4.4 (solvent A) and acetonitrile (solvent B). Samples were kept at 10 °C before the injection. The separation was achieved with a linear gradient of solvent A (30–47%) at 0.56 mL/min flow rate, during 23 min long analysis. Runs were performed with fluorescence detector set with excitation and emission wavelengths of 250 and 428 nm, respectively. The system was calibrated using an external standard of hydrolyzed and 2-AB-labeled glucose oligomers from which the retention times for the individual glycans were converted to glucose units. The obtained chromatograms were all separated into 39 chromatographic areas (peaks) and automatic processing method, with a traditional integration algorithm, was used to process the data. The amounts of glycan present in each area were expressed as the percent of total integrated chromatogram and the peaks were assigned as described by Saldova and colleagues [25].

4. N-glycan Determination in IgG

4.1. Glycan Release and Labelling in IgG

Plasma samples (50 μL) were diluted 10x with the binding buffer and applied to the Protein G plate. The filtration of the samples was completed in approximately 5 min. The plate was washed five times with 5 column volumes (CV) of binding buffer to remove unbound proteins. IgG was released from the protein G monoliths using 5 CV of elution solvent (0.1 M formic acid, pH 2.5). Eluates were collected in a 96 deep-well plate and neutralized to pH 7.0 with 1 M ammonium bicarbonate to maintain the IgG stability. After each sample application, the monoliths were regenerated with the following buffers: 10 CV of 10× PBS, followed by 10 CV of 0.1 M formic acid and 10 CV of 1× PBS to re-equilibrate the monoliths. Each step of the chromatographic procedure was done under vacuum (cca. 60 mmHg pressure reduction while applying the samples, 500 mmHg during elution and washing steps). The purity of the isolated IgG was verified by SDS-PAGE with NuPAGE Novex 4–12% Bis-Tris gels in an Xcell SureLock Mini-Cell (Invitrogen) according to the manufacturer. Precision Plus Protein All Blue Standards (BioRad, Hercules, CA, USA) were used as the molecular weight markers. The gels were run at 180 V for 45 min, stained with GelCode Blue (Thermo Fisher scientific, Waltham, MA, USA) and visualized by a VersaDoc Imaging System (BioRad, Hercules, CA, USA).

4.2. Ultraperformance Liquid Chromatography (UPLC) Analysis of IgG Glycans

Fluorescently labelled N-glycans were separated by UPLC on a Waters Acquity UPLC instrument consisting of a quaternary solvent manager, sample manager and a FLR fluorescence detector set with excitation and emission wavelengths of 330 and 420 nm, respectively. The instrument was under the control of Empower 2 software, build 2145 (Waters, Milford, MA, USA). Labeled N-glycans were separated on a Waters BEH Glycan chromatography column, 100 × 2.1 mm i.d., 1.7 μm BEH particles, with 100 mM ammonium formate (pH 4.4) and acetonitrile. The separation method was developed, which uses a linear gradient of 75–62% acetonitrile at a flow rate of 0.4 mL/min in a 20 min analytical run. Samples were maintained at 5 °C prior to injection, and the separation temperature was 60 °C. The system used hydrolyzed and 2-AB labeled glucose oligomers as external standard, from which the retention times for the individual glycans were converted to glucose units. Data processing was performed using an automatic method with a traditional integration algorithm after which each chromatogram was manually corrected to maintain the same intervals of integration for all the samples. The obtained chromatograms were separated into 24 peaks representing percentage of total integrated area as described previously [14].

5. Statistical Analysis

To remove experimental variation from measurements, normalization and batch correction were performed on UPLC glycan data. Normalization of raw measurements within each sample is required because intensities of UPLC signals can vary more than 100-fold due to experimental noise. Also, laboratory conditions can vary during the experiment, so correction of batch effects is necessary [26]. To make measurements across samples comparable, normalization by total area is performed where peak area of each glycan structure was divided by total area of corresponding chromatogram. Prior to batch correction, normalized glycan measurements were log transformed due to right-skewness of their distributions and multiplicative nature of batch effects. Batch correction was performed on log-transformed measurements using ComBat method [27], R package sva [28], where technical source of variation (which sample was analyzed on which plate) was modeled as batch covariate. To get measurements corrected for experimental noise, estimated batch effects were subtracted from log-transformed measurements.
The results are expressed as medians and 25th (Q1) and 75th (Q3) percentiles and were evaluated with R Statistics 3.5.1. Normality of the distribution was assessed with the Kolmogorov–Smirnov test. As most of the glycan peaks were not normally distributed, non-parametric analyses were used. The 39 plasma and 24 IgG N-glycans are shown as percentages of the total area under the curve. Besides individual N-glycans in plasma and IgG, GlycoAge index was calculated for each individual. GlycoAge index was determined as a logarithmic ratio of two N-glycan structures that showed the highest changes in concentration depending on age: agalactosylated core-a-1,6-fucosylated biantennary N-glycan (FA2), which concentration increases gradually with age and bigalactosylated core-a-1,6-fucosylated biantennary N-glycan (FA2G2), which concentration decreases with aging (log10(FA2/FA2G2)) [14]. Plasma and IgG samples from the PTSD and control group are shown separately for the discovery and the replication study. Multiple linear regression was used to determine the effect of age, BMI and smoking on levels of plasma and IgG N-glycan species. As the age is a main predictor of N-glycosylation changes in human plasma [29] and IgG [30], correction for the effect of age was performed by fitting the linear model of each glycan peak in dependence of age and using the obtained residuals for further statistical analysis [19]. Differences in the distribution of N-glycans and GlycoAge index values between veterans with PTSD and control subjects, and between PTSD severity subgroups were evaluated using Mann-Whitney tests with corrected N-glycan values. Correlations between N-glycans and severity of PTSD were analyzed with Spearman’s rank tests. False discovery rate (Benjamini Hochberg) method was used to correct p values due to the multiple testing. The corrected values at p < 0.05 were considered significant.

6. Results

Multiple linear regression analyses revealed that in our sample smoking and BMI were not significantly associated with majority of N-glycans in plasma (p > 0.05) or IgG (p > 0.05). However, as expected, there was a strong association of N-glycans with age, and therefore all glycan values were corrected for age (Supplementary Tables S3 and S4). The analysis of the entire glycome included 39 N-glycans in plasma (Table 1, Supplementary Figure S1) and 24 IgG N-glycans (Table 2, Supplementary Figure S2).

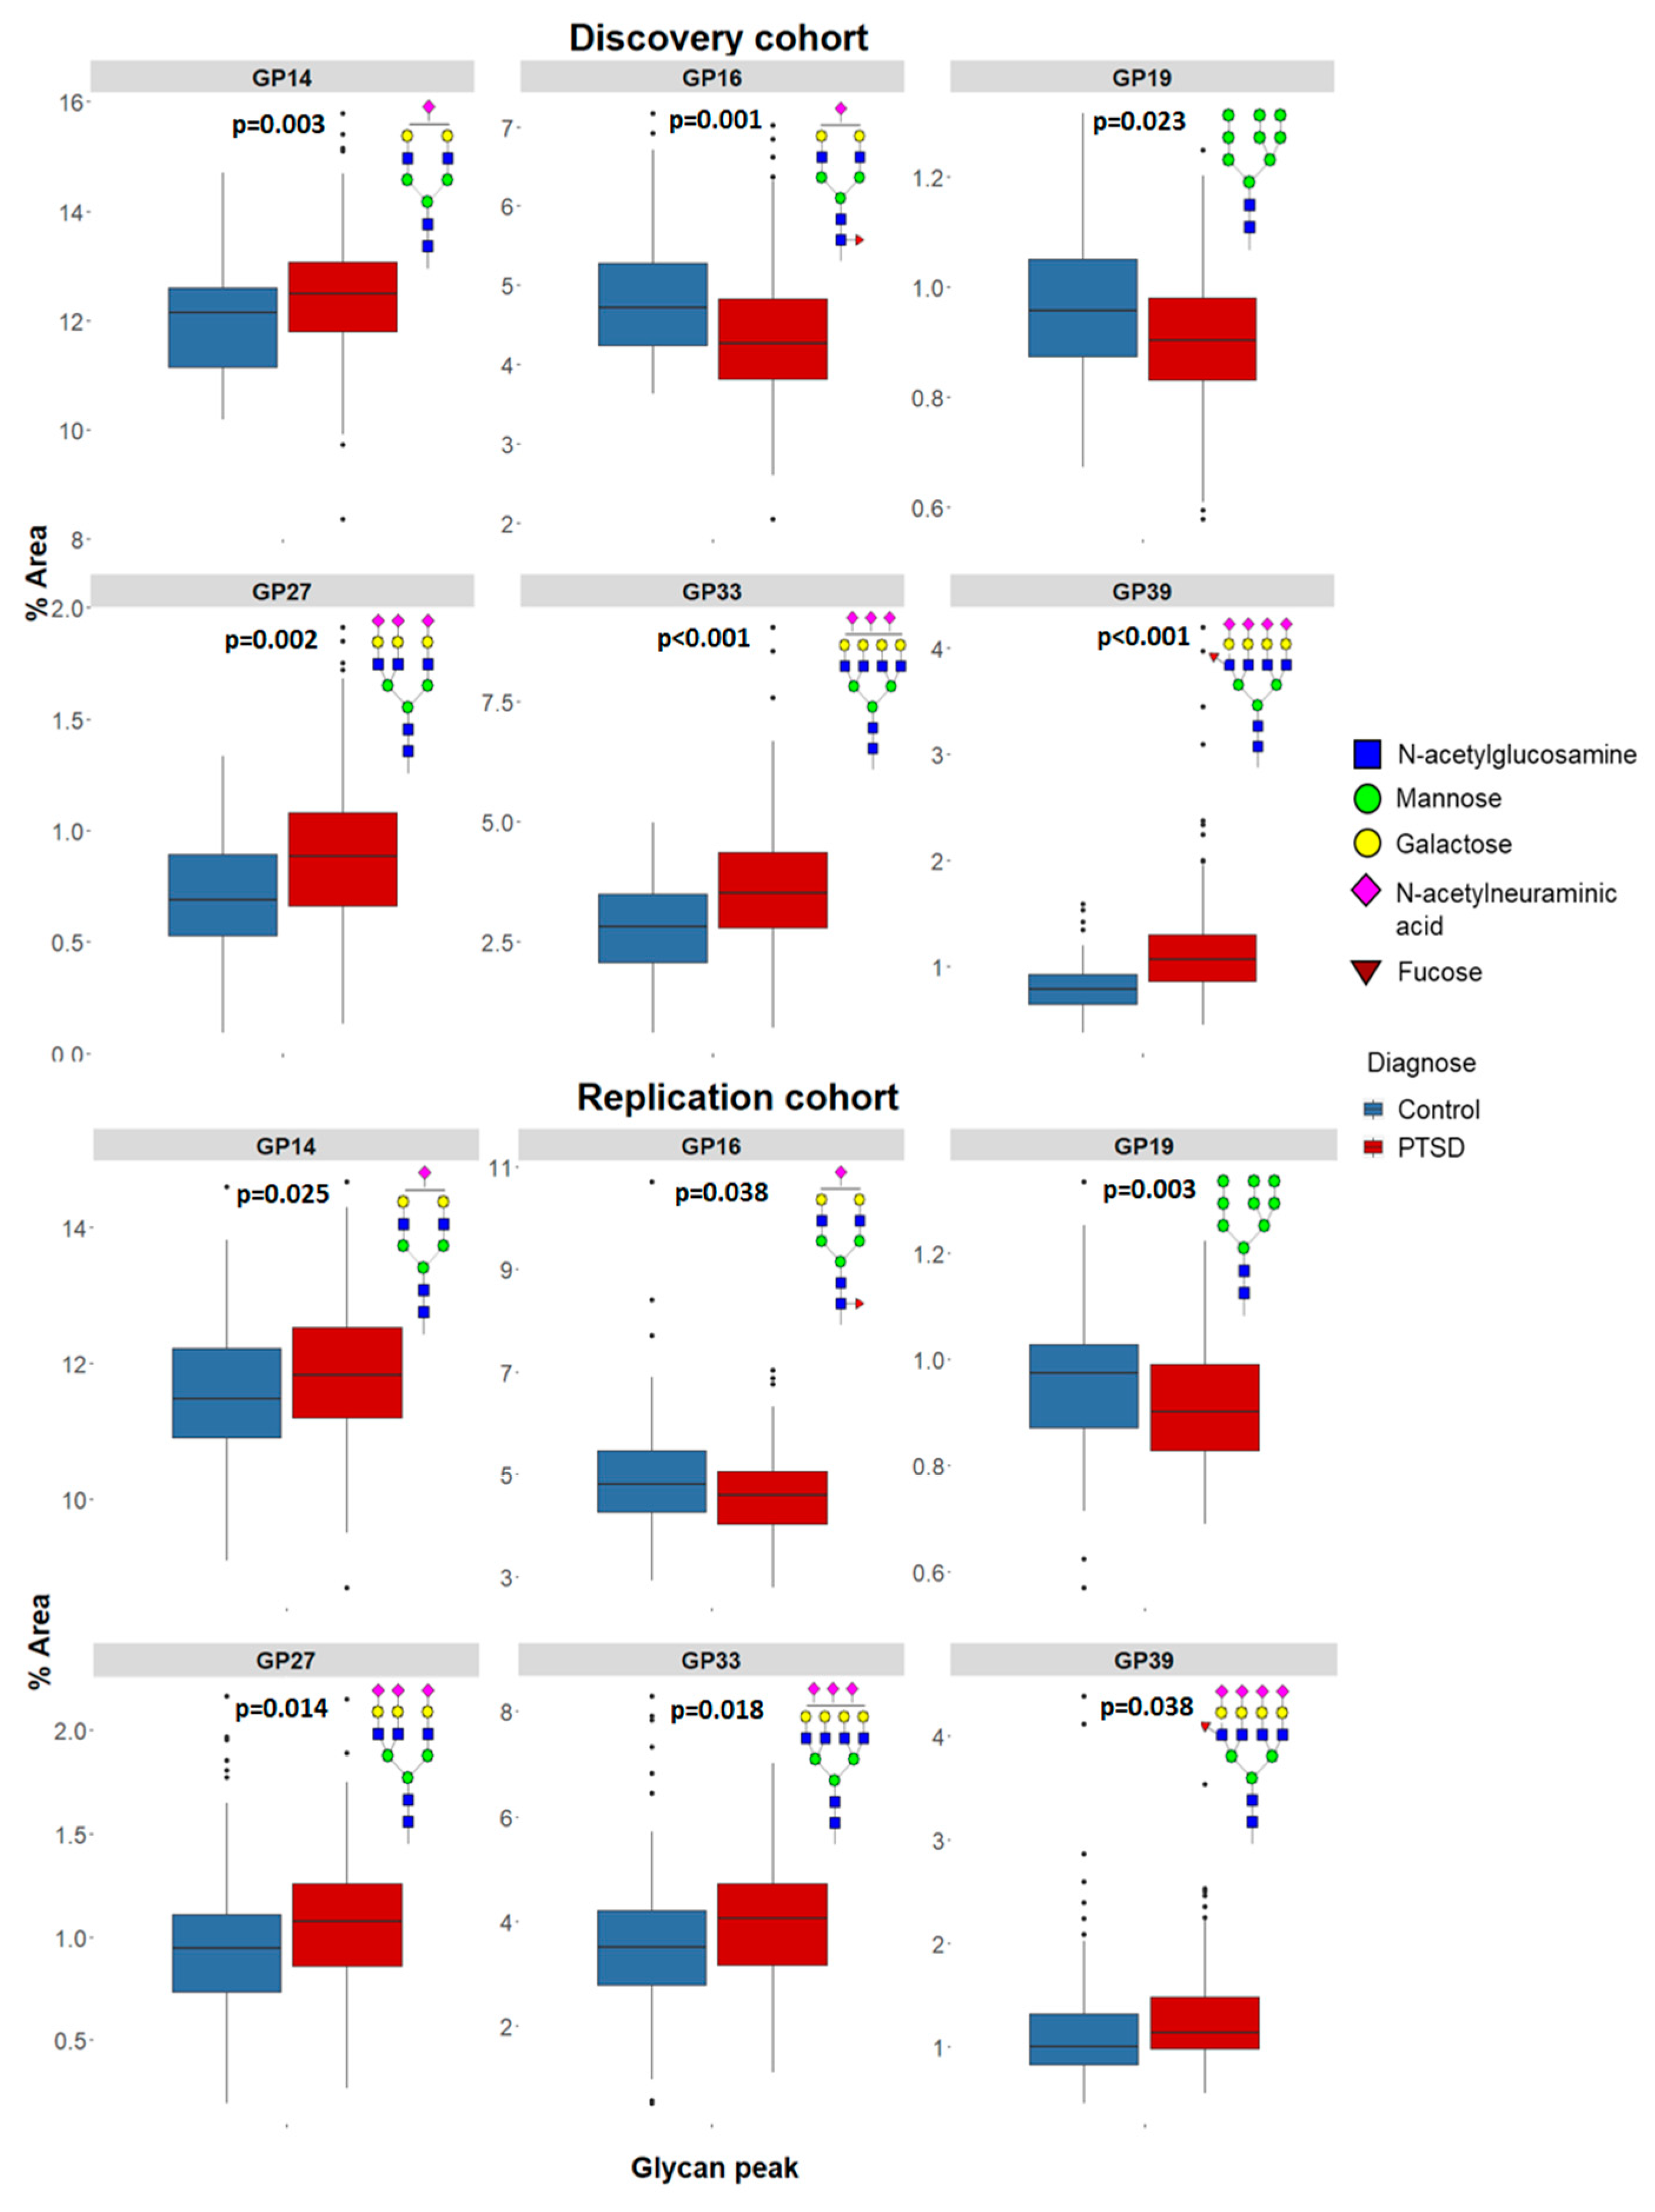
6.1. N-glycans in Plasma

Major glycan peak structures are described in Supplementary Tables S1 and S2. To confirm changes in N-glycan levels in cases/controls, only significantly different N-glycan levels identified in both the discovery and replication cohorts, and altered in the same direction, were designated as significant. In the discovery cohort, comprised of 160 PTSD and 73 age-matched control subjects, 19 out of 39 plasma N-glycans were significantly different between subjects with PTSD and control subjects. In the replication cohort, comprised of 139 PTSD and 171 age-matched control subjects, only six plasma N-glycans out of 19 from the discovery study were confirmed to differ significantly between cases/controls (Table 1). Among these six plasma N-glycans, four (GP14 = A2G2S1, GP27 = A3G3S3, GP33 = A4G4S3, GP39 = A4F1G4S4) were significantly higher, whereas two (GP16 = FA2G2S1, GP19 = M9) were significantly lower in PTSD subjects compared to controls in both cohorts (Figure 1). These results suggested that these six plasma N-glycans might be used as biomarkers of PTSD.

6.2. N-glycans Attached to IgG

Only 2 N-glycans bound to IgG (GP6 = FA2B, GP23 = FA2G2S2) differed significantly between individuals with PTSD and healthy subjects in the discovery cohort, but these findings were not confirmed in the replication study (Table 2). These results revealed that N-glycans bound to IgG are not associated with PTSD.

6.3. GlycoAge Test

To evaluate whether N-glycans can be used as indicators of the accelerated aging in subjects with PTSD [19], a GlycoAge test was calculated for cases/controls in the discovery/replication study (Table 1; Table 2). There were no significant differences between individuals with PTSD and control subjects in the GlycoAge values in the discovery study for plasma (p = 0.208) and IgG N-glycans (p = 0.067). These findings were confirmed in the replication study as both plasma (p = 0.489) and IgG (p = 0.778) GlycoAge values did not differ significantly between participants with PTSD or control participants.

6.4. N-glycans and PTSD Severity

As plasma N-glycans differed significantly between cases and controls, we assessed the possible association between plasma N-glycans and PTSD severity using the Spearman’s correlation (Table 3).
In our sample, most of the patients with PTSD had moderate symptoms (92% in both cohorts), whereas the remainder were diagnosed with severe PTSD. No significant correlations were detected between any of the plasma N-glycans and severity of PTSD in discovery or replication cohort (Table 3). Additionally, differences in plasma N-glycans between patients with moderate and severe PTSD, evaluated with Mann–Whitney U test, were not significant. These results confirmed the lack of association between plasma glycosylation and severity of PTSD symptoms (Table 3).
Furthermore, individuals with moderate and severe PTSD had similar GlycoAge values in the discovery (p = 0.984) and replication cohort (p = 0.969) (Table 3). These results revealed that PTSD severity was not associated with GlycoAge index in individuals with PTSD.

7. Discussion

7.1. N-glycans in Plasma

This is the first study to show significant associations of the plasma, but not IgG, N-glycans with combat-related PTSD. These results, confirmed in both discovery and replication study, have shown in a fairly large sample size, that four plasma N-glycans (A2G2S1, A3G3S3, A4G4S4, A4F1G4S4) were increased, whereas two plasma glycan species (FA2G2S1, M9) were decreased in individuals with PTSD compared to control subjects. Furthermore, individuals with PTSD did not show signs of accelerated physiological aging compared to healthy control subjects, determined with GlycoAge Test index [14,19]. Additionally, severity of PTSD was not associated with plasma N-glycans.
Although several studies have analyzed N-glycosylation profiles in psychiatric and neurodegenerative diseases [31]; Moreno-Villanueva’s study [19] was the only one that analyzed these changes in PTSD subjects. Their study [19] focused on nine N-glycan structures in plasma of 32 individuals: 13 medicated subjects with PTSD, comorbid with MDD, nine trauma-exposed individuals and 10 low-stress control subjects of different ethnicities. In contrast to our results, they found no significant differences in plasma N-glycans between these groups [19]. However, our study analyzed N-glycosylation profile (39 N-glycan species in plasma and 24 attached to IgG) on a much larger and homogenous sample (N = 543) of medication-free males (PTSD/controls), without MDD or other comorbidities.
As N-glycosylation is associated with accelerated aging, a GlycoAge Test has been proposed to predict physiological aging in healthy populations [14]. Higher GlycoAge values have been reported in individuals with AD [14] and PTSD [19], when compared to healthy controls matched for age. Although there was a significant association of GlycoAge values with chronological age in both PTSD and control subjects in our study, there were no significant differences in its values between PTSD/controls, after correcting for age and multiple testing in the large sample of male Caucasian veterans with PTSD. Further modeling of GlycoAge test formula with other identified N-glycan species, obtained in our study, due to more precise separation, and possibly inclusion of additional biochemical and metabolic parameters [32], could yield more accurate results.
Plasma N-glycan profile in PTSD patients from both cohorts was characterized by a greater abundance of highly branched (tri-antennary and tetra-antennary) structures, that were more galactosylated and sialylated (A3G3S3, A4G4S4, and A4F1G4S4). This pattern is identified in acute and chronic inflammation states [33], and in patients 24–48 h after abdominal surgery [34]. Increased highly sialyated and glycosylated N-glycan species (A3F1G3S3 and A4G4LacS4 in low abundant proteins, and A3F1G3S3, A4G4S2, A4G4S3, FA3G3S3, and FA3BG3S3 in highly abundant proteins) were detected in sera of male schizophrenic subjects [15]. Patients with PTSD often exhibit psychotic symptoms [35] that are hallmarks of schizophrenia. Therefore, a similar N-glycosylation profile in these two disorders is not unexpected. A3F1G3S3 N-glycan containing a sLex epitope, that is associated with increased immunological reaction to antigens [36] and metastasis [37], was significantly increased in both low and high abundant proteins [15]. In our study, A4F1G4S4 N-glycan, that also contains sLex epitope, was significantly increased in both cohorts, similarly to results in the recently operated patients [34]. Increased glycan branching in total plasma proteins, detected in our veterans with PTSD has previously been found to positively correlate with severity of MDD [16], a common comorbidity in patients with PTSD. Although our veterans did not have clinical MDD, they share some common depressive/numbing symptoms and similar N-glycan changes. In contrast to the results of present study, increased peripheral fucosylation of biantennary glycans and decreased branching, including tri- and tetraantennary glycans, was detected in ADHD in our previous study [17]. These differences might be explained with different diagnoses (ADHD vs. PTSD), differences in gender and age (average 9-year-old male and female children with ADHD vs. 54-year-old male veterans with PTSD and control male participants).
In our study, high-mannose (M9) and core-fucosylated (FA2G2S1) plasma glycan species were significantly decreased in the PTSD group, compared to the low-stress healthy control, and this result corresponds to lower glycan species found in inflammation [34]. As alternations of high-mannose glycans have been associated with occurrence and progression of different types of cancers [38,39,40], neuropsychiatric disorders [41], inflammation [34] and brain aging [42], whereas PTSD is associated with inflammation [17] and cardiometabolic disorders [4,5], the lower FA2G2S1 glycan result suggests that veterans with PTSD should be closely monitored for these disorders.
Traumatic load was reported to be positively correlated with the GlycoAge Test in subjects with substantial trauma exposure [19]. In our study, severity of PTSD was not significantly associated with plasma N-glycans. This could be explained by the fact that our study included PTSD patients with similar trauma experience and duration, and the fact that 92% of our patients had moderate symptoms of PTSD in both cohorts.

7.2. N-glycans Attached to IgG

We found two IgG glycoforms to be significantly different between PTSD and control subjects in the first cohort. Core fucosylated bisecting agalactosylated N-glycan FA2B was significantly increased in patients with PTSD, while more sialyated and galactosylated form, FA2G2S2, was significantly lower. Core fucosylated N-glycans on IgG are generally considered anti-inflammatory as core fucosylation of IgG can drastically increase antibody-dependent cytotoxicity [43], while decreased galactosylation containing bisecting GlcNAC on IgG is usually hallmark of inflammation and older age [32]. However, the replication cohort did not confirm these changes in FA2B and FA2G2S2 after correcting for multiple testing. Previous research in IgG N-glycome of patients with MDD (male and female combined) has found only two significant glycoforms, both containing bisecting GlcNAC, but similar to our results, there were no significant correlations when males were analyzed separately [16].

8. Conclusions

We selected two large and balanced cohorts in order to identify potential alterations in N-glycosylation pattern characteristic for PTSD. Strength of the study is in a relatively homogeneous sample of age- and sex-matched PTSD patients and controls, with strict exclusion criteria. To ensure that our findings are due to a true biological variation, and to eliminate any possible experimental artefacts and false positive findings due to chance, we replicated our results using a second cohort. Besides, the study analyzed both plasma and IgG N-glycosylation with high-resolution separation techniques and reported only the results that were significant in both discovery and replication cohort, after adjustment for age and multiple testing. To avoid possible bias, plasma samples in both cohorts were randomized and blinded prior to N-glycan determination. However, we still detected differences between discovery and replication cohort that we cannot yet explain, possibly due to other biological parameters or unknown confounders that we did not take into account during sampling and/or statistical analysis.
Limitation of this study is in a relatively narrow subpopulation of patients of the same ethnicity, gender and type of trauma. To validate obtained results, inclusion of women, different ethnicities, individuals exposed to different types of trauma, as well as trauma-exposed controls without PTSD is necessary.
In conclusion, this is the first study detecting alterations in the selected plasma N-glycans in PTSD. Our results suggest that PTSD share similar biological underpinning as other neuropsychiatric disorders and inflammation and could point out to some common glycosylation mechanisms underlying neuropsychiatric disorders and inflammation.

Supplementary Materials

The following are available online at https://www.mdpi.com/2218-273X/9/12/834/s1, Figure S1: Representative chromatogram of plasma N-glycans, Figure S2: Representative chromatogram of IgG N-glycans, Table S1: Plasma N-glycan peaks separated by HILIC-UPLC and their composition as described by Gudelj et al. (2016), Table S2: IgG N-glycan peaks separated by HILIC-UPLC and their composition as described by Nikolac Perkovic et al. (2016), Table S3: Effects of age, smoking and BMI on plasma N-glycan species in the discovery and replication cohort, Table S4. Effects of age, smoking and BMI on plasma N-glycan species in the discovery and replication cohort.

Author Contributions

N.P. developed the original idea. L.T., G.N.E., M.N.P., M.K., and D.S.S. managed the experimental work, collected blood samples, isolated plasma and processed data for analysis. L.T. performed all the statistical analysis. S.U. and O.K. explained the research goals and described protocol in details to the patients; explained the inclusion/exclusion criteria, insured participant adherence for the participation in the study, motivated, selected, diagnosed, evaluated and sampled patients with PTSD and control subjects. G.L. did the determination of N-glycans in GENOS. L.T. and N.P. did the data analysis and interpretation. N.P. and L.T. wrote the first draft of the article. T.J., L.T., G.N.E., M.N.P., D.S.S., and N.P. wrote the final draft, and did the proof reading of the manuscript. All authors contributed to the final version of the manuscript.

Funding

This study was funded by the Croatian Science Foundation, project No. IP-2014-09-4289.

Acknowledgments

We are extremely grateful to all the subjects who took part in this study.

Conflicts of Interest

The authors declare no conflicts of interest. The funding sources had no involvement in study design, in the collection, analysis, and interpretation of data; in the writing of the report; or in the decision to submit the article for publication.

References

  1. American Psychiatric Association. Diagnostic and Statistical Manual of Mental Disorders: Diagnostic and Statistical Manual of Mental Disorders: Fifth Edition; American Psychiatric Association: Arlington, VA, USA, 2013. [Google Scholar]
  2. Dursa, E.K.; Reinhard, M.J.; Barth, S.K.; Schneiderman, A.I. Prevalence of a positive screen for PTSD among OEF/OIF and OEF/OIF-era veterans in a large population-based cohort. J. Trauma Stress 2014, 27, 542–549. [Google Scholar] [CrossRef] [PubMed]
  3. Komar, Z.; Vukusic, H. Post-traumatic stress disorder in Croatia war veterans: Prevalence and psycho-social characteristics. In New Insight in Post-Traumatic Stress Disorder (PTSD); Dekaris, D., Sabioncello, A., Eds.; Croatian Academy of Sciences and Arts: Zagreb, Croatia, 1999; pp. 42–44. [Google Scholar]
  4. Britvic, D.; Anticevic, V.; Kaliterna, M.; Lusic, L.; Beg, A.; Brajevic-Gizdic, I.; Kudric, M.; Stupalo, Z.; Krolo, V.; Pivac, N. Comorbidities with Posttraumatic Stress Disorder (PTSD) among combat veterans: 15 years postwar analysis. Int. J. Clin. Health Psychol. 2015, 15, 81–92. [Google Scholar] [CrossRef] [PubMed] [Green Version]
  5. Mellon, S.H.; Gautam, A.; Hammamieh, R.; Jett, M.; Wolkowitz, O.M. Metabolism, Metabolomics, and Inflammation in Posttraumatic Stress Disorder. Biol. Psychiatry 2018, 83, 866–875. [Google Scholar] [CrossRef] [PubMed] [Green Version]
  6. O’Donovan, A.; Cohen, B.E.; Seal, K.H.; Bertenthal, D.; Margaretten, M.; Nishimi, K.; Neylan, T.C. Elevated risk for autoimmune disorders in iraq and afghanistan veterans with posttraumatic stress disorder. Biol. Psychiatry 2015, 77, 365–374. [Google Scholar] [CrossRef] [Green Version]
  7. Speer, K.; Upton, D.; Semple, S.; McKune, A. Systemic low-grade inflammation in post-traumatic stress disorder: A systematic review. J. Inflamm. Res. 2018, 11, 111–121. [Google Scholar] [CrossRef] [Green Version]
  8. McFarlane, A.C. Post-traumatic stress disorder is a systemic illness, not a mental disorder: Is Cartesian dualism dead? Med. J. Aust. 2017, 206, 248–249. [Google Scholar] [CrossRef]
  9. Domingo-Fernandez, D.; Provost, A.; Kodamullil, A.T.; Marin-Llao, J.; Lasseter, H.; Diaz, K.; Daskalakis, N.P.; Lancashire, L.; Hofmann-Apitius, M.; Haas, M. PTSD Biomarker Database: Deep dive metadatabase for PTSD biomarkers, visualizations and analysis tools. Database 2019. [Google Scholar] [CrossRef] [Green Version]
  10. Ohtsubo, K.; Marth, J.D. Glycosylation in cellular mechanisms of health and disease. Cell 2006, 126, 855–867. [Google Scholar] [CrossRef] [Green Version]
  11. Reily, C.; Stewart, T.J.; Renfrow, M.B.; Novak, J. Glycosylation in health and disease. Nat. Rev. Nephrol. 2019, 15, 346–366. [Google Scholar] [CrossRef]
  12. Gudelj, I.; Lauc, G.; Pezer, M. Immunoglobulin G glycosylation in aging and diseases. Cell Immunol. 2018, 333, 65–79. [Google Scholar] [CrossRef]
  13. Pucic, M.; Knezevic, A.; Vidic, J.; Adamczyk, B.; Novokmet, M.; Polasek, O.; Gornik, O.; Supraha-Goreta, S.; Wormald, M.R.; Redzic, I.; et al. High throughput isolation and glycosylation analysis of IgG-variability and heritability of the IgG glycome in three isolated human populations. Mol. Cell Proteom. 2011, 10, M111-010090. [Google Scholar] [CrossRef] [PubMed] [Green Version]
  14. Vanhooren, V.; Dewaele, S.; Libert, C.; Engelborghs, S.; De Deyn, P.P.; Toussaint, O.; Debacq-Chainiaux, F.; Poulain, M.; Glupczynski, Y.; Franceschi, C.; et al. Serum N-glycan profile shift during human ageing. Exp. Gerontol. 2010, 45, 738–743. [Google Scholar] [CrossRef] [PubMed] [Green Version]
  15. Stanta, J.L.; Saldova, R.; Struwe, W.B.; Byrne, J.C.; Leweke, F.M.; Rothermund, M.; Rahmoune, H.; Levin, Y.; Guest, P.C.; Bahn, S.; et al. Identification of N-glycosylation changes in the CSF and serum in patients with schizophrenia. J. Proteome Res. 2010, 9, 4476–4489. [Google Scholar] [CrossRef] [PubMed]
  16. Park, D.I.; Stambuk, J.; Razdorov, G.; Pucic-Bakovic, M.; Martins-de-Souza, D.; Lauc, G.; Turck, C.W. Blood plasma/IgG N-glycome biosignatures associated with major depressive disorder symptom severity and the antidepressant response. Sci. Rep. 2018, 8, 179. [Google Scholar] [CrossRef] [PubMed] [Green Version]
  17. Pivac, N.; Knezevic, A.; Gornik, O.; Pucic, M.; Igl, W.; Peeters, H.; Crepel, A.; Steyaert, J.; Novokmet, M.; Redzic, I.; et al. Human Plasma Glycome in Attention-Deficit Hyperactivity Disorder and Autism Spectrum Disorders. Mol. Cell Proteom. 2011, 10. [Google Scholar] [CrossRef] [PubMed] [Green Version]
  18. Lundstrom, S.L.; Yang, H.; Lyutvinskiy, Y.; Rutishauser, D.; Herukka, S.K.; Soininen, H.; Zubarev, R.A. Blood plasma IgG Fc glycans are significantly altered in Alzheimer’s disease and progressive mild cognitive impairment. J. Alzheimers Dis. 2014, 38, 567–579. [Google Scholar] [CrossRef] [PubMed]
  19. Moreno-Villanueva, M.; Morath, J.; Vanhooren, V.; Elbert, T.; Kolassa, S.; Libert, C.; Burkle, A.; Kolassa, I.T. N-glycosylation profiling of plasma provides evidence for accelerated physiological aging in post-traumatic stress disorder. Transl. Psychiatry 2013, 3, e320. [Google Scholar] [CrossRef] [Green Version]
  20. Lauc, G.; Dabelic; Dumic, J.; Flogel, M. Stressin and natural killer cell activity in professional soldiers. Ann. N. Y. Acad. Sci. 1998, 851, 526–530. [Google Scholar] [CrossRef] [PubMed]
  21. Ding, N.; Nie, H.; Sun, X.; Sun, W.; Qu, Y.; Liu, X.; Yao, Y.; Liang, X.; Chen, C.C.; Li, Y. Human serum N-glycan profiles are age and sex dependent. Age Ageing 2011, 40, 568–575. [Google Scholar] [CrossRef] [Green Version]
  22. Gebrehiwot, A.G.; Melka, D.S.; Kassaye, Y.M.; Rehan, I.F.; Rangappa, S.; Hinou, H.; Kamiyama, T.; Nishimura, S.I. Healthy human serum N-glycan profiling reveals the influence of ethnic variation on the identified cancer-relevant glycan biomarkers. PLoS ONE 2018, 13, e0209515. [Google Scholar] [CrossRef] [Green Version]
  23. Weathers, F.W.; Keane, T.M.; Davidson, J.R. Clinician-administered PTSD scale: A review of the first ten years of research. Depress. Anxiety 2001, 13, 132–156. [Google Scholar] [CrossRef] [PubMed]
  24. Akmacic, I.T.; Ugrina, I.; Stambuk, J.; Gudelj, I.; Vuckovic, F.; Lauc, G.; Pucic-Bakovic, M. High-throughput glycomics: Optimization of sample preparation. Biochem. Mosc. 2015, 80, 934–942. [Google Scholar] [CrossRef] [PubMed]
  25. Saldova, R.; Shehni, A.A.; Haakensen, V.D.; Steinfeld, I.; Hilliard, M.; Kifer, I.; Helland, A.; Yakhini, Z.; Borresen-Dale, A.L.; Rudd, P.M. Association of N-Glycosylation with Breast Carcinoma and Systemic Features Using High-Resolution Quantitative UPLC. J. Proteome Res. 2014, 13, 2314–2327. [Google Scholar] [CrossRef]
  26. Leek, J.T.; Scharpf, R.B.; Bravo, H.C.; Simcha, D.; Langmead, B.; Johnson, W.E.; Geman, D.; Baggerly, K.; Irizarry, R.A. Tackling the widespread and critical impact of batch effects in high-throughput data. Nat. Rev. Genet. 2010, 11, 733–739. [Google Scholar] [CrossRef] [PubMed] [Green Version]
  27. Johnson, W.E.; Li, C.; Rabinovic, A. Adjusting batch effects in microarray expression data using empirical Bayes methods. Biostatistics 2007, 8, 118–127. [Google Scholar] [CrossRef]
  28. Leek, J.T.; Johnson, W.E.; Parker, H.S.; Jaffe, A.E.; Storey, J.D. The sva package for removing batch effects and other unwanted variation in high-throughput experiments. Bioinformatics 2012, 28, 882–883. [Google Scholar] [CrossRef]
  29. Knezevic, A.; Gornik, O.; Polasek, O.; Pucic, M.; Redzic, I.; Novokmet, M.; Rudd, P.M.; Wright, A.F.; Campbell, H.; Rudan, I.; et al. Effects of aging, body mass index, plasma lipid profiles, and smoking on human plasma N-glycans. Glycobiology 2010, 20, 959–969. [Google Scholar] [CrossRef] [Green Version]
  30. Perkovic, M.N.; Bakovic, M.P.; Kristic, J.; Novokmet, M.; Huffman, J.E.; Vitart, V.; Hayward, C.; Rudand, I.; Wilson, J.F.; Campbell, H.; et al. The association between galactosylation of immunoglobulin G and body mass index. Prog. Neuropsychopharmacol. Biol. Psych. 2014, 48, 20–25. [Google Scholar] [CrossRef]
  31. Konjevod, M.; Tudor, L.; Strac, D.S.; Erjavec, G.N.; Barbas, C.; Zarkovic, N.; Perkovic, M.N.; Uzun, S.; Kozumplik, O.; Lauc, G.; et al. Metabolomic and glycomic findings in posttraumatic stress disorder. Prog. Neuropsychopharmacol. Biol. Psych. 2019, 88, 181–193. [Google Scholar] [CrossRef]
  32. Kristic, J.; Vuckovic, F.; Menni, C.; Klaric, L.; Keser, T.; Beceheli, I.; Pucic-Bakovic, M.; Novokmet, M.; Mangino, M.; Thaqi, K.; et al. Glycans are a novel biomarker of chronological and biological ages. J. Gerontol. A Biol. Sci. Med. Sci. 2014, 69, 779–789. [Google Scholar] [CrossRef] [Green Version]
  33. Clerc, F.; Novokmet, M.; Dotz, V.; Reiding, K.R.; de Haan, N.; Kammeijer, G.S.M.; Dalebout, H.; Bladergroen, M.R.; Vukovic, F.; Rapp, E.; et al. Plasma N-Glycan Signatures Are Associated With Features of Inflammatory Bowel Diseases. Gastroenterology 2018, 155, 829–843. [Google Scholar] [CrossRef] [PubMed] [Green Version]
  34. Gudelj, I.; Baciarello, M.; Ugrina, I.; De Gregori, M.; Napolioni, V.; Ingelmo, P.M.; Bugada, D.; De Gregori, S.; Derek, L.; Pucic-Bakovic, M.; et al. Changes in total plasma and serum N-glycome composition and patient-controlled analgesia after major abdominal surgery. Sci Rep. 2016, 6, 31234. [Google Scholar] [CrossRef] [PubMed]
  35. Pivac, N.; Kozaric-Kovacic, D. Pharmacotherapy of treatment-resistant combat-related posttraumatic stress disorder with psychotic features. Croat. Med. J. 2006, 47, 440–451. [Google Scholar] [PubMed]
  36. Brinkman-van der Linden, E.C.; de Haan, P.F.; Havenaar, E.C.; van Dijk, W. Inflammation-induced expression of sialyl LewisX is not restricted to alpha1-acid glycoprotein but also occurs to a lesser extent on alpha1-antichymotrypsin and haptoglobin. Glycoconjugate J. 1998, 15, 177–182. [Google Scholar] [CrossRef] [PubMed]
  37. Gomes, C.; Osorio, H.; Pinto, M.T.; Campos, D.; Oliveira, M.J.; Reis, C.A. Expression of ST3GAL4 leads to SLe(x) expression and induces c-Met activation and an invasive phenotype in gastric carcinoma cells. PLoS ONE 2013, 8, e66737. [Google Scholar] [CrossRef]
  38. Talabnin, K.; Talabnin, C.; Ishihara, M.; Azadi, P. Increased expression of the high-mannose M6N2 and NeuAc3H3N3M3N2F tri-antennary N-glycans in cholangiocarcinoma. Oncol. Lett. 2018, 15, 1030–1036. [Google Scholar] [CrossRef]
  39. Bhat, G.; Hothpet, V.R.; Lin, M.F.; Cheng, P.W. Shifted Golgi targeting of glycosyltransferases and alpha-mannosidase IA from giantin to GM130-GRASP65 results in formation of high mannose N-glycans in aggressive prostate cancer cells. Biochim. Biophys Acta Gen. Subj. 2017, 1861, 2891–2901. [Google Scholar] [CrossRef]
  40. De Leoz, M.L.; Young, L.J.; An, H.J.; Kronewitter, S.R.; Kim, J.; Miyamoto, S.; Borowsky, A.D.; Chew, H.K.; Lebrilla, C.B. High-mannose glycans are elevated during breast cancer progression. Mol. Cell Proteom. 2011, 10, M110-002717. [Google Scholar] [CrossRef] [Green Version]
  41. Tucholski, J.; Simmons, M.S.; Pinner, A.L.; Haroutunian, V.; McCullumsmith, R.E.; Meador-Woodruff, J.H. Abnormal N-linked glycosylation of cortical AMPA receptor subunits in schizophrenia. Schizophr. Res. 2013, 146, 177–183. [Google Scholar] [CrossRef] [Green Version]
  42. Brunngraber, E.G.; Webster, J.C. Changes in glycoprotein carbohydrate content in the aging human brain. Neurochem. Res. 1986, 11, 579–588. [Google Scholar] [CrossRef]
  43. Masuda, K.; Kubota, T.; Kaneko, E.; Iida, S.; Wakitani, M.; Kobayashi-Natsume, Y.; Kubota, A.; Shitara, K.; Nakamura, K. Enhanced binding affinity for FcgammaRIIIa of fucose-negative antibody is sufficient to induce maximal antibody-dependent cellular cytotoxicity. Mol. Immunol. 2007, 44, 3122–3131. [Google Scholar] [CrossRef] [PubMed]
Figure 1. Distribution of significant plasma N-glycans in healthy control subjects and patients with PTSD, in discovery and replication cohort. GP = glycan peak; GP14 = monosialylated glycan (A2G2S1); GP16=monosialylated glycan (FA2G2S1); GP19 = high mannose (M9); GP27 = trisialylated glycan (A3G3S3); GP33 = trisialylated glycan (A4G4S3); GP39 = tetrasialylated glycan (A4F1G4S4); PTSD = post-traumatic stress disorder.
Biomolecules 09 00834 g001
Table 1. Distribution of total plasma N-glycans in healthy controls and patients with PTSD in discovery and replication cohort. Results are presented as age adjusted percentage of total glycan peak area (median, 25th, and 75th percentile).
Plasma
N-glycan
Peak
Discovery Cohort (N = 233)Replication Cohort (N = 330)
Control (N = 73)PTSD (N = 160)StatisticsControl (N = 171)PTSD (N = 139)Statistics
Median25th75thMedian25th75thMW UpMedian25th75thMedian25th75thMW Up
GP14.6153.8855.5144.1613.3925.1034810.00.0625.4574.4546.5595.8954.5686.84311094.00.524
GP21.9941.7402.2671.9701.7262.2615630.00.7772.1681.9112.4492.2371.9012.51011476.00.719
GP30.0840.0710.1010.0890.0680.1095448.00.5150.1030.0830.1250.1060.0870.13211490.00.719
GP43.7593.2324.4113.2342.8673.7113783.0<0.0013.7703.1784.4263.6663.1834.30811793.00.908
GP52.0621.6582.3941.6841.3941.9713475.0<0.0012.0851.6452.5701.9611.6172.39310989.00.484
GP61.2121.0481.3871.1571.0251.3415085.00.1821.3361.1621.5031.3361.1311.50611633.00.810
GP71.0230.9601.1240.9790.9021.1445235.00.3041.0590.9451.1800.9910.8851.1109285.00.014
GP81.0460.9931.1341.0880.9741.1895260.00.3101.0470.9641.1731.1131.0171.2469453.00.016
GP90.0980.0870.1120.0990.0830.1135827.00.9860.1110.0950.1270.1090.0920.12611156.00.545
GP103.3452.9834.1452.8092.3133.5013820.0<0.0013.1572.5293.8223.0642.5113.57311242.00.612
GP110.7010.6410.8800.7010.5900.8405516.00.6030.8200.7100.9390.7570.6540.8949913.00.043
GP120.9980.9391.0621.0220.9051.1055414.00.4811.0050.9271.0890.9720.8851.07010629.00.278
GP130.7100.6270.8750.6550.5590.7614210.00.0020.8010.6830.9430.7750.6260.93311038.00.489
GP1412.13611.14512.59012.47611.79013.0674261.00.00311.47810.90412.23711.82311.17712.5299652.00.025
GP150.3960.3490.4510.4430.3770.5094278.00.0030.5180.4480.5820.4740.4270.5469919.00.043
GP164.7164.2405.2764.2623.8134.8434080.00.0014.8074.2365.4674.5944.0285.0609813.00.038
GP171.6521.4801.9771.7791.4102.2725254.00.3102.0631.7632.4041.8441.5982.2249375.00.014
GP183.7143.1744.0063.3633.0733.7654873.00.0823.1582.8653.4953.1442.9003.61911353.00.712
GP190.9570.8731.0510.9020.8290.9824627.00.0230.9740.8691.0300.9020.8280.9918778.00.003
GP2029.12827.57930.74029.15227.52530.7695657.00.80226.69224.87027.83826.48724.68228.16011505.00.719
GP210.5100.4660.5440.5130.4680.5455391.00.4630.6160.5600.6640.6120.5570.66211575.00.771
GP224.2433.8134.6993.8593.4224.2584089.00.0014.0013.6074.5293.9363.4594.57210881.00.403
GP232.0091.5852.4202.0291.5452.3725687.00.8332.2811.9302.7512.1631.8052.63210772.00.360
GP241.3831.2401.7251.5321.2321.8145061.00.1711.4321.1301.6931.4421.1911.73911457.00.719
GP250.2920.2690.3160.2940.2700.3195717.00.8390.2740.2520.2990.2790.2470.30511409.00.719
GP261.4341.3401.7311.6211.4021.8364590.00.0201.5341.3221.7201.4991.2751.68310634.00.278
GP270.6900.5280.8910.8840.6621.0844160.00.0020.9460.7341.1171.0750.8531.2639374.00.014
GP280.6830.5890.7670.6720.5510.7955831.00.9860.6360.5200.7360.6040.5080.73911157.00.545
GP290.2010.1700.2310.1840.1580.2204975.00.1270.1810.1540.2010.1720.1550.20311454.00.719
GP304.6844.2795.5845.2104.1705.8695029.00.1564.8263.9445.4904.6023.8925.34710852.00.397
GP310.4250.3580.5230.4300.3390.5255703.00.8380.4330.3500.5310.3950.3200.4789931.00.043
GP321.5031.1991.7301.7741.4682.0453733.0<0.0011.5981.3441.8461.5941.3151.89411696.00.848
GP332.8072.0833.4903.5232.7814.3613883.0<0.0013.5042.7664.2134.0493.1654.7289528.00.018
GP340.3470.3100.4090.3950.3420.4454210.00.0020.3850.3400.4540.3840.3470.43411482.00.719
GP350.3520.2610.4600.4240.3350.5464287.00.0030.4170.3460.5180.4540.3690.56610481.00.211
GP360.4880.4290.5490.6030.5470.6902393.0<0.0010.5570.4850.6270.5930.5150.65110436.00.200
GP370.4120.3490.4730.4650.3710.5684533.00.0150.4520.3850.5530.4620.3890.54611712.00.848
GP380.8900.7371.0131.0670.9361.2583029.0<0.0011.0380.9231.2221.0980.9851.23410786.00.360
GP390.7830.6450.9201.0620.8561.3002931.0<0.0011.0000.8261.3181.1330.9741.4819822.00.038
GlycoAge0.1120.0170.2380.1630.0400.2955126.00.2080.2190.1280.3840.2560.1450.39411021.00.489
Results of the statistics are denoted as Mann Whitney U value (MW U) and false discovery rate (FDR) adjusted p value (p), where significant results are shown in bold. GP = glycan peak; GlycoAge index = log 10(FA2/FA2G2); PTSD = post-traumatic stress disorder.
Table 2. Distribution of N-glycan structures on IgG in healthy controls and patients with PTSD in discovery and replication cohort. Results are presented as age adjusted percentage of total glycan peak area (median, 25th, and 75th percentile).
IgG
N-glycan
Peak
Discovery cohort (N = 233)Replication cohort (N = 330)
Control (N = 73)PTSD (N = 160)StatisticsControl (N = 171)PTSD (N = 139)Statistics
Median25th75thMedian25th75thMW UpMedian25th75thMedian25th75thMW Up
GP10.0850.0700.1110.0890.0720.1105668.00.8890.0970.0800.1140.1000.0810.12411164.00.778
GP20.5360.3680.7190.6420.3990.9244887.00.1700.7390.5151.0010.7100.4931.11111671.00.987
GP30.1040.0880.1160.1080.0910.1255009.00.2880.1230.1110.1410.1250.1100.14011811.00.987
GP421.85017.97425.14422.73319.81827.2474905.00.21824.04221.20328.42725.36621.50129.43310892.00.778
GP50.1630.1500.1780.1570.1420.1745214.00.2180.1840.1570.2090.1830.1530.21411700.00.894
GP65.3404.2626.2016.1675.0567.3344046.00.0126.0364.9527.2746.2535.2297.43611067.00.778
GP70.3650.2890.4500.4020.2740.5315495.00.5510.4520.3330.5620.4420.3540.59711456.00.833
GP818.93617.69519.80118.55117.40919.5845297.00.42818.17916.80219.41518.12917.00219.23211641.00.833
GP99.5948.78910.6059.1428.19810.0114672.00.0619.5938.56410.4229.2418.48810.05010592.00.778
GP104.9104.2915.6185.1724.5746.1294688.00.0675.0834.4055.7285.1344.3426.03711427.00.833
GP110.6700.5780.7320.7080.6380.8214489.00.0610.6830.6120.7560.6780.5930.76511853.00.987
GP120.6840.5440.8950.6430.4660.9285521.00.7300.6070.4560.9230.6150.4770.96611571.00.833
GP130.2640.2300.2980.2580.2290.2935688.00.8850.2610.2280.2970.2570.2250.30011484.00.833
GP1413.17111.02515.40511.8649.80013.9134284.00.05111.6898.92913.59311.0158.70812.68111005.00.778
GP151.7621.5951.9191.7361.4821.9605570.00.8851.6511.4451.8611.6391.4381.84911831.00.987
GP163.1262.8373.4373.0862.7683.3935539.00.4303.0862.8383.4293.0712.7393.40611222.00.778
GP170.9730.9171.0880.9670.8811.1105638.00.8851.0080.8781.1250.9860.8821.11911677.00.833
GP189.3597.85710.6418.5596.9169.8964443.00.0617.8246.7019.2827.7056.7388.88611115.00.778
GP191.9921.7492.2062.0101.7522.3145461.00.6121.9661.7622.2591.9521.6022.20710479.00.373
GP200.4190.3730.4710.4280.3800.4725837.00.8850.4040.3620.4600.3980.3530.45511154.00.778
GP210.8510.7830.9420.8750.7920.9725459.00.4300.9080.8341.0030.8740.8020.9589792.00.174
GP220.1650.1320.2010.1730.1430.2105273.00.3270.1480.1220.1820.1460.1200.17811278.00.778
GP231.7901.5082.2261.5871.3401.8884307.00.0251.6151.4262.0351.6231.3031.84710358.00.373
GP241.8161.6372.0701.9391.6692.2535011.00.2591.9601.7352.2291.8651.5592.24110417.00.373
Glycoage0.2110.0530.3350.2830.1550.4464735.00.0670.3130.2070.5210.3540.2450.52011271.00.778
Results of the statistics are denoted as Mann Whitney U value (MW U) and adjusted p-value (false discovery rate (FDR) method). GP = glycan peak; GlycoAge index = log 10(FA2/FA2G2); PTSD: post-traumatic stress disorder.
Table 3. Correlation between PTSD severity determined by the CAPS scores and distribution of total plasma N-glycan structures, as well as differences between veterans with moderate and severe PTSD in discovery and replication cohort.
Plasma N-Glycan PeakDiscovery Cohort (N = 233)Replication Cohort (N = 330)
rhopMW UprhopMW Up
GP10.0350.791875.00.9840.0760.991612.00.921
GP20.0310.801885.00.9840.0090.991644.00.921
GP30.1260.364804.00.8990.0780.991562.00.921
GP40.1390.330821.00.8990.0030.991615.00.921
GP50.1490.330815.00.8990.0340.991576.00.921
GP60.1040.388741.00.8290.0760.991683.00.969
GP70.0950.395753.00.8290.1190.991687.00.969
GP80.0260.826693.00.8290.0090.991649.00.921
GP90.1110.388816.00.8990.0370.991668.00.969
GP100.1100.388877.00.9840.0170.991635.00.921
GP110.0550.735686.00.8290.0600.991699.00.969
GP120.0130.904680.00.8290.0200.991648.00.921
GP130.1100.388839.00.9690.0200.991508.00.921
GP140.0470.773678.00.8290.0050.991570.00.921
GP150.1000.388817.00.8990.0140.991525.00.921
GP160.1000.388770.00.8290.0120.991544.00.921
GP170.0440.784735.00.8290.0180.991641.00.921
GP180.0410.791745.00.8290.0010.991685.00.969
GP190.1480.330602.00.8290.2040.312593.00.921
GP200.1180.388798.00.8990.0040.991605.00.921
GP210.0340.791881.00.9840.0920.991625.00.921
GP220.0950.395845.00.9760.0290.991605.00.921
GP230.0120.904850.00.9770.0970.991514.00.921
GP240.1370.330823.00.8990.0250.991696.00.969
GP250.0340.791635.00.8290.2050.312505.00.921
GP260.0480.773685.00.8290.0700.991586.00.921
GP270.1360.330725.00.8290.0640.991452.00.921
GP280.1700.330736.00.8290.0120.991676.00.969
GP290.0090.914770.00.8290.0580.991672.00.969
GP300.1330.330621.00.8290.0180.991693.00.969
GP310.1580.330668.00.8290.1170.991641.00.921
GP320.1040.388872.00.9840.0080.991602.00.921
GP330.1460.330760.00.8290.0110.991508.00.921
GP340.0170.901752.00.8290.1340.991590.00.921
GP350.1060.388773.00.8290.0380.991515.00.921
GP360.1360.330867.00.9840.0930.991580.00.921
GP370.0560.735696.00.8290.0020.991614.00.921
GP380.0740.575772.00.8290.0280.991695.00.969
GP390.1510.330806.00.8990.0250.991628.00.921
GlycoAge0.0360.791875.00.9840.0130.991689.00.969
Results of the statistics are denoted as Spearman’s rho coefficient (ρ), Mann Whitney U value (MW U), and corresponding adjusted p value (false discovery rate (FDR) method). GP = glycan peak; GlycoAge index = log10 (FA2/FA2G2); PTSD = post-traumatic stress disorder.

