Tracking Temporal Development of Optical Thickness of Hydrogen Alpha Spectral Radiation in a Laser-Induced Plasma


Abstract
1. Introduction
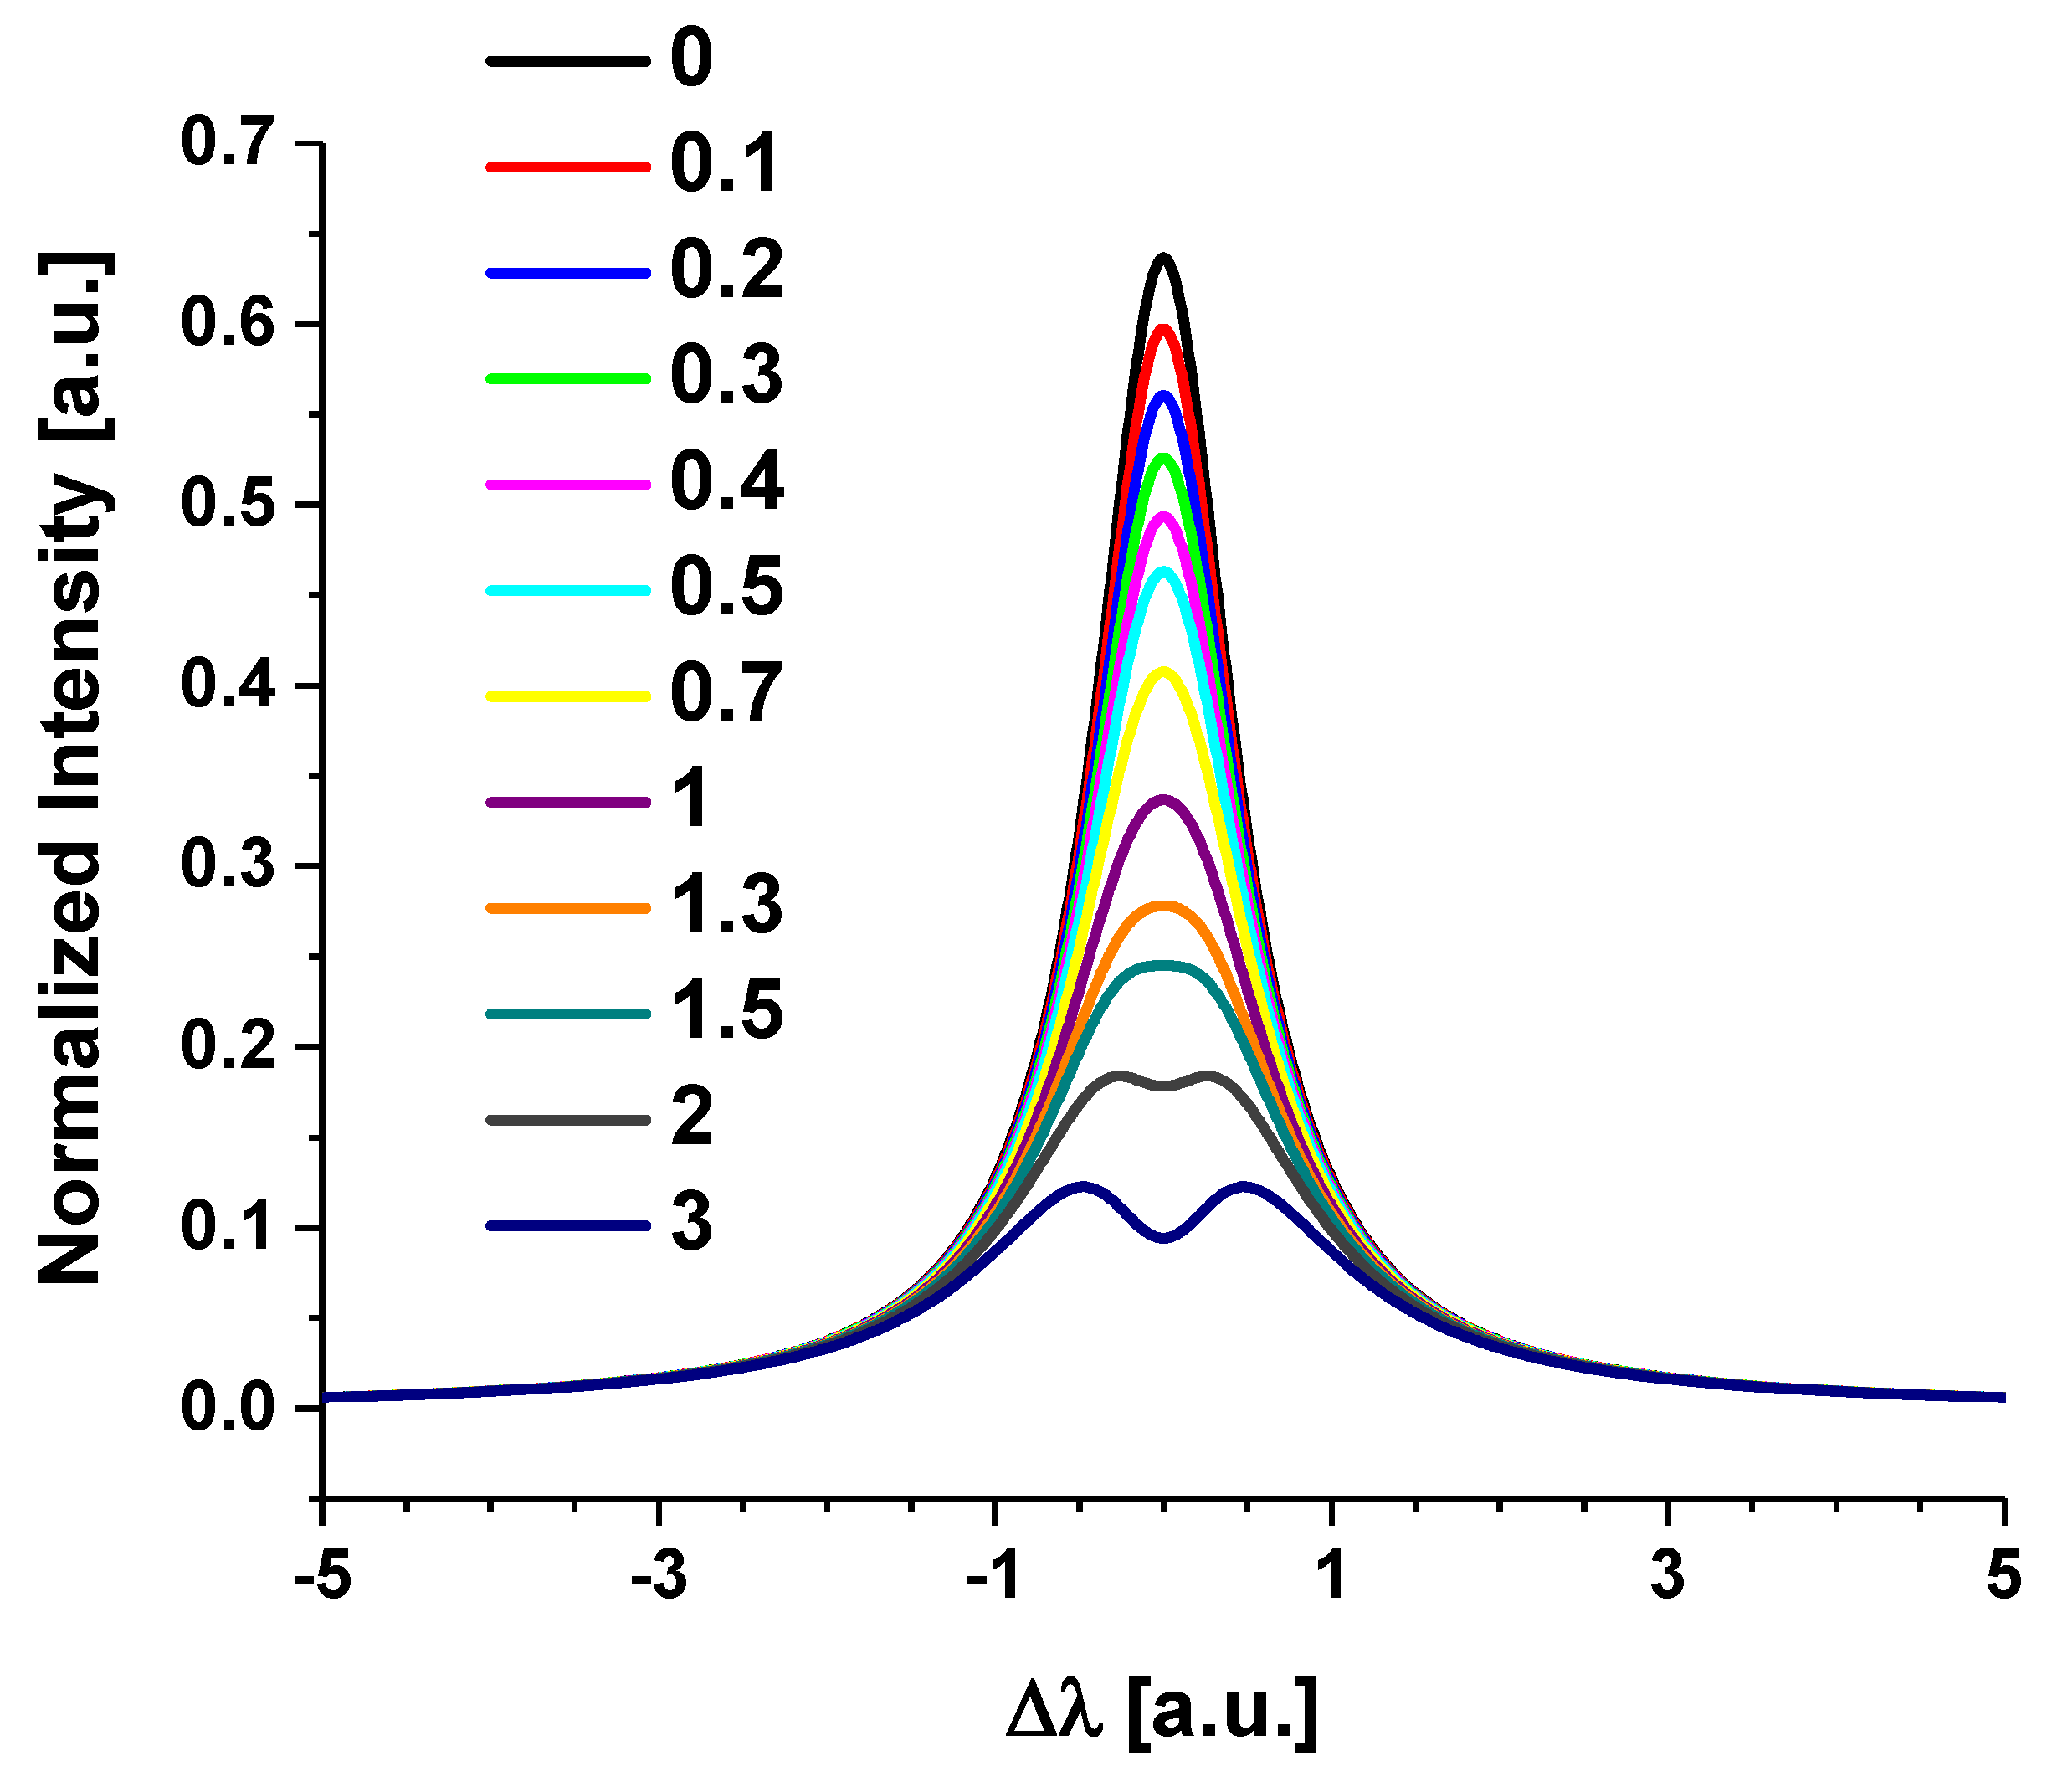
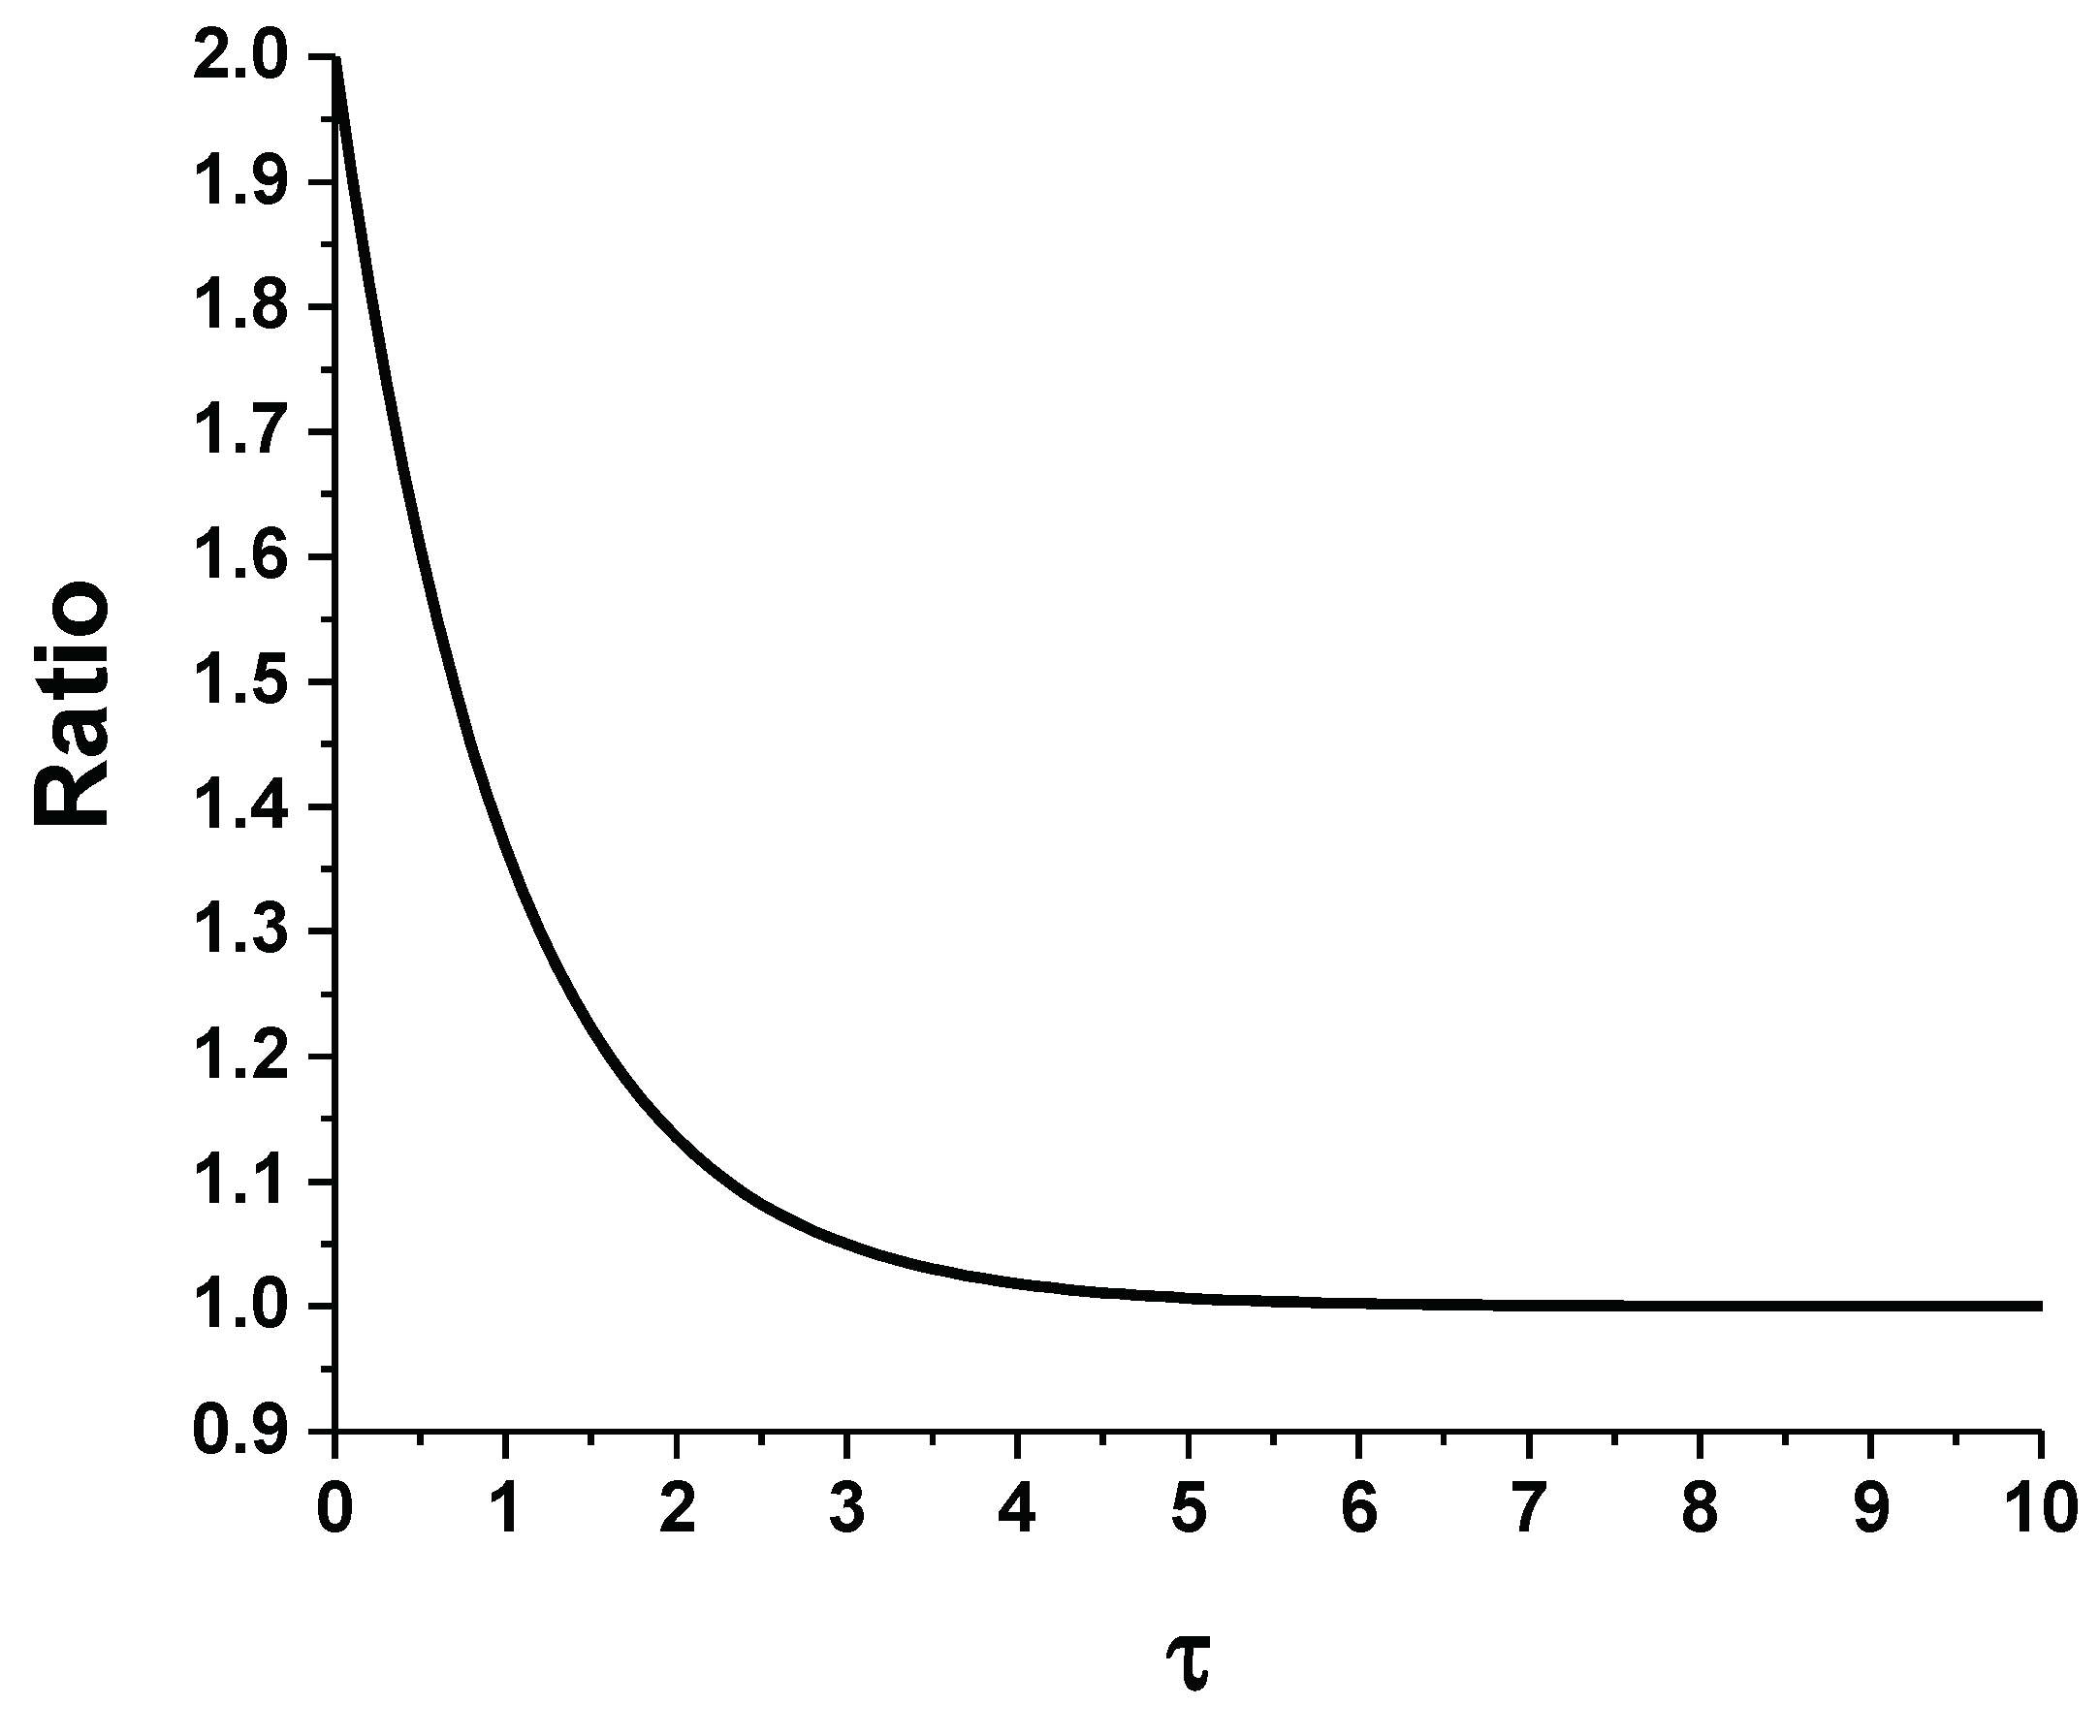
2. Theory
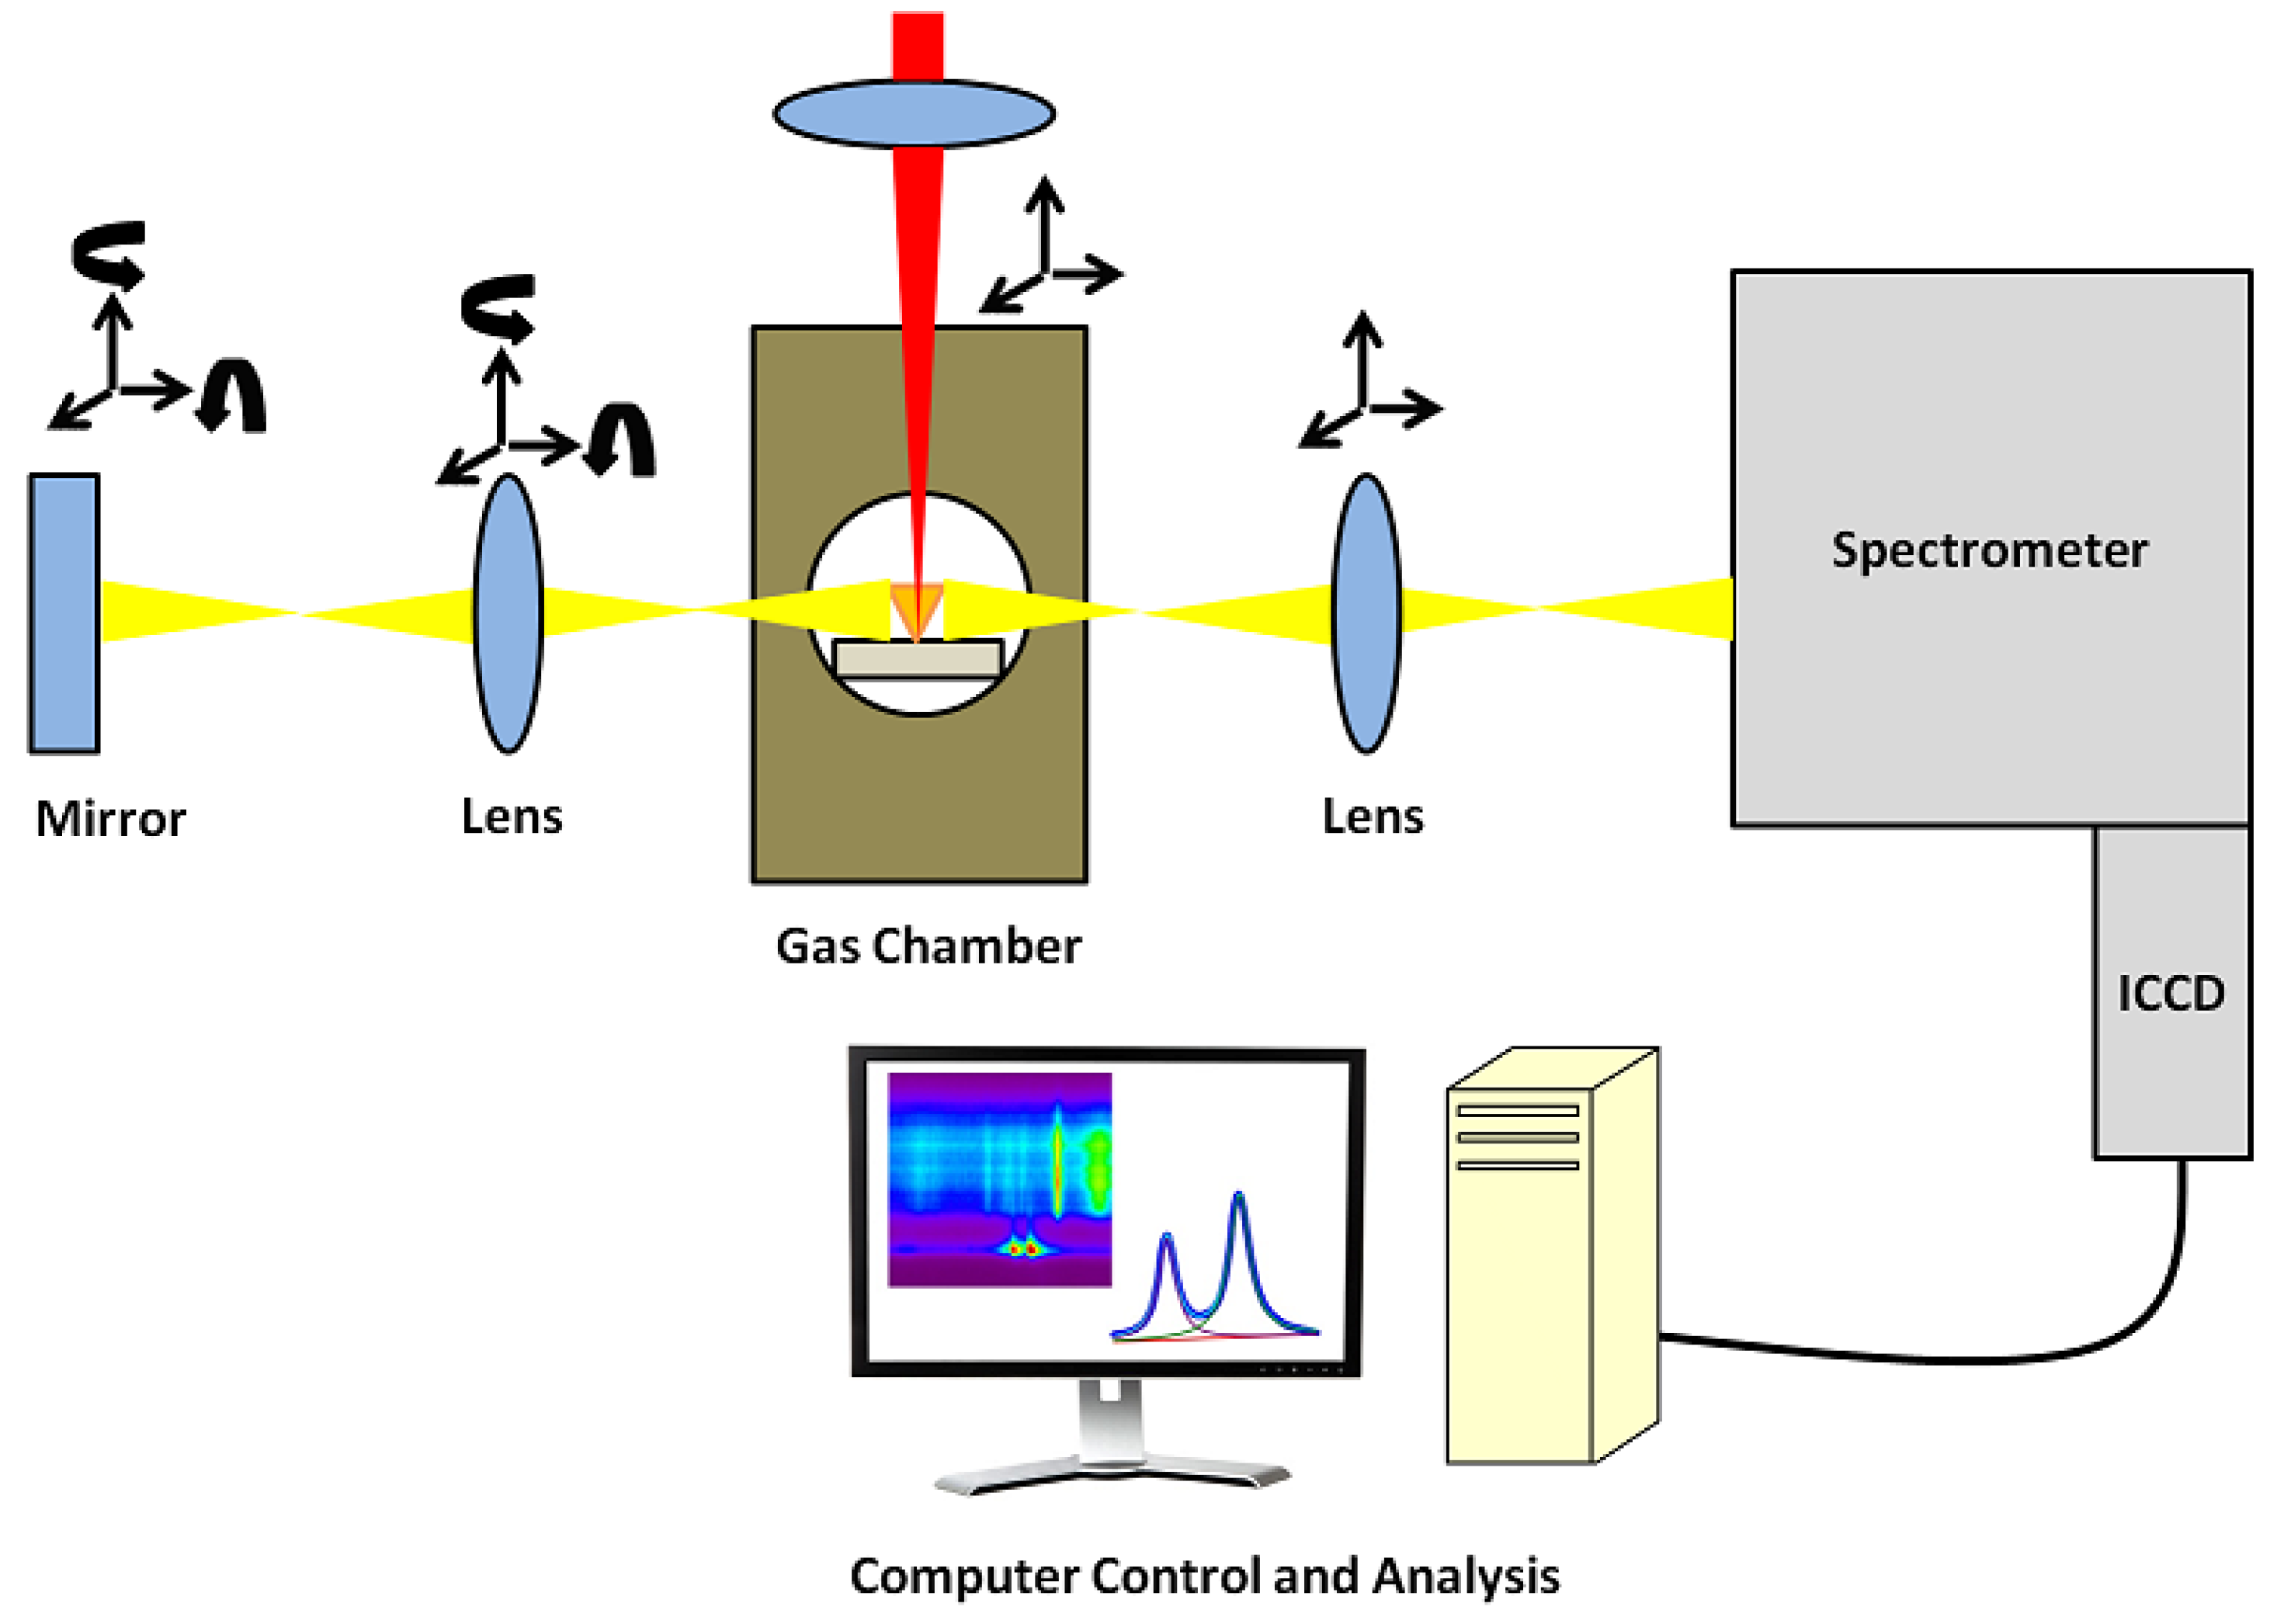
3. Experimental Details
4. Results and Discussion
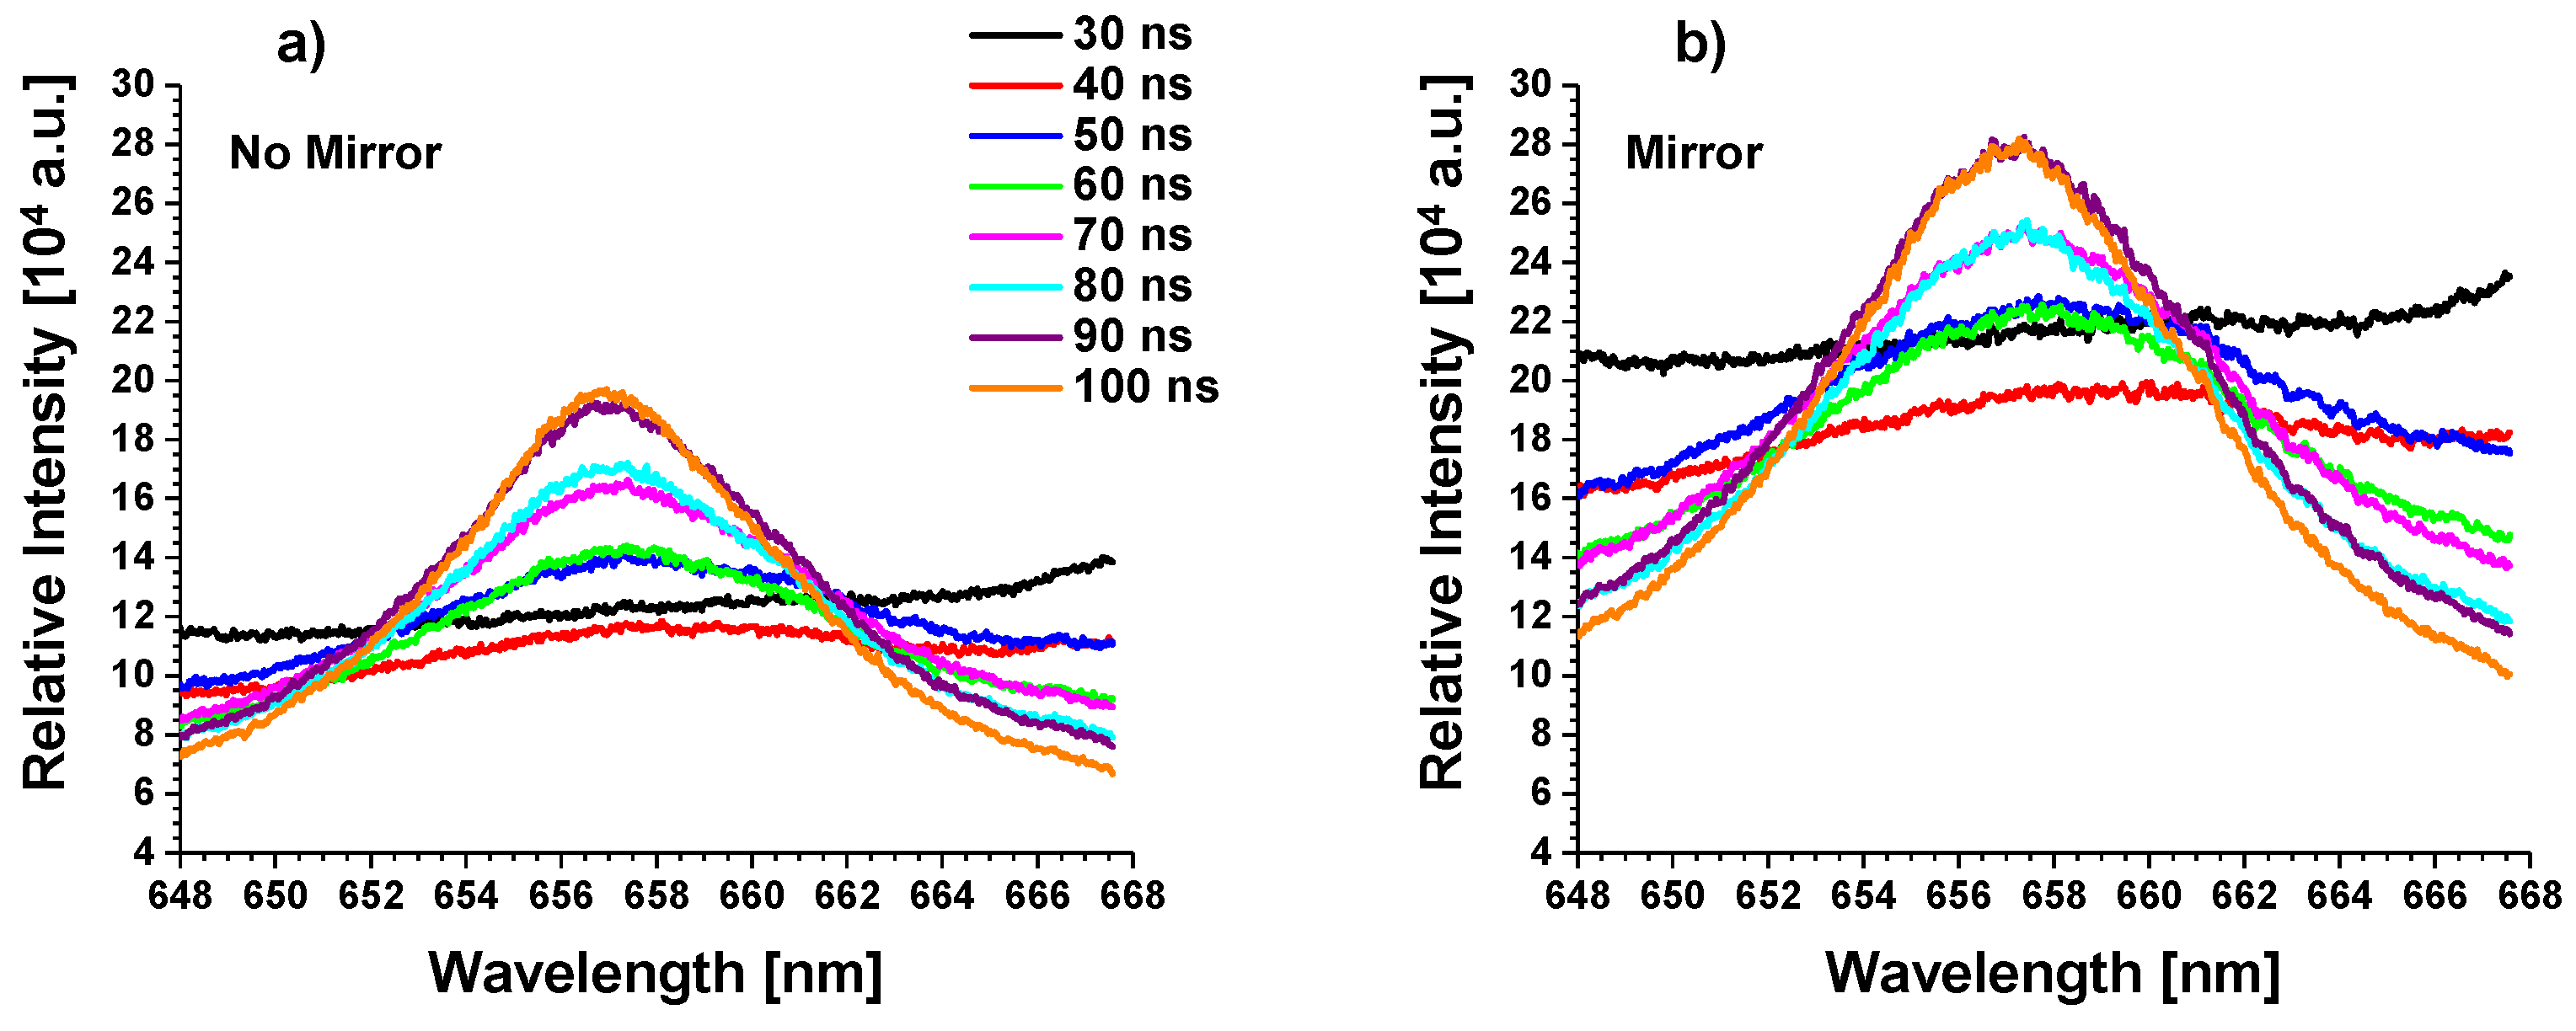
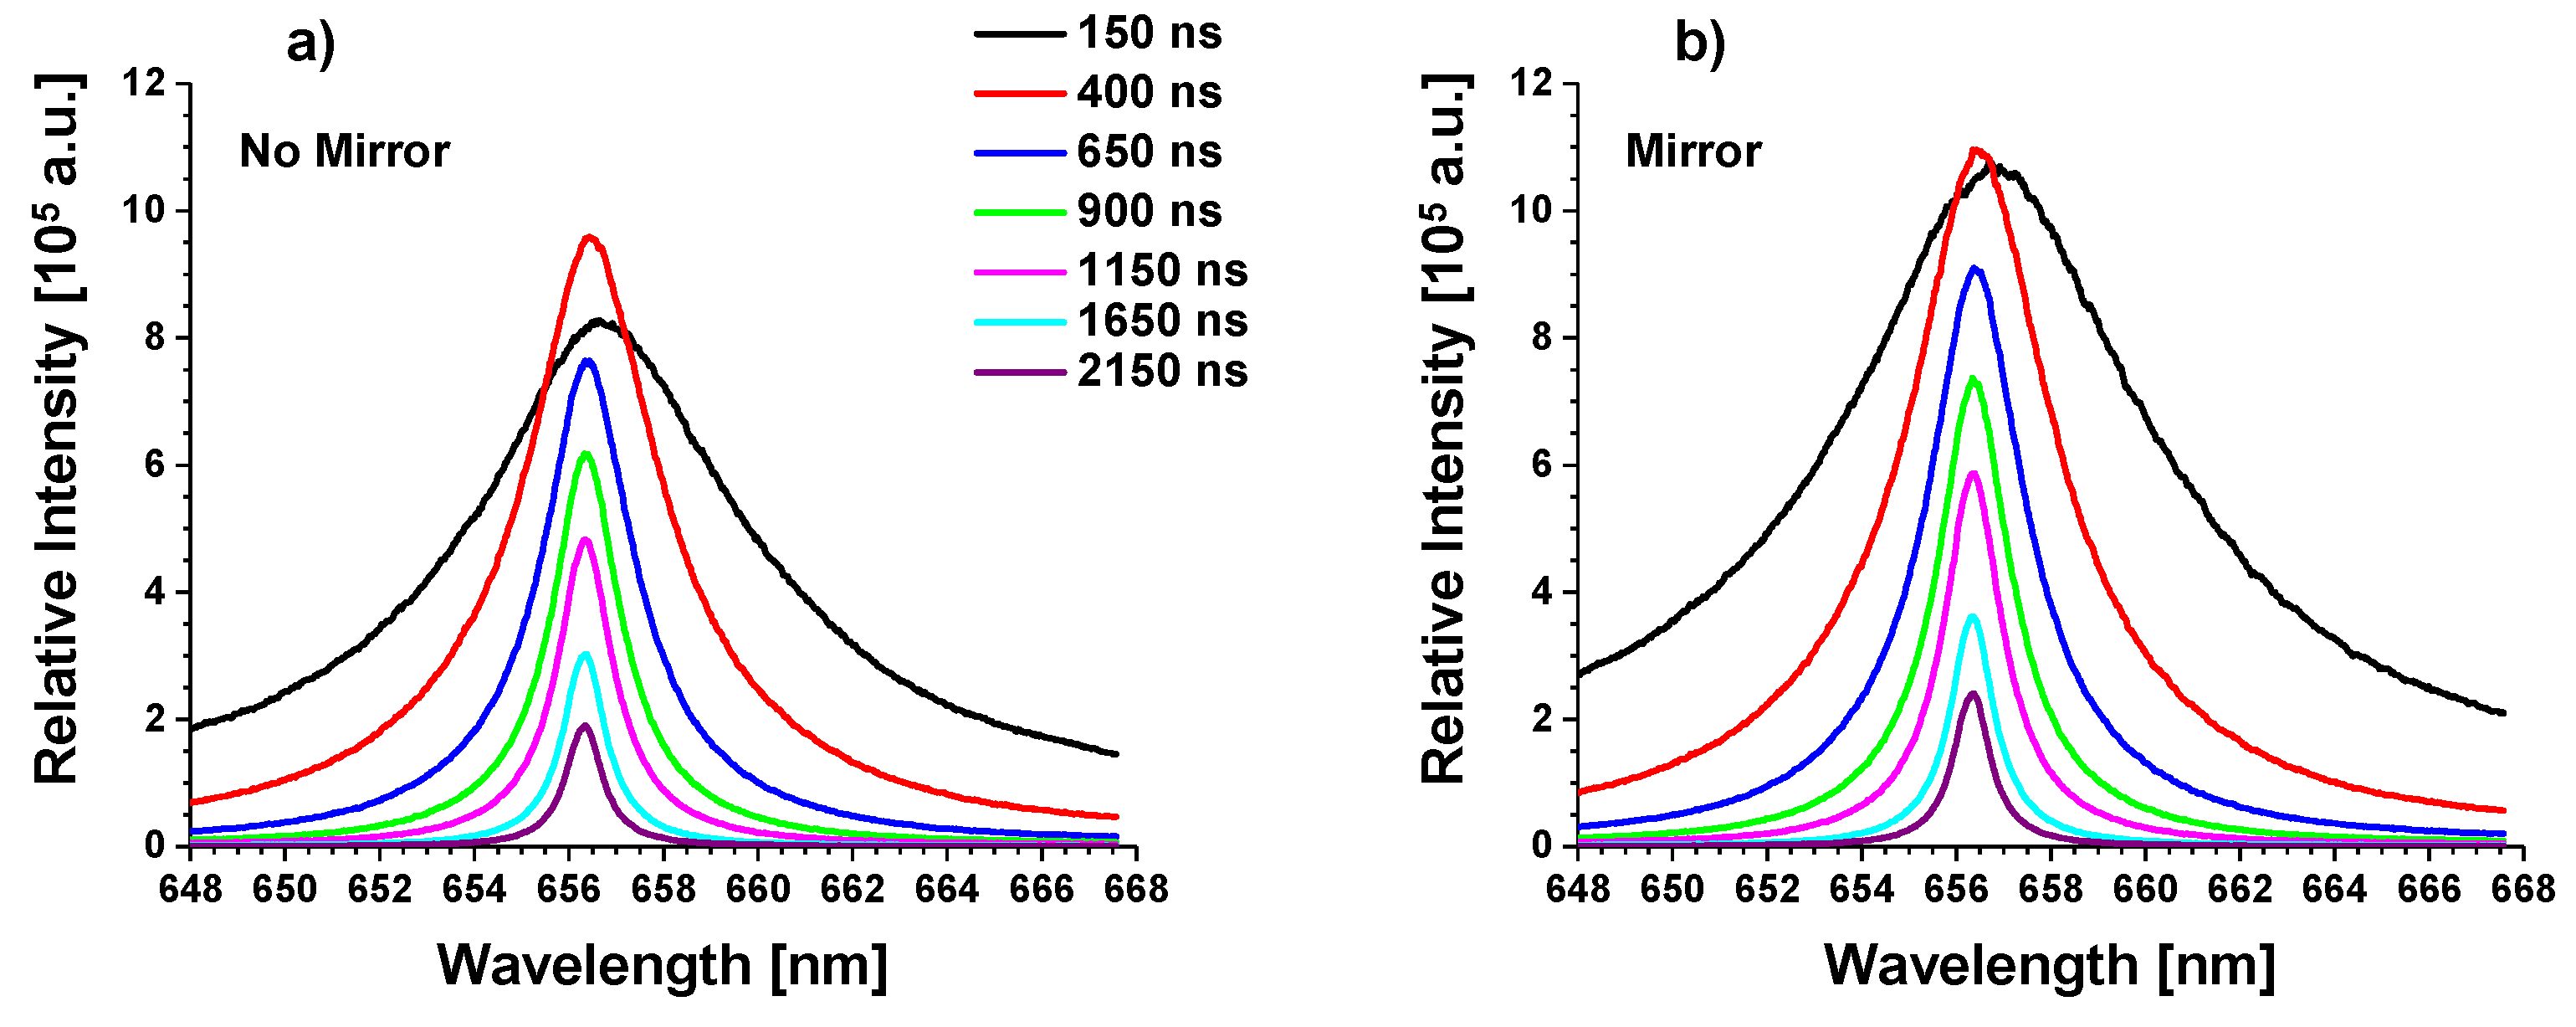
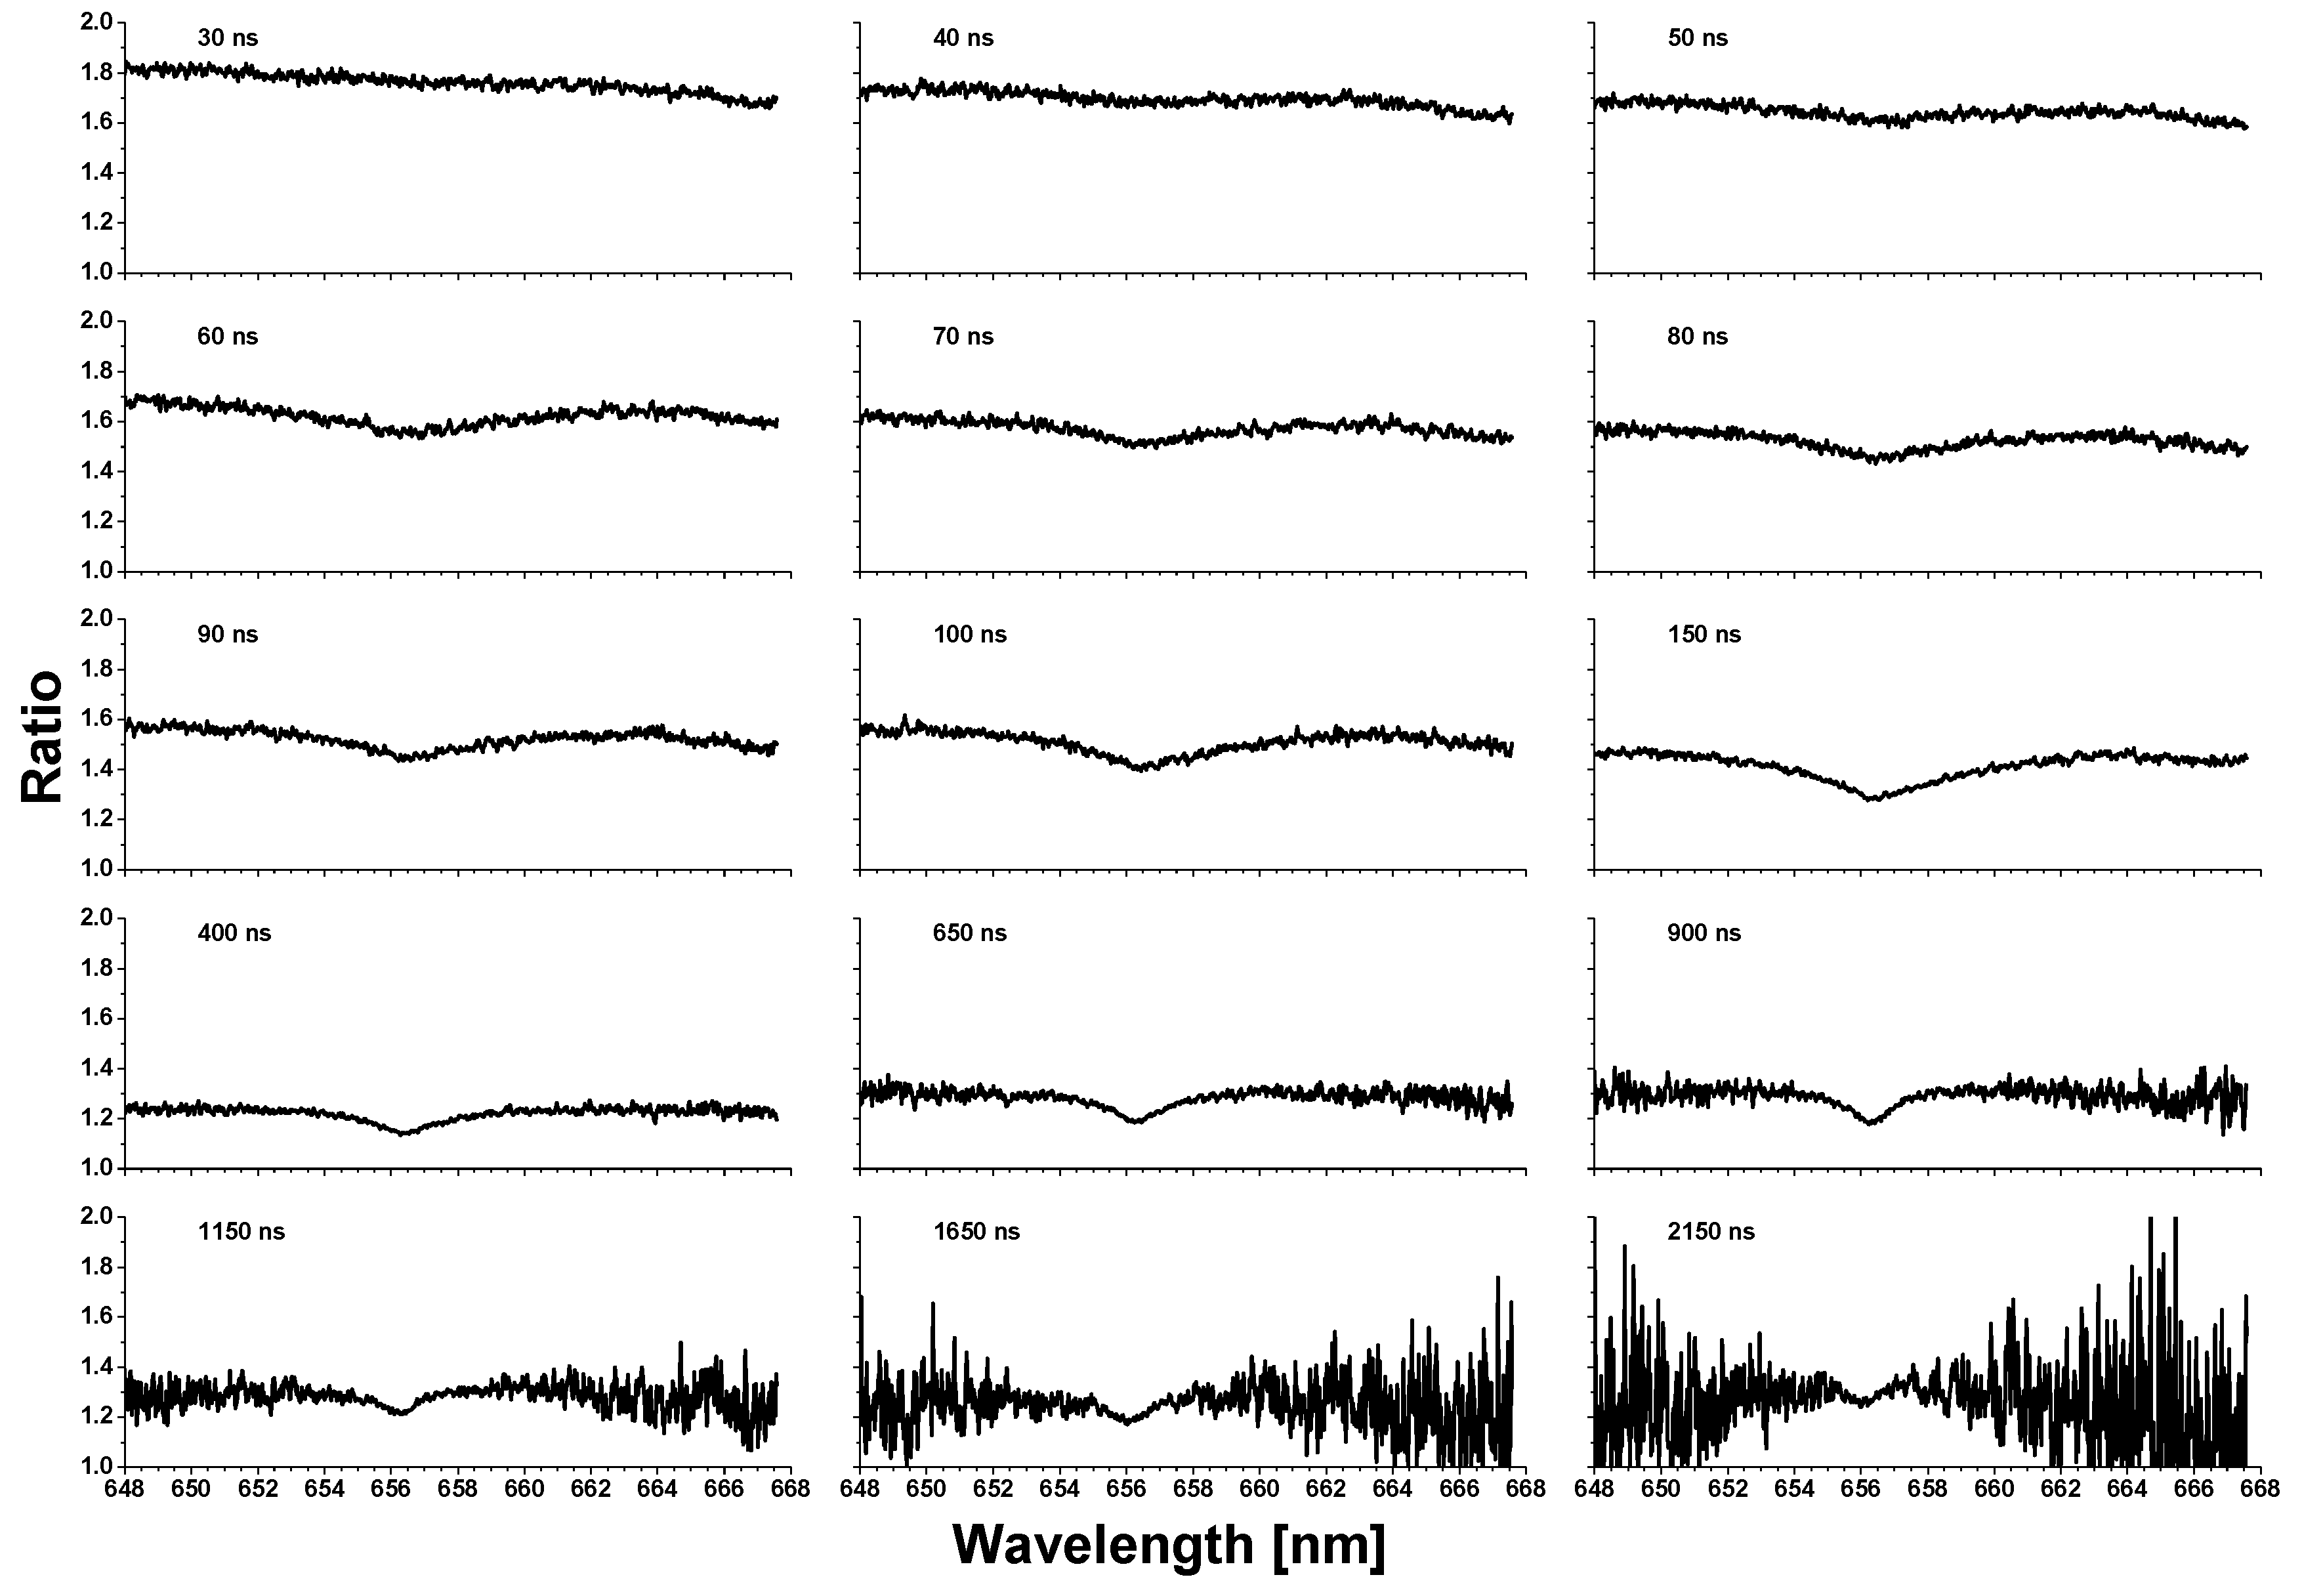
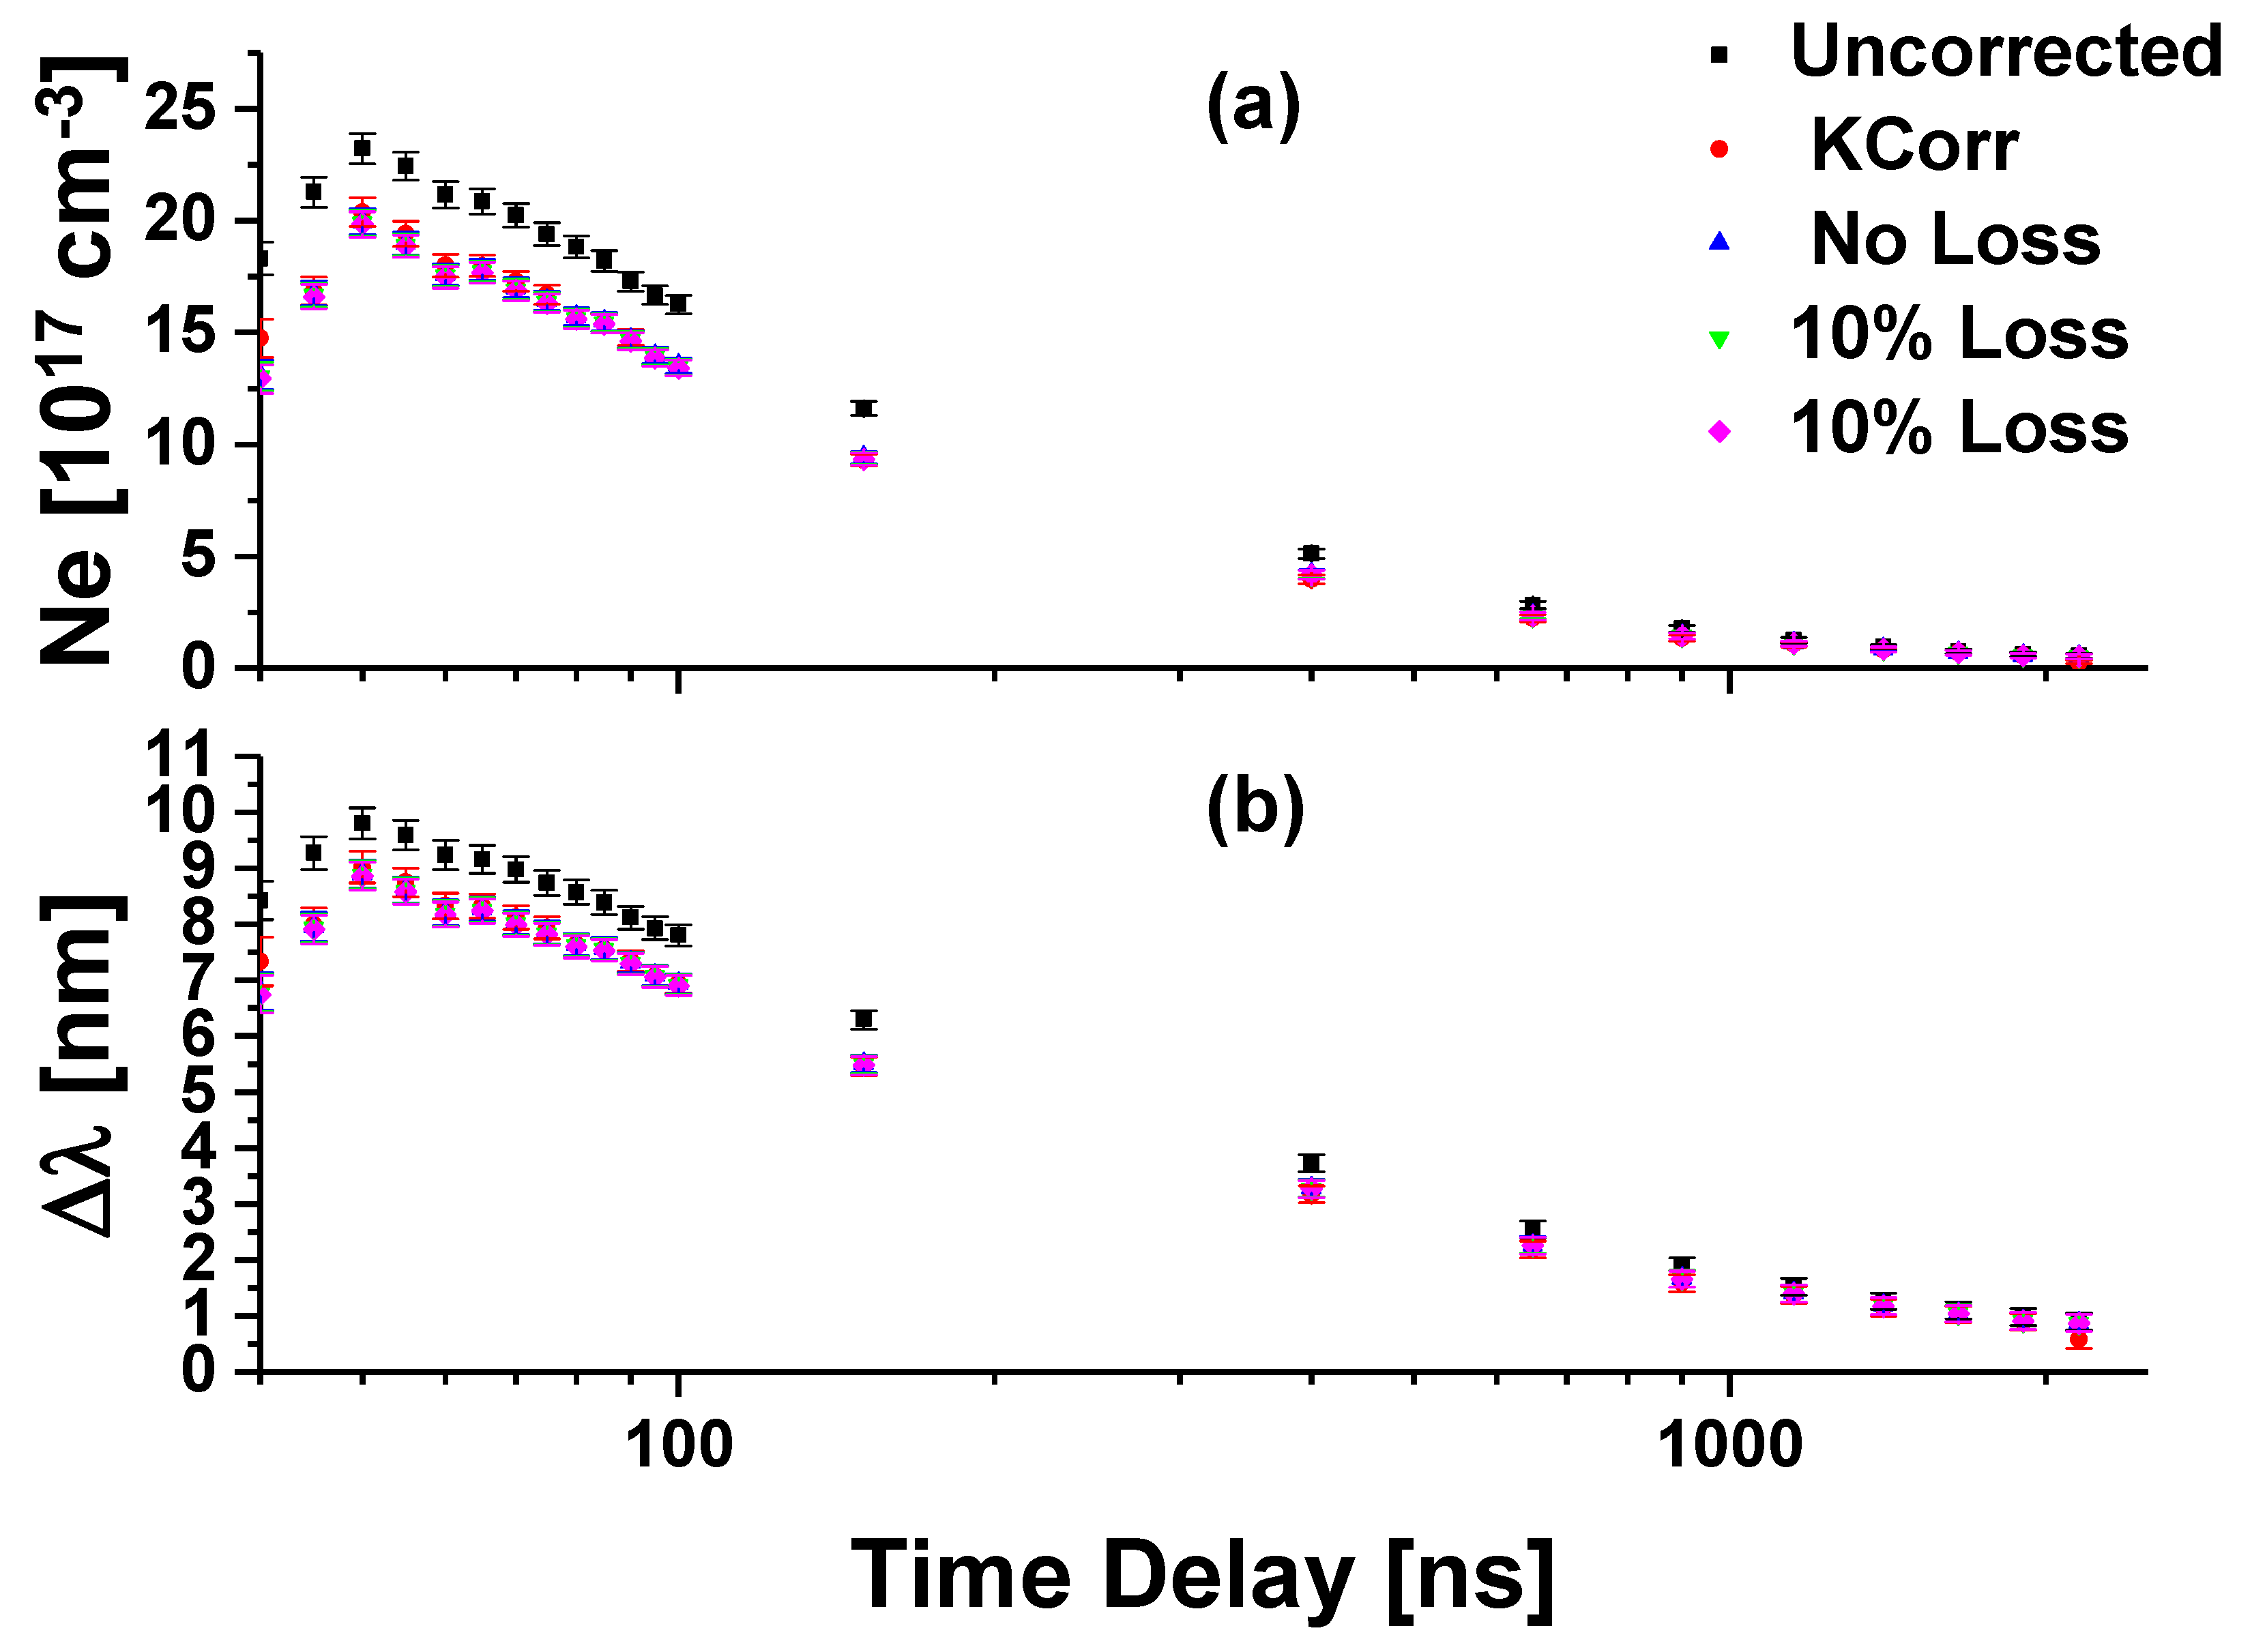
4.1. Temporal Self-Absorption Behavior
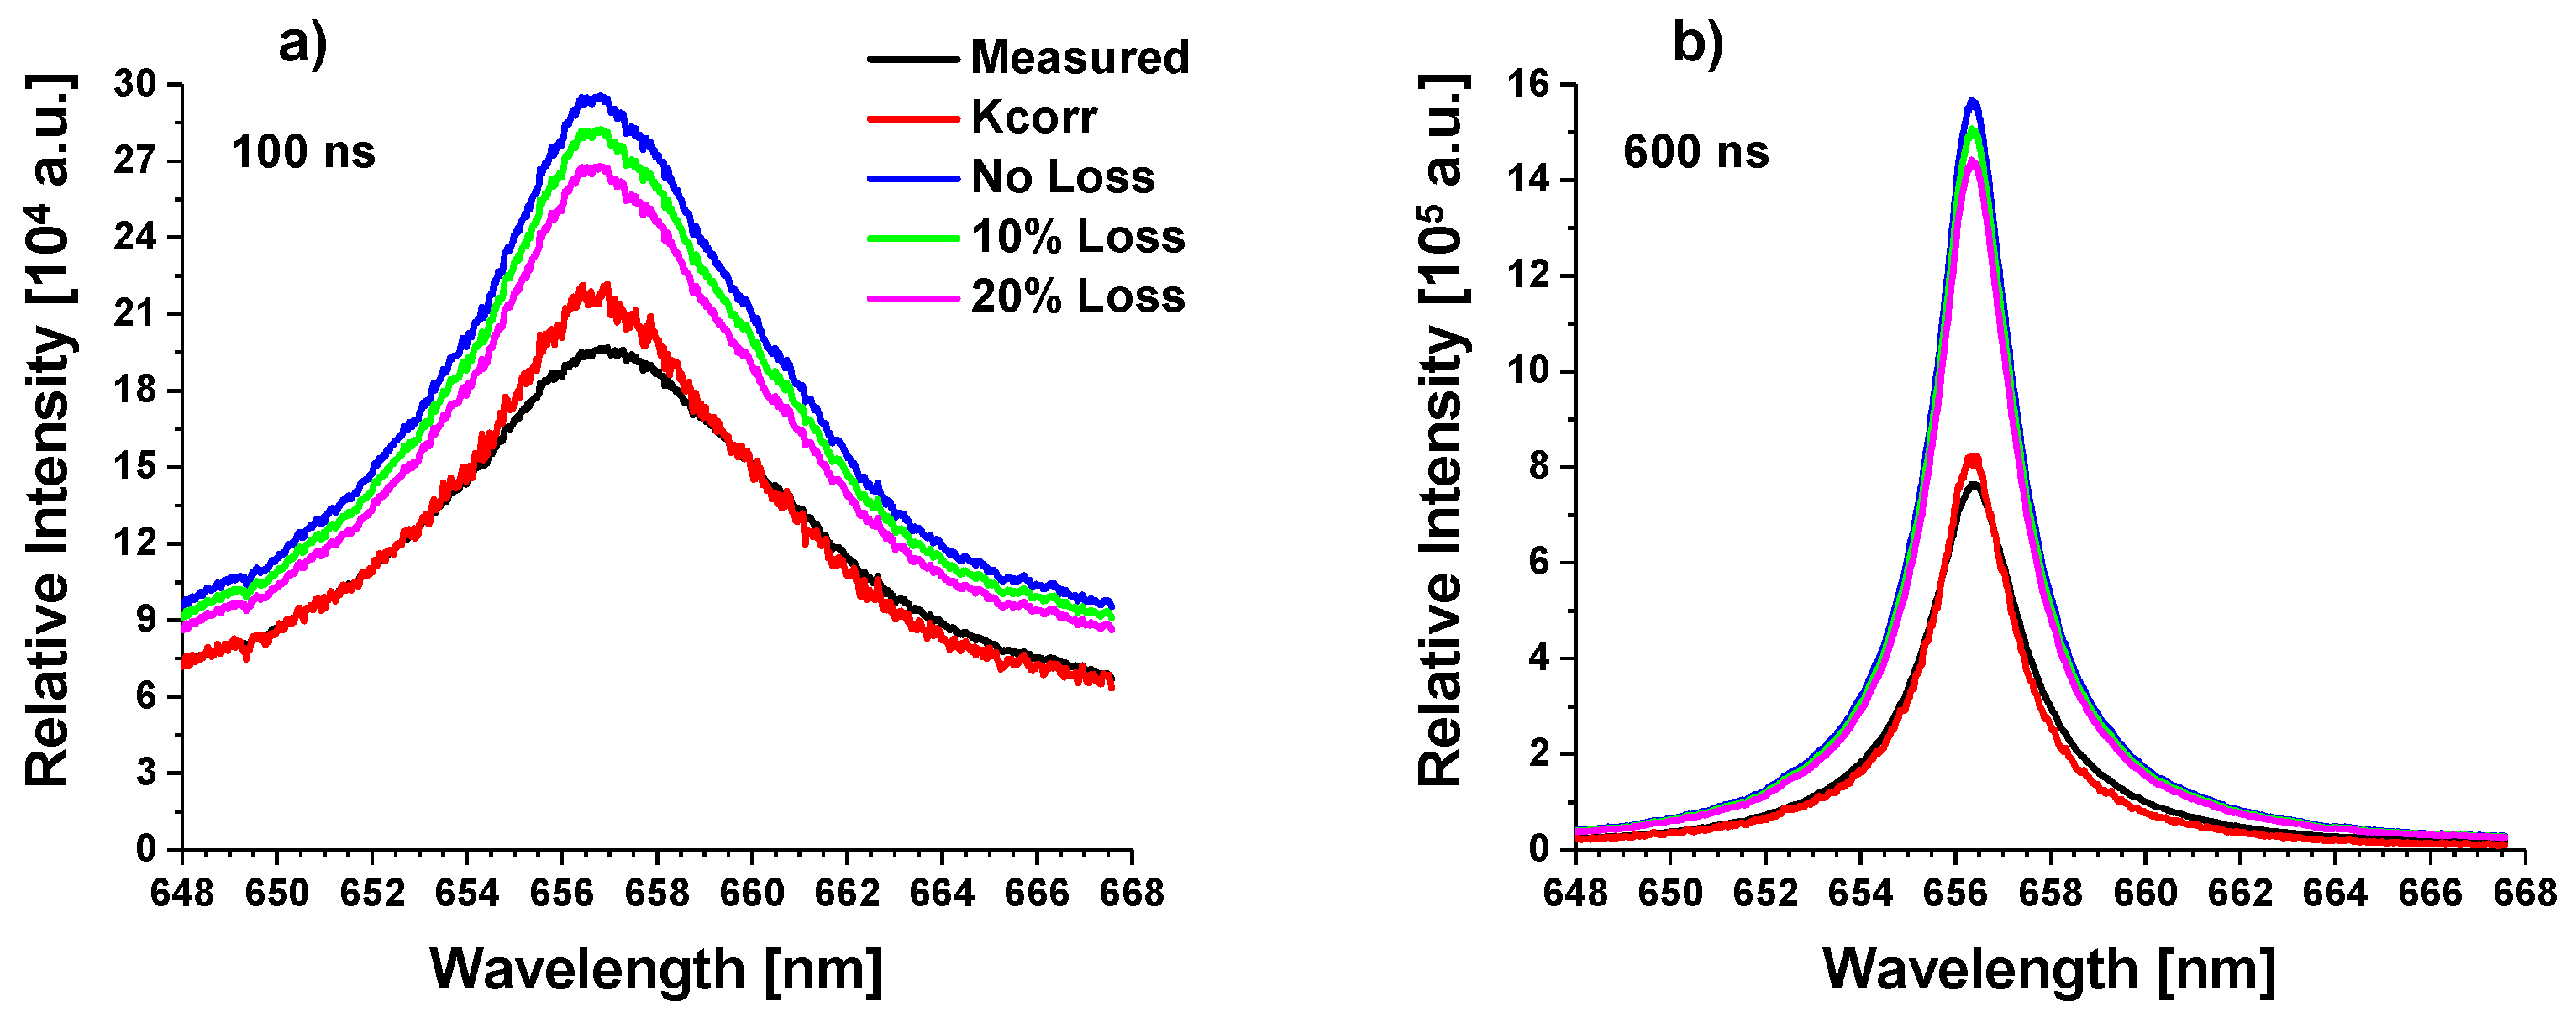
4.2. Self-Absorption Impact on Line Shapes
5. Conclusions
Author Contributions
Funding
Acknowledgments
Conflicts of Interest
References
- Parigger, C.G. Atomic and molecular emissions in laser-induced breakdown spectroscopy. Spectrochim. Acta Part B At. Spectrosc. 2013, 79–80, 4–16. [Google Scholar] [CrossRef]
- Harilal, S.S.; Brumfield, B.E.; Cannon, B.D.; Phillips, M.C. Shock wave mediated plume chemistry for molecular formation in laser ablation plasmas. Anal. Chem. 2016, 88, 2296–2302. [Google Scholar] [CrossRef] [PubMed]
- Lam, J.; Amans, D.; Chaput, F.; Diouf, M.; Ledoux, G.; Mary, N.; Masenelli-Varlot, K.; Motto-Ros, V.; Dujardin, C. γ-Al2O3 nanoparticles synthesized by pulsed laser ablation in liquids: A plasma analysis. Phys. Chem. Chem. Phys. 2016, 16, 963–973. [Google Scholar] [CrossRef] [PubMed]
- Panda, A.K.; Singh, A.; Thirumurugesan, R.; Kuppusami, P.; Mohandas, E. Optimization of substrate-target distance for pulsed laser deposition of tungsten oxide thin films using Langmuir probe. J. Instrument. 2015, 10, P09014. [Google Scholar] [CrossRef]
- Cremers, D.A.; Radziemski, L.J. Handbook of Laser-Induced Breakdown Spectroscopy; John Wiley and Sons: Hoboken, NJ, USA, 2006. [Google Scholar]
- Hahn, D.W.; Omenetto, N. Laser-Induced Breakdown Spectroscopy (LIBS), Part 1: Review of Basic Diagnostics and Plasma-Paritcle Interactions: Still-Challeneging Issues Within the Analytical Plasma Community. Appl. Spectrosc. 2010, 64, 335A–366A. [Google Scholar] [CrossRef]
- Hahn, D.W.; Omenetto, N. Laser-Induced Breakdown Spectroscopy (LIBS), Part, I.I. Review of Instrumental and Methodological Approaches to Material Analysis and Applications to Different Fields. Appl. Spectrosc. 2012, 66, 347–419. [Google Scholar] [CrossRef]
- Konjevic, N. On the use of non-hydrogenic spectral line profiles for plasma electron density diagnostics. Plasma Sources Sci. Technol. 2001, 10, 356–363. [Google Scholar] [CrossRef]
- Konjevic, N.; Dimitrijevic, M.S.; Wiese, W.L. Experimental stark widths and shifts for spectral lines of neutral atoms: A critical review of selected data for the period 1976 to 1982. J. Phys. Chem. Ref. Data 1984, 13, 649–686. [Google Scholar] [CrossRef]
- Konjevic, N.; Dimitrijevic, M.S.; Wiese, W.L. Experimental stark widths and shifts for spectral lines of positive ions: A critical review of selected data for the period 1976 to 1982. J. Phys. Chem. Ref. Data 1984, 13, 619–647. [Google Scholar] [CrossRef]
- Kunze, H.J. Introduction to Plasma Spectroscopy; Springer: Berlin/Heidelberg, Germany, 2009. [Google Scholar]
- Griem, H.R. Spectral Line Broadening By Plasmas; Academic Press: New York, NY, USA, 1974. [Google Scholar]
- Cowan, R.D.; Dieke, G.H. Self-Absorption of Spectrum Lines. Rev. Mod. Phys. 1948, 20, 418–455. [Google Scholar] [CrossRef]
- Cristoforetti, G.; Giacomo, A.D.; Dell’Aglio, M.; Legnaioli, S.; Tognoni, E.; Palleschi, V.; Omenetto, N. Local Thermodynamic Equilibrium in Laser-Induced Breakdown Spectroscopy: Beyond the McWhirter criterion. Spectrochim. Acta Part B At. Spectrosc. 2010, 65, 86–95. [Google Scholar] [CrossRef]
- Gottfried, J.L. Discrimination of biological and chemical threat simulants in residue mixtures on multiple substrates. Anal. Bioanal. Chem. 2011, 400, 3289–3304. [Google Scholar] [CrossRef] [PubMed]
- Amamou, H.; Bois, A.; Ferhat, B.; Redon, R.; Rossetto, B.; Matheron, P. Correction of self-absorption spectral line and ratios of transition probabilities for homogeneous and LTE plasma. J. Quant. Spectrosc. Radiat. Transf. 2002, 75, 747–763. [Google Scholar] [CrossRef]
- Amamou, H.; Bois, A.; Ferhat, B.; Redon, R.; Rossetto, B.; Ripert, M. Correction of the self-absorption for self-reversed spectral lines: Application to two resonance lines of nuetral aluminium. J. Quant. Spectrosc. Radiat. Transf. 2003, 77, 362–372. [Google Scholar] [CrossRef]
- Bulajic, D.; Corsi, M.; Cristoforetti, G.; Legnaioli, S.; Palleschi, V.; Salvetti, A.; Tognoni, E. A procedure for correcting self-absorption in calibration free-laser induced breakdown spectroscopy. Spectrochim. Acta Part B At. Spectrosc. 2002, 57, 339–353. [Google Scholar] [CrossRef]
- Burger, M.; Skoc̆ić, M.; Bukvić, S. Study of self-absorption in laser-induced breakdown spectroscopy. Spectrochim. Acta Part B At. Spectrosc. 2014, 101, 51–56. [Google Scholar] [CrossRef]
- El Sherbini, A.M.; El Sherbini, T.M.; Hegazy, H.; Cristoforetti, G.; Legnaioli, S.; Palleschi, V.; Pardini, L.; Salvetti, A.; Tognoni, E. Evaluation of self-absorption coefficients of aluminum emission lines in laser-induced breakdown spectroscopy measurments. Spectrochim. Acta Part B At. Spectrosc. 2005, 60, 1573–1579. [Google Scholar] [CrossRef]
- Fu, Y.; Warren, R.A.; Jones, W.B.; Smith, B.W.; Omenetto, N. Detecting Temporal Changes of Self-Absorption in a Laser-Induced Copper Plasma from Time-Resolved Photomultiplier Signal Emission Profiles. Appl. Spectrosc. 2019, 73, 163–170. [Google Scholar] [CrossRef]
- Herrera, K.K.; Tognoni, E.; Omenetto, N.; Smith, B.W.; Winfordner, J.D. Semi-quantitative analyis of metal alloys, brass and soil samples by calibration-free laser-induced breakdown spectroscopy: Recent results and considertions. J. Anal. At. Spectrom. 2009, 24, 413–425. [Google Scholar] [CrossRef]
- Moon, H.Y.; Herrera, K.K.; Omenetto, N.; Smith, B.J.; Winefordner, J.D. On the usefulness of a duplicating mirror to evaluate self-absorption effects in laser induced breakdown spectroscopy. Spectrochim. Acta Part B At. Spectrosc. 2009, 64, 702–713. [Google Scholar] [CrossRef]
- Omenetto, N.; Winefordner, J.D.; Alkemade, C.T.J. An expression for the atomic flourescence and thermal-emission intensity under conditions of near saturation and arbitrary self-absorption. Spectrochim. Acta Part B At. Spectrosc. 1975, 30, 335–341. [Google Scholar] [CrossRef]
- Hermann, J.; Grojo, D.; Axente, E.; Gerhard, C.; Burger, M.; Craciun, V. Ideal radiation source for plasma spectroscopy generated by laser ablation. Phys. Rev. E 2017, 96, 053210. [Google Scholar] [CrossRef] [PubMed]
- Gornushkin, I.B.; Stevenson, C.L.; Smith, B.W.; Omenetto, N.; Winefordner, J.D. Modeling an inhomogeneous optically thick laser induced plasma: A simplified theoretical approach. Spectrochim. Acta Part B At. Spectrosc. 2001, 56, 1769–1785. [Google Scholar] [CrossRef]
- Hermann, J.; Boulmer-Leborgne, C.; Hong, D. Diagnostics of the early phase of an ultraviolet laser induced plasma by spectral line analysis considering self-absorption. J. Appl. Phys. 1998, 83, 691–696. [Google Scholar] [CrossRef]
- Bransden, B.H.; Joachain, C.J. Physics of Atoms and Molecules, 2nd ed.; Prentice Hall: New York, NY, USA, 2003. [Google Scholar]
- Parigger, C.G.; Woods, A.C.; Witte, M.J.; Swafford, L.D.; Surmick, D.M. Measurement and analysis of atomic hydrogen and diatomic molecular AlO, C2, CN, and TiO spectra following laser-induced optical breakdown. J. Vis. Exp. 2012, 38, E51250. [Google Scholar]
- Ivković, M.; Konjević, N.; Pavlović, Z. Hydrogen Balmer beta: The separation between line peaks for plasma electron density diagnostics and self-absoprtion test. J. Quant. Spectrosc. Radiat. Transf. 2015, 154, 1–8. [Google Scholar] [CrossRef]
- Gautm, G.; Surmick, D.M.; Parigger, C.G. Comment on “Hydrogen Balmer beta: The separation between line peaks for plasma electron density diagnsotics and self-saborption test”. J. Quant. Specrosc. Radiat. Transf. 2015, 160, 19–21. [Google Scholar] [CrossRef]
- Aguilera, J.A.; Aragón, C. Characterization of laser-induced plasmas by emission spectroscopy with curve-of-growth measurements. Part I: Temporal evolution of plasma parameters and self-absorption. Spectrochim. Acta Part B At. Spectrosc. 2008, 63, 784–792. [Google Scholar] [CrossRef]
- Gornushkin, I.B.; Anzano, J.M.; King, L.A.; Smith, B.W.; Omenetto, N.; Winefordner, J.D. Curve of growth methodology applied to laser-induced plasma emission spectroscopy. Spectrochim. Acta Part B At. Spectrosc. 1999, 54, 491–503. [Google Scholar] [CrossRef]
- Fujimoto, T. Plasma Spectroscopy; Clarendon-Press: Oxford, UK, 2004. [Google Scholar]
- Ladenburg, R.; Reiche, F. Über selective Absorption. Ann. Phys. 1913, 347, 181–209. [Google Scholar] [CrossRef]
- Gouy, G.L. Recherches Photométrigues sur les Flammes Colorées. Ann. Chim. Phys. 1879, 18, 5–101. [Google Scholar]
- Parigger, C.G.; Gautam, G.; Surmick, D.M. Radial electron density measurements in laser-induced plasma from Abel inverted hydrogen Balmer beta line profiles. Int. Rev. At. Mol. Phys. 2015, 6, 43–65. [Google Scholar]
- Gigosos, M.A.; Gonzalez, M.A.; Cardeñoso, V. Computer simulated Balmer-alpha, -beta, and -gamma Stark line profiles for non-equilibirum plasma diagnostics. Spectrochim. Acta Part B At. Spectrosc. 2003, 58, 1489–1504. [Google Scholar] [CrossRef]
- Konjević, N.; Ivković, M.; Sakan, N. Hydrogen Balmer lines for low electron number density plasma diagnostics. Spectrochim. Acta Part B At. Spectrosc. 2012, 76, 16–26. [Google Scholar] [CrossRef]
- Parigger, C.G.; Plemmons, D.H.; Oks, E. Balmer series Hβ measurements in a laser-induced hydrogen plasma. Appl. Opt. 2003, 42, 5992–6000. [Google Scholar] [CrossRef] [PubMed]
- Abramowitz, M.; Stegun, I.A. Handbook of Mathematical Functions With Formulas, Graphs, and Mathematical Tables, 9th ed.; Dover: New York, NY, USA, 1964. [Google Scholar]
- Fadeeva, V.; Terentjev, N.M. Tables of Values of the Proability Integral for Complex Arguments; State Publishing House for Technical and Technological Literature: Moscow, Russia, 1954. [Google Scholar]
- MatLab®, Natick, MA, USA. 2018. Available online: https://www.mathworks.com (accessed on 5 November 2018).
- Zaghloul, M.R.; Ali, A.N. Algorithm 916: Computing the Faddeyeva and Voigt functions. ACM Trans. Math. Soft. 2011, 38, 15:1–15:22. [Google Scholar] [CrossRef]
- Byrd, R.H.; Schnabel, R.B.; Schultz, G.A. A trust region algorithm for nonlinearly constrained optimization. SIAM J. Numer. Anal. 1987, 24, 1152–1170. [Google Scholar] [CrossRef]
- Coleman, T.F.; Li, Y. An Interior Trust Region Approach for Nonlinear Minimization Subject to Bounds. SIAM J. Optimiz. 1996, 6, 418–445. [Google Scholar] [CrossRef]
- Surmick, D.M.; Parigger, C.G. Empirical Formulae for Electron Density Diagnostics from Hα and Hβ Line Profiles. Int. Rev. At. Mol. Phys. 2014, 5, 73–81. [Google Scholar]
- Griem, H.R.; Halenka, J.; Olchawa, W. Comparison of hydrogen Balmer-alpha Stark profiles measured at high electron densities with theoretical results. J. Phys. B At. Mol. Opt. Phys. 2005, 38, 975. [Google Scholar] [CrossRef]


| Time [ns] | Uncorrected [nm] | Kcorr [nm] | No Loss [nm] | 10% Loss [nm] | 20% [nm] |
|---|---|---|---|---|---|
| 40 | 8.42 ± 0.34 | 7.33 ± 0.43 | 6.80 ± 0.34 | 6.77 ± 0.34 | 6.74 ± 0.34 |
| 50 | 9.80 ± 0.28 | 9.01 ± 0.28 | 8.89 ± 0.25 | 8.88 ± 0.25 | 8.86 ± 0.25 |
| 60 | 9.24 ± 0.23 | 8.32 ± 0.23 | 8.20 ± 0.23 | 8.19 ± 0.23 | 8.17 ± 0.23 |
| 70 | 8.98 ± 0.26 | 8.12 ± 0.21 | 8.03 ± 0.21 | 8.01 ± 0.22 | 7.99 ± 0.21 |
| 80 | 8.57 ± 0.24 | 7.63 ± 0.19 | 7.64 ± 0.20 | 7.61 ± 0.20 | 7.60 ± 0.20 |
| 90 | 8.11 ± 0.21 | 7.34 ± 0.19 | 7.31 ± 0.19 | 7.30 ± 0.19 | 7.29 ± 0.19 |
| 100 | 7.80 ± 0.20 | 6.93 ± 0.18 | 6.93 ± 0.18 | 6.92 ± 0.18 | 6.90 ± 0.18 |
| 150 | 6.30 ± 0.17 | 5.46 ± 0.16 | 5.51 ± 0.16 | 5.49 ± 0.16 | 5.47 ± 0.16 |
| 400 | 3.72 ± 0.15 | 3.17 ± 0.15 | 3.28 ± 0.15 | 3.28 ± 0.15 | 3.27 ± 0.15 |
| 650 | 2.53 ± 0.15 | 2.19 ± 0.15 | 2.27 ± 0.15 | 2.26 ± 0.15 | 2.25 ± 0.15 |
| 900 | 1.88 ± 0.15 | 1.58 ± 0.15 | 1.66 ± 0.15 | 1.66 ± 0.15 | 1.65 ± 0.15 |
| 1150 | 1.51 ± 0.15 | 1.36 ± 0.15 | 1.40 ± 0.15 | 1.40 ± 0.15 | 1.40 ± 0.15 |
| 1650 | 1.10 ± 0.15 | 1.02 ± 0.15 | 1.04 ± 0.15 | 1.04 ± 0.15 | 1.04 ± 0.15 |
| 2150 | 0.90 ± 0.15 | 0.57 ± 0.15 | 0.87 ± 0.15 | 0.87 ± 0.15 | 0.87 ± 0.15 |
© 2019 by the authors. Licensee MDPI, Basel, Switzerland. This article is an open access article distributed under the terms and conditions of the Creative Commons Attribution (CC BY) license (http://creativecommons.org/licenses/by/4.0/).
Share and Cite
Surmick, D.M.; Parigger, C.G. Tracking Temporal Development of Optical Thickness of Hydrogen Alpha Spectral Radiation in a Laser-Induced Plasma. Atoms 2019, 7, 101. https://doi.org/10.3390/atoms7040101
Surmick DM, Parigger CG. Tracking Temporal Development of Optical Thickness of Hydrogen Alpha Spectral Radiation in a Laser-Induced Plasma. Atoms. 2019; 7(4):101. https://doi.org/10.3390/atoms7040101
Chicago/Turabian StyleSurmick, David M., and Christian G. Parigger. 2019. "Tracking Temporal Development of Optical Thickness of Hydrogen Alpha Spectral Radiation in a Laser-Induced Plasma" Atoms 7, no. 4: 101. https://doi.org/10.3390/atoms7040101
APA StyleSurmick, D. M., & Parigger, C. G. (2019). Tracking Temporal Development of Optical Thickness of Hydrogen Alpha Spectral Radiation in a Laser-Induced Plasma. Atoms, 7(4), 101. https://doi.org/10.3390/atoms7040101