1. Introduction
Mathematical chemistry is a hypothetical science in which synthetic structures are observable by the use of scientific instruments. The synthetic diagram hypothesis is a part of this field where chart hypothesis devices are applied to scientifically demonstrate concoctions. This hypothesis noticeably contributes to the field of concoction science [
1].
A diagram G (V, E), with a vertex set V and an edge set E, is shown to be associated if an association between any pair of vertices in G exists. A system is essentially an associated diagram with no distinct edges and no circles. For diagram G, the level of vertex V is the quantity of edges with respect to V and is referred to as deg (v). A sub-atomic diagram is a synthetic structure in which vertices signify iotas and edges refer to bonds.
Atomic diagrams are typically described by various topological records regarding the relationship between the substance structures of a particle with natural, synthetic, or physical properties. Studies have determined a few applications of various topological files in quantitative structure–action relationships (QSARs), quantitative structure–property relationships (QSPRs), virtual screening, and computational medication planning.
A topological list is a numerical quantity, related to a chart, which describes the topology of a diagram and is invariant under diagram automorphism. A topological list (Top(
G)) of a diagram (G) is a number with the property that, for each chart
H isomorphic to
G, Top(
H) = Top(
G). The idea of a topological file originated from the work done by Wiener [
2] when he was attempting to determine the breaking point of paraffin. He named this value the way number. Later on, the way number was renamed in the Wiener file. The Wiener record is the first and most concentrated topological list, both from a hypothetical perspective and by its applications, and is characterized as the entirety of the separations between all the sets of vertices in
G (see [
3] for details).
One of the most seasoned topological records is the main Zagreb list, which was presented by Gutman and Trinajstic in 1972 and is based on the level of vertices of
G. In 2013, Shirdel, Reza Pour, and Sayadi [
4] presented a degree-based Zagreb list called the hyper-Zagreb record. It is as follows:
In 2012, Ghorbani and Azimi [
5] characterized two new forms of Zagreb record for diagram
G. The principal Zagreb records
PM1(
G), the second numerous Zagreb list
PM2(
G), and the following files are characterized below:
In Reference [
6], the Zagreb polynomials were defined as
Recently, there has been extensive research activity into the
HM(G),
vPM1(G), and
PM2(G) indices, as well as
M1(G, x) and
M2(G,x) polynomials and their variants (see also [
7,
8,
9,
10,
11,
12,
13]). For further research regarding the topological indices of various graph families, see [
14,
15,
16,
17,
18,
19,
20,
21,
22,
23,
24,
25,
26].
2. Main Results and Methods
To process our results, we used the techniques of combinatorial figuring, the vertex segment strategy, the edge segment strategy, diagram hypothetical apparatuses, and the degree tallying technique. Further, we used MATLAB software for numerical calculations and checks. Additionally, we used Maple software to plot these numerical results. Furthermore, we processed the hyper-Zagreb file, the first various Zagreb file, the second numerous Zagreb file, and the Zagreb polynomials regarding the crystallographic structure of Cu2O and titanium difluoride (TiF2).
3. Crystallographic Structure of Cu2O
Among the different metal oxides, Cu
2O has recently attracted a great deal of attention due to its recognized properties, non-poisonous nature, ease, abundance, and straightforward creation process. Currently, the promising applications of Cu
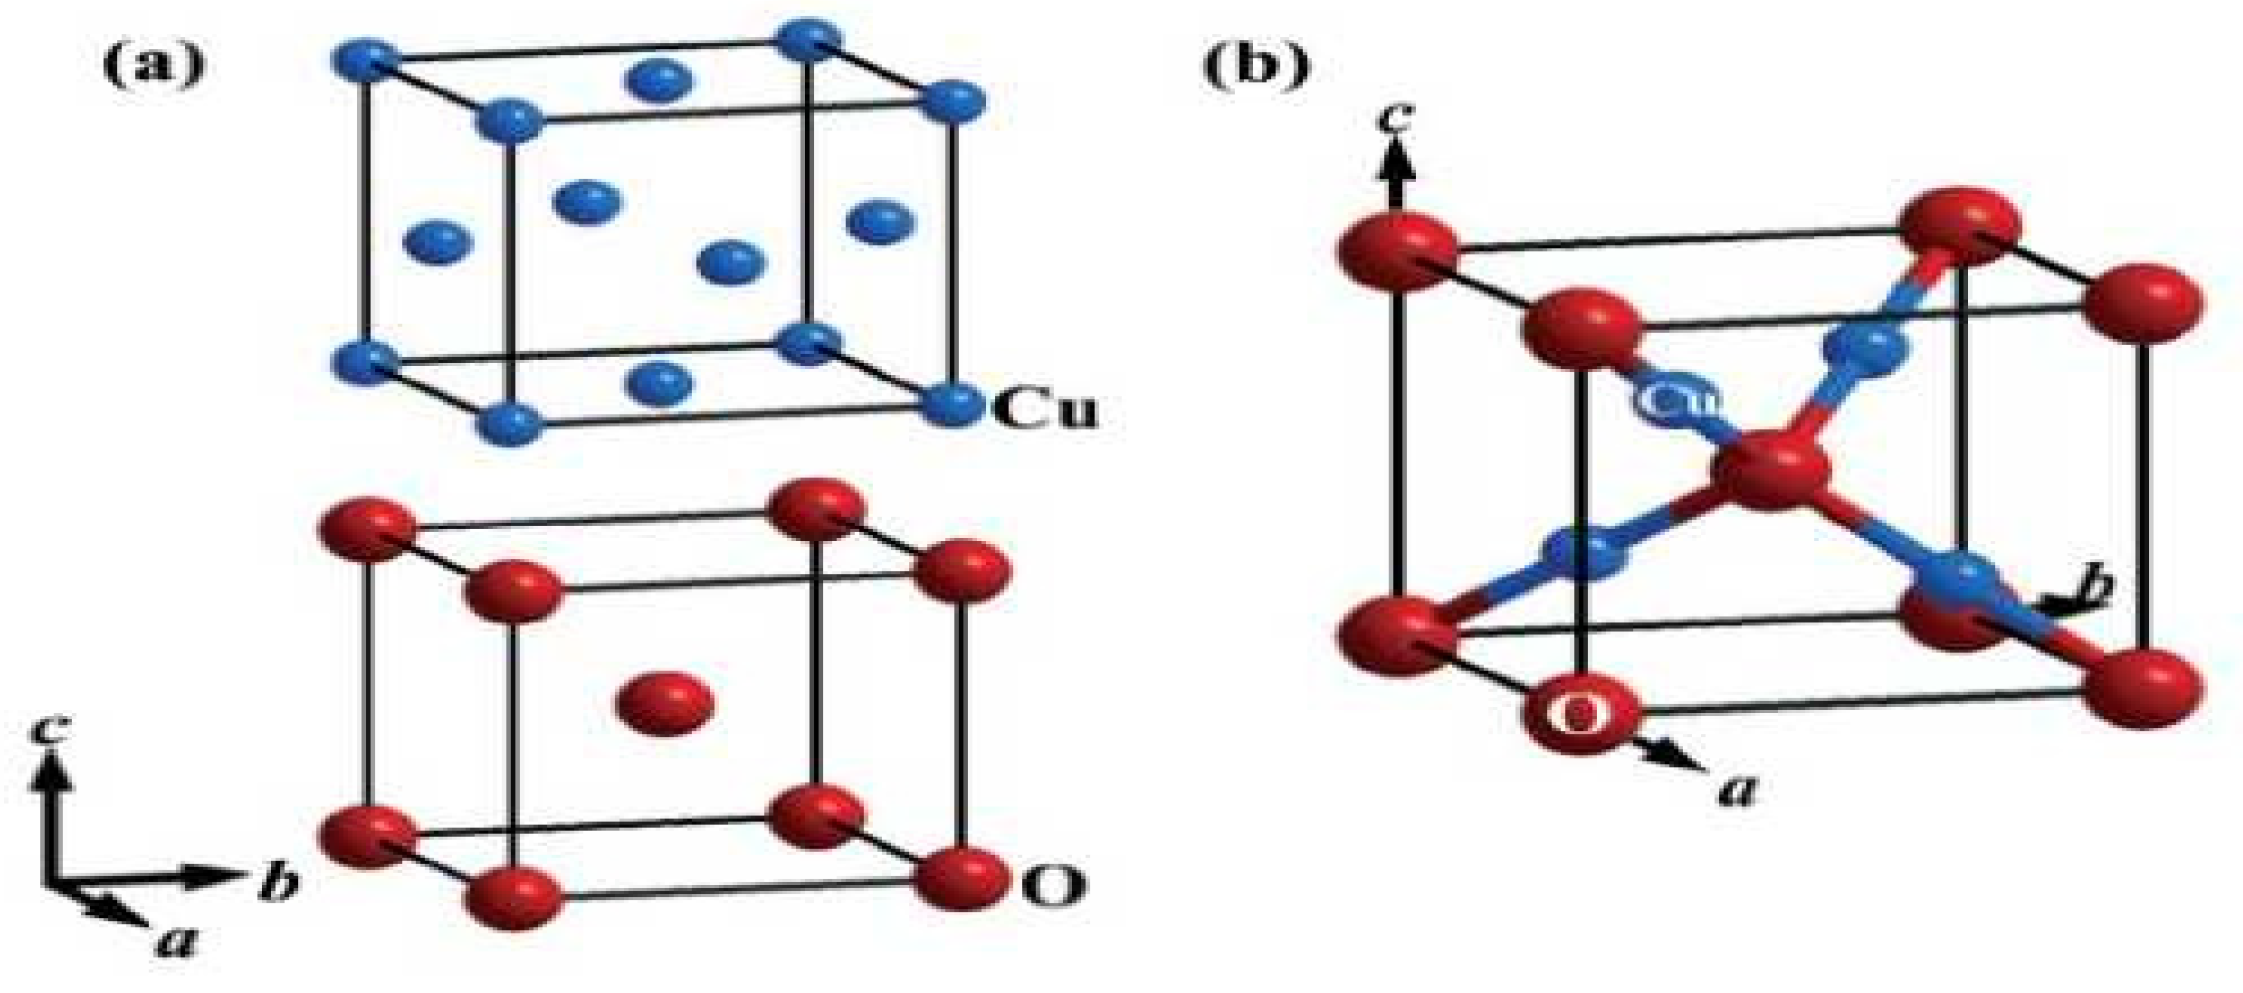
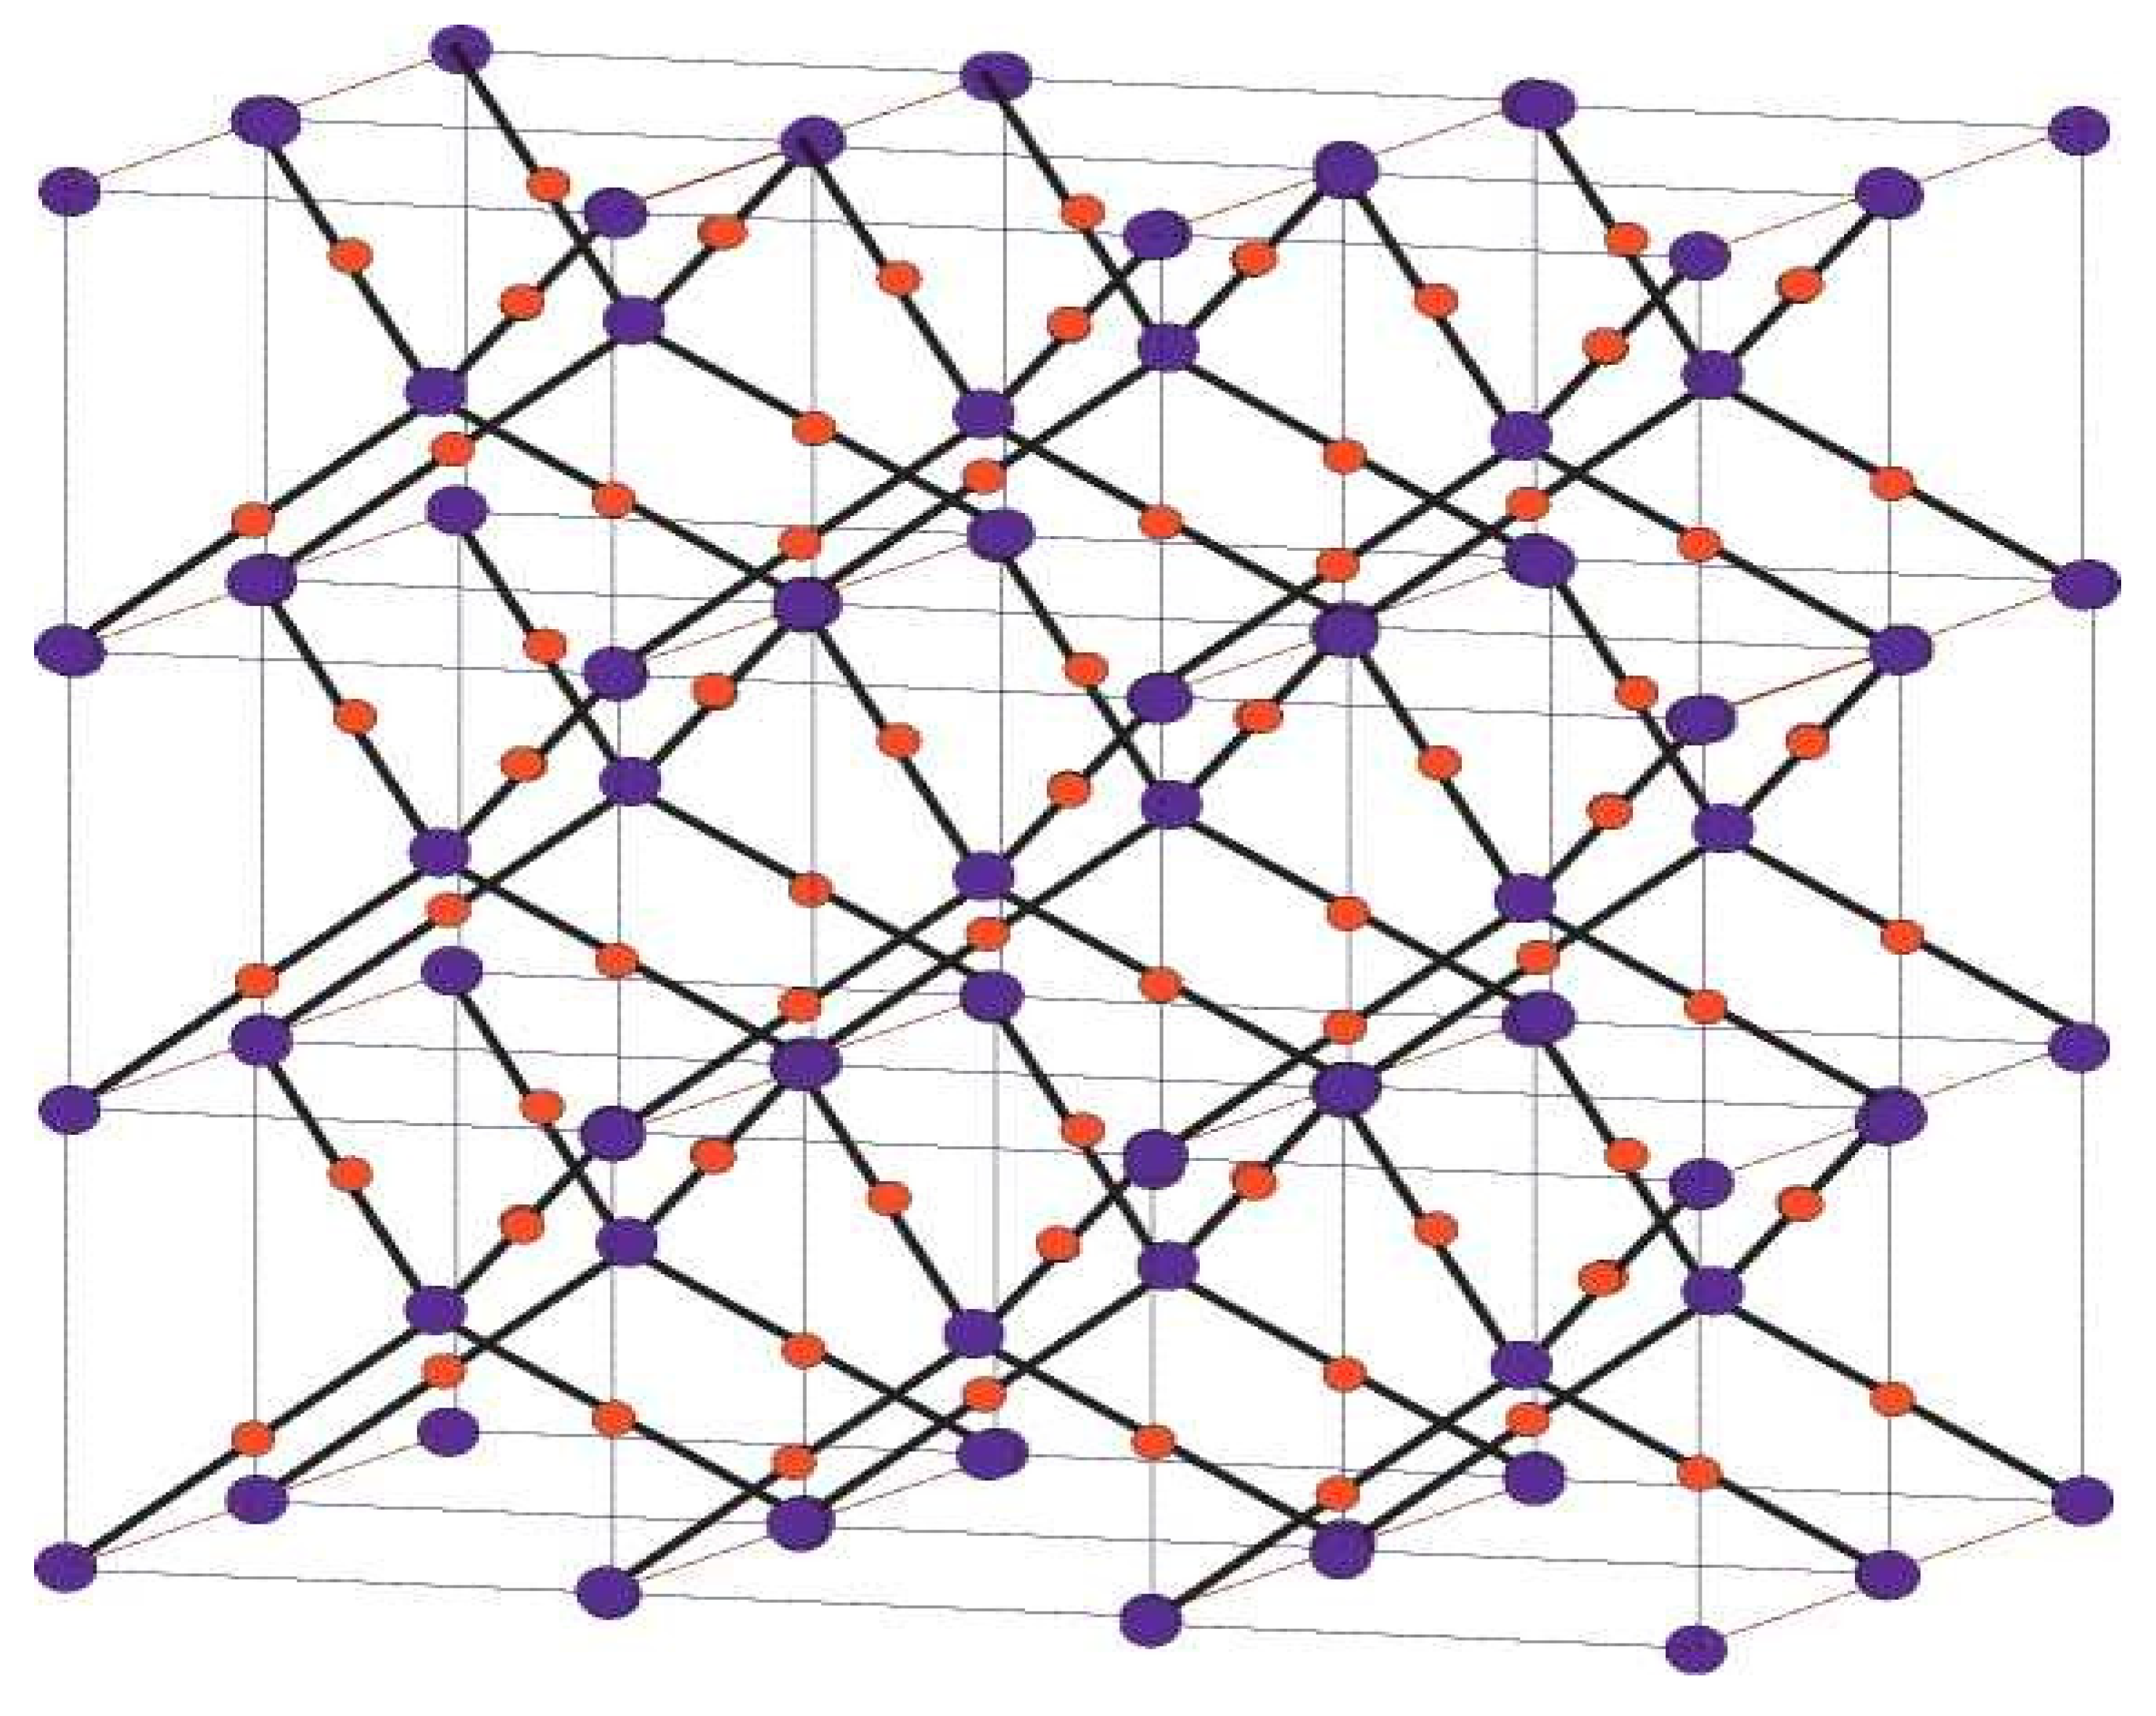
2O mostly center around concoction sensors, sun-oriented cells, photocatalysis, lithium-particle batteries, and catalysis. The concoction chart of the crystallographic structure of Cu
2O is depicted in
Figure 1 and
Figure 2. For more data about this structure, see [
3,
22].
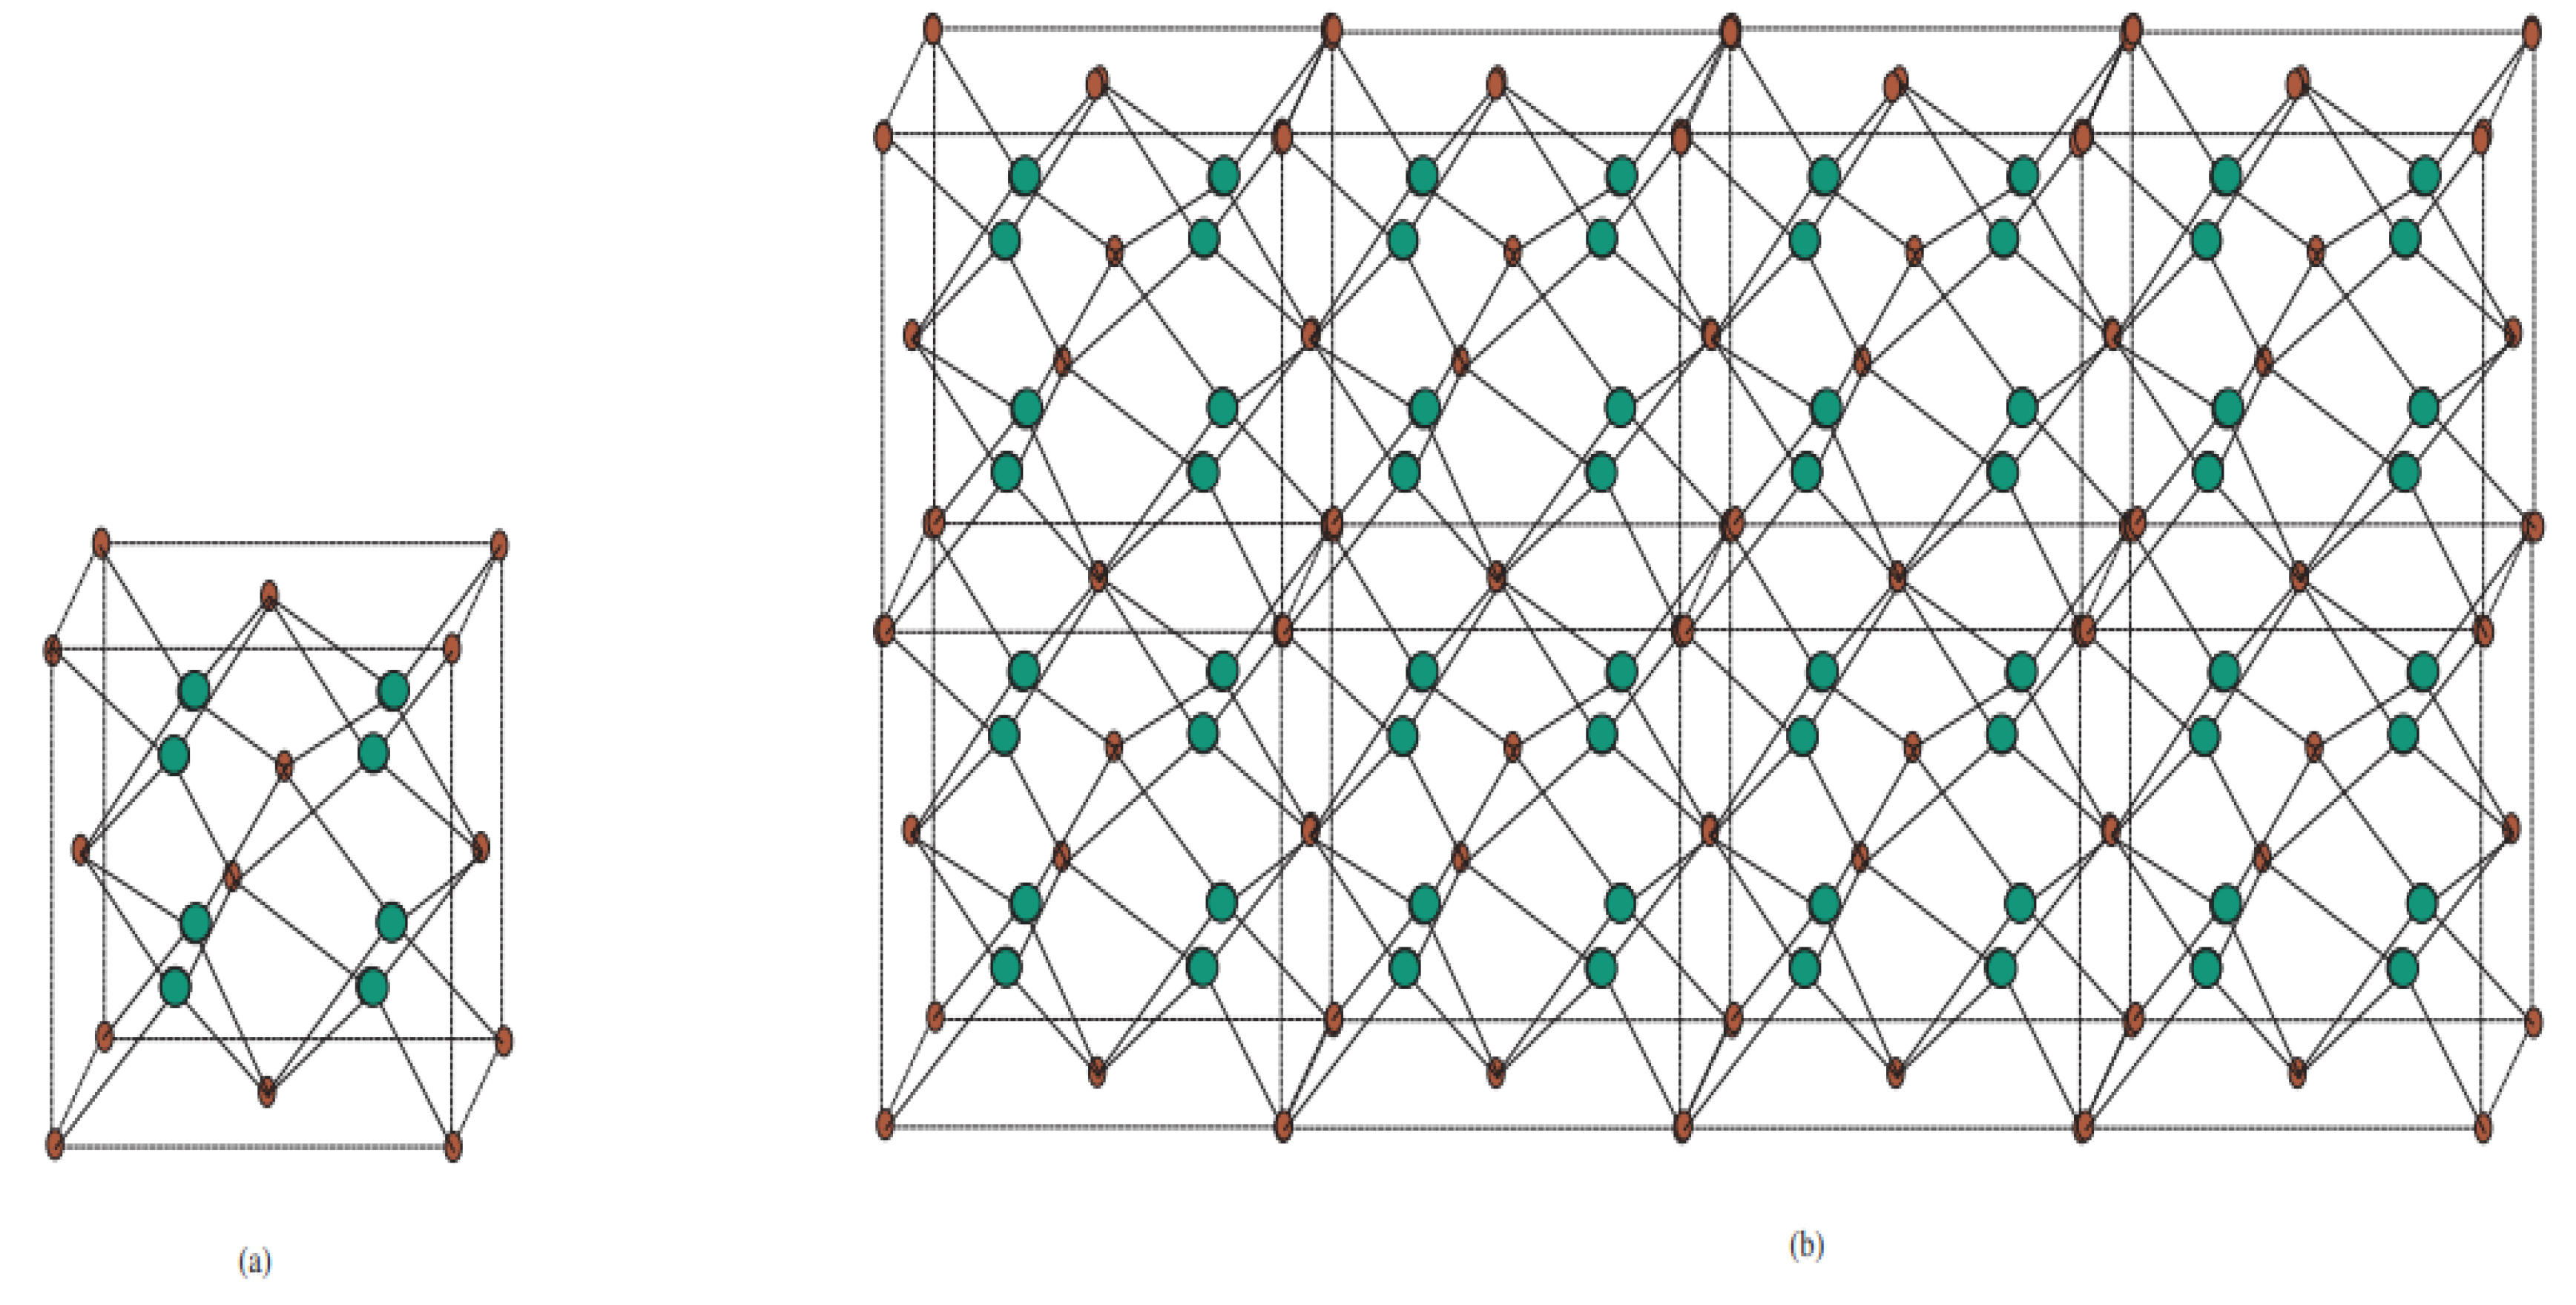
4. Crystal Structure of Titanium Difluoride TiF2[m, n, t]
Titanium difluoride is a water-insoluble titanium hotspot used in oxygen-sensitive applications such as metal creation. Fluoride mixes have various applications in current innovations and science, from oil refining and drawing to engineered natural science and the assembly of pharmaceuticals. The substance chart of the precious stone structure of titanium difluoride TiF
2[
m,
n,
t] is depicted in
Figure 5. For more subtleties, see [
12,
20].
5. Comparisons and Discussion
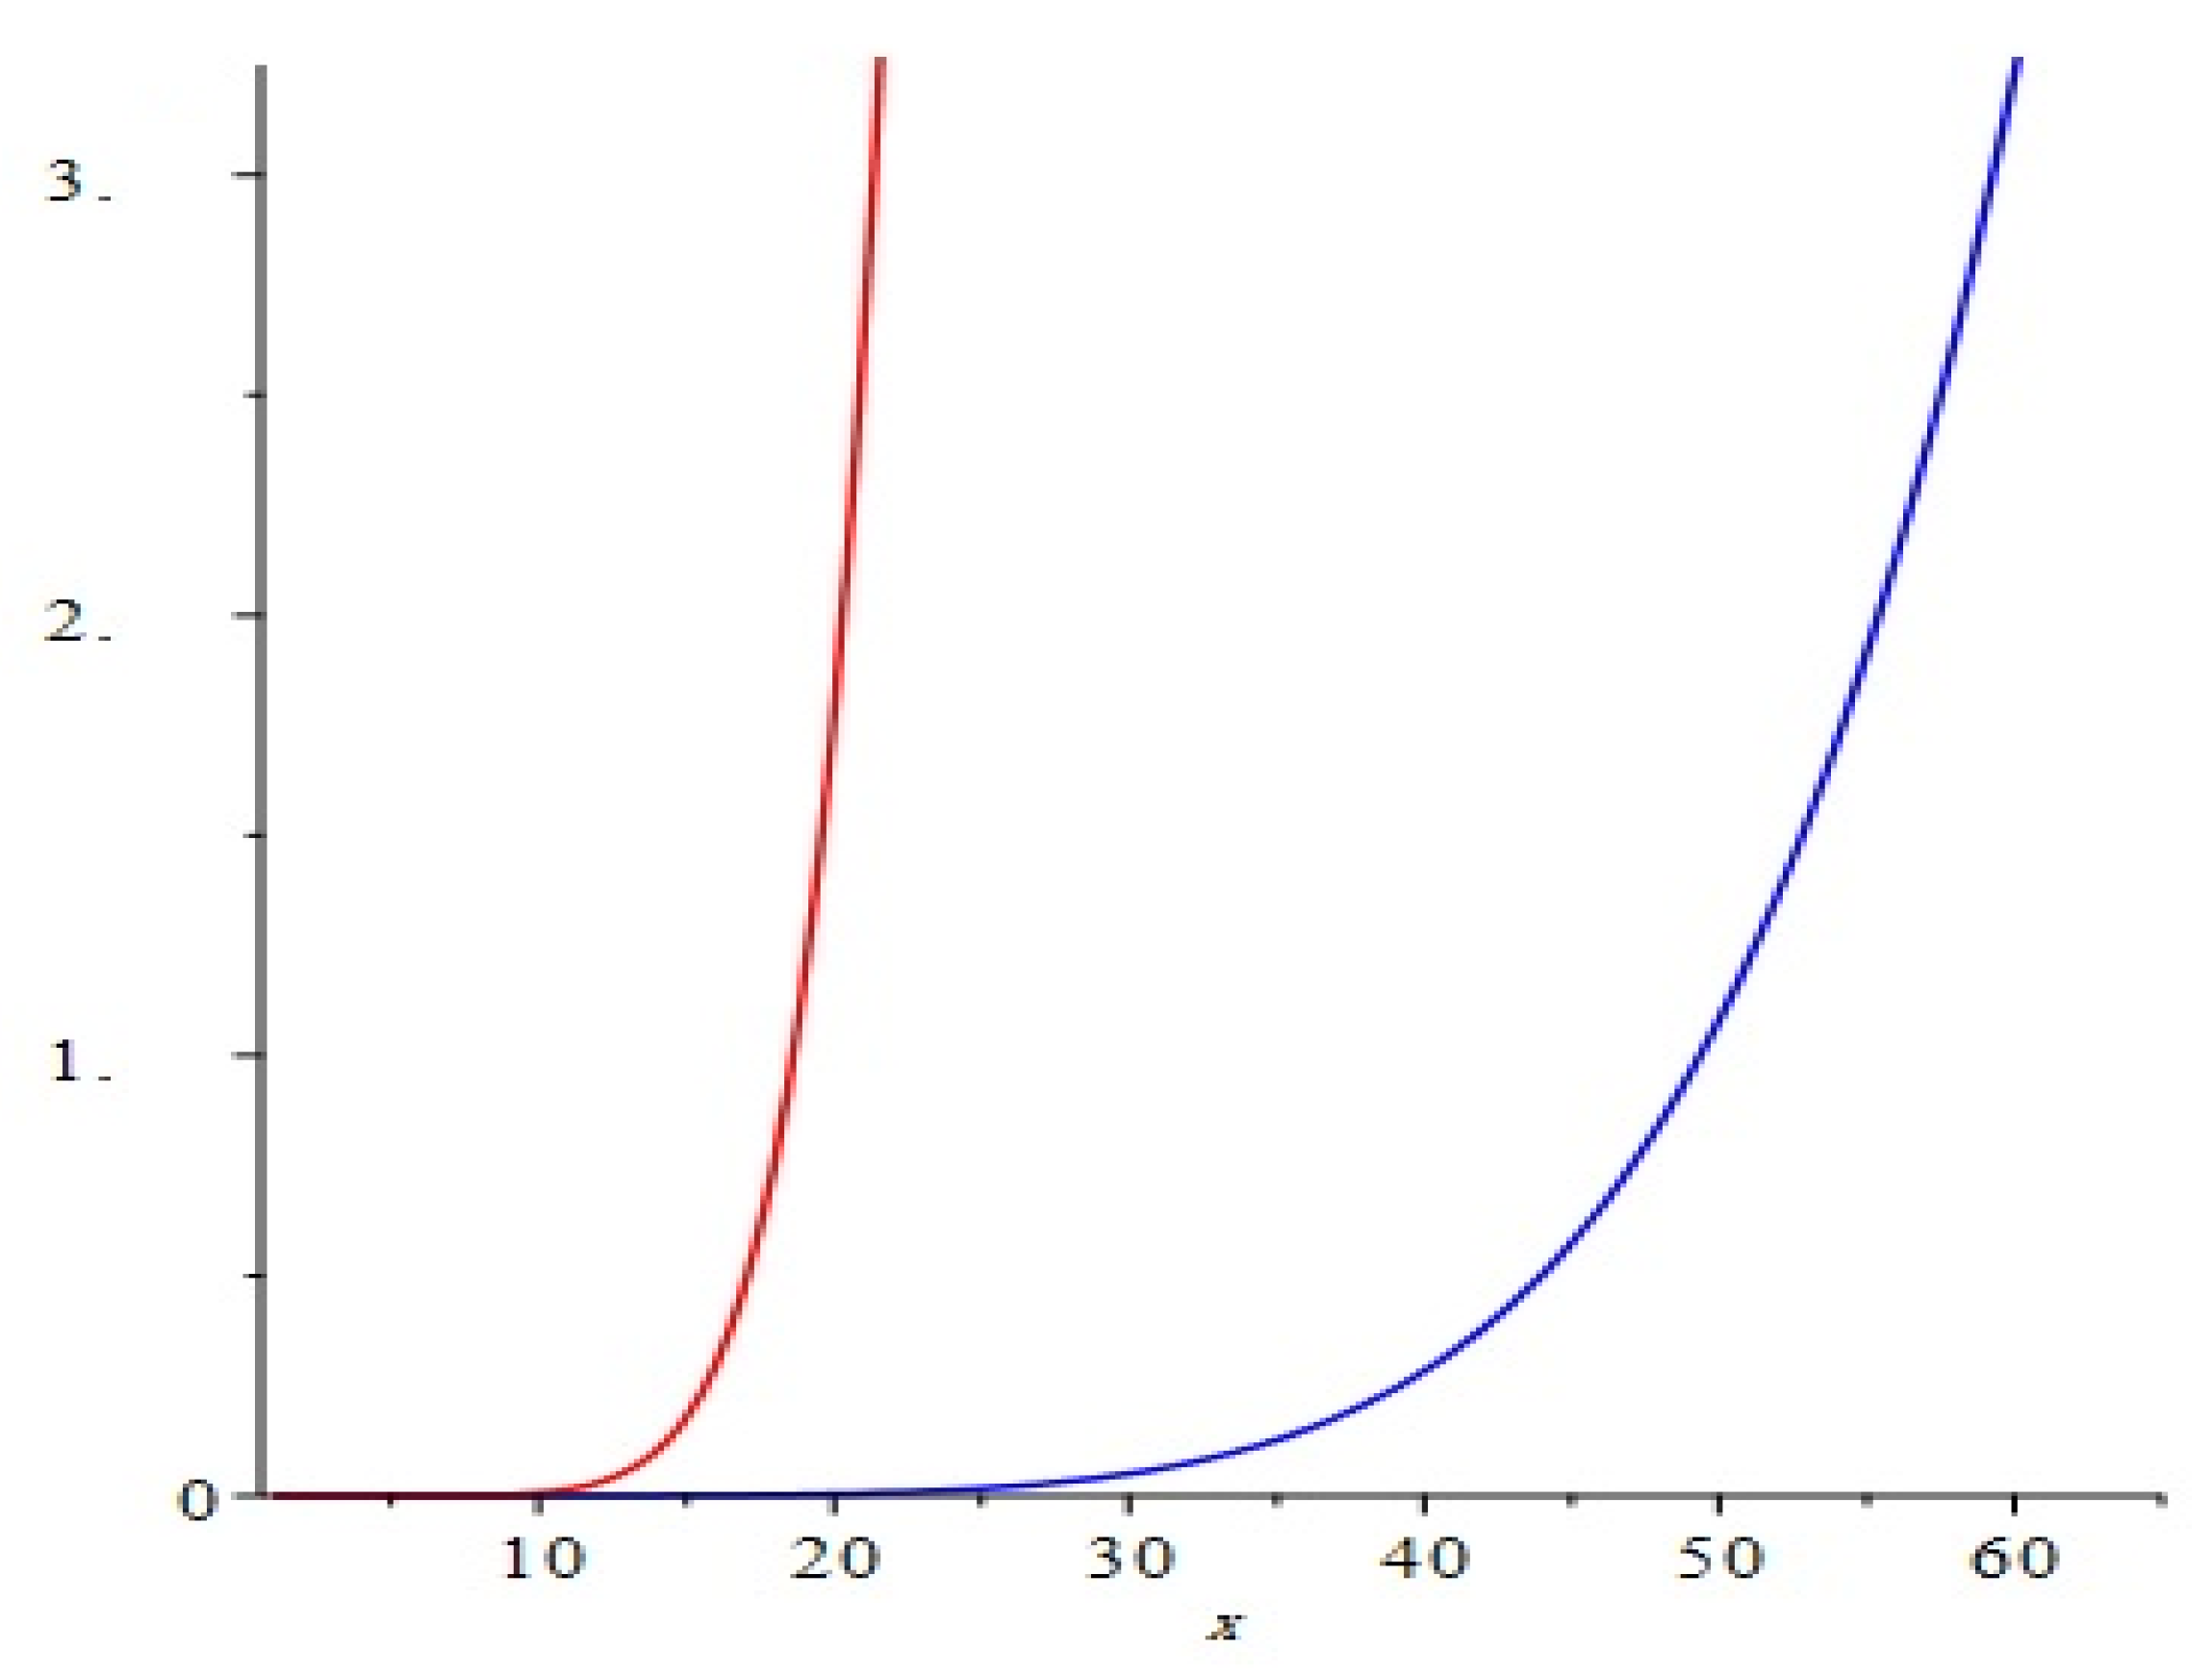
The examination of the first and second various Zagreb lists and Zagreb polynomials of Cu2O[m, n, t] are graphical portrayals, in Figure 4, that can be used for specific estimations of m, n, and t. By fluctuating the estimation of m, n, and t in the given area, the principal, second various Zagreb files and Zagreb polynomials carried on in an unexpected way.
The correlation of the first and second various Zagreb files and Zagreb polynomials of TiF
2[
m,
n,
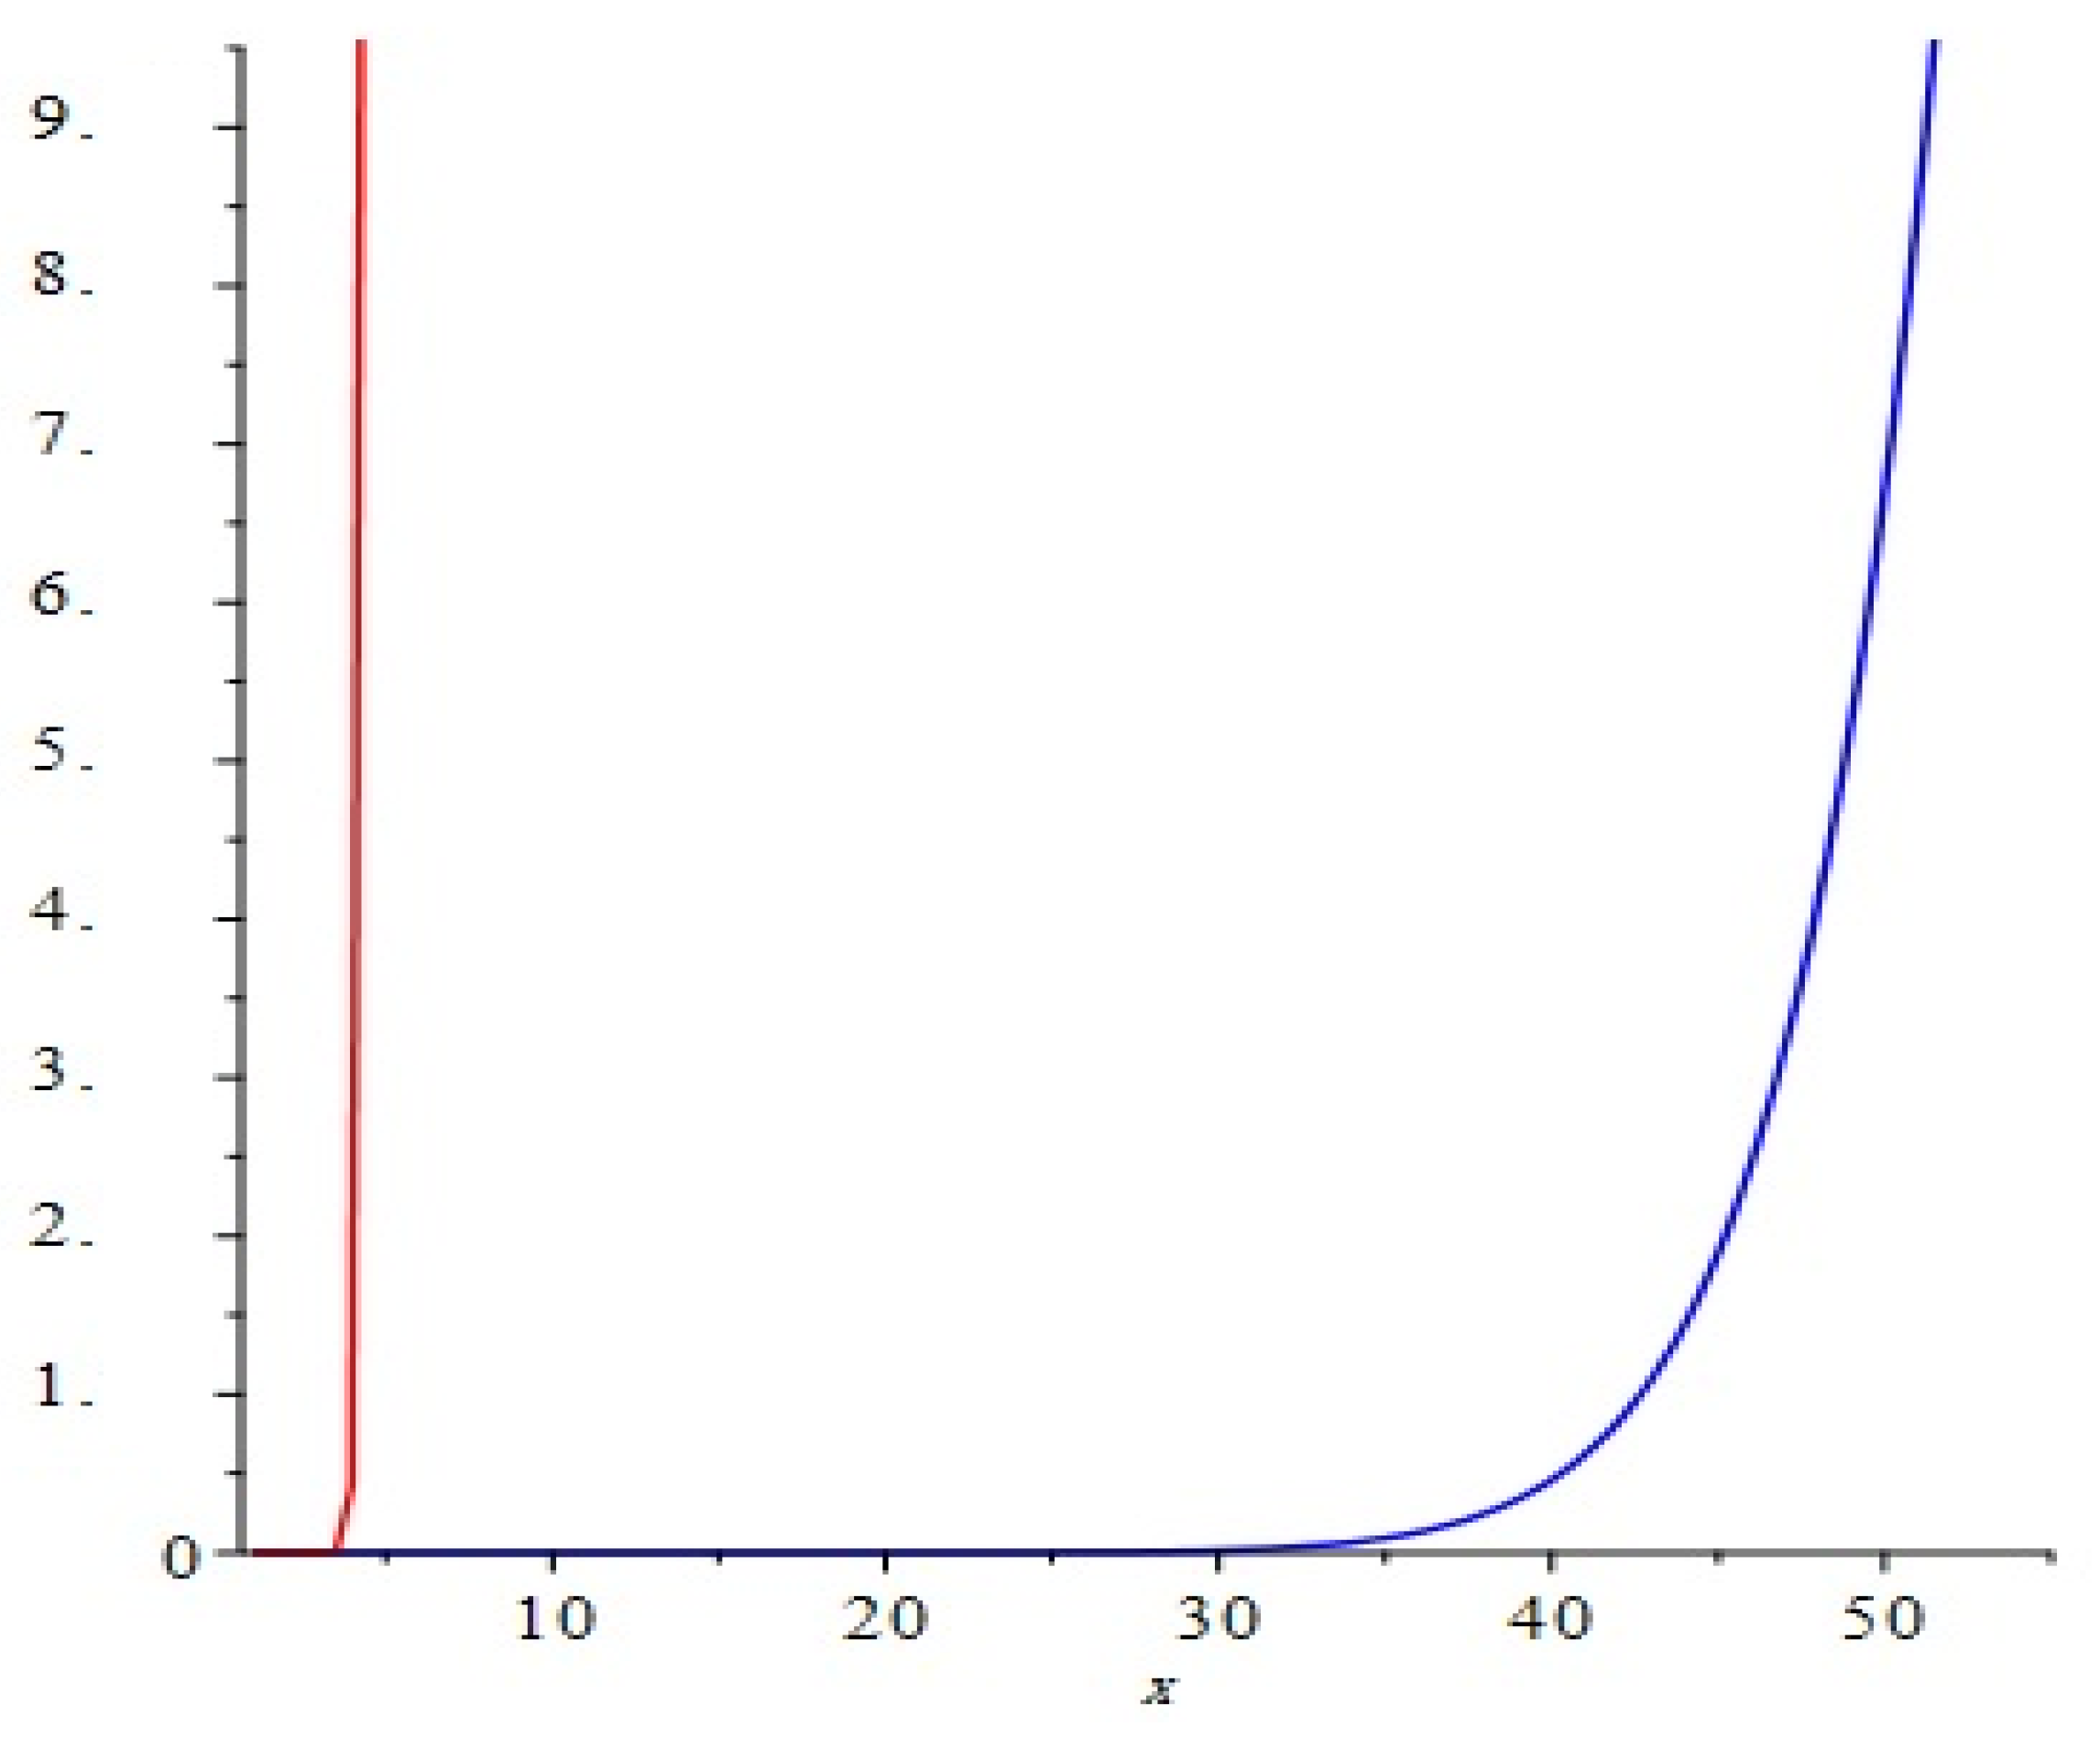
t] are graphical portrayals in
Figure 7 for specific estimations of
m,
n, and
t. By changing the estimations of
m,
n, and
t in the given space, the primary, second numerous Zagreb lists and Zagreb polynomials carried on in an unexpected way.
Since the first and second Zagreb records were found to occur for calculations of the absolute π electron vitality of the atoms, on account of Cu2O[m, n, t] and TiF2[m, n, t], their qualities gave complete π electron vitality in expanding the request for higher estimations of m, n, and t.
6. Conclusions
In this paper, we dealt with titanium difluoride (TiF2) and the crystallographic structure of Cu2O, and studied their topological indices. We determined the hyper-Zagreb index, first multiple Zagreb index, second multiple Zagreb index, and Zagreb polynomials for titanium difluoride, as well as the crystallographic structure of Cu2O. Additionally, by using MATLAB, we plotted these computed results numerically and discussed their behavior regarding their monotonicity.
Author Contributions
H.Y. contributed in conceptualization, designing the experiments and funding. M.K.S. conceived and designed the experiments, and analyzed the data. M.H.M. and M.A.R. performed experiments and some computations. S.A. and M.N. contributed to methodology, software, and validation, and wrote the initial draft of the paper, which were validated and approved by M.K.S., and wrote the final draft. All authors read and approved the final version of the paper.
Funding
This work was supported by the Soft Scientific Research of Sichuan Province under grant 2018ZR0265, Sichuan Military and Civilian Integration Strategy Research Center under grant JMRH-1818, and Sichuan Provincial Department of Education (Key Project) under grant 18ZA0118.
Acknowledgments
The authors are grateful to the anonymous referees for their valuable comments and suggestions that improved this paper.
Conflicts of Interest
The authors declare no conflicts of interest.
References
- Gutman, I.; Polansky, O.E. Mathematical Concepts in Organic Chemistry; Springer: New York, NY, USA, 1986. [Google Scholar]
- Wiener, H. Structural determination of paraffin boiling points. J. Am. Chem. Soc. 1947, 69, 17–20. [Google Scholar] [CrossRef] [PubMed]
- Dobrynin, A.A.; Entringer, R.; Gutman, I. Wiener index of trees: Theory and applications. Acta Appl. Math. 2001, 66, 211–249. [Google Scholar] [CrossRef]
- Shirdel, G.H.; RezaPour, H.; Sayadi, A.M. The Hyper-Zagreb Index of Graph Operations. Iran. J. Math. Chem. 2013, 4, 213–220. [Google Scholar]
- Ghorbaniand, M.; Azimi, N. Note on multiple Zagreb indices. Iran. J. Math. Chem. 2012, 3, 137–143. [Google Scholar]
- Gutman, I.; Das, K.C. Some Properties of the Second Zagreb Index. Match Commun. Math. Comput. Chem. 2004, 50, 103–112. [Google Scholar]
- Deza, M.; Fowler, P.W.; Rassat, A.; Rogers, K.M. Fullerenes as tilings of surfaces. J. Chem. Inf. Comput. Sci. 2000, 40, 550–558. [Google Scholar] [CrossRef]
- Eliasi, M.; Iranmanesh, A.; Gutman, I. Multiplicative version of first Zagreb index. Match Commun. Math. Comput. Chem. 2012, 68, 217–230. [Google Scholar]
- Furtula, B.; Gutman, I.; Dehmer, M. On structure-sensitivity of degree-based topological indices. Appl. Math. Comput. 2013, 219, 8973–8978. [Google Scholar] [CrossRef]
- Gao, W.; Siddiqui, M.K.; Imran, M.; Jamil, M.K.; Farahani, M.R. Forgotten Topological Index of Chemical Structure in Drugs. Saudi Pharm. J. 2016, 24, 258–267. [Google Scholar] [CrossRef]
- Gao, W.; Siddiqui, M.K. Molecular Descriptors of Nanotube, Oxide, Silicate, and Triangulene Networks. J. Chem. 2017, 2017, 1–10. [Google Scholar] [CrossRef]
- Gharibi, W.; Ahmad, A.; Siddiqui, M.K. On Zagreb Indices, Zagreb Polynomials of Nanocone and Nanotubes. J. Comput. Nanosci. 2016, 13, 5086–5092. [Google Scholar] [CrossRef]
- Gutman, I. Degree-based topological indices. Croat. Chem. Acta. 2013, 86, 351–361. [Google Scholar] [CrossRef]
- Shao, Z.; Amjadi, J.S.; Sheikholeslami, M.; Valinavaz, M. On the Total Double Roman Domination. IEEE Access 2019, 7, 52035–52041. [Google Scholar] [CrossRef]
- Gao, Y.; Zhu, E.; Shao, Z.; Gutman, I.; Klobucar, A. Total domination and open packing in some chemical graphs. J. Math. Chem. 2018, 5, 1481–1492. [Google Scholar] [CrossRef]
- Shao, Z.; Liang, M.; Xu, X. Some new optimal generalized Sidon sequences. Ars Comb 2012, 107, 369–378. [Google Scholar]
- Shao, Z.; Siddiqui, M.K.; Muhammad, M.K. Computing zagreb indices and zagreb polynomials for symmetrical nanotubes. Symmetry 2018, 10, 244. [Google Scholar] [CrossRef]
- Wang, S.; Shao, Z.; Liu, J.B.; Wei, B. The Bounds of Vertex Padmakar–Ivan Index on k-Trees. Mathematics 2019, 7, 324. [Google Scholar] [CrossRef]
- Kadela, M. Model of multiple-layer pavement structure-subsoil system. Bull. Pol. Acad. Sci. Tech. Sci. 2016, 64, 112–118. [Google Scholar] [CrossRef][Green Version]
- Liu, J.B.; Siddiqui, M.K.; Zahid, M.A.; Naeem, M.; Baig, A.Q. Topological Properties of Crystallographic Structure of Molecules. Symmetry 2018, 10, 265. [Google Scholar] [CrossRef]
- Rada, J.; Cruz, R.; Gutman, I. Benzenoid systems with extremal vertex-degree-based topological indices. Match Commun. Math. Comput. Chem. 2014, 72, 125–136. [Google Scholar]
- Shao, Z.; Wu, P.; Zhang, X.; Dimitrov, D.; Liu, J.B. On the maximum ABC index of graphs with prescribed size and without pendent vertices. IEEE Access 2018, 6, 604–616. [Google Scholar] [CrossRef]
- Siddiqui, M.K.; Imran, M.; Ali, A. On Zagreb indices, Zagreb polynomials of some nanostar dendrimers. Appl. Math. Comput. 2016, 280, 132–139. [Google Scholar] [CrossRef]
- Siddiqui, M.K.; Gharibi, W. On Zagreb Indices, Zagreb Polynomials of Mesh Derived Networks. J. Comput. Nanosci. 2016, 13, 8683–8688. [Google Scholar] [CrossRef]
- Siddiqui, M.K.; Naeem, M.; Rahman, N.A.; Imran, M. Computing topological indices of certain networks. J. Optoelectron. Adv. Mater. 2016, 18, 884–892. [Google Scholar]
- Shao, Z.; Wu, P.; Gao, Y.; Gutman, I.; Zhang, X. On the maximum ABC index of graphs without pendent vertices. Appl. Math. Comput. 2017, 315, 298–312. [Google Scholar] [CrossRef]
Figure 1.
Crystallographic structure of Cu2O. (a) Structural attributes of Cu and O particles in the Cu2O cross section. The Cu2O cross section is shaped by interpenetrating the Cu and O grids with one another. (b) Unit cell of Cu2O. Copper particles appear as small blue circles, and oxygen iotas appear as large red circles. In the Cu2O cross section, every Cu iota is composed of two O particles, and every O molecule is facilitated by four Cu iotas.
Figure 2.
Crystallographic structure of Cu2O [3, 2, 3].
Figure 2.
Crystallographic structure of Cu2O [3, 2, 3].
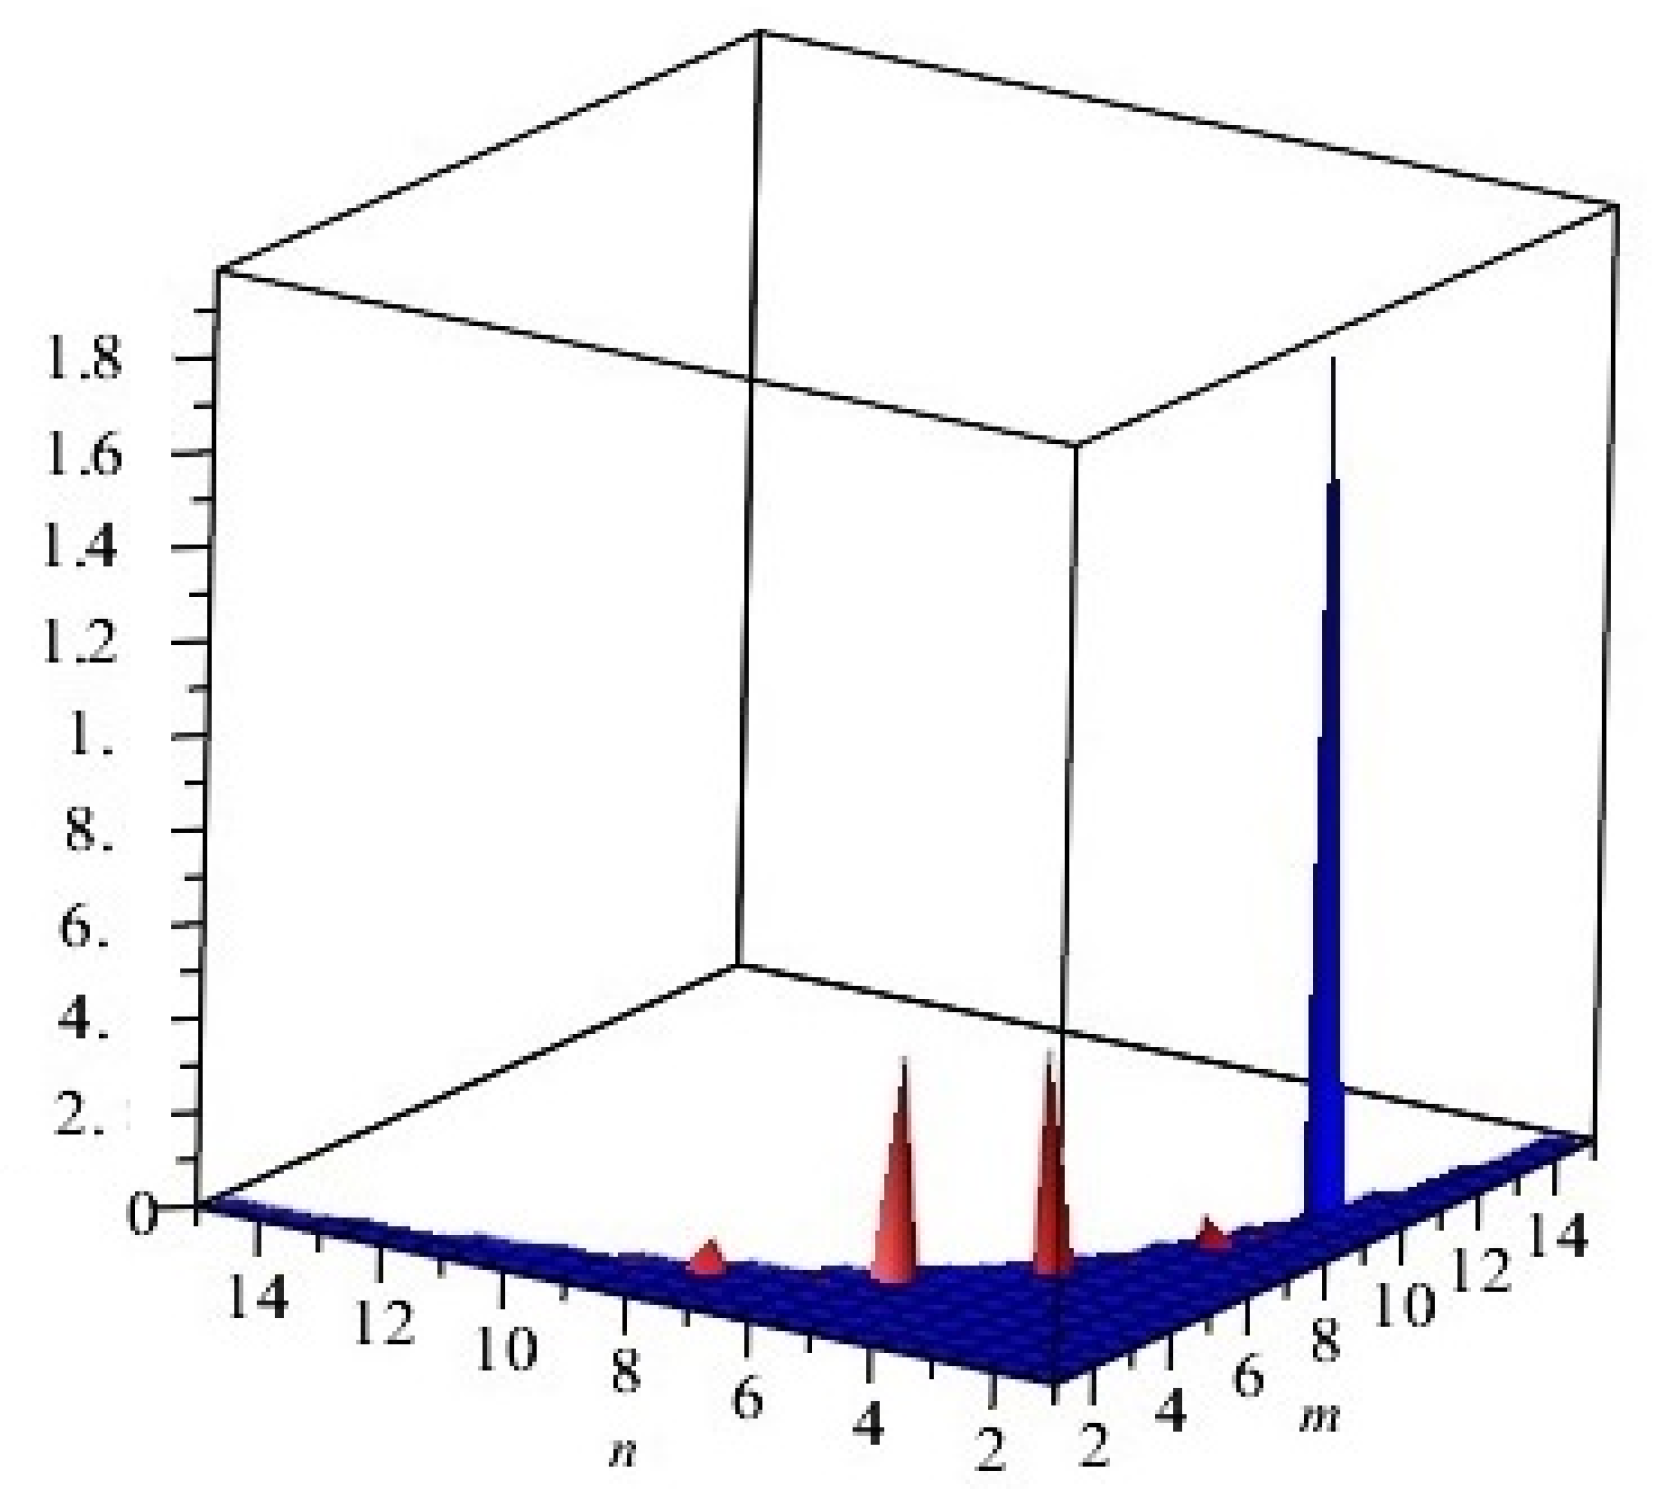
Figure 3.
First and second multiplicative Zagreb indices PM1(G) and PM2(G) of G, equivalent to Cu2O[m, n, t] for t = 2. Blue and red colors represent PM1(G) and PM2(G), respectively.
Figure 3.
First and second multiplicative Zagreb indices PM1(G) and PM2(G) of G, equivalent to Cu2O[m, n, t] for t = 2. Blue and red colors represent PM1(G) and PM2(G), respectively.
Figure 4.
Comparison of the first and second Zagreb polynomials M1(G, x) and M2(G, x) of G = Cu2O[m, n, t] for t = 10 = m = n. Blue and red lines represent M1(G, x) and M2(G, x), respectively. M2(G, x) is shown to grow more rapidly than M1(G, x).
Figure 4.
Comparison of the first and second Zagreb polynomials M1(G, x) and M2(G, x) of G = Cu2O[m, n, t] for t = 10 = m = n. Blue and red lines represent M1(G, x) and M2(G, x), respectively. M2(G, x) is shown to grow more rapidly than M1(G, x).
Figure 5.
Crystal structure titanium difluoride TiF2[m, n, t]. (a) Unit cell of TiF2[m, n, t] with Ti atoms in red and F atoms in green. (b) Crystal structure of TiF2[4, 1, 2].
Figure 5.
Crystal structure titanium difluoride TiF2[m, n, t]. (a) Unit cell of TiF2[m, n, t] with Ti atoms in red and F atoms in green. (b) Crystal structure of TiF2[4, 1, 2].
Figure 6.
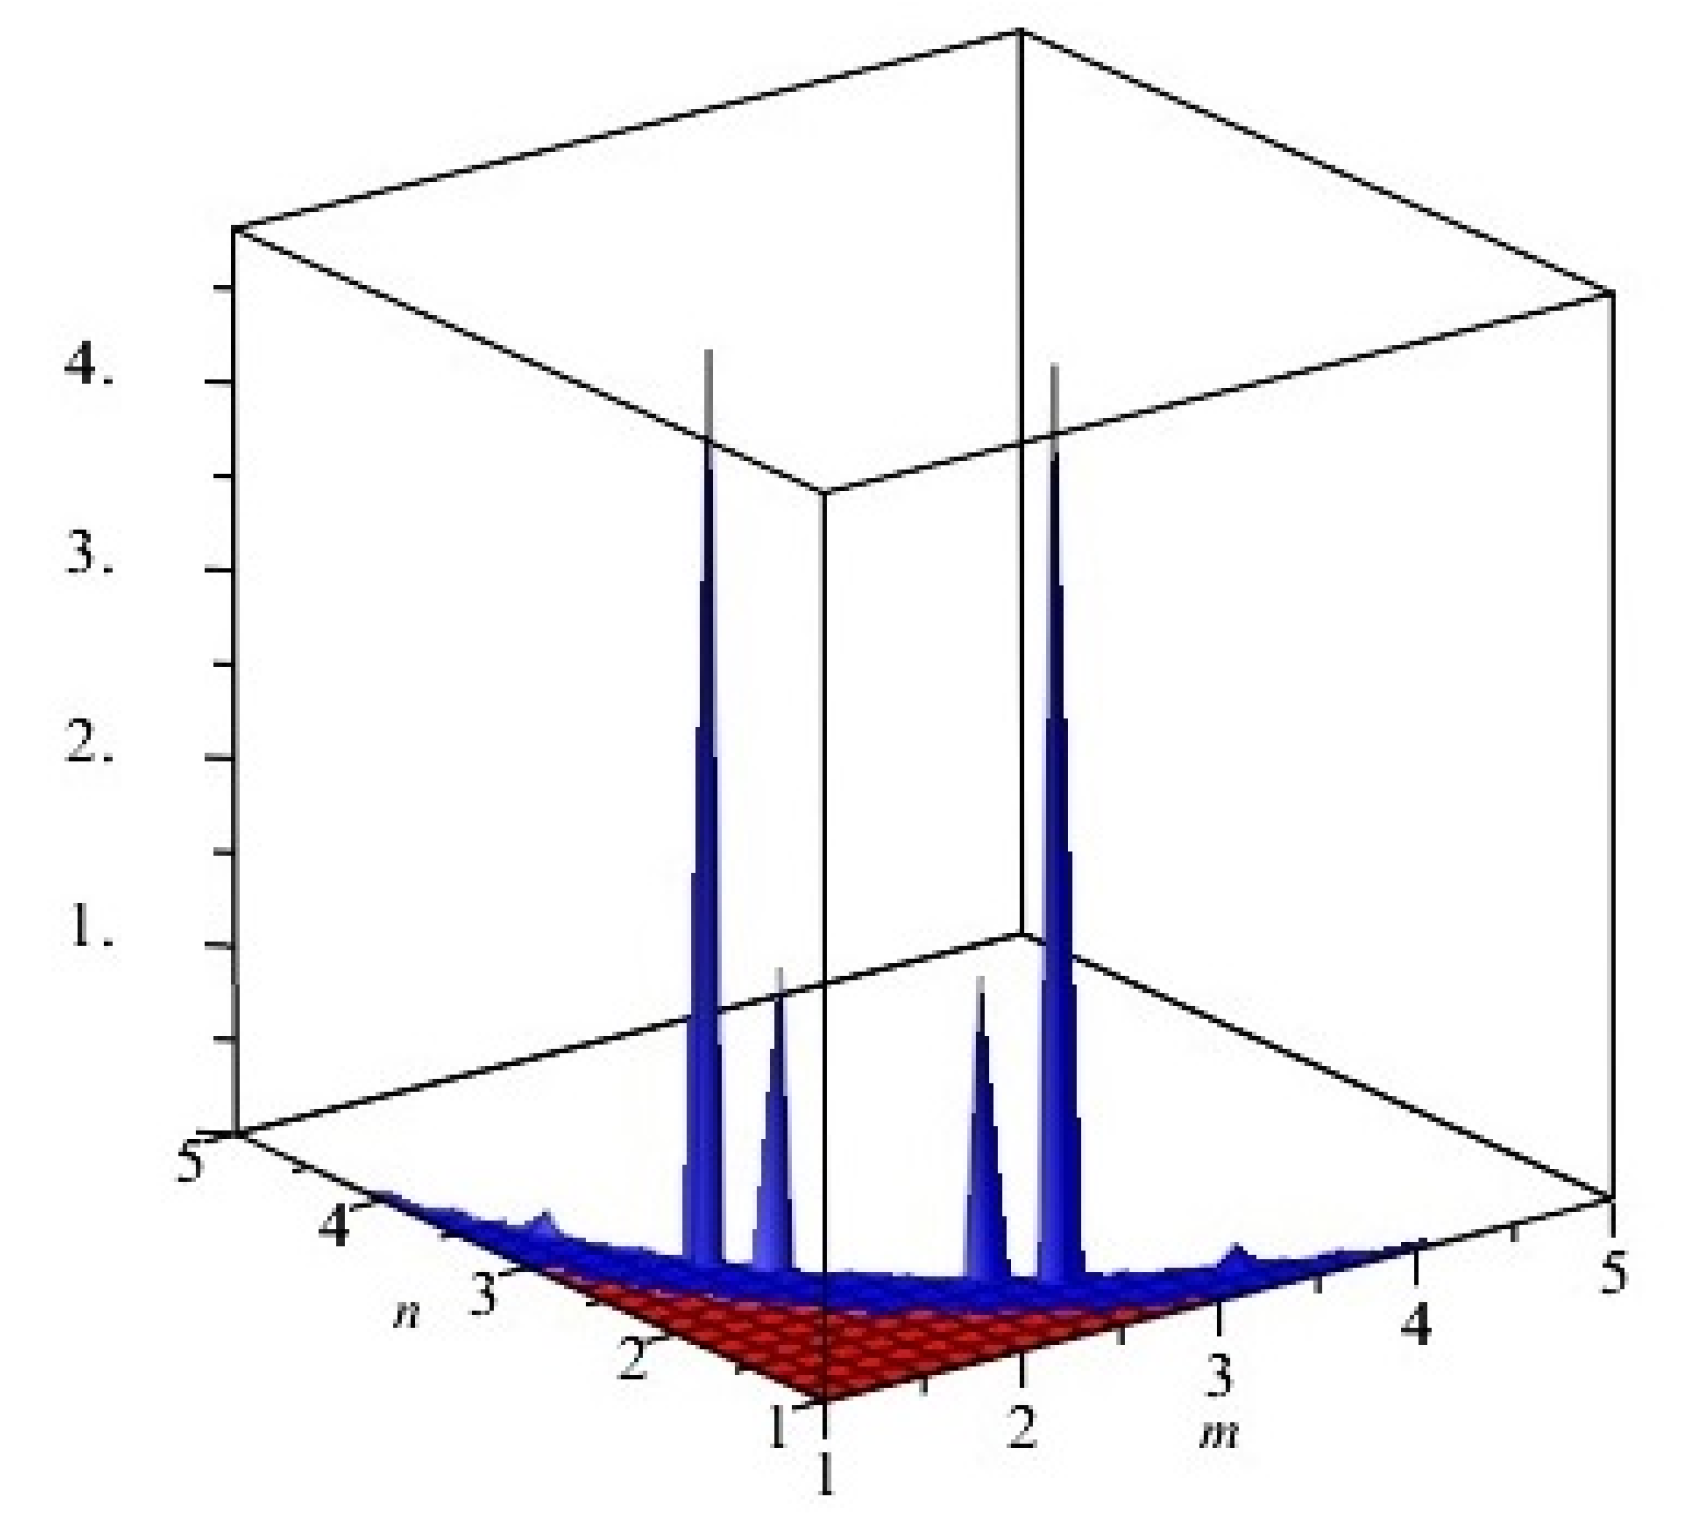
First and second multiplicative Zagreb indices PM1(G) and PM2(G) of G, equivalent to TiF2[m, n, t] for t = 2. The blue and red colors represent PM1(G) and PM2(G), respectively. We can see that, in the given domain, PM1(G) is more dominant than PM2(G).
Figure 6.
First and second multiplicative Zagreb indices PM1(G) and PM2(G) of G, equivalent to TiF2[m, n, t] for t = 2. The blue and red colors represent PM1(G) and PM2(G), respectively. We can see that, in the given domain, PM1(G) is more dominant than PM2(G).
Figure 7.
Comparison of the first and second Zagreb polynomials M1(G, x) and M2(G, x) of G = TiF2[m, n, t], for t = 10 = m = n. The blue and red represent M1(G, x) and M2(G, x), respectively. We can see that M2(G, x) grows more rapidly than M1(G, x).
Figure 7.
Comparison of the first and second Zagreb polynomials M1(G, x) and M2(G, x) of G = TiF2[m, n, t], for t = 10 = m = n. The blue and red represent M1(G, x) and M2(G, x), respectively. We can see that M2(G, x) grows more rapidly than M1(G, x).
Table 1.
Edge partition of Cu2O[rn, n, t] based on the degrees of the end vertices of each edge.
Table 1.
Edge partition of Cu2O[rn, n, t] based on the degrees of the end vertices of each edge.
| Number of edges | 4n + 4m + 4t − 8 | 4nm + 4nt + 4mt − 8n − 8m − 8t + 12 | 4(2nmt − nm − nt − mt + n + m + t − 1) |
| Set of Edges | E1 | E2 | E3 |
Table 2.
Edge partition of TiF2[m, n, t] based on the degrees of end vertices of each edge.
Table 2.
Edge partition of TiF2[m, n, t] based on the degrees of end vertices of each edge.
| Number of edges | 8 | 8(m + n + t − 3) | 16(mn + mt + nt) − 16(m + n + t) + 24 | 32mnt − 16(mt + mn + nt) + 8(m + n + t) − 8 |
|---|
| Set of Edges | E1 | E2 | | E3 |
© 2019 by the authors. Licensee MDPI, Basel, Switzerland. This article is an open access article distributed under the terms and conditions of the Creative Commons Attribution (CC BY) license (http://creativecommons.org/licenses/by/4.0/).
