Article

An Isotopic Ratio Outlier Analysis Approach for Global Metabolomics of Biosynthetically Talented Actinomycetes

1
Chemistry Department, University of North Florida, Jacksonville, FL 32224, USA
2
IROA Technologies, Ann Arbor, MI 48105, USA
*
Author to whom correspondence should be addressed.
Metabolites 2019, 9(9), 181; https://doi.org/10.3390/metabo9090181
Submission received: 1 September 2019 / Accepted: 4 September 2019 / Published: 10 September 2019
(This article belongs to the Special Issue Natural Products Metabolomics)

Abstract

:
Actinomycetes are powerhouses of natural product biosynthesis. Full realization of this biosynthetic potential requires approaches for recognizing novel metabolites and determining mediators of metabolite production. Herein, we develop an isotopic ratio outlier analysis (IROA) ultra-high performance liquid chromatography-mass spectrometry (UHPLC/MS) global metabolomics strategy for actinomycetes that facilitates recognition of novel metabolites and evaluation of production mediators. We demonstrate this approach by determining impacts of the iron chelator 2,2′-bipyridyl on the Nocardiopsis dassonvillei metabolome. Experimental and control cultures produced metabolites with isotopic carbon signatures that were distinct from corresponding “standard” culture metabolites, which were used as internal standards for LC/MS. This provided an isotopic MS peak pair for each metabolite, which revealed the number of carbon atoms and relative concentrations of metabolites and distinguished biosynthetic products from artifacts. Principal component analysis (PCA) and random forest (RF) differentiated bipyridyl-treated samples from controls. RF mean decrease accuracy (MDA) values supported perturbation of metabolites from multiple amino acid pathways and novel natural products. Evaluation of bipyridyl impacts on the nocazine/XR334 diketopiperazine (DKP) pathway revealed upregulation of amino acid precursors and downregulation of late stage intermediates and products. These results establish IROA as a tool in the actinomycete natural product chemistry arsenal and support broad metabolic consequences of bipyridyl.

Graphical Abstract

1. Introduction

Bacteria from the order Actinomycetales, commonly known as actinomycetes, are diverse and widespread across marine, freshwater, and terrestrial habitats [1]. Actinomycetes are prolific producers of small molecules, accounting for over 75% of bioactive bacterial natural products identified to date [2]. These structurally diverse metabolites serve as lead compounds for pharmaceutical and agrochemical development [3], inspire organic syntheses [4], mediate intra- and interspecies interactions [5], and provide chemical probes for elucidating mechanisms of biological processes [6].
While actinomycete metabolism has been intensely investigated for over 75 years [2], bioinformatics analyses support that actinomycete genomes encode a treasure trove of biosynthetic pathways with the potential of yielding as-yet unidentified secondary metabolites [7]. The unveiling of these metabolites poses substantial challenges, largely due to the complexity of actinomycete metabolomes [8], limited understanding of pathway regulation and triggers of pathway expression [9], low natural product yields [10], and repeated discovery of known metabolites [11]. These struggles have been tackled by approaches that include supplementation of cultures with small molecules hypothesized to mediate biosynthesis [12,13], co-cultivation of microorganisms to elicit metabolite production [12,14,15,16], heterologous expression of targeted biosynthetic pathways in hosts optimized for secondary metabolism [17,18], and creation of biosynthetic gene elimination mutants to facilitate recognition of metabolites encoded by these genes [18].
A variety of comparative bioactivity [14], gene transcript [12], protein [12], and metabolite profiling techniques [12,19] have been developed to evaluate changes in bacterial secondary metabolic pathway activity in response to experimental treatments. Innovative mass spectrometry (MS)-based metabolomics approaches have demonstrated particular promise in these efforts [8,20,21,22,23]. These approaches include imaging MS to pinpoint producers of novel metabolites during microbial co-cultivation [15,24,25] and liquid chromatography-mass spectrometry principal component analysis (LC/MS-PCA) metabolomics to efficiently prioritize strains with greatest potential for production of novel metabolites and evaluate impacts of co-cultivation [14,16,26,27]. Additionally, LC/MS with molecular networking by tandem MS has facilitated metabolite dereplication and recognition of unique molecular families [28,29].
Challenges of bacterial MS metabolomics include the differentiation of biosynthetic compounds from “red herring” artifacts introduced during chemical extraction or analysis, large numbers of candidate molecular formulae supported by exact mass data, and the need for many replicate samples to achieve statistically significant comparisons of metabolite abundances between experimental groups without use of internal standards [8,20,21,22,23]. Isotopic ratio outlier analysis (IROA) global metabolomics offers potential solutions to these bacterial metabolomics hurdles [30]. IROA LC/MS metabolomics was developed using Caenorhabditis elegans worm models [31,32], and IROA was recently adapted for gas chromatography-mass spectrometry (GC/MS) with Saccharomyces cerevisiae yeast models [33,34]. In these seminal IROA studies, treatment and control organisms were grown in media composed of uniformly 95:5 12C:13C- and 5:95 12C:13C-labeled carbon sources, respectively. Paired treatment and control organisms were pooled prior to chemical extraction and LC/MS or GC/MS. MS revealed an isotopic peak pair for each metabolite found in both treatment and control, and statistical comparison of peak areas between these isotopic partners using an automated pipeline rapidly pinpointed metabolites whose abundance differed between groups.
Using the IROA approach, metabolites were readily distinguished from artifacts based on distinctive isotopic peak pairs exclusive to biosynthetic products. Evaluation of the molecular ion m/z difference between 12C and 13C monoisotopomers readily revealed the number of carbon atoms in each metabolite, dramatically narrowing the number of molecular formulae feasible from exact masses. Further, the pooling of isotopically distinguishable metabolites from control and experimental samples prior to chemical extraction and analysis reduced variability associated with these steps, lowering the number of replicates required for comparison of metabolite abundances. Together, these features suggest the potential of IROA metabolomics as a tool for study of actinomycetes and other rich sources of natural products.
Herein, we establish an IROA UHPLC/MS global metabolomics approach for bacteria by evaluating responses of model actinomycete Nocardiopsis dassonvillei DSM 43111 to the iron chelator 2,2′-bipyridyl. Iron has previously been demonstrated as a mediator of natural product biosynthetic pathway activity in bacteria [35], and supplementation of media with bipyridyl, as a treatment, was previously used in other actinomycetes to emulate competition with iron-chelating bacteria and trigger the production of siderophores [24]. N. dassonvillei features rich secondary metabolic potential, with its genome encoding over a dozen natural product pathways predicted to yield metabolites from classes including polyketides, nonribosomal peptides, siderophores, and terpenoids [36,37]. One of these pathways was previously demonstrated to yield the nocazine/XR334 family of diketopiperazine (DKP) natural products [38], while metabolites corresponding to the other pathways remain cryptic. Our results illustrate the potential of IROA LC/MS metabolomics as a tool in the arsenal for realizing the biosynthetic potential of actinomycetes and highlight broad impacts of bipyridyl on N. dassonvillei metabolism.

2. Results

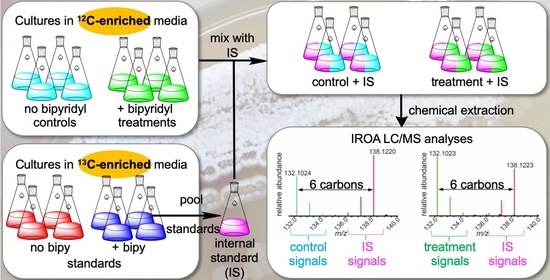
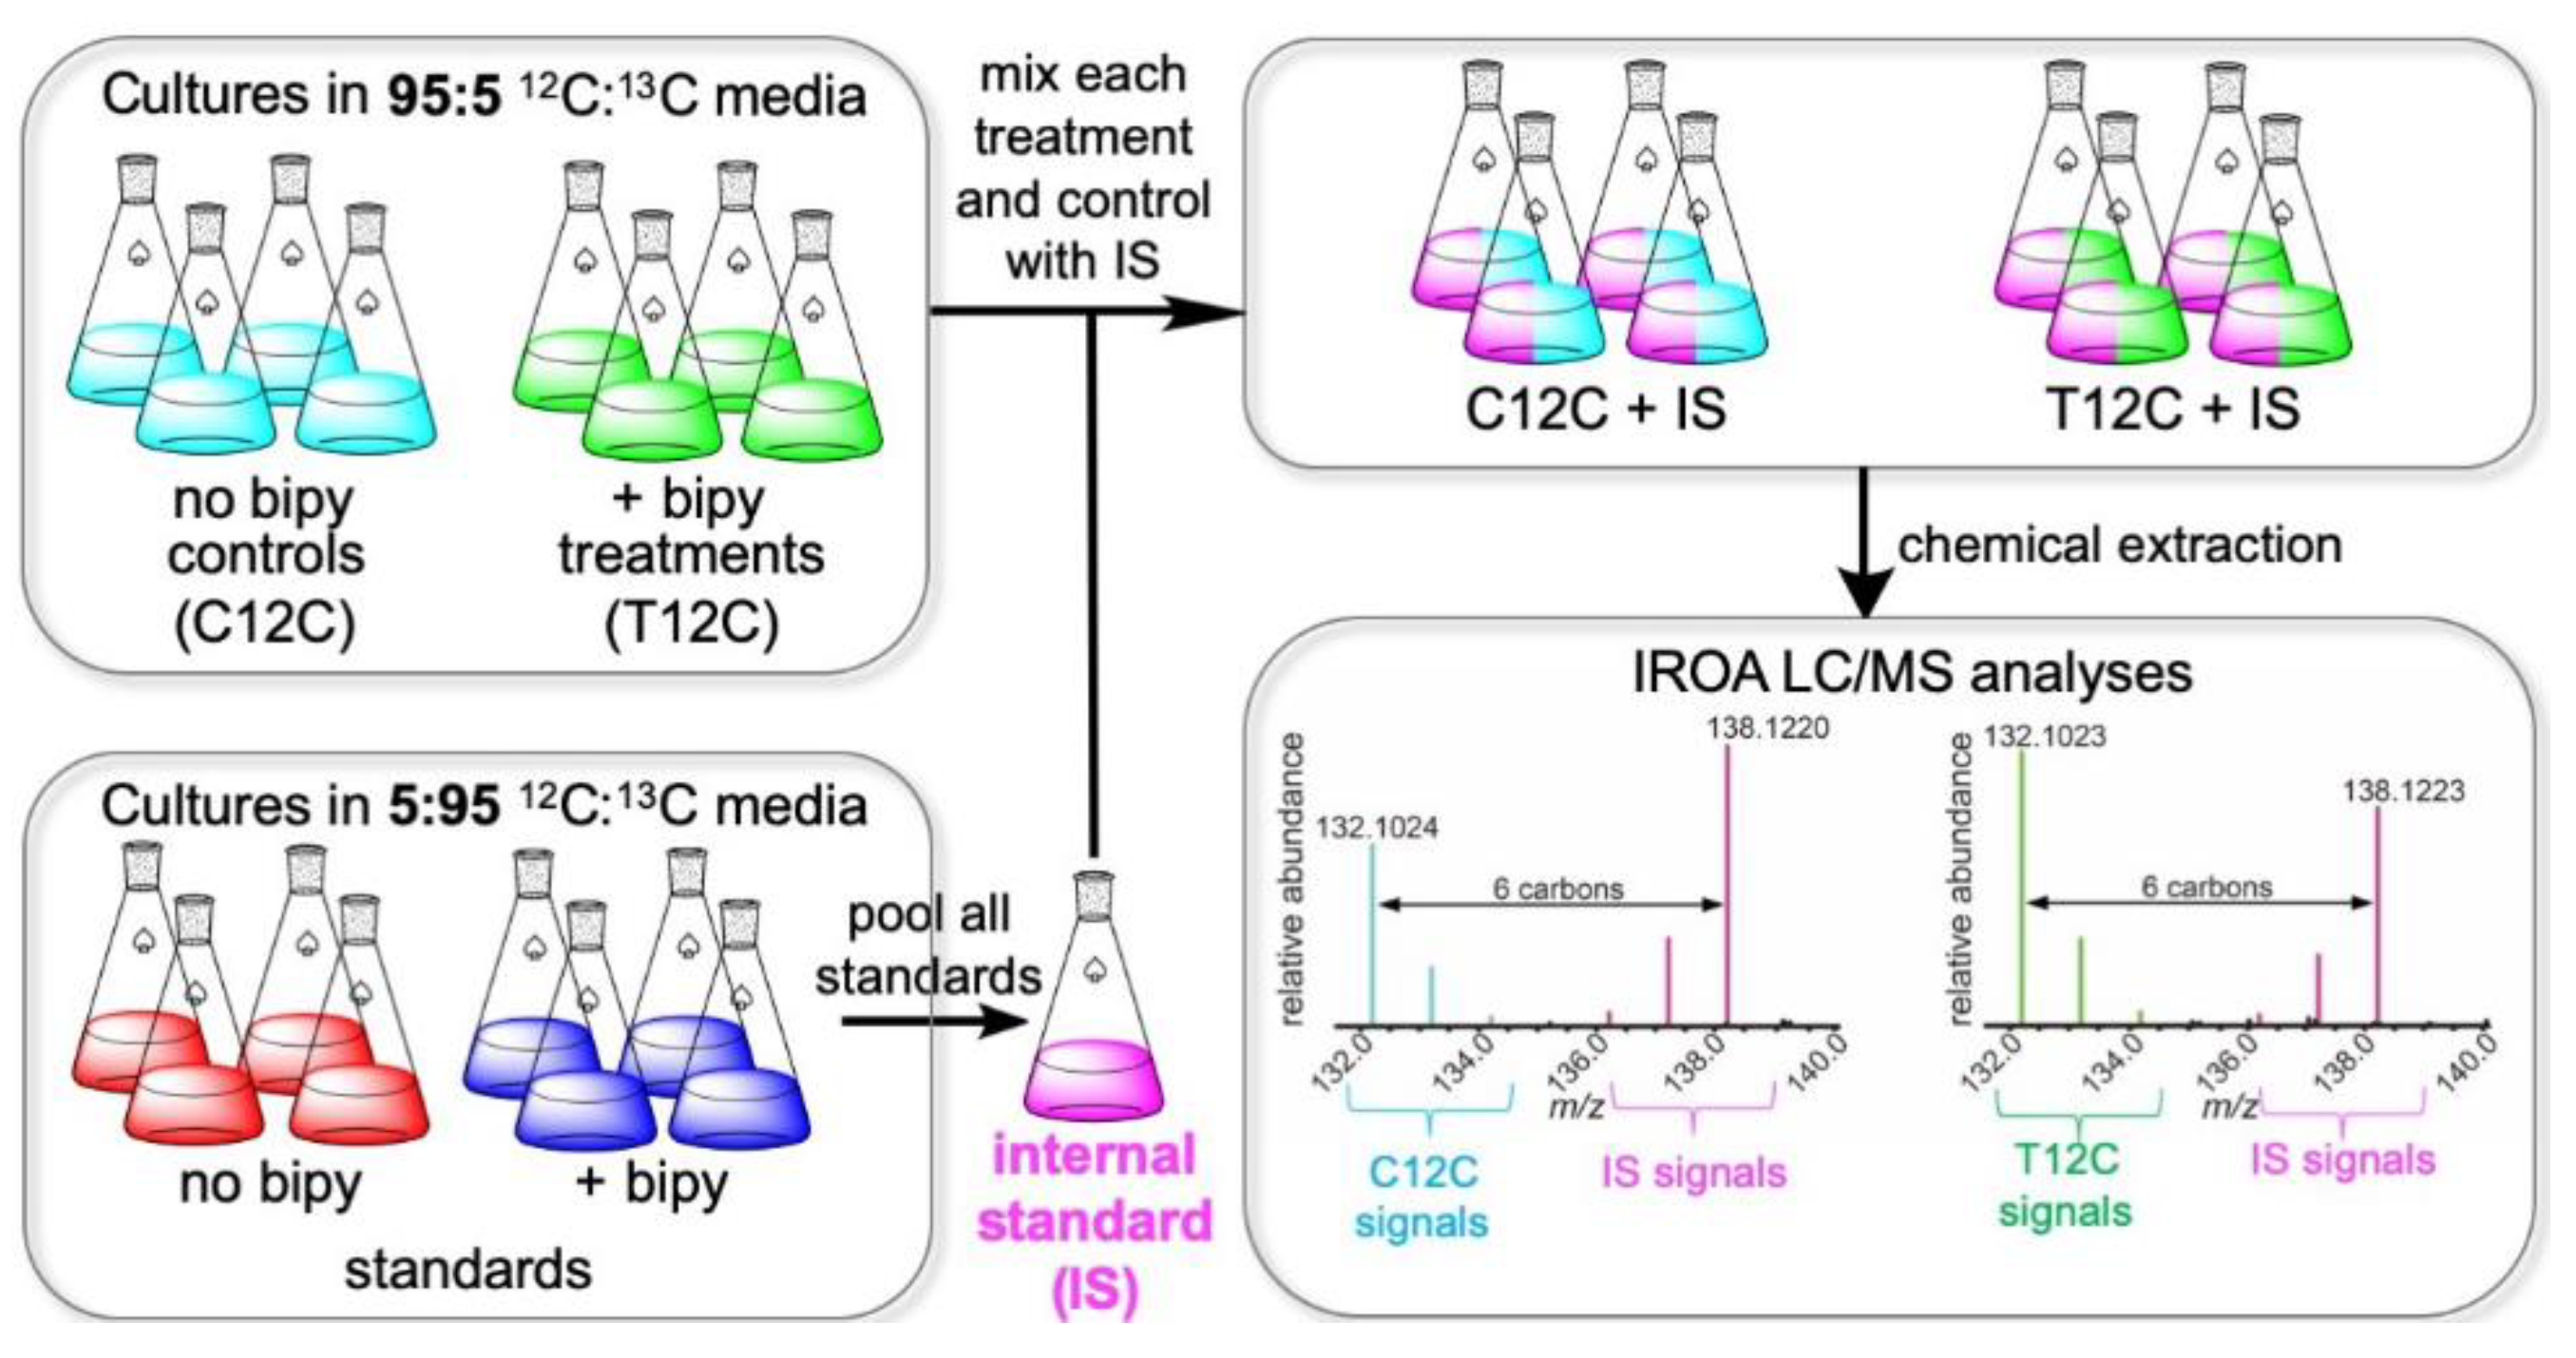
2.1. IROA Approach Enabling Detection of Metabolites Whose Production Is Initiated or Terminated in Response to Experimental Treatment

In published IROA metabolomics protocols [32,33,34], organisms from experimental and control groups were grown in media containing uniformly labeled carbon sources with different 12C:13C ratios (i.e., 95:5 vs. 5:95) and pooled prior to chemical extraction and UHPLC/MS or GC/MS. Comparison of the relative abundances of 12C- and 13C-labeled signals from isotopic peak pairs revealed differences in metabolite abundances between groups. This approach could not be used to find compounds that were absent from the experimental or control group, since a 12C- and 13C-labeled isotope peak pair would not exist. This limited applications of the existing IROA approach for natural product studies.
Thus, we aimed to develop an IROA method that enabled the measurement of all metabolic changes, including metabolites whose production was initiated or terminated in response to experimental treatment. This key change required making a biochemically complex internal standard (IS) containing distinctive isotopes of all metabolites from every experimental or control group. This IS was prepared by fermenting both experimental (with bipyridyl) and control (without bipyridyl) N. dassonvillei in uniformly 5:95 12C:13C-labeled media. These cultures were pooled at the conclusion of fermentation to provide a complete set of 13C-enriched metabolites for use as an IS (Figure 1). This IS was added to each treatment and control sample (T12C and C12C, respectively), which contained 95:5 12C:13C-labeled metabolites, immediately prior to chemical extraction and metabolomics analyses. Thus, this approach provided an internal standard (IS) containing a unique isotope of all of the compounds in any of the experimental or control groups. Ratios of MS peak areas were determined for each compound from T12C or C12C relative to its isotopic IS using ClusterFinder software. When either T12C or C12C integrals were below the limit of quantitation, missing data points resulted. To facilitate statistical analyses, these data points were imputed by ClusterFinder algorithms. Statistical comparisons of T12C:IS vs. C12C:IS peak pair ratios for all metabolites then enabled evaluation of metabolites whose production was initiated, terminated, up-, or downregulated in response to bipyridyl treatment.

2.2. N. dassonvillei Metabolome Revealed by Untargeted IROA UHPLC/MS

To determine the feasibility of our IROA LC/MS approach for untargeted metabolomics of actinomycetes (Figure 1), metabolic changes resulting from treatment of the model actinomycete N. dassonvillei with bipyridyl were assessed. Evaluation of high-resolution electrospray ionization positive (ESI+) and ESI UHPLC/MS data for chemical extracts of bipyridyl treatment (T12C) and no bipyridyl control (C12C) cultures, each supplemented with IS, revealed 1332 T12C-IS and/or C12C-IS MS peak pairs (Table 1; Table S1). A variety of metabolites were detected exclusively from one sample type or differed dramatically between types (Table S2), supporting that bipyridyl treatment results in initiation, termination, upregulation, and downregulation of biosynthetic pathways over the evaluated fermentation period.
Computation of the difference in molecular ion m/z’s between 12C and 13C monoisotopic peak pair signals indicated that the number of carbon atoms in detected metabolites ranged from two to 36 (Supplementary Materials Figure S1). Of the 1332 metabolites supported by IROA peak pair analyses, identities of 107 molecules (Table S1) were supported by correspondence between number of carbon atoms, exact masses of molecular ions, and retention times with a library of standard compounds. Identified metabolites encompassed common classes of biomolecules including amino acids, dipeptides, carbohydrates, and metabolites from nucleic acid pathways (Table S1). For the majority of other metabolites, identifications were made to at least the level of molecular formula. This IROA technique excluded all non-biological signals from consideration, thereby assuring that all detected analytes truly represented N. dassonvillei metabolites rather than artifacts. Together, these data support the suitability of IROA approaches for evaluating actinomycete metabolomes and detecting a broad range of metabolites from this biosynthetically talented group of bacteria.

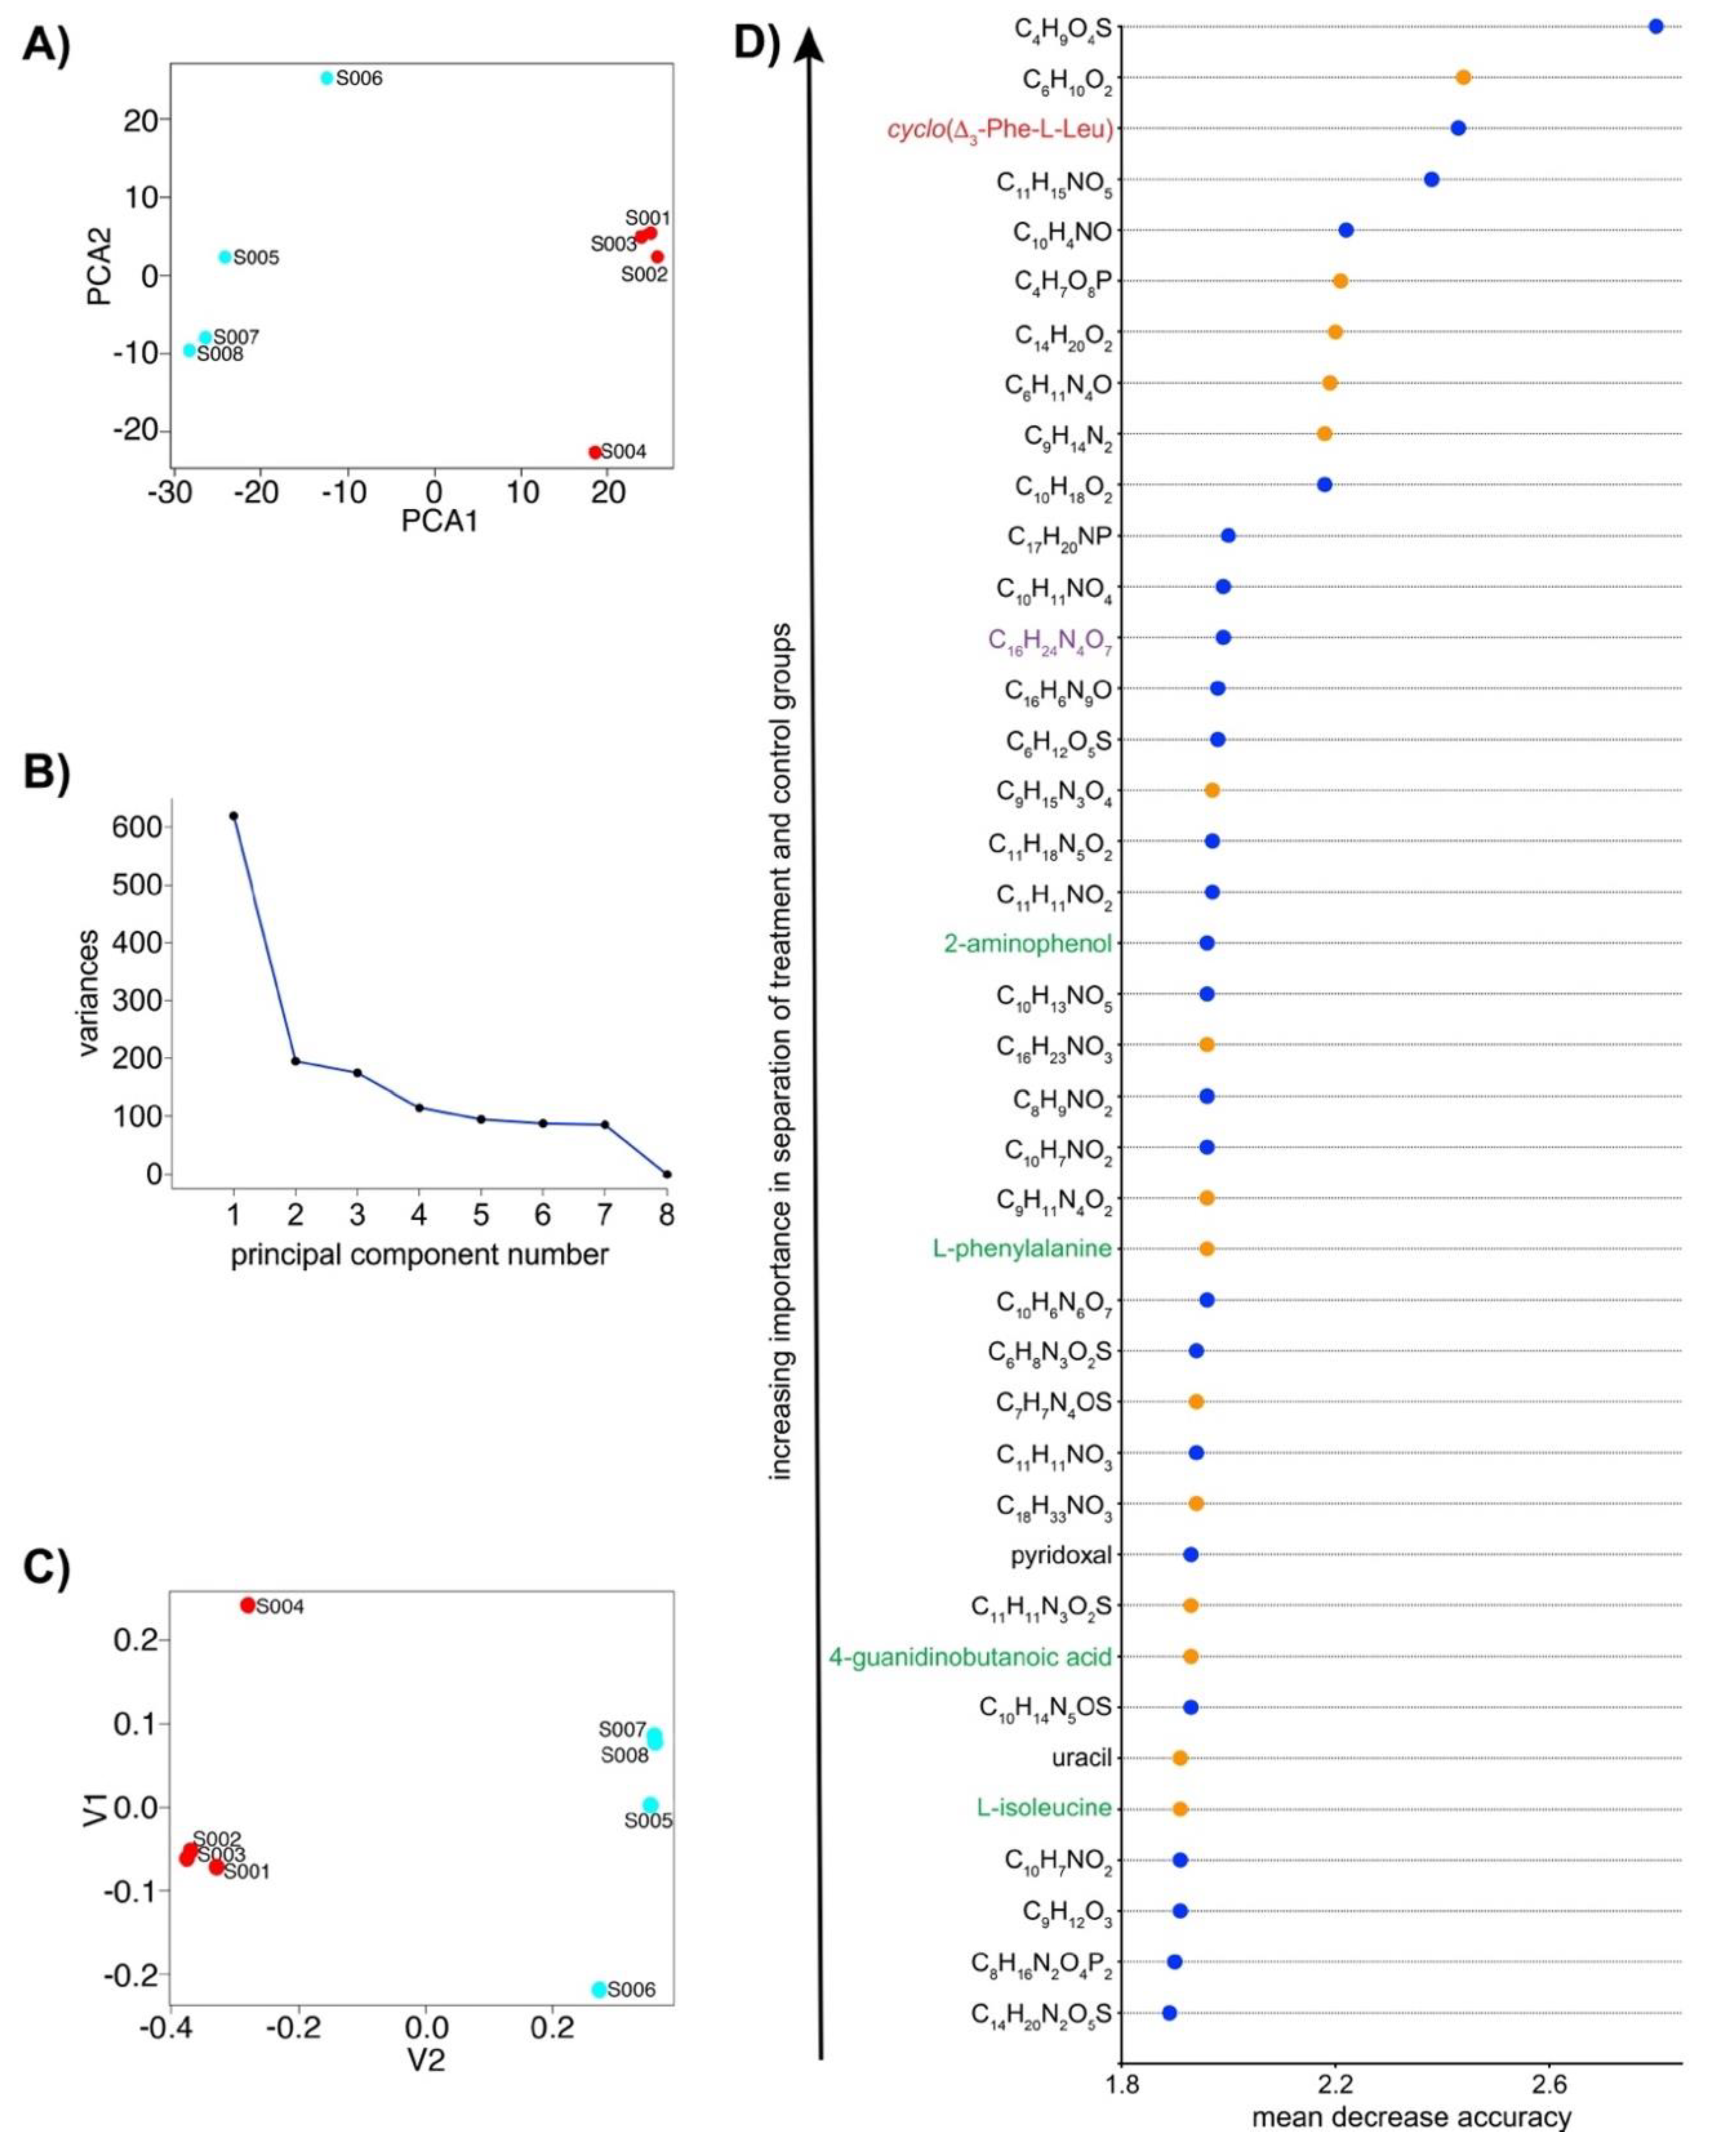
2.3. IROA LC/MS Differentiates Treatment and Control N. dassonvillei Metabolomes and Suggests the Production of Novel Metabolites

For each IROA MS peak pair detected from N. dassonvillei (Supplementary Materials Table S1), the ratio between signals from controls (C12C, n = 4) or treatments (T12C, n = 4) and IS was determined (Table S2). Univariate statistical comparison of these C12C:IS and T12C:IS ratios by unpaired two sample t-tests revealed that abundances of 253 metabolites were altered in response to bipyridyl treatment with p < 0.001. These metabolites (Table S3) were associated with a variety of primary metabolic pathways, including nucleic acid and amino acid pathways.
To further evaluate metabolic perturbation resulting from bipyridyl treatment, both supervised and unsupervised multivariate analyses were conducted (Figure 2). Principal component analysis (PCA), an unsupervised method [39], was employed to provide a global overview of variance between treatment and control groups. PCA clearly distinguished between samples from these two groups (Figure 2A), supporting perturbation of the N. dassonvillei metabolome in response to bipyridyl. The PCA scree plot (Figure 2B) revealed that the first two PCs account for most of the variation between N. dassonvillei treatment and control groups.
Random forest (RF) analysis, a supervised multivariate method [40], was conducted to further evaluate variance between treatment and control groups and to determine individual metabolites most important for distinguishing between groups. RF differentiated all treatments from controls (Figure 2C), and the mean decrease accuracy (MDA) was determined for individual metabolites (Figure 2D). MDA measures the decrease in performance of an RF model if an individual metabolite was removed from the analysis [40]. Hence, a larger MDA value corresponds to greater importance of a metabolite in predicting the sample group and provides evidence for metabolic signatures associated with experimental treatments. The 40 N. dassonvillei metabolites with highest MDA scores included molecules up- and downregulated in response to bipyridyl treatment and spanned multiple classes of primary metabolites (Figure 2D, Figure S2, Table S4). Molecules from amino acid pathways (i.e., l-phenylalanine, 4-guanidinobutanoic acid, 2-aminobenzoic acid, l-isoleucine) were prominent among metabolites with largest MDA values. The metabolic signature associated with bipyridyl treatment also included a variety of as-yet unidentified metabolites. Molecular formulae of these metabolites were predicted based on the IROA-supported number of carbon atoms along with correspondence between theoretical and experimental exact masses for molecular ions (Figure 2D).
The MDA-supported molecular signature (Figure 2D) was further evaluated for potentially novel secondary metabolites. Since most recently discovered bioactive natural products possess >10 carbon atoms, we focused on metabolites within this carbon number range. An IROA-supported carbon number of 16 together with experimental [M + H]+ m/z 385.1761 supported C16H24N4O7 as a putative molecular formula (Figure S3) that, to our knowledge, is unprecedented among bacterial natural products. Unfortunately, fermentation at an eight-liter scale failed to yield this metabolite in quantities sufficient for structure elucidation.

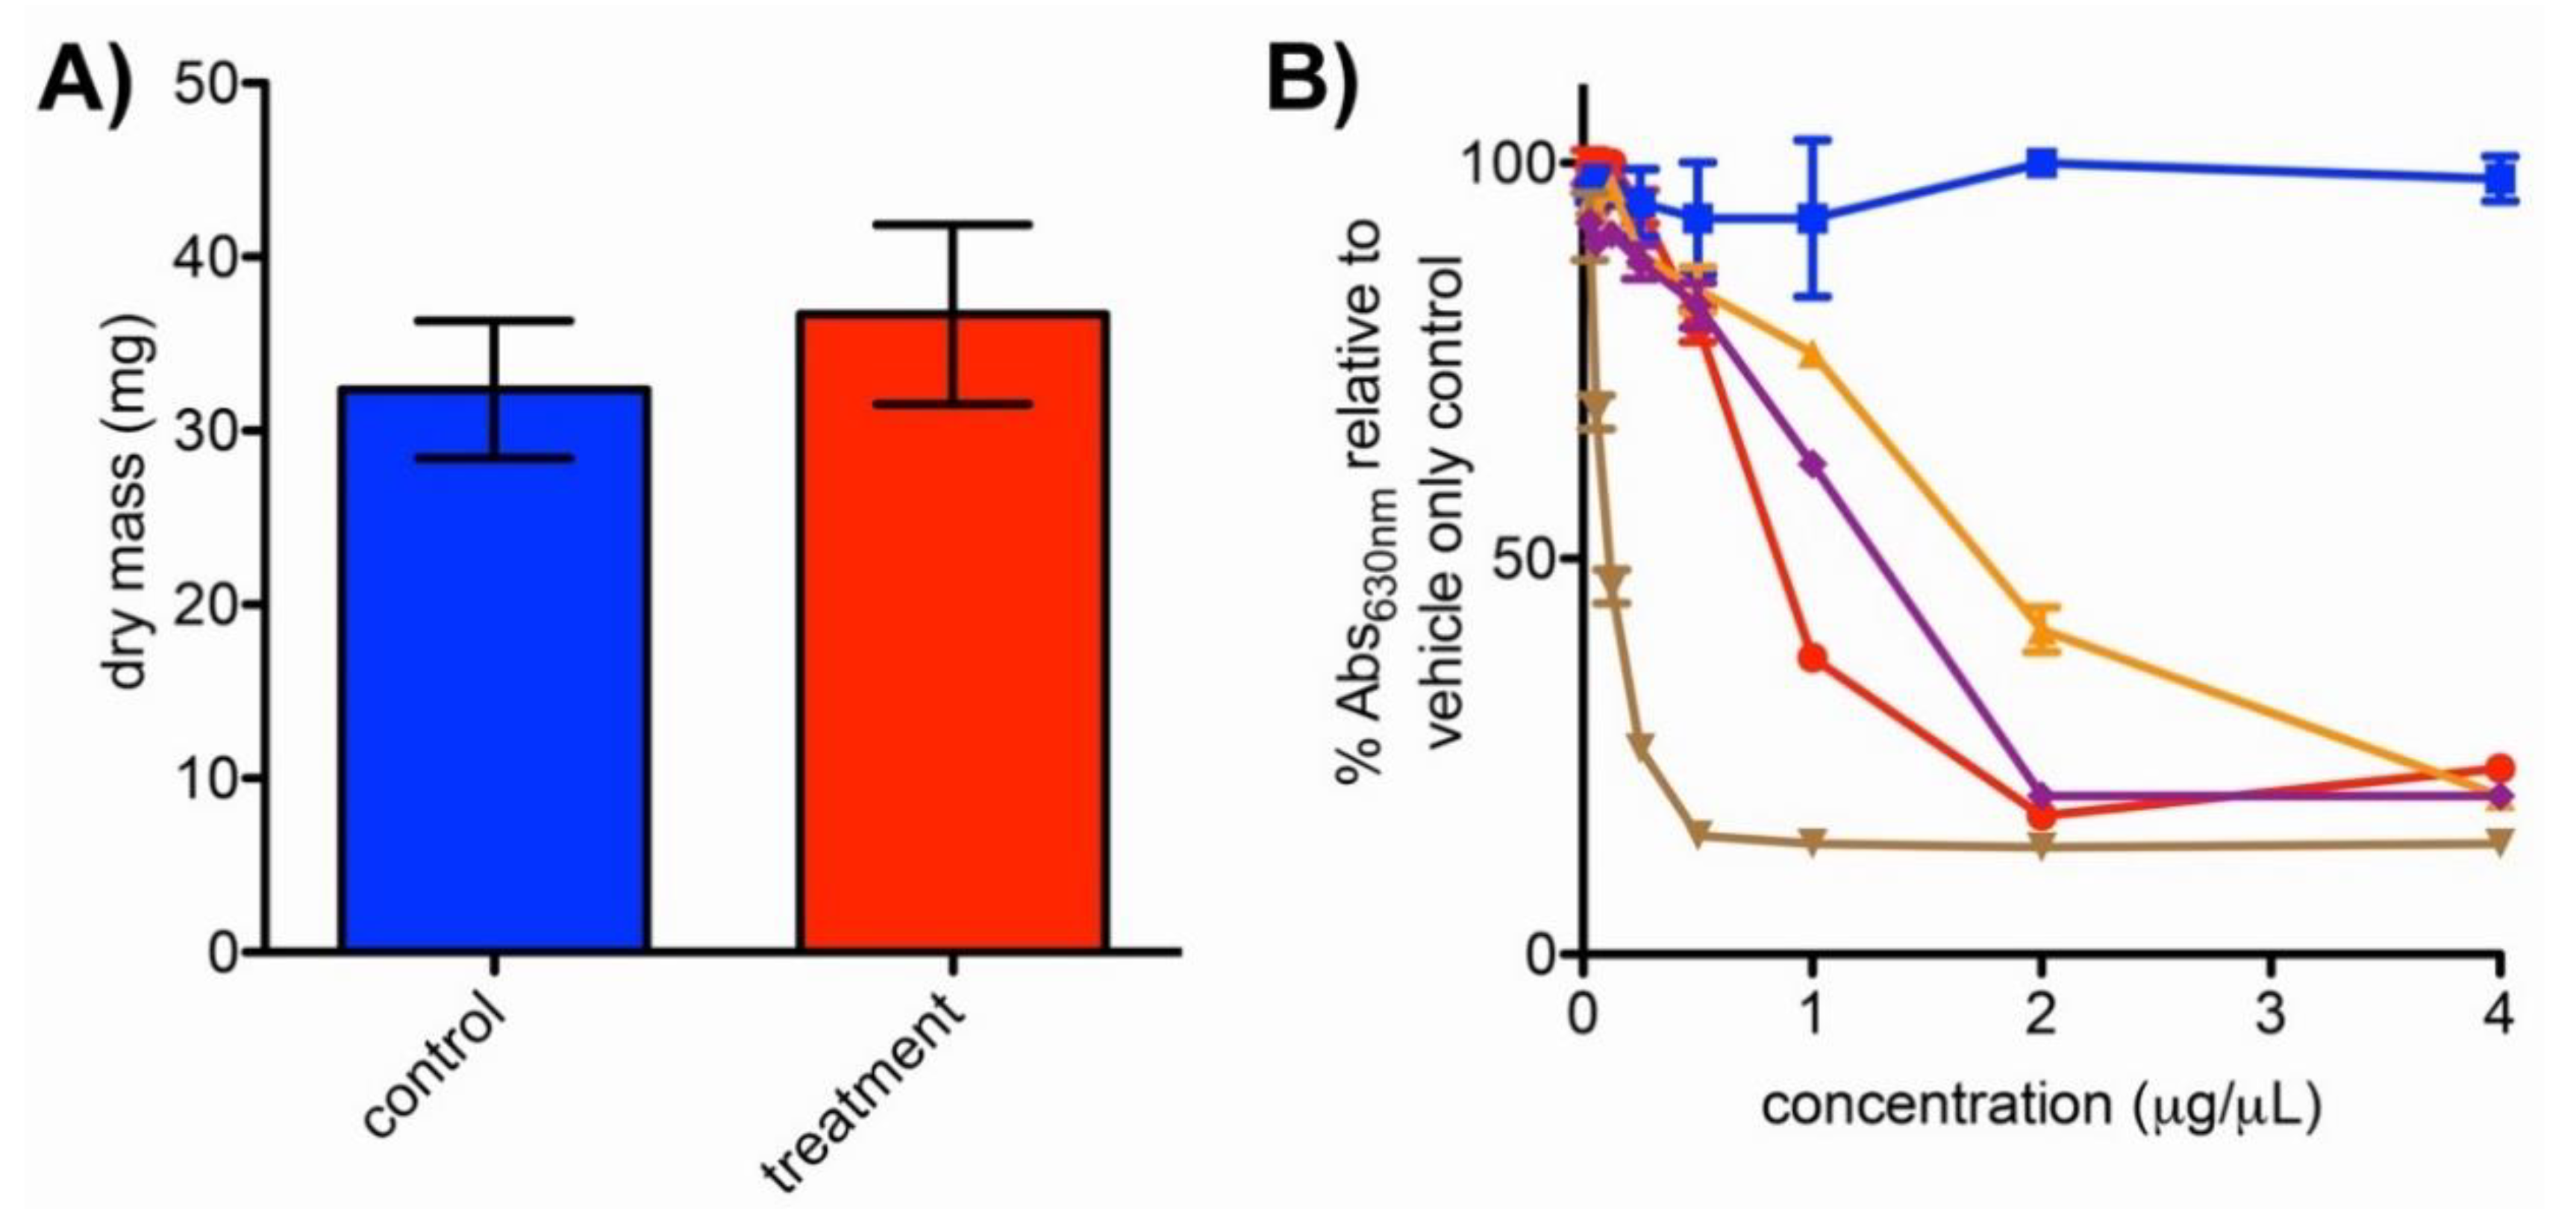
2.4. Impacts of Bipyridyl Treatment on N. dassonvillei Biomass and Siderophore Production

To evaluate whether observed metabolic changes (Figure 2) may relate to decreased growth in bipyridyl-treated N. dassonvillei cultures, biomasses of cell pellets from treatments and controls (n = 4) were determined at the conclusion of fermentation. This revealed no significant difference (unpaired t-test, p = 0.23) in dry mass resulting from fermentation in the presence or absence of bipyridyl (Figure 3A).
To evaluate siderophore production as a potential mechanism by which N. dassonvillei may mitigate impacts of iron limitation, ethyl acetate chemical extracts from treatment and control cultures were subjected to an established chemical assay for siderophore detection [41]. Activity in this assay was greater for extracts from N. dassonvillei grown in media supplemented with bipyridyl than for control chemical extracts of bipyridyl-supplemented media (Figure 3B), supporting the production of siderophores by bipyridyl-treated N. dassonvillei. In contrast, extracts from N. dassonvillei grown in media without bipyridyl were not active at evaluated concentrations. This difference in activity between N. dassonvillei sample types suggested that bipyridyl treatment upregulates siderophore production, or alternatively, that activity is enhanced by interactions between constitutively produced siderophores and bipyridyl extracted from the media. To evaluate these possibilities, the activity of extracts from N. dassonvillei grown in bipyridyl-containing media was compared with mixtures of extracts from bipyridyl-containing media and N. dassonvillei fermented in the absence of bipyridyl. Comparable activities were observed between these two sample types (Figure 3B), suggesting that siderophore assay activity results primarily from additive effects of bipyridyl with constitutive N. dassonvillei siderophores rather than from dramatic upregulation of siderophore biosynthesis.

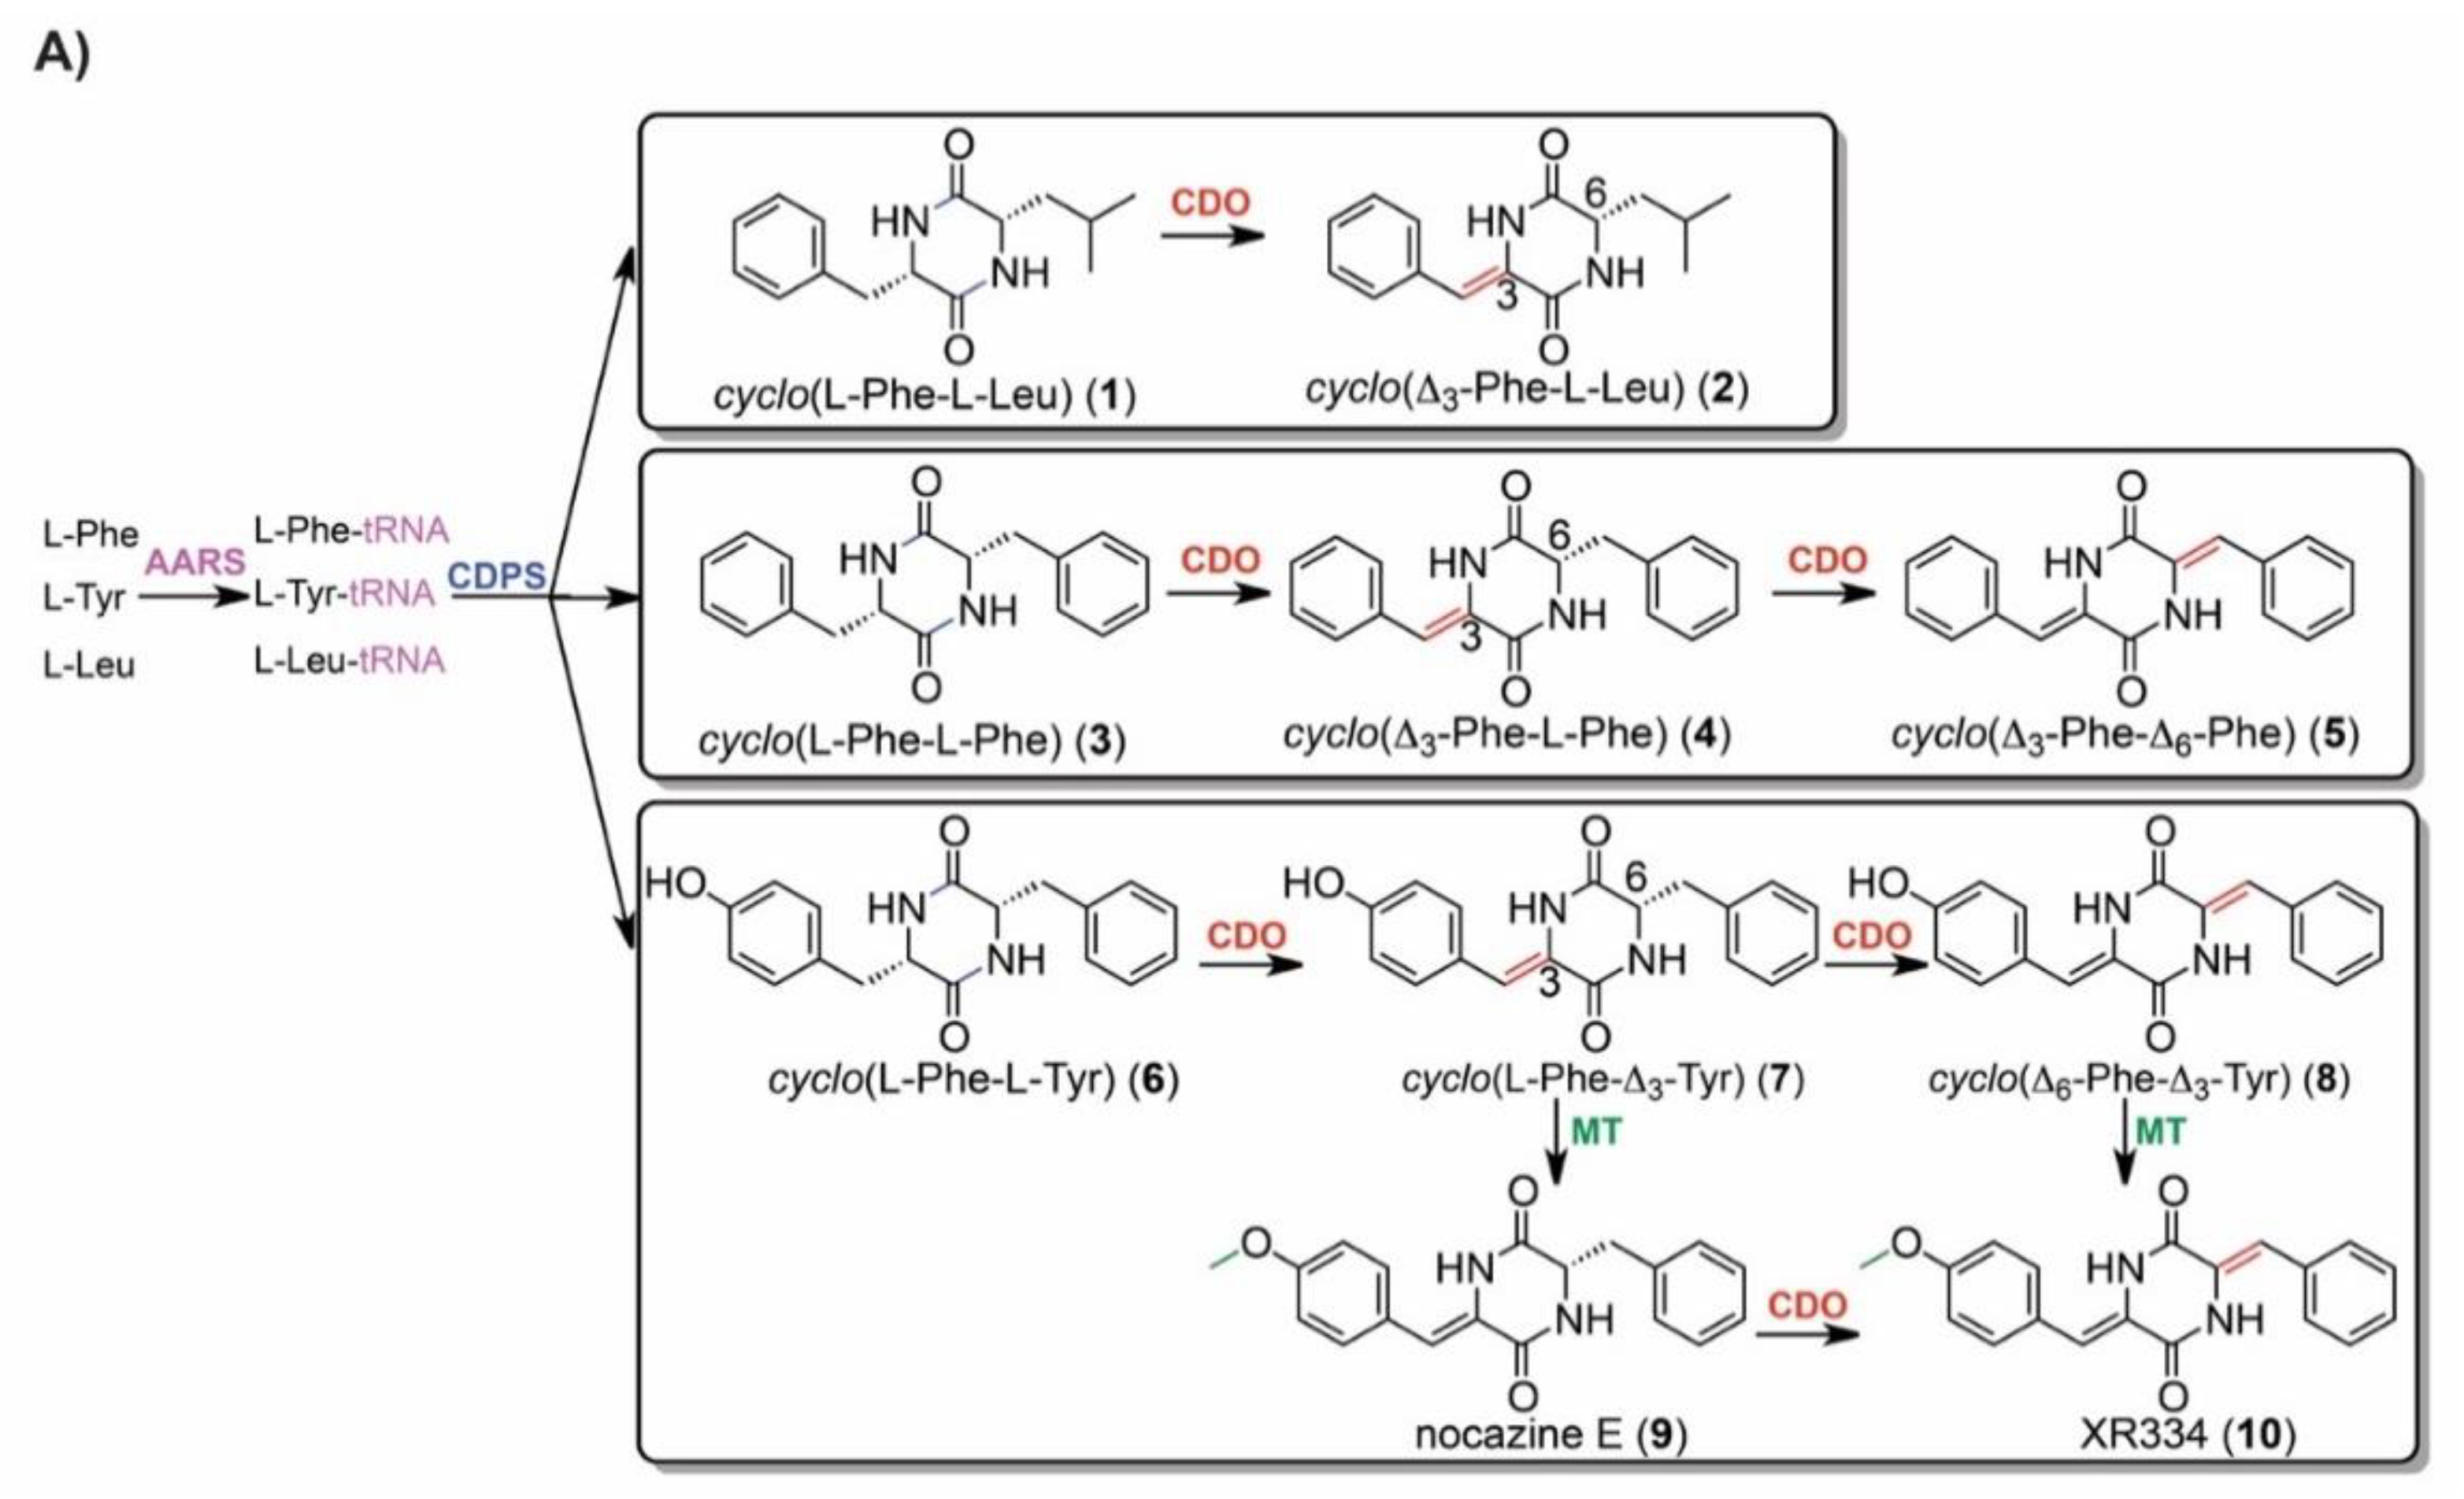
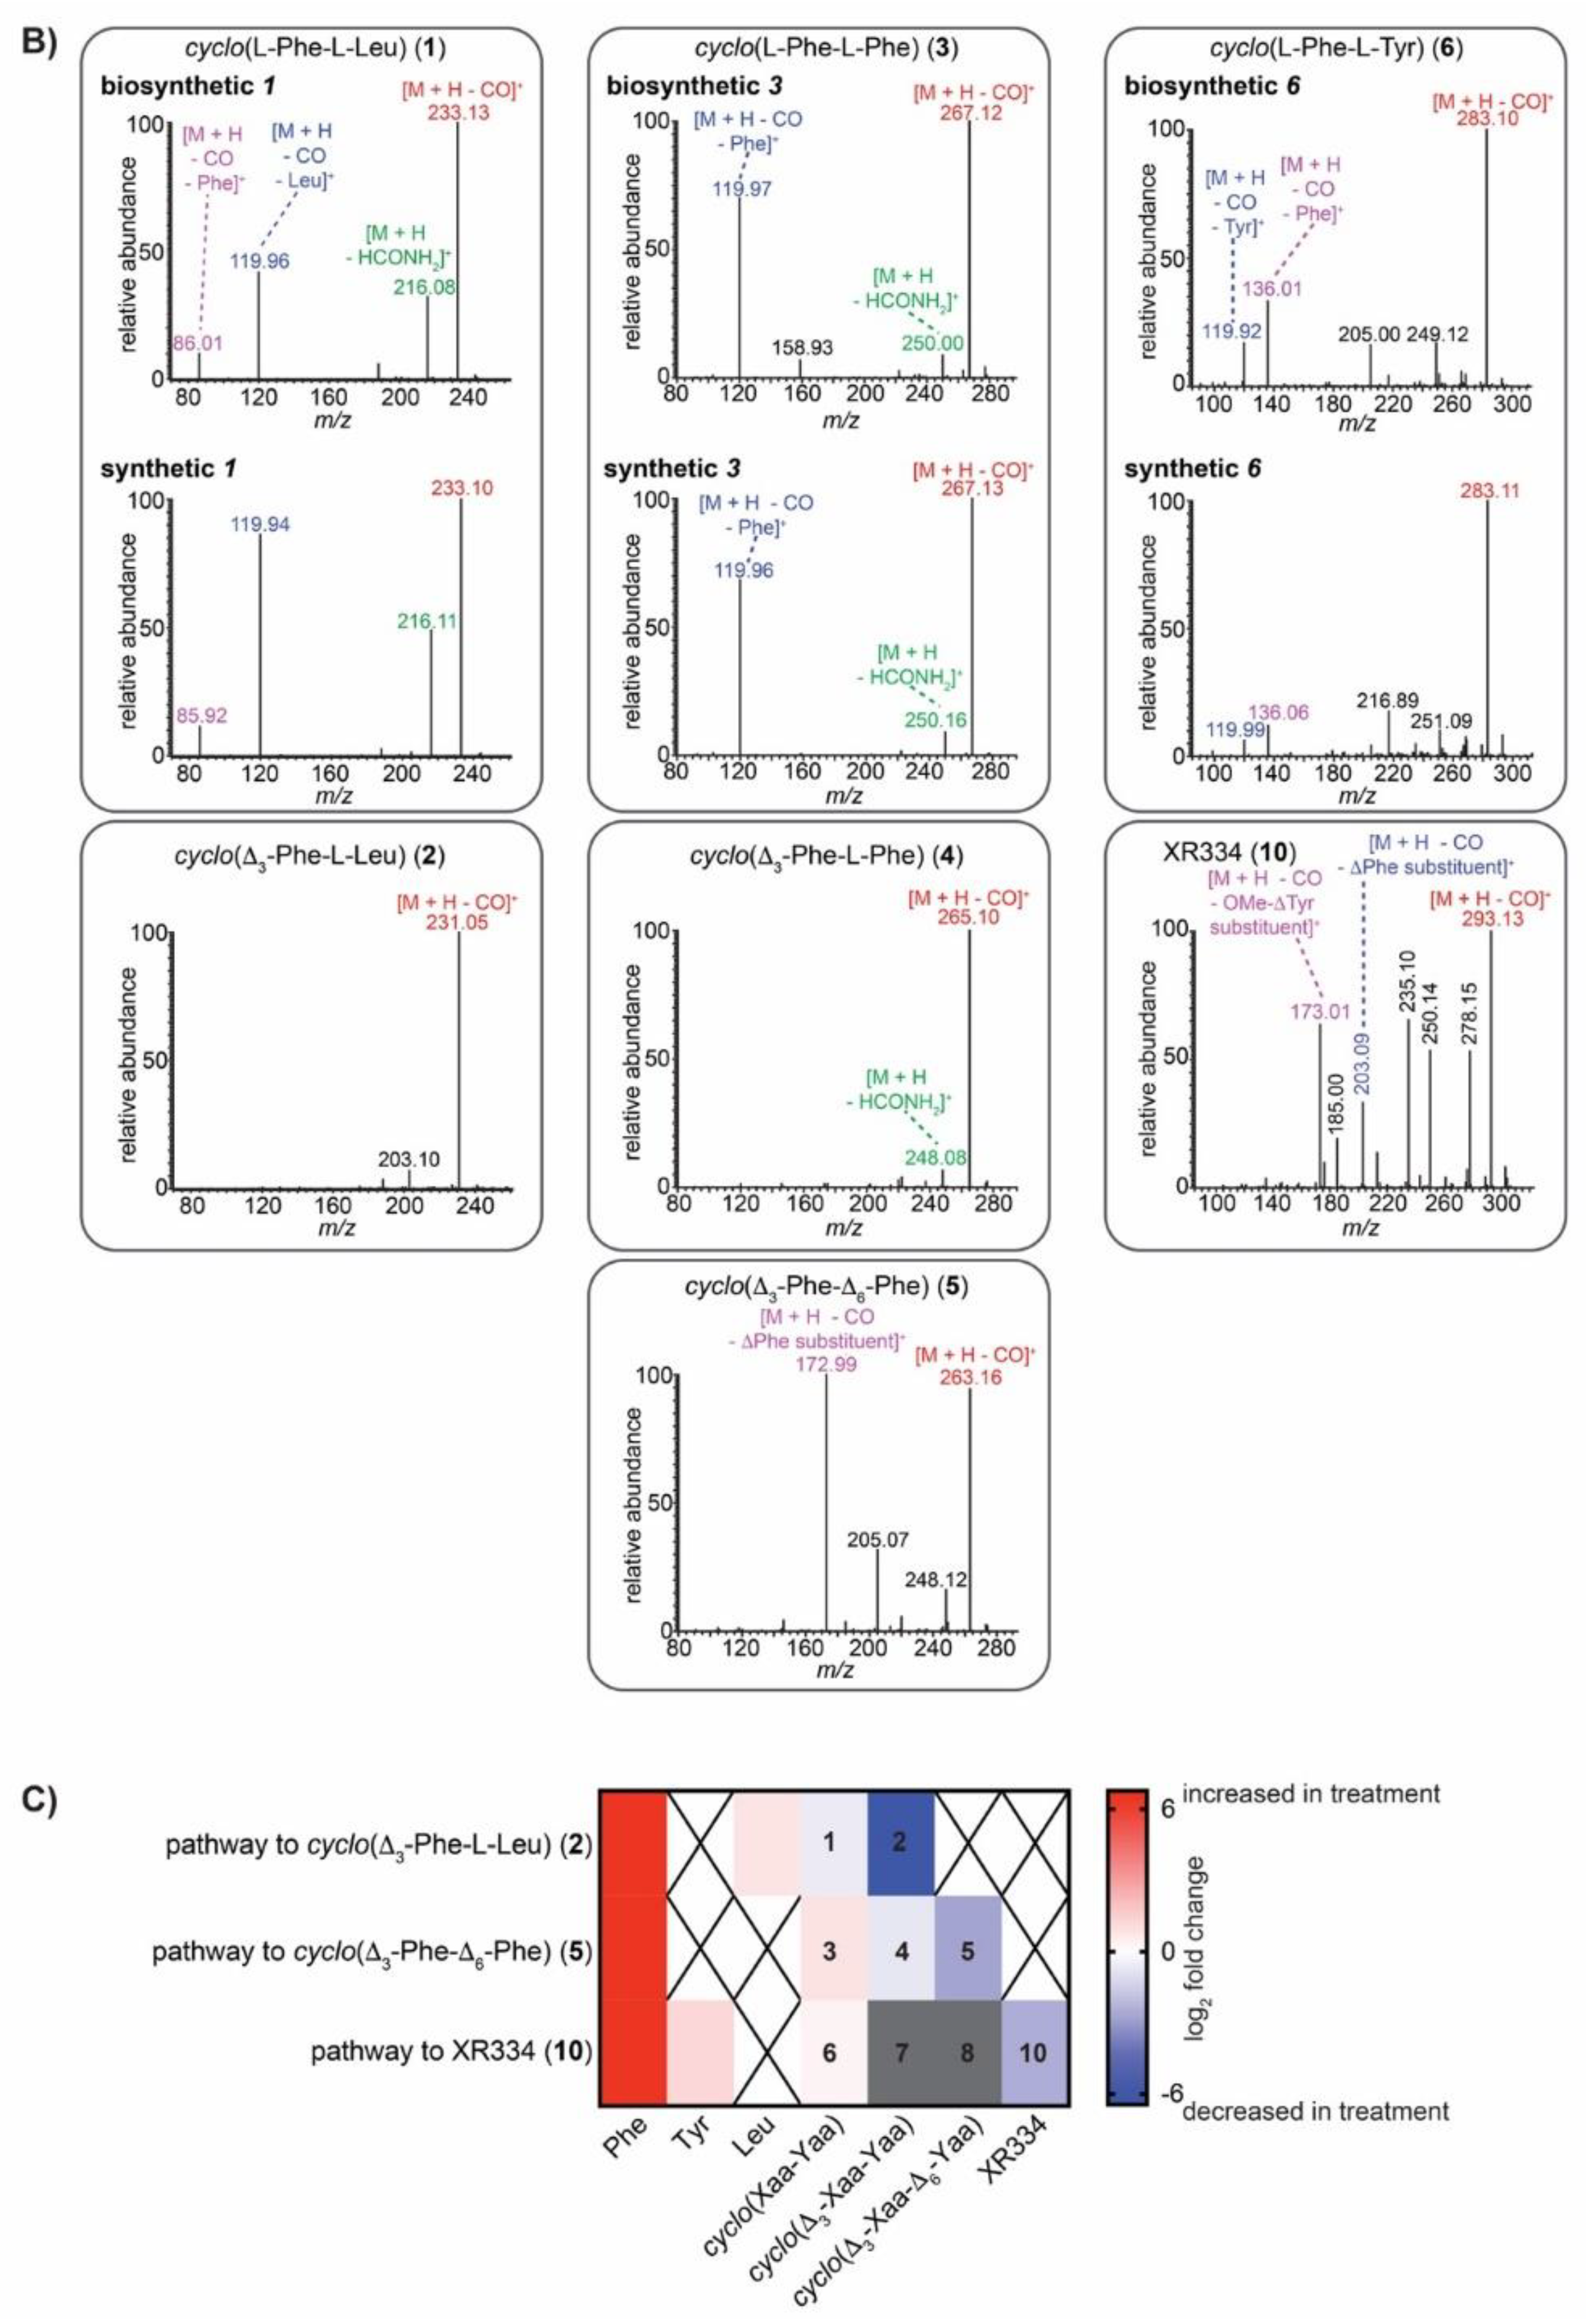
2.5. IROA Enables Rapid Assessment of the Perturbation of Targeted Metabolic Pathways

The optimization of high-value secondary metabolic pathways requires understanding of the impacts of experimental variables on pathway precursors, intermediates, and products. Aiming to establish IROA as a tool for evaluating mediators of targeted pathways, we assessed the effects of bipyridyl on the previously reported nocazine/XR334 diketopiperazine (DKP) biosynthetic pathway from N. dassonvillei [38] (Figure 4A). Production of nocazine/XR334 pathway final products (i.e., 2, 5, 10) is catalyzed by a suite of promiscuous enzymes, with these DKP products assembled from different amino acid precursors and differing in methylation and/or dehydrogenation tailoring (Figure 4A).
Inspection of the N. dassonvillei IROA dataset revealed MS exact masses and carbon numbers suggesting DKPs 1–6 and 10 and amino acid precursors leucine, phenylalanine, and tyrosine (Table S1; Figure S4). MS signals indicative of 7–9 were not observed. The identity of each amino acid precursor was confirmed by comparison of LC retention time and MS exact mass with authentic standards. Structures of DKPs 1–6 and 10 were confirmed by correspondence between tandem mass spectra (Figure 4B) of N. dassonvillei metabolites with commercial standards and/or literature values [38,42]. Intriguingly, identification of these metabolites revealed that cyclo3-Phe-L-Leu) 2 was among those metabolites with greatest MDAs (Figure 2D).
The abundance of each nocazine/XR334 pathway precursor, intermediate, and product (Figure 4a) was compared between bipyridyl treatment (n = 4) and no bipyridyl control (n = 4) N. dassonvillei cultures. A similar trend was observed along the pathways leading to final products 2, 5, and 10. For each, amino acid precursors were upregulated in treatments, while downregulation of late stage intermediates and products was observed (Figure 4C). This finding supports that bipyridyl perturbs the nocazine/XR334 pathway and suggests a particularly negative impact on later stages of the pathway. It also highlights the promise of IROA metabolomics for efficiently tracking impacts of experimental variables, such as small molecules, on targeted secondary metabolic pathways.

3. Discussion

Our work provides the first demonstration of IROA LC/MS metabolomics for actinomycetes, a biotechnologically important group of bacteria renowned as secondary metabolite producers [1,2,7]. It also establishes an IROA protocol (Figure 1) that enables recognition of metabolites which are exclusive to some experimental groups. This opens doors for new applications of IROA, such as the tracking of metabolites corresponding to cryptic biosynthetic pathways via comparison of metabolomes between wild type and biosynthetic gene elimination mutant organisms. Likewise, microbial co-cultivation and exposure to small molecules have previously been demonstrated to initiate secondary metabolite production [12,13,14,15,16,24], and the IROA protocol herein provides a novel strategy for recognition of these induced natural products.
The IROA approach offers several features that complement previously developed strategies for MS-based metabolomics of actinomycetes. The 12C/13C isotopic peak pair observed for each metabolite not only enables comparison of metabolite abundances across experimental and control groups, but also differentiates artifact signals from biosynthetic products and reveals the number of carbon atoms in each metabolite [32]. Determination of the number of carbon atoms in combination with high resolution exact masses dramatically reduces the number of plausible molecular formulae relative to conventional MS approaches [32], facilitating recognition of metabolites with novel molecular formulae. This was highlighted by the metabolic signature resulting from bipyridyl treatment (Figure 2d), which included a metabolite with a putative molecular formula of C16H24N4O7 that, to our knowledge, is unprecedented among bacterial natural products. IROA recognition of the number of carbon atoms also facilitates identification of previously characterized metabolites, as demonstrated herein for the nocazine/XR334 family of natural products (Figure 4; Figure S4).
Our findings highlight the utility of IROA metabolomics for global evaluation of changes to both primary and secondary metabolism. PCA and RF, complementary multivariate analysis methods [39,40], each clearly differentiated metabolomes from bipyridyl-treated and no-bipyridyl control N. dassonvillei in our study and suggest broad-reaching metabolic consequences of bipyridyl (Figure 2). The large number of metabolic changes observed in our study creates challenges for prioritization of specific metabolites for identification. Future integration of IROA approaches with burgeoning MS-based molecular networking approaches [28,29] and actinomycete-specific secondary metabolite databases [43] is anticipated to promote dereplication of known metabolites and facilitate prioritization of promising novel metabolites.
Metabolome changes observed in the current study may result from direct responses of N. dassonvillei to bipyridyl or, more likely, from responses to diminished free iron due to chelation by bipyridyl. While iron is required for a variety of metabolic processes, its availability in nature is limited by the low solubility of Fe3+ [44]. Bacteria have adapted to iron limitation in many ways, including the constitutive or inducible production of siderophores that sequester iron for the producing organism [44]. For example, Vinayavekhin et al. demonstrated that low iron levels stimulated production of a family of novel siderophoric 2-alkyl-4,5-dihydrothiazole-4-carboxylates by proteobacterium Pseudomonas aeruginosa [35]. Likewise, Traxler et al. used imaging mass spectrometry to reveal that interactions with siderophore-producing bacteria stimulated the production of novel siderophoric acylated desferrioxamines by Streptomyces coelicolor, presumably as an evolutionary strategy to compete for iron [24]. Our study suggests that N. dassonvillei produces siderophore(s) of as-yet unknown structures (Figure 3B). Siderophore production offers one plausible explanation of how N. dassonvillei may avert significant reductions in biomass in response to iron (III) limitation during bipyridyl treatment (Figure 3A).
While the N. dassonvillei genome encodes a pathway homologous to the desferrioxamine pathway from S. coelicolor (70–75% amino acid similarity) [36,37,45], this group of siderophores has not been previously reported from N. dassonvillei and our IROA analyses likewise revealed no evidence for production of known desferrioxamines. This suggests that the N. dassonvillei desferrioxamine pathway is silent or encodes novel desferrioxamines. The N. dassonvillei genome also encodes multiple cryptic nonribosomal peptide synthetase and polyketide synthase pathways, which potentially yield as-yet unidentified siderophores.
Together, our results illuminate impacts of bipyridyl on the metabolome of a model actinomycete and provide the first implementation of IROA global metabolomics for study of actinomycetes. Our results support IROA as a tool in the pipeline for natural product evaluation, suggesting its utility for recognition of metabolites with novel molecular formulae and for evaluating impacts of experimental treatments, such as small molecules, on primary and secondary metabolism.

4. Materials and Methods

4.1. Nocardiopsis dassonvillei Cultures and Fermentation for IROA Experiments

Nocardiopsis dassonvillei (Brocq-Rousseau 1904) Meyer 1976 DSM 43111 (ATCC 23218) was obtained from the American Type Culture Collection and maintained on ISP-2 agar plates. N. dassonvillei experimental and control cultures were prepared using media composed of 1.5 g protein hydrolysate, 0.8 g yeast extract, and 1 g glucose per L of deionized water, with each carbon source uniformly 95:5 12C:13C-labeled (IROA Technologies). Treatment cultures (3 mL, n = 4) were supplemented with 2,2′-bipyridyl (200 μM, Sigma Aldrich) in DMSO vehicle, while control cultures (3 mL, n = 4) were supplemented with an equal amount of DMSO without bipyridyl. Additionally, standard cultures were prepared using the same media formulations, methods, and number of cultures as above, but containing uniformly 5:95 12C:13C-labeled carbon sources. Cultures for tandem MS were prepared as above, using media without isotope labels. All cultures were fermented at 30 °C with shaking at 220 rpm for 7 days prior to chemical extraction.

4.2. Chemical Extraction and Preparation of Samples for UHPLC/MS Metabolomics

Following fermentation, all four replicate standard cultures were pooled to yield a 5:95 12C:13C-labeled metabolite mixture for use as an IS. Each treatment and control culture was supplemented (1:1) with this IS, extracted twice with an equal volume of ethyl acetate, and solvent removed in vacuo. Chemical extracts were resolubilized with 500 μL of methanol for UHPLC/MS.

4.3. UHPLC/MS Analysis

Reversed phase UHPLC/MS was conducted using a Dionex Ultimate 3000 UHPLC pump interfaced with a Thermo Fisher Q-Exactive Orbitrap mass spectrometer. An ACE Excel PFP-C18 2.1 × 100 mm with 2.0 μm particle size column (ACE #EXL-1010-1002U) was used, with 2 μL injections of chemical extracts. UHPLC was conducted using a flow rate of 350 μL/min with water and acetonitrile gradient, where each contained 0.1% formic acid. An initial mobile phase of 100% water was held for 3 min, followed by a linear gradient from 0–80% acetonitrile over 10 min, then held at 80% acetonitrile for 3 min. MS was conducted in ESI+ and ESI modes with a probe temperature of 350 °C, spray voltage of 3500 V, capillary temperature of 320 °C, sheath gas flow rate of 40 arbitrary units, and auxiliary gas flow rate of 10 arbitrary units. Tandem mass spectra for DKPs 1–6 and 10 were collected using a Dionex Ultimate 3000 UHPLC pump interfaced with a Thermo Fisher LTQ-XL mass spectrometer in ESI+ mode with parameters analogous to those above and a normalized collision energy of 40 for MS2.

4.4. Data Processing and Analyses

Thermo raw datafiles were converted into mzxml files and imported into IROA ClusterFinder software V3.0 (IROA Technologies) for analysis. ClusterFinder was used following manufacturer protocols for automated recognition of IROA peak pairs and prediction of molecular formulae, followed by statistical comparisons of abundances of all recognized 12C- and 13C-labeled isotopic peak pairs. PCA and RF analysis, including MDA evaluation, were conducted using the Statistical Tools feature of ClusterFinder. Indicated primary metabolites were identified by comparison of retention time, IROA-predicted molecular formula, and molecular ion m/z with the Mass Spectrometry Metabolite Library of Standards (MSMLS, IROA Technologies). Plausible identities of other metabolites were proposed based on comparison of predicted molecular formula with molecules from the ClusterFinder database (IROA Technologies). Box-whisker plots and heatmaps, as well as statistics associated with these plots, were prepared using GraphPad Prism 8.

4.5. Evaluation of Biomass and Siderophore Production

Treatment (with bipyridyl) and control (no bipyridyl) cultures (n = 4) were prepared at 150 mL scales using fermentation parameters and media as above, but containing natural abundances of isotopes. At the conclusion of fermentation, cell pellets were prepared from 50 mL of each culture by centrifugation at 5000 rpm for 15 min, pellets washed twice with DI water, and dried at 95 °C for 48 h before determination of dry mass. Statistical comparisons of dry masses were conducted using GraphPad Prism 5 with an unpaired t-test.
From each culture, 100 mL was extracted twice with an equal volume of ethyl acetate, and solvent removed in vacuo. Control extracts (n = 4) corresponding to media supplemented with bipyridyl (no bacteria) were prepared equivalently. Extracts were reconstituted with DMSO vehicle for siderophore assays.
Siderophore production was evaluated using an established chemical assay, in which Fe3+, chrome azurol S, and hexadecyltrimethylammonium bromide form a blue tertiary complex that exhibits strong Abs630. This complex is disrupted in proportion to siderophore concentration, with a corresponding Abs630 decrease [41]. Assays were conducted in 96-well plates at eight concentrations of each chemical extract in a 1:1 serial dilution series ranging from 4 to 0.03 μg/μL. Desferrioxamine B mesylate (MilliporeSigma) was evaluated at this concentration range as a positive control. Following incubation at room temperature until color change equilibrium was achieved (~4 h), siderophore activity was evaluated by comparing Abs630 values for all samples relative to corresponding DMSO vehicle-only negative controls. Standard deviations were computed and plotted using GraphPad Prism 5.

Supplementary Materials

The following are available online at https://www.mdpi.com/2218-1989/9/9/181/s1, Microsoft Excel spreadsheet containing Table S1: Summary of metabolites detected by IROA; Table S2: Isotopic ratios for all metabolites; Table S3: Metabolites deemed significant by univariate statistical analysis. Supplementary information PDF containing Figure S1: Histogram of number of carbon atoms in metabolites; Figure S2: Box-whisker plots of 40 metabolites with largest MDA; Figure S3: IROA molecular ion for putative novel C16 metabolite; Figure S4: IROA molecular ions for DKPs 1–6 and 10; Table S4: Summary of IROA LC/MS data for 40 metabolites with largest MDA.

Author Contributions

Conceptualization, C.B., F.d.J. and A.L.L.; formal analysis, J.C., T.N., J.K., C.B., F.d.J. and A.L.L.; funding acquisition, A.L.L.; investigation, J.C., T.N. and A.L.L.; methodology, C.B., F.d.J. and A.L.L.; project administration, A.L.L.; software, C.B. and F.d.J.; supervision, A.L.L.; writing—original draft, A.L.L.; writing—review and editing, J.C., T.N., J.K., C.B. and F.d.J.

Funding

We are grateful for funding from a University of Florida Southeast Center for Integrated Metabolomics (SECIM) Pilot and Feasibility grant to A.L.L., and University of North Florida (UNF) Transformational Learning Opportunity (TLO) and Academic Affairs grants to A.L.L. J.K. acknowledges support from the UNF Presidential Scholar program.

Acknowledgments

We are grateful to Arthur Edison for discussions of IROA experimental design and to SECIM for UHPLC/MS analyses and discussions.

Conflicts of Interest

The authors have no conflict of interest to declare.

References

  1. Barka, E.A.; Vatsa, P.; Sanchez, L.; Gaveau-Vaillant, N.; Jacquard, C.; Meier-Kolthoff, J.P.; Klenk, H.P.; Clement, C.; Ouhdouch, Y.; van Wezel, G.P. Taxonomy, Physiology, and Natural Products of Actinobacteria. Microbiol. Mol. Biol. Rev. 2016, 80, 1–43. [Google Scholar] [CrossRef] [PubMed] [Green Version]
  2. Berdy, J. Thoughts and facts about antibiotics: Where we are now and where we are heading. J. Antibiot. 2012, 65, 385–395. [Google Scholar] [CrossRef] [PubMed] [Green Version]
  3. Genilloud, O. Actinomycetes: Still a source of novel antibiotics. Nat. Prod. Rep. 2017, 34, 1203–1232. [Google Scholar] [CrossRef] [PubMed]
  4. Nicolaou, K.C.; Hale, C.R.; Nilewski, C.; Ioannidou, H.A. Constructing molecular complexity and diversity: Total synthesis of natural products of biological and medicinal importance. Chem. Soc. Rev. 2012, 41, 5185–5238. [Google Scholar] [CrossRef] [PubMed]
  5. Behie, S.W.; Bonet, B.; Zacharia, V.M.; McClung, D.J.; Traxler, M.F. Molecules to Ecosystems: Actinomycete Natural Products in situ. Front. Microbiol. 2017, 7, 2149. [Google Scholar] [CrossRef]
  6. Carlson, E.E. Natural Products as Chemical Probes. ACS Chem. Biol. 2010, 5, 639–653. [Google Scholar] [CrossRef] [Green Version]
  7. Baltz, R.H. Gifted microbes for genome mining and natural product discovery. J. Ind. Microbiol. Biotechnol. 2017, 44, 573–588. [Google Scholar] [CrossRef]
  8. Nguyen, Q.T.; Merlo, M.E.; Medema, M.H.; Jankevics, A.; Breitling, R.; Takano, E. Metabolomics methods for the synthetic biology of secondary metabolism. FEBS Lett. 2012, 586, 2177–2183. [Google Scholar] [CrossRef]
  9. Van der Heul, H.U.; Bilyk, B.L.; McDowall, K.J.; Seipke, R.F.; van Wezel, G.P. Regulation of antibiotic production in Actinobacteria: New perspectives from the post-genomic era. Nat. Prod. Rep. 2018, 35, 575–604. [Google Scholar] [CrossRef]
  10. Bilyk, O.; Luzhetskyy, A. Metabolic engineering of natural product biosynthesis in actinobacteria. Curr. Opin. Biotechnol. 2016, 42, 98–107. [Google Scholar] [CrossRef]
  11. Gaudencio, S.P.; Pereira, F. Dereplication: Racing to speed up the natural products discovery process. Nat. Prod. Rep. 2015, 32, 779–810. [Google Scholar] [CrossRef] [PubMed]
  12. Abdelmohsen, U.R.; Grkovic, T.; Balasubramanian, S.; Kamel, M.S.; Quinn, R.J.; Hentschel, U. Elicitation of secondary metabolism in actinomycetes. Biotechnol. Adv. 2015, 33, 798–811. [Google Scholar] [CrossRef] [PubMed] [Green Version]
  13. Xu, F.; Nazari, B.; Moon, K.; Bushin, L.B.; Seyedsayamdost, M.R. Discovery of a Cryptic Antifungal Compound from Streptomyces albus J1074 Using High-Throughput Elicitor Screens. J. Am. Chem Soc. 2017, 139, 9203–9212. [Google Scholar] [CrossRef] [PubMed]
  14. Adnani, N.; Chevrette, M.G.; Adibhatla, S.N.; Zhang, F.; Yu, Q.; Braun, D.R.; Nelson, J.; Simpkins, S.W.; McDonald, B.R.; Myers, C.L.; et al. Coculture of Marine Invertebrate-Associated Bacteria and Interdisciplinary Technologies Enable Biosynthesis and Discovery of a New Antibiotic, Keyicin. ACS Chem. Biol. 2017, 12, 3093–3102. [Google Scholar] [CrossRef] [PubMed]
  15. Derewacz, D.K.; Covington, B.C.; McLean, J.A.; Bachmann, B.O. Mapping Microbial Response Metabolomes for Induced Natural Product Discovery. ACS Chem Biol 2015, 10, 1998–2006. [Google Scholar] [CrossRef] [PubMed] [Green Version]
  16. Adnani, N.; Vazquez-Rivera, E.; Adibhatla, S.N.; Ellis, G.A.; Braun, D.R.; Bugni, T.S. Investigation of Interspecies Interactions within Marine Micromonosporaceae Using an Improved Co-Culture Approach. Mar. Drugs 2015, 13, 6082–6098. [Google Scholar] [CrossRef] [PubMed]
  17. Yamanaka, K.; Reynolds, K.A.; Kersten, R.D.; Ryan, K.S.; Gonzalez, D.J.; Nizet, V.; Dorrestein, P.C.; Moore, B.S. Direct cloning and refactoring of a silent lipopeptide biosynthetic gene cluster yields the antibiotic taromycin A. Proc. Natl. Acad. Sci. USA 2014, 111, 1957–1962. [Google Scholar] [CrossRef] [PubMed] [Green Version]
  18. Liu, R.; Deng, Z.; Liu, T. Streptomyces species: Ideal chassis for natural product discovery and overproduction. Metab. Eng. 2018, 50, 74–84. [Google Scholar] [CrossRef]
  19. Wu, C.; Choi, Y.H.; van Wezel, G.P. Metabolic profiling as a tool for prioritizing antimicrobial compounds. J. Ind. Microbiol. Biotechnol. 2015, 43, 299–312. [Google Scholar] [CrossRef] [Green Version]
  20. Aretz, I.; Meierhofer, D. Advantages and Pitfalls of Mass Spectrometry Based Metabolome Profiling in Systems Biology. Int. J. Mol. Sci. 2016, 17, 632. [Google Scholar] [CrossRef]
  21. Covington, B.C.; McLean, J.A.; Bachmann, B.O. Comparative mass spectrometry-based metabolomics strategies for the investigation of microbial secondary metabolites. Nat. Prod. Rep. 2017, 34, 6–24. [Google Scholar] [CrossRef] [PubMed]
  22. Krug, D.; Müller, R. Secondary metabolomics: The impact of mass spectrometry-based approaches on the discovery and characterization of microbial natural products. Nat. Prod. Rep. 2014, 31, 768–783. [Google Scholar] [CrossRef] [PubMed]
  23. Wolfender, J.-L.; Nuzillard, J.-M.; van der Hooft, J.J.J.; Renault, J.-H.; Bertrand, S. Accelerating Metabolite Identification in Natural Product Research: Toward an Ideal Combination of Liquid Chromatography—High- Resolution Tandem Mass Spectrometry and NMR Profiling, in Silico Databases, and Chemometrics. Anal. Chem. 2018, 91, 704–742. [Google Scholar] [CrossRef] [PubMed]
  24. Traxler, M.F.; Watrous, J.D.; Alexandrov, T.; Dorrestein, P.C.; Kolter, R. Interspecies Interactions Stimulate Diversification of the Streptomyces coelicolor Secreted Metabolome. MBio 2013, 4, 1–12. [Google Scholar] [CrossRef] [PubMed]
  25. Yang, Y.-L.; Xu, Y.; Kersten, R.D.; Liu, W.-T.; Meehan, M.J.; Moore, B.S.; Bandeira, N.; Dorrestein, P.C. Connecting Chemotypes and Phenotypes of Cultured Marine Microbial Assemblages by Imaging Mass Spectrometry. Angew. Chem. Int. Ed. Engl. 2011, 50, 5839–5842. [Google Scholar] [CrossRef]
  26. Hou, Y.; Braun, D.R.; Michel, C.R.; Klassen, J.L.; Adnani, N.; Wyche, T.P.; Bugni, T.S. Microbial strain prioritization using metabolomics tools for the discovery of natural products. Anal. Chem. 2012, 84, 4277–4283. [Google Scholar] [CrossRef] [PubMed]
  27. Chanana, S.; Thomas, C.; Braun, D.; Hou, Y.; Wyche, T.; Bugni, T. Natural Product Discovery Using Planes of Principal Component Analysis in R (PoPCAR). Metabolites 2017, 7, 34. [Google Scholar] [CrossRef] [PubMed]
  28. Nguyen, D.D.; Wu, C.H.; Moree, W.J.; Lamsa, A.; Medema, M.H.; Zhao, X.; Gavilan, R.G.; Aparicio, M.; Atencio, L.; Jackson, C.; et al. MS/MS networking guided analysis of molecule and gene cluster families. Proc. Natl. Acad. Sci. USA 2013, 110, E2611–E2620. [Google Scholar] [CrossRef] [Green Version]
  29. Wang, M.; Carver, J.J.; Phelan, V.V.; Sanchez, L.M.; Garg, N.; Peng, Y.; Nguyen, D.D.; Watrous, J.; Kapono, C.A.; Luzzatto-Knaan, T.; et al. Sharing and community curation of mass spectrometry data with Global Natural Products Social Molecular Networking. Nat. Biotechnol. 2016, 34, 828–837. [Google Scholar] [CrossRef] [Green Version]
  30. De Jong, F.A.; Beecher, C. Addressing the current bottlenecks of metabolomics: Isotopic Ratio Outlier Analysis™, an isotopic-labeling technique for accurate biochemical profiling. Bioanalysis 2012, 4, 2303–2314. [Google Scholar] [CrossRef]
  31. Clendinen, C.S.; Stupp, G.S.; Wang, B.; Garrett, T.J.; Edison, A.S. 13C Metabolomics: NMR and IROA for Unknown Identification. Curr. Metab. 2016, 4, 116–120. [Google Scholar] [CrossRef] [PubMed] [Green Version]
  32. Stupp, G.S.; Clendinen, C.S.; Ajredini, R.; Szewc, M.A.; Garrett, T.J.; Menger, R.F.; Yost, R.A.; Beecher, C.; Edison, A.S. Isotopic Ratio Outlier Analysis Global Metabolomics of Caenorhabditis elegans. Anal. Chem. 2013, 85, 11858–11865. [Google Scholar] [CrossRef] [PubMed]
  33. Qiu, Y.; Moir, R.; Willis, I.; Beecher, C.; Tsai, Y.-H.; Garrett, T.J.; Yost, R.A.; Kurland, I.J. Isotopic Ratio Outlier Analysis of the S. cerevisiae Metabolome Using Accurate Mass Gas Chromatography/Time-of-Flight Mass Spectrometry: A New Method for Discovery. Anal. Chem. 2016, 88, 2747–2754. [Google Scholar] [CrossRef] [PubMed]
  34. Qiu, Y.; Moir, R.; Willis, I.; Seethapathy, S.; Biniakewitz, R.; Kurland, I. Enhanced Isotopic Ratio Outlier Analysis (IROA) Peak Detection and Identification with Ultra-High Resolution GC-Orbitrap/MS: Potential Application for Investigation of Model Organism Metabolomes. Metabolites 2018, 8, 9. [Google Scholar] [CrossRef] [PubMed]
  35. Vinayavekhin, N.; Saghatelian, A. Regulation of Alkyl-dihydrothiazole-carboxylates (ATCs) by Iron and the Pyochelin Gene Cluster in Pseudomonas aeruginosa. ACS Chem. Biol. 2009, 4, 617–623. [Google Scholar] [CrossRef] [PubMed]
  36. Sun, H.; Lapidus, A.; Nolan, M.; Lucas, S.; Del Rio, T.G.; Tice, H.; Cheng, J.-F.; Tapia, R.; Han, C.; Goodwin, L.; et al. Complete genome sequence of Nocardiopsis dassonvillei type strain (IMRU 509T). Stand. Genom. Sci. 2010, 3, 325–336. [Google Scholar] [CrossRef] [PubMed]
  37. Li, H.W.; Zhi, X.Y.; Yao, J.C.; Zhou, Y.; Tang, S.K.; Klenk, H.P.; Zhao, J.; Li, W.J. Comparative genomic analysis of the genus Nocardiopsis provides new insights into its genetic mechanisms of environmental adaptability. PLoS ONE 2013, 8, e61528. [Google Scholar] [CrossRef] [PubMed]
  38. Giessen, T.W.; von Tesmar, A.M.; Marahiel, M.A. Insights into the generation of structural diversity in a tRNA-dependent pathway for highly modified bioactive cyclic dipeptides. Chem. Biol. 2013, 20, 828–838. [Google Scholar] [CrossRef] [PubMed]
  39. Jolliffe, I.T. Principal Component Analysis, 2nd ed.; Springer: New York, NY, USA, 2002. [Google Scholar]
  40. Kam Ho, T. The Random Subspace Method for Constructing Decision Forests. IEEE Trans. Pattern Anal. 1998, 20, 832–844. [Google Scholar] [CrossRef]
  41. Schwyn, B.; Neilands, J.B. Universal Chemical Assay for the Detection and Determination of Siderophores. Anal. Biochem. 1986, 160, 47–56. [Google Scholar] [CrossRef]
  42. Guo, Y.-C.; Cao, S.-X.; Zong, X.-K.; Liao, X.-C.; Zhao, Y.-F. ESI-MSn study on the fragmentation of protonated cyclic-dipeptides. Spectrosc. Int. J. 2009, 23, 131–139. [Google Scholar] [CrossRef]
  43. Klementz, D.; Doring, K.; Lucas, X.; Telukunta, K.K.; Erxleben, A.; Deubel, D.; Erber, A.; Santillana, I.; Thomas, O.S.; Bechthold, A.; et al. StreptomeDB 2.0—An extended resource of natural products produced by streptomycetes. Nucleic Acids Res. 2016, 44, D509–D514. [Google Scholar] [CrossRef] [PubMed]
  44. Hider, R.C.; Kong, X. Chemistry and biology of siderophores. Nat. Prod. Rep. 2010, 27, 637–657. [Google Scholar] [CrossRef] [PubMed]
  45. Barona-Gomez, F.; Wong, U.; Giannakopulos, A.E.; Derrick, P.J.; Challis, G.L. Identification of a cluster of genes that directs desferrioxamine biosynthesis in Streptomyces coelicolor M145. J. Am. Chem. Soc. 2004, 126, 16282–16283. [Google Scholar] [CrossRef] [PubMed]
Figure 1. Overview of isotopic ratio outlier analysis (IROA) experimental approach for detecting metabolites whose production is upregulated, downregulated, or exclusive to treatments or controls. This approach was used to evaluate impacts of 2,2′-bipyridyl (bipy) on the N. dassonvillei metabolome. Bipyridyl treatment (n = 4, T12C) and no-bipyridyl control (n = 4, C12C) bacteria were fermented in uniformly 95:5 12C:13C-labeled media alongside equivalent standard cultures in 5:95 12C:13C-labeled media. Standard cultures were then pooled to provide an internal standard (IS) mixture containing 13C-labeled isotopes of every metabolite from T12C or C12C. Each T12C and C12C culture was supplemented with this IS before chemical extraction and UHPLC/MS. The ratio of C12C (blue) or T12C (green) MS signal integrals to corresponding IS signals (magenta) was determined. Statistical comparison of these C12C:IS and T12C:IS ratios enabled determination of metabolites whose production was impacted by bipyridyl treatment. Evaluation of the m/z difference between monoisotopic 12C- and 13C-labeled metabolites indicated the number of carbon atoms in each molecule, as illustrated by the IROA peak pair for leucine from N. dassonvillei.
Metabolites 09 00181 g001
Figure 2. Multivariate analyses of bipyridyl treatment and no-bipyridyl control N. dassonvillei metabolomes. (A) A two-dimensional principal component analysis (PCA) score plot supported impacts of bipyridyl on the N. dassonvillei metabolome. Data points corresponding to controls are in red (S001–S004) and are differentiated from light blue data points corresponding to treatments (S005–S008). (B) A scree plot of PCA component variances supported that PC1–PC2 account for most of the deviation between treatment and control groups. (C) A multidimensional scaling plot of proximity matrix from random forest (RF) segregated treatment and control samples. X- and y-axes indicate multidimensional scaling coordinates, and data points are colored as in (A). (D) RF variable importance plot of 40 metabolites contributing most toward RF separation of groups. Annotated metabolites associated with amino acid metabolism, based on the KEGG database, are named in green. Previously reported secondary metabolites are named in red, and novel putative molecular formulae with >10 C are in purple. Blue data points indicate metabolites that decreased in response to bipyridyl, and orange indicates metabolites whose abundance increased in response to this iron chelator.
Metabolites 09 00181 g002
Figure 3. Evaluation of N. dassonvillei biomass and siderophore titer changes in response to fermentation in bipyridyl-containing media for seven days. (A) Dry mass of cell pellets from N. dassonvillei treatments fermented in 50 mL media with bipyridyl relative to controls fermented without bipyridyl. An unpaired t-test (n = 4) revealed p = 0.23. (B) Comparison of siderophore activity across chemical extracts from N. dassonvillei culture types and media only controls. Decreased absorbance at 630 nm corresponds to increased siderophore concentration, as illustrated by desferrioxamine B positive controls (brown triangles). Blue squares denote activity of extracts from control N. dassonvillei grown in media without bipyridyl, while red circles indicate activity of N. dassonvillei treatments fermented with bipyridyl. These treatment extracts were markedly more active than those from bipyridyl-containing media only controls (orange triangles), supporting that N. dassonvillei produces siderophores. Comparable activities were observed for treatment extracts (red circles) and extracts formed by mixing extracts from bipyridyl-containing media with bipyridyl-free N. dassonvillei cultures (purple diamonds), suggesting that bipyridyl treatment does not dramatically upregulate siderophore production. Error bars indicate standard deviation for n = 4 replicates.
Metabolites 09 00181 g003
Figure 4. Application of IROA metabolomics for evaluating impacts of small molecules on targeted natural product biosynthetic pathways. Impacts of bipyridyl on N. dassonvillei production of DKPs 1–10 were evaluated. (A) The previously reported biosynthetic pathway for 1–10 includes aminoacyl tRNA synthetase (AARS)-catalyzed ligation of amino acids with tRNAs, followed by cyclodipeptide synthase (CDPS)-catalyzed formation of DKPs 1, 3, and 6 from different combinations of aminoacyl-tRNAs. Tailoring of these DKP intermediates by a cyclic dipeptide oxidase (CDO) and/or methyltransferase (MT) leads to final products 2, 5, and 10 [38]. (B) LC/MS2 supported identification of each DKP from N. dassonvillei extracts. Comparison of MS2 fragments for 1, 3, and 6 from N. dassonvillei with synthetic standards supported their identification, while dehydrogenated and/or methylated derivatives were confirmed by correspondence between observed fragments shown in color with literature values [38,42]. (C) Heatmap of mean (n = 4) log2 fold changes in abundance of DKP pathway metabolites in response to bipyridyl. From left-to-right, the heatmap is arranged in the order of precursors leading to final DKPs 2, 5, and 10. Map fields marked with “X” indicate metabolites not required for production of the final DKP indicated in that row, fields in gray indicate previously reported pathway intermediates that were not detected in our experiments, and numbers superimposed within the heatmap correspond to compound numbers from (A). Xaa and Yaa indicate Phe, Leu, or Tyr residues of DKPs.
Metabolites 09 00181 g004aMetabolites 09 00181 g004b
Table 1. Summary of N. dassonvillei metabolome revealed by IROA UHPLC/MS. IROA peak pair refers to a pair of molecular ion signals corresponding to a 12C-labeled metabolite from T12C and/or C12C and its isotopic 13C-labeled IS. Metabolite identities were proposed from agreement between molecular ion exact masses, IROA-determined number of carbon atoms, and retention times with compounds from a standard library.
ESI Mode
PositiveNegativeTotal
IROA peak pairs detected1243891332
Identified metabolites8522107

