Oxylipin Profiling of Alzheimer’s Disease in Nondiabetic and Type 2 Diabetic Elderly

 , , and
Abstract
1. Introduction
2. Results
3. Discussion
4. Materials and Methods
4.1. Metabolic and Cognitive Characterization
4.2. Measurement of Serum Non-Esterified Oxylipins
4.3. Statistical Analyses
4.3.1. Pre-Processing of Data.
4.3.2. Univariate and Multivariate Assessments.
Supplementary Materials
Author Contributions
Funding
Acknowledgments
Conflicts of Interest
References
- Gilroy, D.W.; Edin, M.L.; De Maeyer, R.P.; Bystrom, J.; Newson, J.; Lih, F.B.; Stables, M.; Zeldin, D.C.; Bishop-Bailey, D. CYP450-derived oxylipins mediate inflammatory resolution. Proc. Natl. Acad. Sci. USA 2016, 113, E3240–E3249. [Google Scholar] [CrossRef]
- Gartung, A.; Zhao, J.; Chen, S.; Mottillo, E.; VanHecke, G.C.; Ahn, Y.H.; Maddipati, K.R.; Sorokin, A.; Granneman, J.; Lee, M.J. Characterization of Eicosanoids Produced by Adipocyte Lipolysis: Implication of Cyclooxygenase-2 in Adipose Inflammation. J. Biol. Chem. 2016, 291, 16001–16010. [Google Scholar] [CrossRef]
- Dasilva, G.; Pazos, M.; Garcia-Egido, E.; Gallardo, J.M.; Ramos-Romero, S.; Torres, J.L.; Romeu, M.; Nogues, M.R.; Medina, I. A lipidomic study on the regulation of inflammation and oxidative stress targeted by marine omega-3 PUFA and polyphenols in high-fat high-sucrose diets. J. Nutr. Biochem. 2017, 43, 53–67. [Google Scholar] [CrossRef]
- Liu, X.; Moon, S.H.; Jenkins, C.M.; Sims, H.F.; Gross, R.W. Cyclooxygenase-2 Mediated Oxidation of 2-Arachidonoyl-Lysophospholipids Identifies Unknown Lipid Signaling Pathways. Cell Chem. Biol. 2016, 23, 1217–1227. [Google Scholar] [CrossRef]
- Akiyama, H.; Barger, S.; Barnum, S.; Bradt, B.; Bauer, J.; Cole, G.M.; Cooper, N.R.; Eikelenboom, P.; Emmerling, M.; Fiebich, B.L.; et al. Inflammation and Alzheimer’s disease. Neurobiol. Aging 2000, 21, 383–421. [Google Scholar] [CrossRef]
- Barzilay, J.I.; Abraham, L.; Heckbert, S.R.; Cushman, M.; Kuller, L.H.; Resnick, H.E.; Tracy, R.P. The Relation of Markers of Inflammation to the Development of Glucose Disorders in the Elderly: The Cardiovascular Health Study. Diabetes 2001, 50, 2384–2389. [Google Scholar] [CrossRef]
- Drake, J.; Link, C.D.; Butterfield, D.A. Oxidative stress precedes fibrillar deposition of Alzheimer’s disease amyloid beta-peptide (1-42) in a transgenic Caernorhabditis elegans. Neurobiol. Aging 2003, 24, 415–420. [Google Scholar] [CrossRef]
- Iadecola, C. Neurovascular regulation in the normal brain and in Alzheimer’s disease. Nat. Rev. Neurosci. 2004, 5, 347–360. [Google Scholar] [CrossRef]
- Grapov, D.; Adams, S.H.; Pedersen, T.L.; Garvey, W.T.; Newman, J.W. Type 2 diabetes associated changes in the plasma non-esterified fatty acids, oxylipins and endocannabinoids. PLoS ONE 2012, 7, e48852. [Google Scholar] [CrossRef]
- Akkaya, C.; Yavuzer, S.S.; Yavuzer, H.; Erkol, G.; Bozluolcay, M.; Dincer, Y. DNA damage, DNA susceptibility to oxidation and glutathione redox status in patients with Alzheimer’s disease treated with and without memantine. J. Neurol. Sci. 2017, 378, 158–162. [Google Scholar] [CrossRef]
- Smith, C.D.; Carney, J.M.; Starke-Reed, P.E.; Oliver, C.N.; Stadtman, E.R.; Floyd, R.A.; Markesbery, W.R. Excess brain protein oxidation and enzyme dysfunction in normal aging and in Alzheimer disease. Proc. Natl. Acad. Sci. USA 1991, 88, 10540–10543. [Google Scholar] [CrossRef]
- Bradley-Whitman, M.A.; Lovell, M.A. Biomarkers of lipid peroxidation in Alzheimer disease (AD): An update. Arch. Toxicol. 2015, 89, 1035–1044. [Google Scholar] [CrossRef]
- Lu, T.; Aron, L.; Zullo, J.; Pan, Y.; Kim, H.; Chen, Y.; Yang, T.H.; Kim, H.M.; Drake, D.; Liu, X.S.; et al. REST and stress resistance in ageing and Alzheimer’s disease. Nature 2014, 507, 448–454. [Google Scholar] [CrossRef]
- Morris, J.K.; Piccolo, B.D.; Shankar, K.; Thyfault, J.P.; Adams, S.H. The serum metabolomics signature of type 2 diabetes is obscured in Alzheimer’s disease. Am. J. Physiol. Endocrinol. Metab. 2018, 314, E584–E596. [Google Scholar] [CrossRef]
- Shin, E.; Yeo, E.; Lim, J.; Chang, Y.H.; Park, H.; Shim, E.; Chung, H.; Hwang, H.J.; Chun, J.; Hwang, J. Nitrooleate mediates nitric oxide synthase activation in endothelial cells. Lipids 2014, 49, 457–466. [Google Scholar] [CrossRef]
- Panati, K.; Subramani, P.A.; Reddy, M.M.; Derangula, M.; Arva Tatireddigari, V.R.R.; Kolliputi, N.; Narala, V.R. The nitrated fatty acid, 10-nitrooleate inhibits the neutrophil chemotaxis via peroxisome proliferator-activated receptor gamma in CLP-induced sepsis in mice. Int. Immunopharmacol. 2019, 72, 159–165. [Google Scholar] [CrossRef]
- Reddy, A.T.; Lakshmi, S.P.; Dornadula, S.; Pinni, S.; Rampa, D.R.; Reddy, R.C. The nitrated fatty acid 10-nitro-oleate attenuates allergic airway disease. J. Immunol. 2013, 191, 2053–2063. [Google Scholar] [CrossRef]
- Rudolph, V.; Rudolph, T.K.; Schopfer, F.J.; Bonacci, G.; Woodcock, S.R.; Cole, M.P.; Baker, P.R.; Ramani, R.; Freeman, B.A. Endogenous generation and protective effects of nitro-fatty acids in a murine model of focal cardiac ischaemia and reperfusion. Cardiovasc. Res. 2010, 85, 155–166. [Google Scholar] [CrossRef]
- Hercule, H.C.; Schunck, W.H.; Gross, V.; Seringer, J.; Leung, F.P.; Weldon, S.M.; da Costa Goncalves ACh Huang, Y.; Luft, F.C.; Gollasch, M. Interaction between P450 eicosanoids and nitric oxide in the control of arterial tone in mice. Arterioscler. Thromb. Vasc. Biol. 2009, 29, 54–60. [Google Scholar] [CrossRef]
- Hercule, H.C.; Salanova, B.; Essin, K.; Honeck, H.; Falck, J.R.; Sausbier, M.; Ruth, P.; Schunck, W.H.; Luft, F.C.; Gollasch, M. The vasodilator 17,18-epoxyeicosatetraenoic acid targets the pore-forming BK alpha channel subunit in rodents. Exp. Physiol. 2007, 92, 1067–1076. [Google Scholar] [CrossRef]
- Catella, F.; Lawson, J.A.; Fitzgerald, D.J.; FitzGerald, G.A. Endogenous biosynthesis of arachidonic acid epoxides in humans: Increased formation in pregnancy-induced hypertension. Proc. Natl. Acad. Sci. USA 1990, 87, 5893–5897. [Google Scholar] [CrossRef]
- Caligiuri, S.P.B.; Aukema, H.M.; Ravandi, A.; Lavallee, R.; Guzman, R.; Pierce, G.N. Specific plasma oxylipins increase the odds of cardiovascular and cerebrovascular events in patients with peripheral artery disease. Can. J. Physiol. Pharmacol. 2017, 95, 961–968. [Google Scholar] [CrossRef]
- Zhang, Y.; Guallar, E.; Blasco-Colmenares, E.; Harms, A.C.; Vreeken, R.J.; Hankemeier, T.; Tomaselli, G.F.; Cheng, A. Serum-Based Oxylipins Are Associated with Outcomes in Primary Prevention Implantable Cardioverter Defibrillator Patients. PLoS ONE 2016, 11, e0157035. [Google Scholar] [CrossRef]
- Markworth, J.F.; Vella, L.; Lingard, B.S.; Tull, D.L.; Rupasinghe, T.W.; Sinclair, A.J.; Maddipati, K.R.; Cameron-Smith, D. Human inflammatory and resolving lipid mediator responses to resistance exercise and ibuprofen treatment. Am. J. Physiol. Regul. Integr. Comp. Physiol. 2013, 305, R1281–R1296. [Google Scholar] [CrossRef]
- VanRollins, M. Epoxygenase metabolites of docosahexaenoic and eicosapentaenoic acids inhibit platelet aggregation at concentrations below those affecting thromboxane synthesis. J. Pharmacol. Exp. Ther. 1995, 274, 798–804. [Google Scholar]
- Miller, C.; Yamaguchi, R.Y.; Ziboh, V.A. Guinea pig epidermis generates putative anti-inflammatory metabolites from fish oil polyunsaturated fatty acids. Lipids 1989, 24, 998–1003. [Google Scholar] [CrossRef]
- Gonzalez-Periz, A.; Planaguma, A.; Gronert, K.; Miquel, R.; Lopez-Parra, M.; Titos, E.; Horrillo, R.; Ferré, N.; Deulofeu, R.; Arroyo, V.; et al. Docosahexaenoic acid (DHA) blunts liver injury by conversion to protective lipid mediators: Protectin D1 and 17S-hydroxy-DHA. FASEB J. 2006, 20, 2537–2539. [Google Scholar] [CrossRef]
- Whiley, L.; Sen, A.; Heaton, J.; Proitsi, P.; Garcia-Gomez, D.; Leung, R.; Smith, N.; Thambisetty, M.; Kloszewska, I.; Mecocci, P. Evidence of altered phosphatidylcholine metabolism in Alzheimer’s disease. Neurobiol. Aging 2014, 35, 271–278. [Google Scholar] [CrossRef]
- Snowden, S.G.; Ebshiana, A.A.; Hye, A.; An, Y.; Pletnikova, O.; O’Brien, R.; Troncoso, J.; Legido-Quigley, C.; Thambisetty, M. Association between fatty acid metabolism in the brain and Alzheimer disease neuropathology and cognitive performance: A nontargeted metabolomic study. PLoS MED 2017, 14, e1002266. [Google Scholar] [CrossRef]
- Nasaruddin, M.L.; Holscher, C.; Kehoe, P.; Graham, S.F.; Green, B.D. Wide-ranging alterations in the brain fatty acid complement of subjects with late Alzheimer’s disease as detected by GC-MS. Am. J. Transl. Res. 2016, 8, 154–165. [Google Scholar]
- Fuller, K.N.Z.; Miranda, E.R.; Thyfault, J.P.; Morris, J.K.; Haus, J.M. Metabolic Derangements Contribute to Reduced sRAGE Isoforms in Subjects with Alzheimer’s Disease. Mediators Inflamm. 2018, 2018, 2061376. [Google Scholar] [CrossRef]
- Pullerits, R.; Bokarewa, M.; Dahlberg, L.; Tarkowski, A. Decreased levels of soluble receptor for advanced glycation end products in patients with rheumatoid arthritis indicating deficient inflammatory control. Arthritis Res. Ther. 2005, 7, R817–R824. [Google Scholar] [CrossRef]
- Ott, A.; Stolk, R.P.; van Harskamp, F.; Pols, H.A.P.; Hofman, A.; Breteler, M.M.B. Diabetes mellitus and the risk of dementia: The Rotterdam Study. Neurology 1999, 53, 1937. [Google Scholar] [CrossRef]
- Arvanitakis, Z.; Wilson, R.S.; Bienias, J.L.; Evans, D.A.; Bennett, D.A. Diabetes Mellitus and Risk of Alzheimer Disease and Decline in Cognitive Function. Arch. Neurol. 2004, 61, 661–666. [Google Scholar] [CrossRef]
- Harris, T.R.; Hammock, B.D. Soluble epoxide hydrolase: Gene structure, expression and deletion. Gene 2013, 526, 61–74. [Google Scholar] [CrossRef]
- Roman, R.J. P-450 metabolites of arachidonic acid in the control of cardiovascular function. Physiol. Rev. 2002, 82, 131–185. [Google Scholar] [CrossRef]
- Konkel, A.; Schunck, W.H. Role of cytochrome P450 enzymes in the bioactivation of polyunsaturated fatty acids. Biochim. Biophys. Acta 2011, 1814, 210–222. [Google Scholar] [CrossRef]
- Gao, Y. 8.4 EDH. In Biology of Vascular Smooth Muscle: Vasoconstriction and Dilatation; Springer: New York, NY, USA, 2017; p. 105. [Google Scholar]
- Schuchardt, J.P.; Schmidt, S.; Kressel, G.; Willenberg, I.; Hammock, B.D.; Hahn, A.; Schebb, N.H. Modulation of blood oxylipin levels by long-chain omega-3 fatty acid supplementation in hyper- and normolipidemic men. Prostaglandins Leukot. Essent. Fatty Acids 2014, 90, 27–37. [Google Scholar] [CrossRef]
- Ajith, T.A. A Recent Update on the Effects of Omega-3 Fatty Acids in Alzheimer’s Disease. Curr. Clin. Pharmacol. 2018, 13, 252–260. [Google Scholar] [CrossRef]
- Morris, J.K.; Honea, R.A.; Vidoni, E.D.; Swerdlow, R.H.; Burns, J.M. Is Alzheimer’s disease a systemic disease? Biochim. Biophys. Acta 2014, 1842, 1340–1349. [Google Scholar] [CrossRef]
- Tajima, Y.; Ishikawa, M.; Maekawa, K.; Murayama, M.; Senoo, Y.; Nishimaki-Mogami, T.; Nakanishi, H.; Ikeda, K.; Arita, M.; Taguchi, R.; et al. Lipidomic analysis of brain tissues and plasma in a mouse model expressing mutated human amyloid precursor protein/tau for Alzheimer’s disease. Lipids Health Dis. 2013, 12, 68. [Google Scholar] [CrossRef]
- Imig, J.D.; Navar, L.G.; Roman, R.J.; Reddy, K.K.; Falck, J.R. Actions of epoxygenase metabolites on the preglomerular vasculature. J. Am. Soc. Nephrol. 1996, 7, 2364–2370. [Google Scholar]
- Yu, Z.; Xu, F.; Huse, L.M.; Morisseau, C.; Draper, A.J.; Newman, J.W.; Parker, C.; Graham, L.; Engler, M.M.; Hammock, B.D.; et al. Soluble epoxide hydrolase regulates hydrolysis of vasoactive epoxyeicosatrienoic acids. Circ. Res. 2000, 87, 992–998. [Google Scholar] [CrossRef]
- Oltman, C.L.; Weintraub, N.L.; VanRollins, M.; Dellsperger, K.C. Epoxyeicosatrienoic acids and dihydroxyeicosatrienoic acids are potent vasodilators in the canine coronary microcirculation. Circ. Res. 1998, 83, 932–939. [Google Scholar] [CrossRef]
- Okonkwo, O.C.; Cohen, R.A.; Gunstad, J.; Tremont, G.; Alosco, M.L.; Poppas, A. Longitudinal trajectories of cognitive decline among older adults with cardiovascular disease. Cerebrovasc. Dis. 2010, 30, 362–373. [Google Scholar] [CrossRef]
- Tejera, N.; Boeglin, W.E.; Suzuki, T.; Schneider, C. COX-2-dependent and -independent biosynthesis of dihydroxy-arachidonic acids in activated human leukocytes. J. Lipid Res. 2012, 53, 87–94. [Google Scholar] [CrossRef]
- de Vries, M.A.; Alipour, A.; Klop, B.; van de Geijn, G.J.; Janssen, H.W.; Njo, T.L.; van der Meulen, N.; Rietveld, A.P.; Liem, A.H.; Westerman, E.M.; et al. Glucose-dependent leukocyte activation in patients with type 2 diabetes mellitus, familial combined hyperlipidemia and healthy controls. Metabolism 2015, 64, 213–217. [Google Scholar] [CrossRef]
- Yamada, H.; Kikuchi, S.; Hakozaki, M.; Motodate, K.; Nagahora, N. 8-Hydroxyeicosapentaenoic Acid Decreases Plasma and Hepatic Triglycerides via Activation of Peroxisome Proliferator-Activated Receptor Alpha in High-Fat Diet-Induced Obese Mice. J. Lipids 2016, 2016, 7498508. [Google Scholar] [CrossRef]
- O’Flaherty, J.T.; Rogers, L.C.; Paumi, C.M.; Hantgan, R.R.; Thomas, L.R.; Clay, C.E.; High, K.; Chen, Y.Q.; Willingham, M.C.; Smitherman, P.K.; et al. 5-Oxo-ETE analogs and the proliferation of cancer cells. Biochim. Biophys. Acta 2005, 1736, 228–236. [Google Scholar] [CrossRef]
- Heppner, F.L.; Ransohoff, R.M.; Becher, B. Immune attack: The role of inflammation in Alzheimer disease. Nat. Rev. Neurosci. 2015, 16, 358–372. [Google Scholar] [CrossRef]
- Croset, M.; Sala, A.; Folco, G.; Lagarde, M. Inhibition by lipoxygenase products of TXA2-like responses of platelets and vascular smooth muscle. 14-Hydroxy from 22:6n-3 is more potent than 12-HETE. Biochem. Pharmacol. 1988, 37, 1275–1280. [Google Scholar] [CrossRef]
- Lagarde, M.; Guichardant, M.; Bernoud-Hubac, N.; Calzada, C.; Vericel, E. Oxygenation of polyunsaturated fatty acids and oxidative stress within blood platelets. Biochim. Biophys. Acta Mol. Cell Biol. Lipids 2018, 1863, 651–656. [Google Scholar] [CrossRef]
- Agrawal, K.; Hassoun, L.A.; Foolad, N.; Pedersen, T.L.; Sivamani, R.K.; Newman, J.W. Sweat lipid mediator profiling: A noninvasive approach for cutaneous research. J. Lipid Res. 2017, 58, 188–195. [Google Scholar] [CrossRef]
- Strassburg, K.; Huijbrechts, A.M.; Kortekaas, K.A.; Lindeman, J.H.; Pedersen, T.L.; Dane, A.; Berger, R.; Brenkman, A.; Hankemeier, T.; van Duynhoven, J.; et al. Quantitative profiling of oxylipins through comprehensive LC-MS/MS analysis: Application in cardiac surgery. Anal. Bioanal. Chem. 2012, 404, 1413–1426. [Google Scholar] [CrossRef]
- Benjamini, H. Controlling the false discovery rate: A practical and powerful approach to multiple testing. J. R. Stat. Soc. 1995, 57, 289–300. [Google Scholar] [CrossRef]
- Mehmood, T.; Hovde Liland, K.; Snipen, L.; Sæbø, S. A review of variable selection methods in Partial Least Squares Regression. Chemom. Intell. Lab. Syst. 2012, 118, 62–69. [Google Scholar] [CrossRef]
- Mevik, B.-H.; Wehrens, R.; Liland, K.H. Partial Least Squares and Principal Component Regression. R Package, Version 2.7-1. Available online: https://CRAN.R-project.org/package=pls (accessed on 6 September 2018).
- Wing, J.; Weston, S.; Williams, A.; Keefer, C.; Engelhardt, A.; Cooper, T.; Mayer, Z.; Kenkel, B.; Benesty, M.; Lescarbeau, R.; et al. Caret: Classification and Regression Training. R Package Version 6.0-81. Available online: https://CRAN.R-project.org/package=caret (accessed on 6 September 2018).
- Davison, A.C.; Hinkley, D.V. Bootstrap Methods and Their Applications; Cambridge University Press: Cambridge, UK, 1997; ISBN 0-521-57391-2. [Google Scholar]
- Canty, A.; Ripley, B. Boot: Bootstrap R (S-Plus) Functions. R Package, version 1.3-20. 2017. Available online: https://astrostatistics.psu.edu/su07/R/html/boot/html/00Index.html (accessed on 3 September 2019).


| Metabolites 1 | Cognitively Healthy (n = 39) 2 | Alzheimer’s Disease (n = 39) 2 | P 3 | FDR 4 | Sub-Class | Fatty Acid Precursor |
|---|---|---|---|---|---|---|
| Total Fatty Acid Alcohol | 209 (110, 490) | 267 (140, 500) | 0.295 | 0.965 | Fatty Acid Alcohol | - |
| 14-HDoHE | 22.9 (8.3, 52) | 25.9 (14, 53) | 0.376 | 0.965 | Fatty Acid Alcohol | C22:6n3 |
| 12S-HETE | 93.8 (39, 220) | 119 (46, 250) | 0.386 | 0.965 | Fatty Acid Alcohol | C20:4n6 |
| 9-HOTE | 1.21 (0.82, 2.1) | 1.13 (0.81, 1.7) | 0.470 | 0.965 | Fatty Acid Alcohol | C18:3n3 |
| 17-HDoHE | 1.72 (1.1, 3.1) | 1.91 (1.4, 3.1) | 0.471 | 0.965 | Fatty Acid Alcohol | C22:6n3 |
| 5S-HEPE | 0.553 (0.37, 0.93) | 0.563 (0.35, 0.75) | 0.486 | 0.965 | Fatty Acid Alcohol | C20:5n3 |
| 11-HETE | 1.53 (0.92, 2.2) | 1.41 (0.89, 2.1) | 0.580 | 0.965 | Fatty Acid Alcohol | C20:4n6 |
| 13-HOTE | 1.96 (1.3, 3) | 1.88 (1.4, 2.6) | 0.580 | 0.965 | Fatty Acid Alcohol | C18:3n3 |
| 9-HODE | 17.8 (14, 35) | 19 (15, 24) | 0.643 | 0.965 | Fatty Acid Alcohol | C18:2n6 |
| 5-HETE | 3.72 (2.7, 4.8) | 3.75 (3.3, 4.5) | 0.668 | 0.965 | Fatty Acid Alcohol | C20:4n6 |
| 15-HETE | 3.1 (2.2, 5.4) | 3.68 (2.4, 5) | 0.681 | 0.965 | Fatty Acid Alcohol | C20:4n6 |
| 12S-HEPE | 5.72 (2, 12) | 5 (2.3, 13) | 0.695 | 0.965 | Fatty Acid Alcohol | C20:5n3 |
| 15-HEPE | 0.313 (0.21, 0.65) | 0.369 (0.21, 0.56) | 0.762 | 0.965 | Fatty Acid Alcohol | C20:5n3 |
| 9-HEPE | 0.235 (0.17, 0.46) | 0.268 (0.16, 0.41) | 0.824 | 0.972 | Fatty Acid Alcohol | C20:5n3 |
| 8S-HETE | 0.907 (0.62, 1.3) | 0.876 (0.68, 1.3) | 0.908 | 0.972 | Fatty Acid Alcohol | C20:4n6 |
| 9-HETE | 0.879 (0.61, 1.2) | 0.864 (0.61, 1.3) | 0.915 | 0.972 | Fatty Acid Alcohol | C20:4n6 |
| 13S-HODE | 26.7 (19, 46) | 27.6 (20, 36) | 0.957 | 0.972 | Fatty Acid Alcohol | C18:2n6 |
| 4-HDoHE | 0.596 (0.32, 1.1) | 0.592 (0.4, 0.89) | 0.965 | 0.972 | Fatty Acid Alcohol | C22:6n3 |
| 14,15-DiHETrE | 0.633 (0.51, 0.77) | 0.738 (0.64, 0.89) | 0.021 | 0.510 | Fatty Acid Diol | C18:3n3 |
| 11,12-DiHETrE | 0.509 (0.41, 0.62) | 0.599 (0.46, 0.75) | 0.027 | 0.510 | Fatty Acid Diol | C20:4n6 |
| 5,6-DiHETrE | 0.332 (0.23, 0.43) | 0.38 (0.3, 0.45) | 0.044 | 0.514 | Fatty Acid Diol | C20:4n6 |
| 8,9-DiHETrE | 0.296 (0.23, 0.38) | 0.367 (0.29, 0.42) | 0.045 | 0.514 | Fatty Acid Diol | C20:4n6 |
| LTB4 | 0.763 (0.49, 1.4) | 1.02 (0.68, 1.6) | 0.059 | 0.564 | Fatty Acid Diol | C20:4n6 |
| 19,20-DiHDPE | 1.55 (1.3, 2) | 1.74 (1.3, 2.6) | 0.155 | 0.930 | Fatty Acid Diol | - |
| 9,10-DiHODE | 0.182 (0.11, 0.27) | 0.26 (0.14, 0.34) | 0.163 | 0.930 | Fatty Acid Diol | C18:3n3 |
| 9,10-e-DiHO | 5.02 (4.2, 6) | 4.92 (4.2, 5.5) | 0.437 | 0.965 | Fatty Acid Diol | C18:0 |
| 17,18-DiHETE | 4.97 (2.9, 7.2) | 5.41 (3.2, 8.6) | 0.448 | 0.965 | Fatty Acid Diol | C20:5n3 |
| 6-trans-LTB4 | 0.209 (0.11, 0.29) | 0.214 (0.14, 0.35) | 0.596 | 0.965 | Fatty Acid Diol | C20:4n6 |
| 15,16-DiHODE | 6.52 (5.2, 9.6) | 7.43 (5.5, 11) | 0.646 | 0.965 | Fatty Acid Diol | C18:3n3 |
| 9,10-DiHOME | 3.08 (2.5, 4.2) | 3.2 (2.5, 4.4) | 0.701 | 0.965 | Fatty Acid Diol | C18:2n6 |
| Total Fatty Acid Diol | 30 (27, 32) | 28.3 (24, 36) | 0.872 | 0.972 | Fatty Acid Diol | - |
| 14,15-DiHETE | 0.605 (0.35, 0.92) | 0.548 (0.41, 0.81) | 0.931 | 0.972 | Fatty Acid Diol | C20:5n3 |
| 12(13)Ep-9-KODE | 5.35 (2, 11) | 4.22 (1.6, 9.4) | 0.471 | 0.965 | Fatty Acid Epoxide | C18:3n3 |
| 12(13)-EpOME | 2.04 (1.5, 3.1) | 2.38 (1.6, 3.2) | 0.580 | 0.965 | Fatty Acid Epoxide | C18:2n6 |
| Total Fatty Acid Epoxide | 15.4 (9.9, 23) | 12.5 (8.9, 23) | 0.580 | 0.965 | Fatty Acid Epoxide | - |
| 9,10-EpO | 1.35 (1.1, 1.7) | 1.31 (1.1, 1.6) | 0.621 | 0.965 | Fatty Acid Epoxide | C18:0 |
| 19(20)-EpDPE | 0.179 (0.14, 0.24) | 0.197 (0.14, 0.29) | 0.794 | 0.972 | Fatty Acid Epoxide | C22:6n3 |
| 9(10)-EpOME | 0.829 (0.57, 1.2) | 0.924 (0.65, 1.4) | 0.858 | 0.972 | Fatty Acid Epoxide | C18:2n6 |
| 15,16-EpODE | 1.33 (0.86, 1.9) | 1.39 (0.87, 2.2) | 0.922 | 0.972 | Fatty Acid Epoxide | C18:3n3 |
| Total Fatty Acid Ketone | 24.6 (20, 54) | 22.8 (14, 31) | 0.150 | 0.930 | Fatty Acid Ketone | - |
| 9-KODE | 14.5 (9.6, 28) | 13 (6.9, 20) | 0.168 | 0.930 | Fatty Acid Ketone | C18:2n6 |
| 15-KETE | 0.287 (0.18, 0.48) | 0.221 (0.15, 0.37) | 0.179 | 0.930 | Fatty Acid Ketone | C20:4n6 |
| 13-KODE | 5.87 (3.3, 12) | 4.26 (2.2, 8.5) | 0.252 | 0.965 | Fatty Acid Ketone | C18:2n6 |
| 5-KETE | 0.342 (0.25, 0.55) | 0.36 (0.24, 0.45) | 0.574 | 0.965 | Fatty Acid Ketone | C20:4n6 |
| 9,12,13-TriHOME | 3.68 (2.7, 4.3) | 3.54 (2.3, 4.7) | 0.735 | 0.965 | Fatty Acid Triol | C18:2n6 |
| 10-Nitrooleate | 1.46 (1.1, 2.3) | 1.2 (0.88, 1.6) | 0.026 | 0.510 | Nitro-fatty Acid | C18:1n9 |
| 6-keto-PGF1alpha | 0.22 (0.2, 0.24) | 0.213 (0.19, 0.23) | 0.315 | 0.965 | Prostanoid | C20:4n6 |
| PGF2alpha | 0.422 (0.25, 0.71) | 0.518 (0.29, 0.88) | 0.507 | 0.965 | Prostanoid | C20:4n6 |
| Total Prostanoid | 0.745 (0.62, 1.1) | 0.816 (0.6, 1.2) | 0.714 | 0.965 | Prostanoid | - |
| 15-deoxy PGJ2 | 0.115 (0.11, 0.12) | 0.114 (0.11, 0.12) | 0.727 | 0.965 | Prostanoid | C20:4n6 |
| TXB2 | 3.24 (0.16, 20) | 0.839 (0.2, 14) | 0.534 | 0.965 | Thromboid | C20:4n6 |
| Total C18:0 species | 6.49 (5.3, 7.1) | 6.14 (5.6, 6.9) | 0.456 | 0.965 | - | C18:0 |
| Total C18:2n6 species | 73.6 (58, 140) | 76.8 (56, 100) | 0.574 | 0.965 | - | C18:2n6 |
| Total C22:6n3 species | 45.3 (26, 98) | 37.8 (19, 83) | 0.723 | 0.965 | - | C22:6n3 |
| Total C20:5n3 species | 14.3 (8.9, 26) | 13.9 (9, 20) | 0.747 | 0.965 | - | C20:5n3 |
| Total C20:4n6 species | 184 (78, 390) | 138 (96, 290) | 0.888 | 0.972 | - | C20:4n6 |
| Total C18:3n3 species | 20.5 (13, 31) | 19.3 (14, 28) | 0.972 | 0.972 | - | C18:3n3 |
| Metabolites 1 | Cognitive Healthy (n = 22) 2 | Alzheimer’s Disease (n = 19) 2 | P 3 | FDR 4 | Sub-Class | Fatty Acid Precursor |
|---|---|---|---|---|---|---|
| 17-HDoHE | 1.57 (1.1, 2.2) | 3.22 (2.1, 4.5) | 0.014 | 0.523 | Fatty Acid Alcohol | C22:6n3 |
| Total Fatty Acid Alcohol | 228 (120, 290) | 421 (250, 690) | 0.041 | 0.523 | Fatty Acid Alcohol | - |
| 12S-HEPE | 4.06 (3.4, 8) | 6.94 (3.5, 27) | 0.156 | 0.697 | Fatty Acid Alcohol | C20:5n3 |
| 9-HODE | 20.1 (17, 26) | 18.2 (15, 24) | 0.237 | 0.697 | Fatty Acid Alcohol | C18:2n6 |
| 12S-HETE | 125 (49, 190) | 146 (86, 320) | 0.259 | 0.697 | Fatty Acid Alcohol | C20:4n6 |
| 15-HEPE | 0.242 (0.19, 0.55) | 0.357 (0.21, 0.83) | 0.270 | 0.697 | Fatty Acid Alcohol | C20:5n3 |
| 15-HETE | 3.67 (2.6, 4.4) | 3.78 (2.7, 6.5) | 0.281 | 0.697 | Fatty Acid Alcohol | C20:4n6 |
| 9-HEPE | 0.206 (0.14, 0.37) | 0.275 (0.14, 0.47) | 0.318 | 0.697 | Fatty Acid Alcohol | C20:5n3 |
| 14-HDoHE | 27.5 (16, 42) | 37.5 (19, 110) | 0.344 | 0.697 | Fatty Acid Alcohol | C22:6n3 |
| 9-HOTE | 1.2 (0.94, 1.6) | 1.06 (0.71, 1.6) | 0.445 | 0.724 | Fatty Acid Alcohol | C18:3n3 |
| 5S-HEPE | 0.473 (0.33, 0.65) | 0.553 (0.38, 0.85) | 0.460 | 0.729 | Fatty Acid Alcohol | C20:5n3 |
| 13S-HODE | 26.3 (22, 37) | 25.8 (22, 42) | 0.727 | 0.958 | Fatty Acid Alcohol | C18:2n6 |
| 4-HDoHE | 0.577 (0.44, 0.76) | 0.491 (0.37, 1.1) | 0.791 | 0.958 | Fatty Acid Alcohol | C22:6n3 |
| 5-HETE | 3.75 (3, 4.9) | 3.69 (3, 4.9) | 0.846 | 0.958 | Fatty Acid Alcohol | C20:4n6 |
| 8S-HETE | 0.832 (0.69, 1) | 0.85 (0.71, 1.1) | 0.846 | 0.958 | Fatty Acid Alcohol | C20:4n6 |
| 13-HOTE | 1.51 (1.3, 2.2) | 1.64 (1.2, 2.8) | 0.867 | 0.958 | Fatty Acid Alcohol | C18:3n3 |
| 11-HETE | 1.17 (1, 1.8) | 1.35 (0.92, 1.8) | 0.907 | 0.958 | Fatty Acid Alcohol | C20:4n6 |
| 9-HETE | 0.794 (0.69, 0.99) | 0.789 (0.69, 0.96) | 0.969 | 0.986 | Fatty Acid Alcohol | C20:4n6 |
| 17,18-DiHETE | 3.86 (2.9, 4.1) | 4.98 (4.2, 8) | 0.024 | 0.523 | Fatty Acid Diol | C20:5n3 |
| 14,15-DiHETE | 0.42 (0.36, 0.6) | 0.7 (0.61, 0.81) | 0.044 | 0.523 | Fatty Acid Diol | C20:5n3 |
| 9,10-DiHODE | 0.208 (0.084, 0.29) | 0.341 (0.18, 0.59) | 0.062 | 0.523 | Fatty Acid Diol | C18:3n3 |
| 15,16-DiHODE | 7.26 (6.1, 10) | 5.19 (4, 8.1) | 0.065 | 0.523 | Fatty Acid Diol | C18:3n3 |
| 6-trans-LTB4 | 0.211 (0.14, 0.27) | 0.318 (0.17, 0.41) | 0.134 | 0.697 | Fatty Acid Diol | C20:4n6 |
| 19,20-DiHDPE | 1.46 (1.4, 1.8) | 2.02 (1.4, 2.3) | 0.198 | 0.697 | Fatty Acid Diol | - |
| 5,6-DiHETrE | 0.39 (0.26, 0.42) | 0.401 (0.31, 0.52) | 0.293 | 0.697 | Fatty Acid Diol | C20:4n6 |
| 9,10-e-DiHO | 5.04 (4.5, 5.7) | 5.45 (4.3, 9.2) | 0.305 | 0.697 | Fatty Acid Diol | C18:0 |
| 8,9-DiHETrE | 0.341 (0.27, 0.39) | 0.38 (0.29, 0.46) | 0.357 | 0.697 | Fatty Acid Diol | C20:4n6 |
| Total Fatty Acid Diol | 27.4 (22, 31) | 31.3 (26, 33) | 0.426 | 0.724 | Fatty Acid Diol | - |
| 14,15-DiHETrE | 0.692 (0.53, 0.83) | 0.71 (0.56, 0.93) | 0.578 | 0.876 | Fatty Acid Diol | C18:3n3 |
| 9,10-DiHOME | 2.71 (2.3, 3.9) | 2.98 (2.1, 4.2) | 0.697 | 0.958 | Fatty Acid Diol | C18:2n6 |
| 11,12-DiHETrE | 0.567 (0.43, 0.7) | 0.548 (0.44, 0.82) | 0.867 | 0.958 | Fatty Acid Diol | C20:4n6 |
| LTB4 | 0.758 (0.43, 1.1) | 0.783 (0.3, 1.5) | 0.990 | 0.990 | Fatty Acid Diol | C20:4n6 |
| 15,16-EpODE | 1.56 (1.2, 2.3) | 0.887 (0.69, 1.9) | 0.073 | 0.523 | Fatty Acid Epoxide | C18:3n3 |
| 9,10-EpO | 1.55 (1.2, 2) | 1.19 (1, 1.7) | 0.164 | 0.697 | Fatty Acid Epoxide | C18:0 |
| 12(13)Ep-9-KODE | 2.08 (0.87, 6.7) | 3.38 (2, 10) | 0.232 | 0.697 | Fatty Acid Epoxide | C18:3n3 |
| Total Fatty Acid Epoxide | 15.1 (8.6, 18) | 18.4 (15, 21) | 0.379 | 0.697 | Fatty Acid Epoxide | - |
| 19(20)-EpDPE | 0.205 (0.15, 0.24) | 0.218 (0.15, 0.29) | 0.600 | 0.876 | Fatty Acid Epoxide | C22:6n3 |
| 12(13)-EpOME | 1.85 (1.2, 3.1) | 2.07 (1.2, 3) | 0.826 | 0.958 | Fatty Acid Epoxide | C18:2n6 |
| 9(10)-EpOME | 0.778 (0.61, 1.4) | 0.781 (0.68, 1.2) | 0.887 | 0.958 | Fatty Acid Epoxide | C18:2n6 |
| 9-KODE | 12.6 (11, 20) | 10.2 (7.4, 15) | 0.141 | 0.697 | Fatty Acid Ketone | C18:2n6 |
| 13-KODE | 4.79 (3.9, 7.5) | 4.04 (2.3, 7.3) | 0.371 | 0.697 | Fatty Acid Ketone | C18:2n6 |
| 5-KETE | 0.287 (0.24, 0.54) | 0.284 (0.23, 0.34) | 0.688 | 0.958 | Fatty Acid Ketone | C20:4n6 |
| 15-KETE | 0.218 (0.15, 0.42) | 0.198 (0.17, 0.26) | 0.905 | 0.958 | Fatty Acid Ketone | C20:4n6 |
| Total Fatty Acid Ketone | 19.9 (18, 35) | 21.2 (17, 34) | 0.905 | 0.958 | Fatty Acid Ketone | - |
| 9,12,13-TriHOME | 3.8 (2.3, 5.4) | 3.25 (2.2, 4.1) | 0.259 | 0.697 | Fatty Acid Triol | C18:2n6 |
| 10-Nitrooleate | 1.23 (0.86, 2.2) | 1.09 (0.75, 1.4) | 0.254 | 0.697 | Nitro-fatty Acid | C18:1n9 |
| 6-keto-PGF1alpha | 0.213 (0.19, 0.23) | 0.223 (0.21, 0.24) | 0.189 | 0.697 | Prostanoid | C20:4n6 |
| Total Prostanoid | 0.71 (0.58, 0.88) | 0.953 (0.68, 1.1) | 0.314 | 0.697 | Prostanoid | - |
| 15-deoxy PGJ2 | 0.115 (0.11, 0.12) | 0.121 (0.11, 0.13) | 0.337 | 0.697 | Prostanoid | C20:4n6 |
| PGF2alpha | 0.375 (0.26, 0.53) | 0.494 (0.35, 0.75) | 0.404 | 0.719 | Prostanoid | C20:4n6 |
| TXB2 | 0.779 (0.49, 9.9) | 0.876 (0.25, 5.8) | 0.940 | 0.974 | Thromboid | C20:4n6 |
| Total C22:6n3 species | 19.2 (11, 40) | 118 (75, 140) | 0.073 | 0.523 | - | C22:6n3 |
| Total C18:2n6 species | 76 (64, 93) | 64.7 (57, 90) | 0.190 | 0.697 | - | C18:2n6 |
| Total C20:5n3 species | 10 (7.7, 23) | 14.9 (7.9, 27) | 0.440 | 0.724 | - | C20:5n3 |
| Total C18:0 species | 6.2 (5.7, 7.4) | 6.77 (5.7, 11) | 0.596 | 0.876 | - | C18:0 |
| Total C20:4n6 species | 167 (130, 210) | 182 (130, 330) | 0.734 | 0.958 | - | C20:4n6 |
| Total C18:3n3 species | 19.6 (16, 24) | 19.2 (13, 24) | 0.778 | 0.958 | - | C18:3n3 |
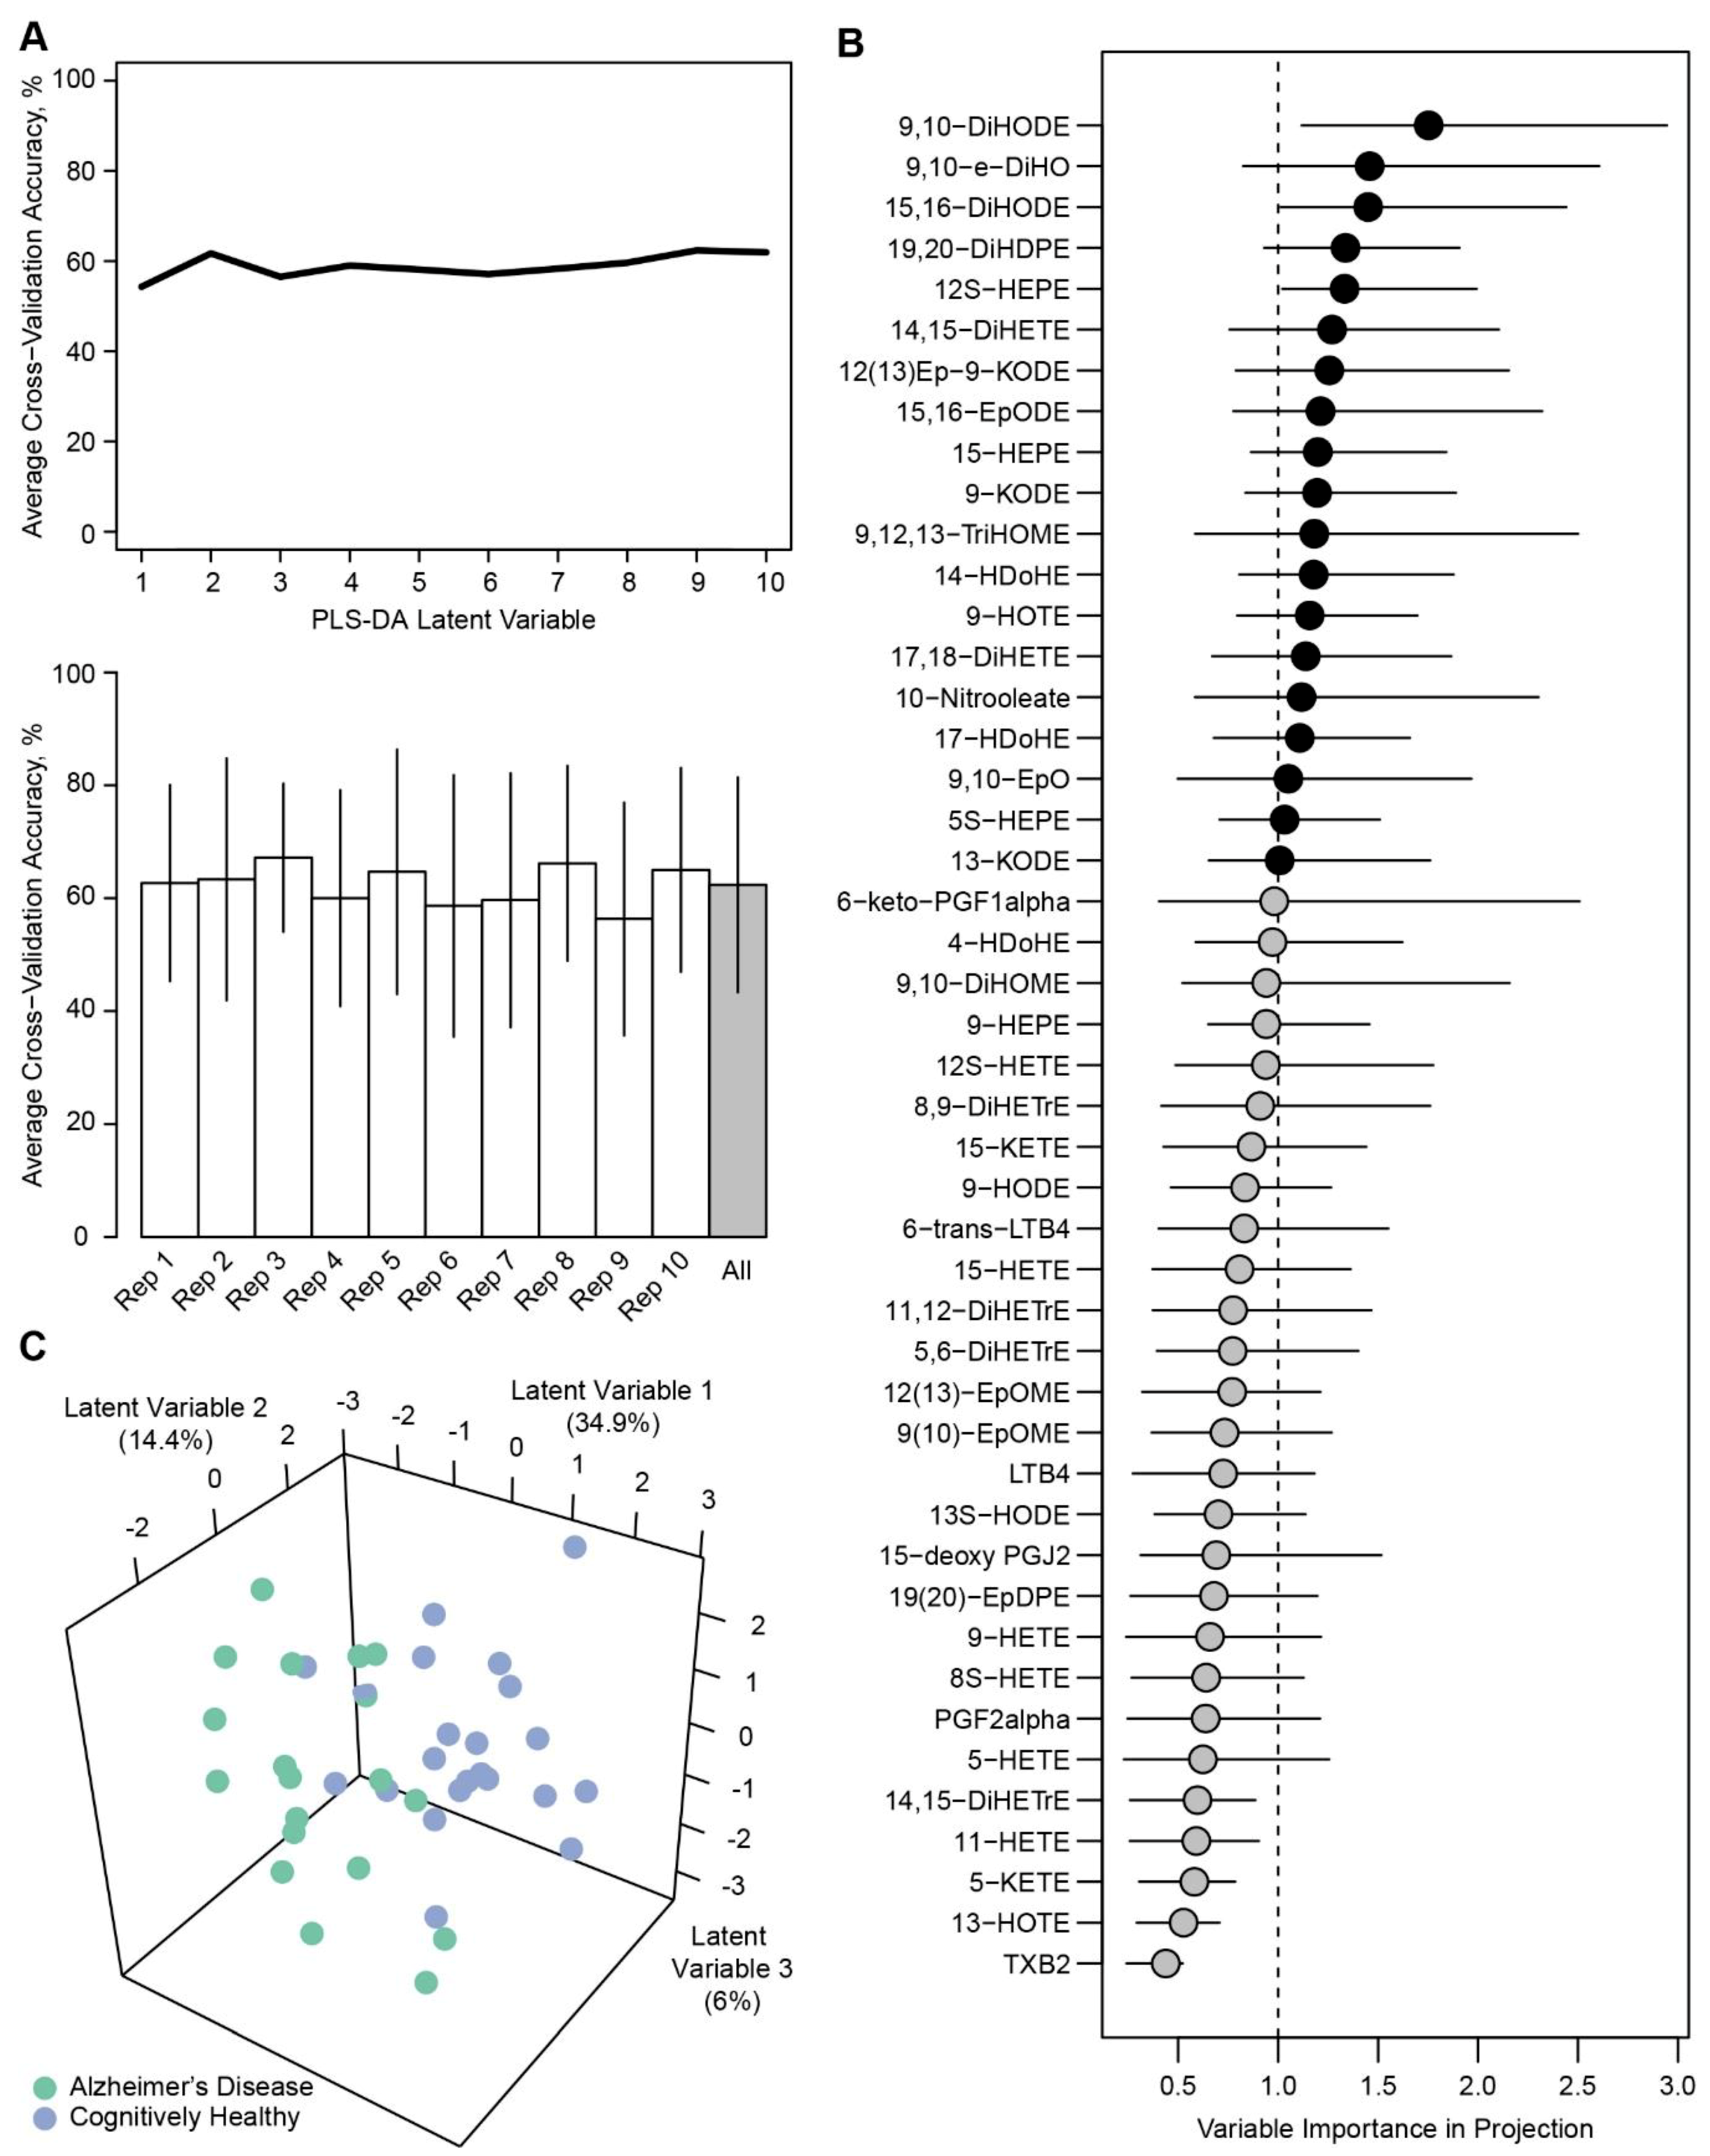
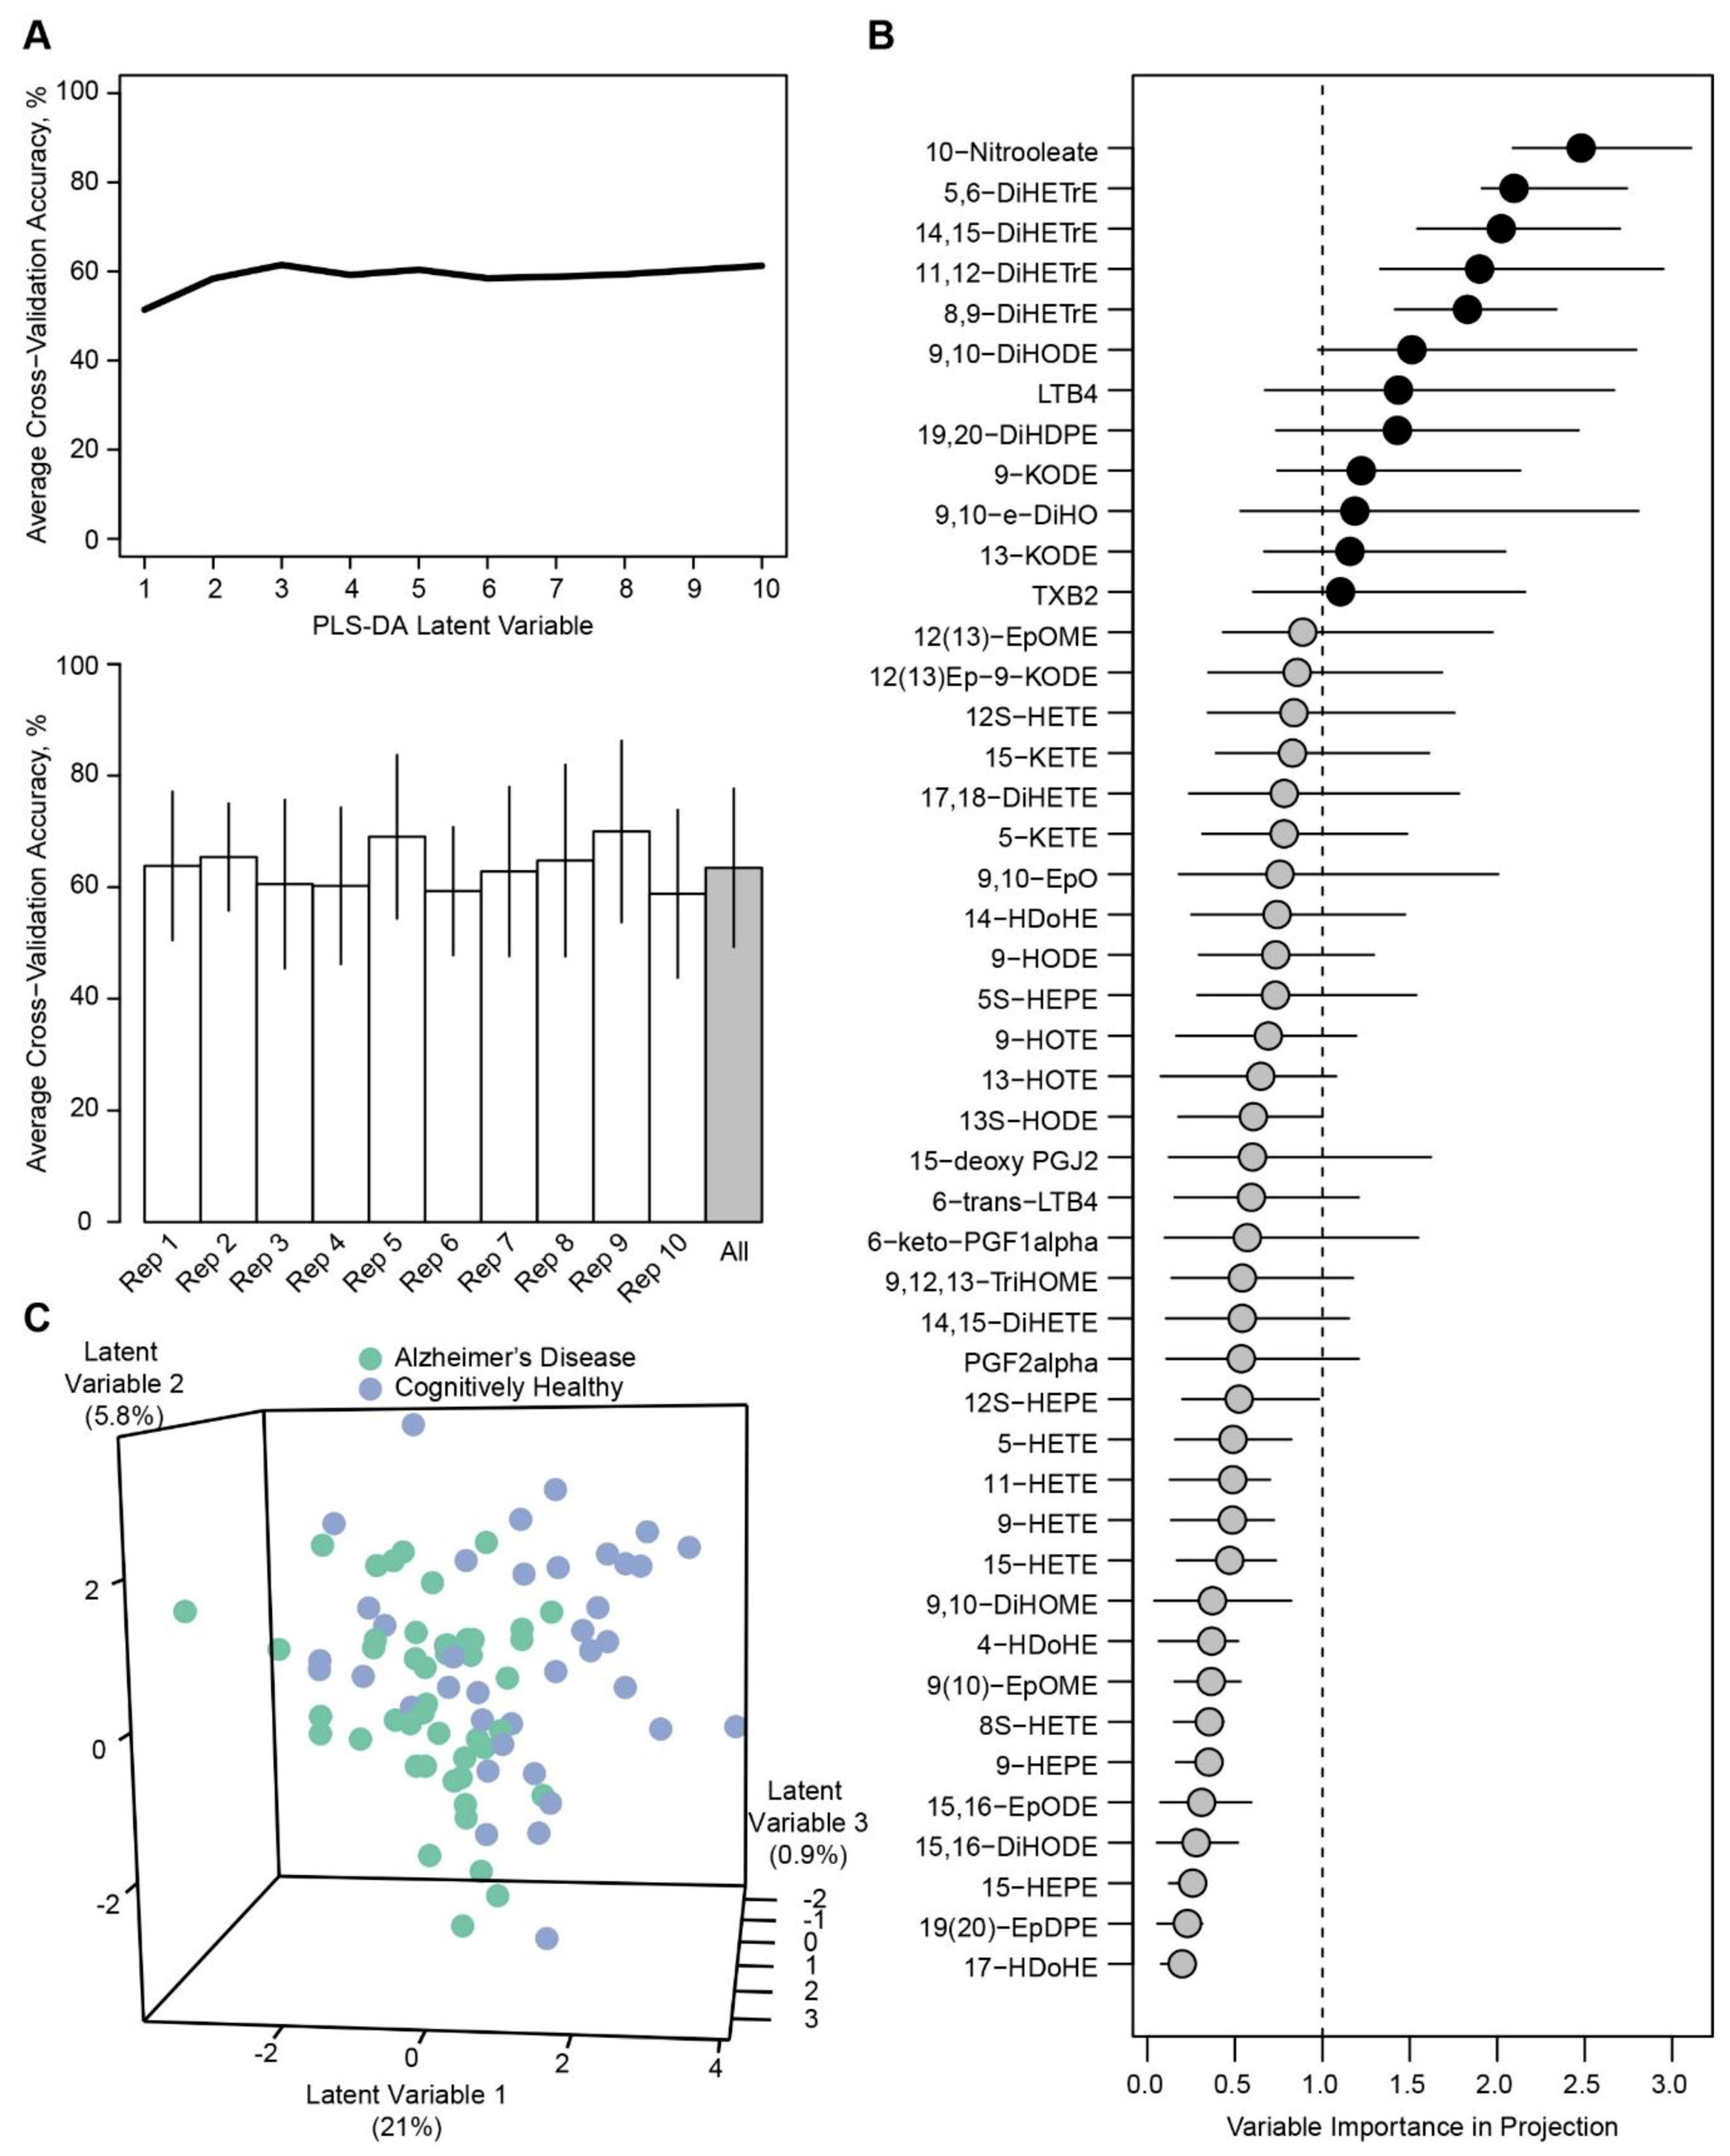
| Nondiabetic Group (n = 84) | T2D Group (n = 42) | Notable Roles | |
|---|---|---|---|
| 10-nitrooleate | Lower in AD | - | Nitric oxide synthase regulation [15] Inhibition of neutrophil chemotaxis via PPARγ activation [16,17] Damage mediation after reperfusion in cardiac ischemia [18] |
| 14,15-DiHETrE | Higher in AD | - | Promotes vasodilation in preclinical models [19,20] Elevated in pregnancy-related hypertension [21] |
| 11,12-DiHETrE | Higher in AD | - | Increased odds of vascular events* [22] Potential marker of ventricular arrhythmia [23] Promotes vasodilation in preclinical models [19,20] |
| 8,9-DiHETrE | Higher in AD | - | Increased odds of vascular events* [22] Potential marker of ventricular arrhythmia [23] Promotes vasodilation in preclinical models [19] Elevated after treatment of ibuprofen in humans [24] |
| 5,6-DiHETrE | Higher in AD | - | Potential marker of ventricular arrhythmia [23] Vasodilation in mouse due to increased nitric oxide availability [19] Elevated after treatment of ibuprofen in healthy males [24] Promotes vasodilation in preclinical models [20] |
| 14,15-DiHETE | - | Higher in AD | Inhibition of platelet aggregation [25] |
| 17,18-DiHETE | - | Higher in AD | Potential marker of ventricular arrhythmia [23] Inhibition of platelet aggregation [25] |
| 17-HDoHE | - | Higher in AD | Anti-inflammatory action in preclinical models [26] PPARγ agonist in cell models [27] |
© 2019 by the authors. Licensee MDPI, Basel, Switzerland. This article is an open access article distributed under the terms and conditions of the Creative Commons Attribution (CC BY) license (http://creativecommons.org/licenses/by/4.0/).
Share and Cite
Morris, J.K.; Piccolo, B.D.; John, C.S.; Green, Z.D.; Thyfault, J.P.; Adams, S.H. Oxylipin Profiling of Alzheimer’s Disease in Nondiabetic and Type 2 Diabetic Elderly. Metabolites 2019, 9, 177. https://doi.org/10.3390/metabo9090177
Morris JK, Piccolo BD, John CS, Green ZD, Thyfault JP, Adams SH. Oxylipin Profiling of Alzheimer’s Disease in Nondiabetic and Type 2 Diabetic Elderly. Metabolites. 2019; 9(9):177. https://doi.org/10.3390/metabo9090177
Chicago/Turabian StyleMorris, Jill K., Brian D. Piccolo, Casey S. John, Zachary D. Green, John P. Thyfault, and Sean H. Adams. 2019. "Oxylipin Profiling of Alzheimer’s Disease in Nondiabetic and Type 2 Diabetic Elderly" Metabolites 9, no. 9: 177. https://doi.org/10.3390/metabo9090177
APA StyleMorris, J. K., Piccolo, B. D., John, C. S., Green, Z. D., Thyfault, J. P., & Adams, S. H. (2019). Oxylipin Profiling of Alzheimer’s Disease in Nondiabetic and Type 2 Diabetic Elderly. Metabolites, 9(9), 177. https://doi.org/10.3390/metabo9090177