Plasma Free Fatty Acids Metabolic Profile with LC-MS and Appetite-Related Hormones in South Asian and White European Men in Relation to Adiposity, Physical Activity and Cardiorespiratory Fitness: A Cross-Sectional Study

 ,
,  , , , ,
  and
and
Abstract
1. Introduction
2. Results
2.1. Participant Characteristics
2.2. Free Fatty Acids Metabolic Profile
2.3. Fasting Plasma Concentrations of Appetite-Related Hormones, Inflammatory Markers and Lipid Parameters
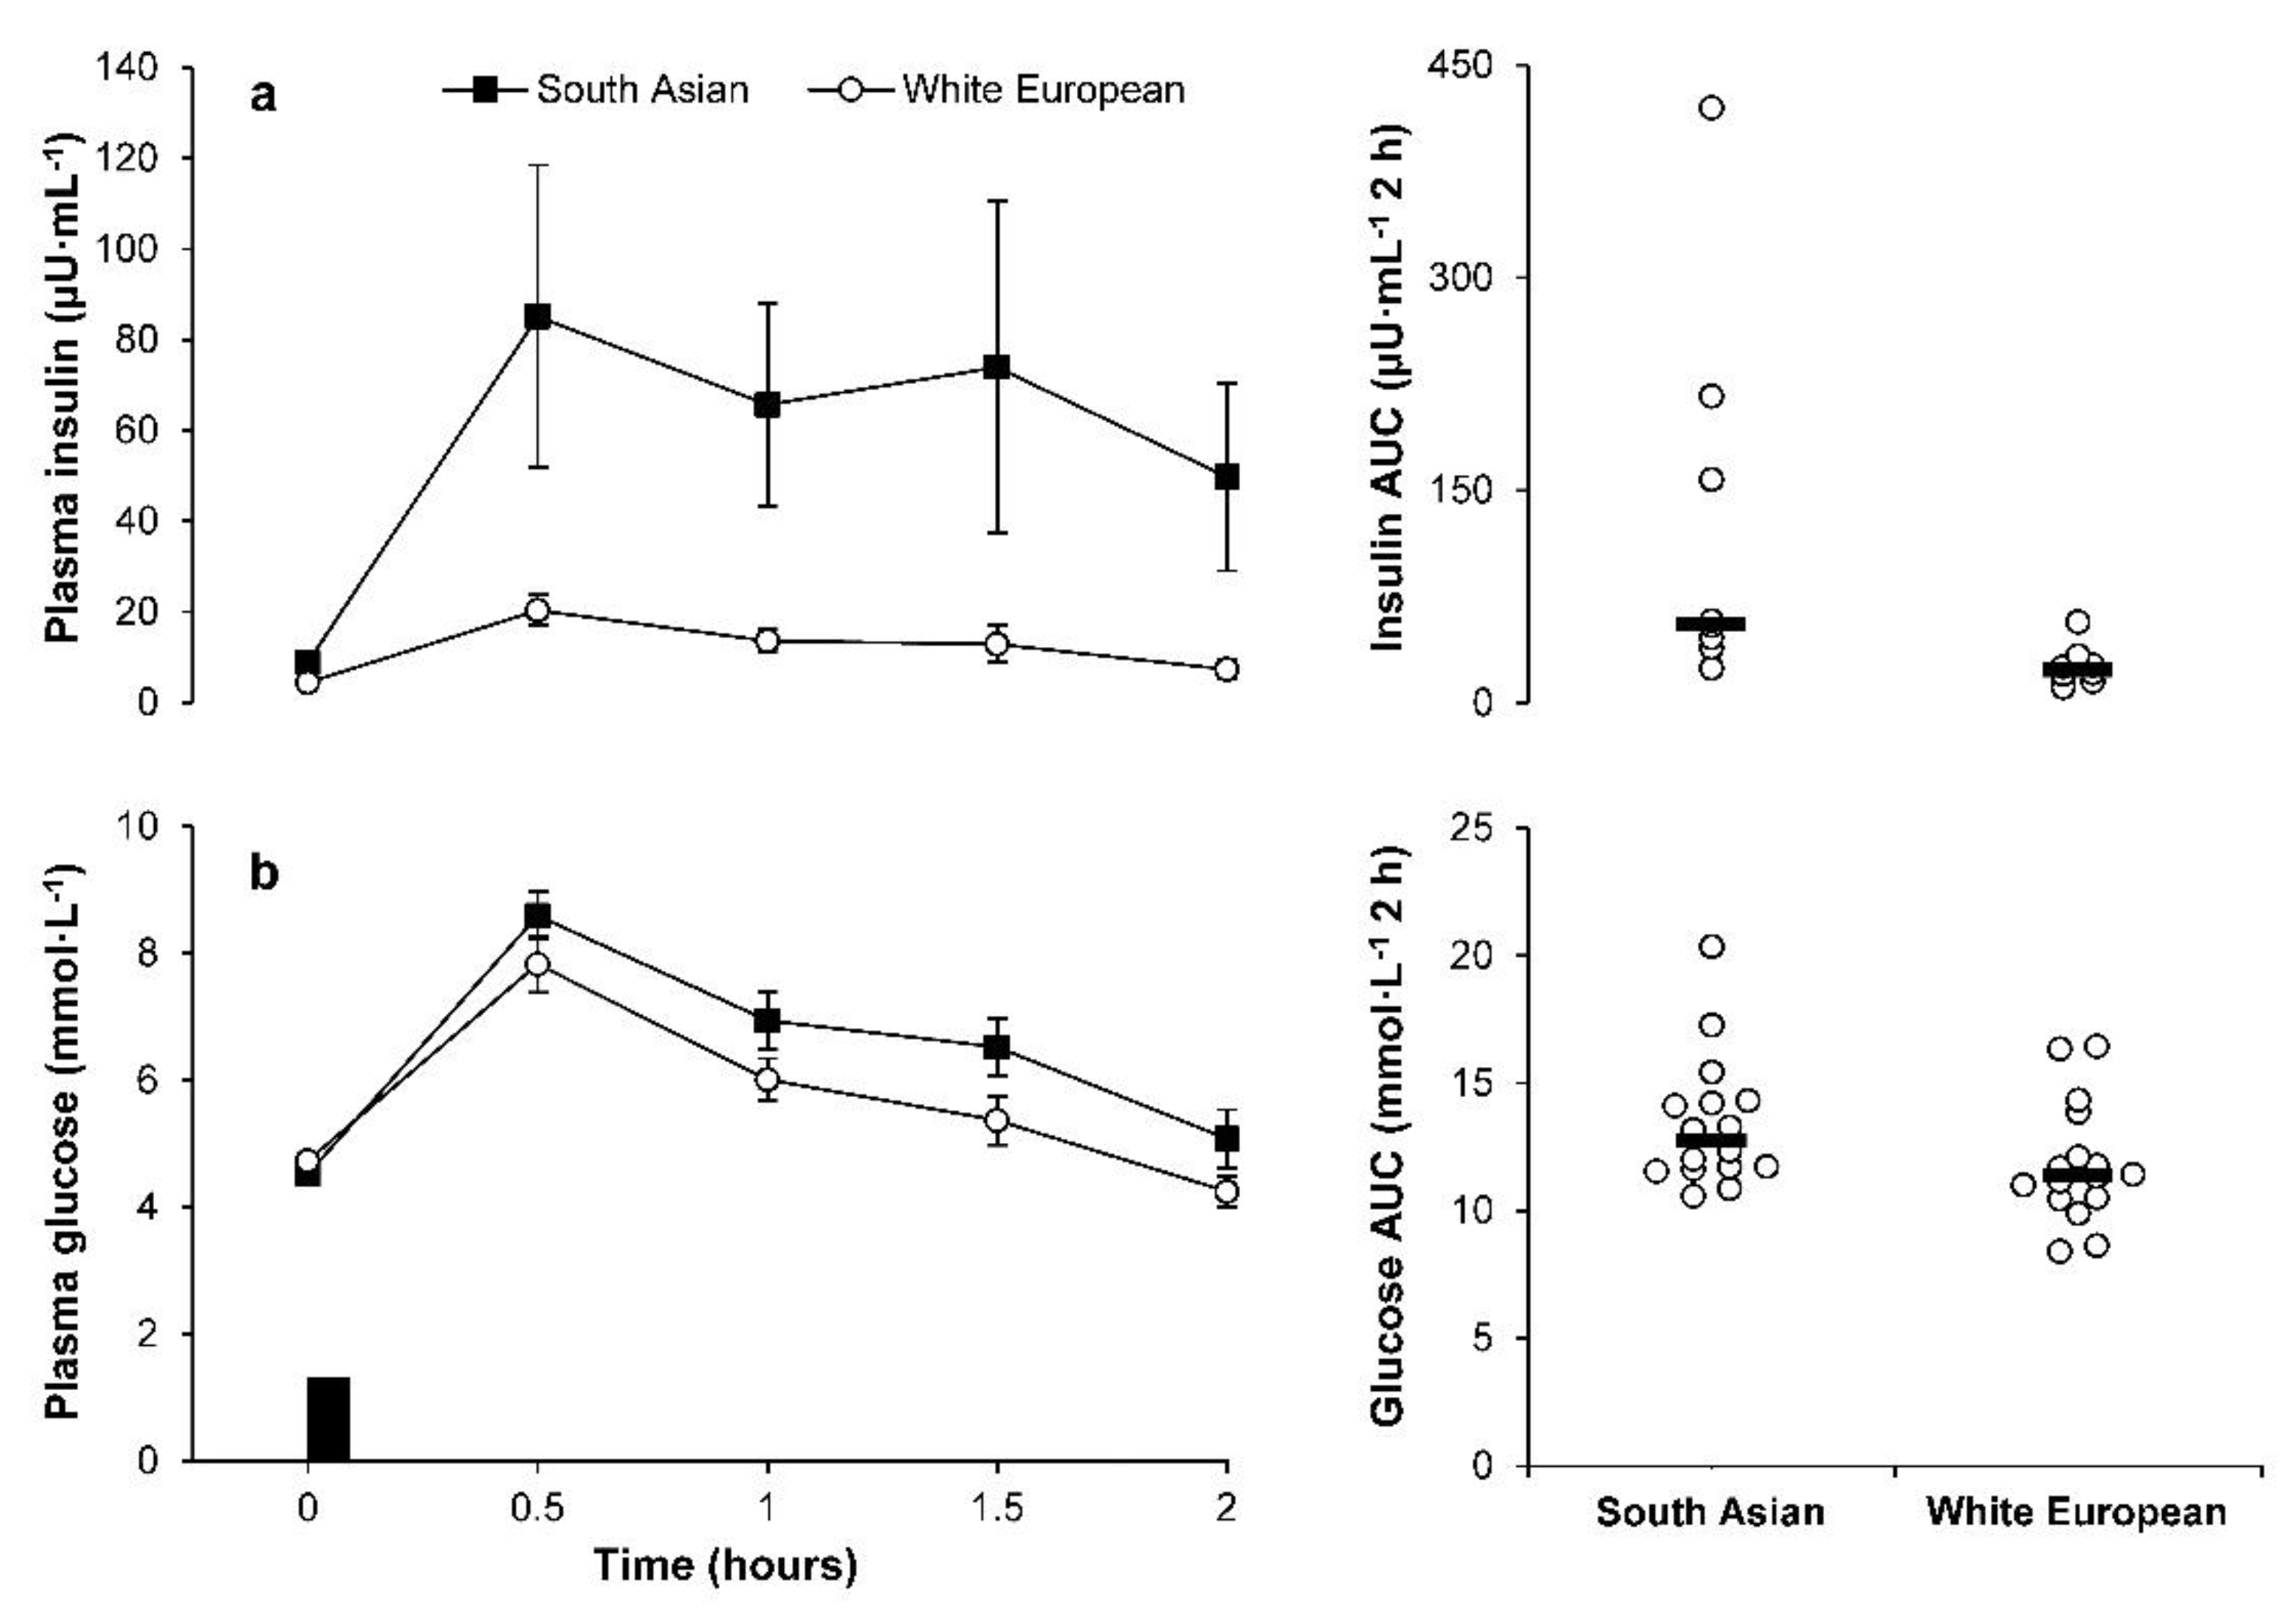
2.4. Plasma Glucose and Insulin Concentrations during the OGTT
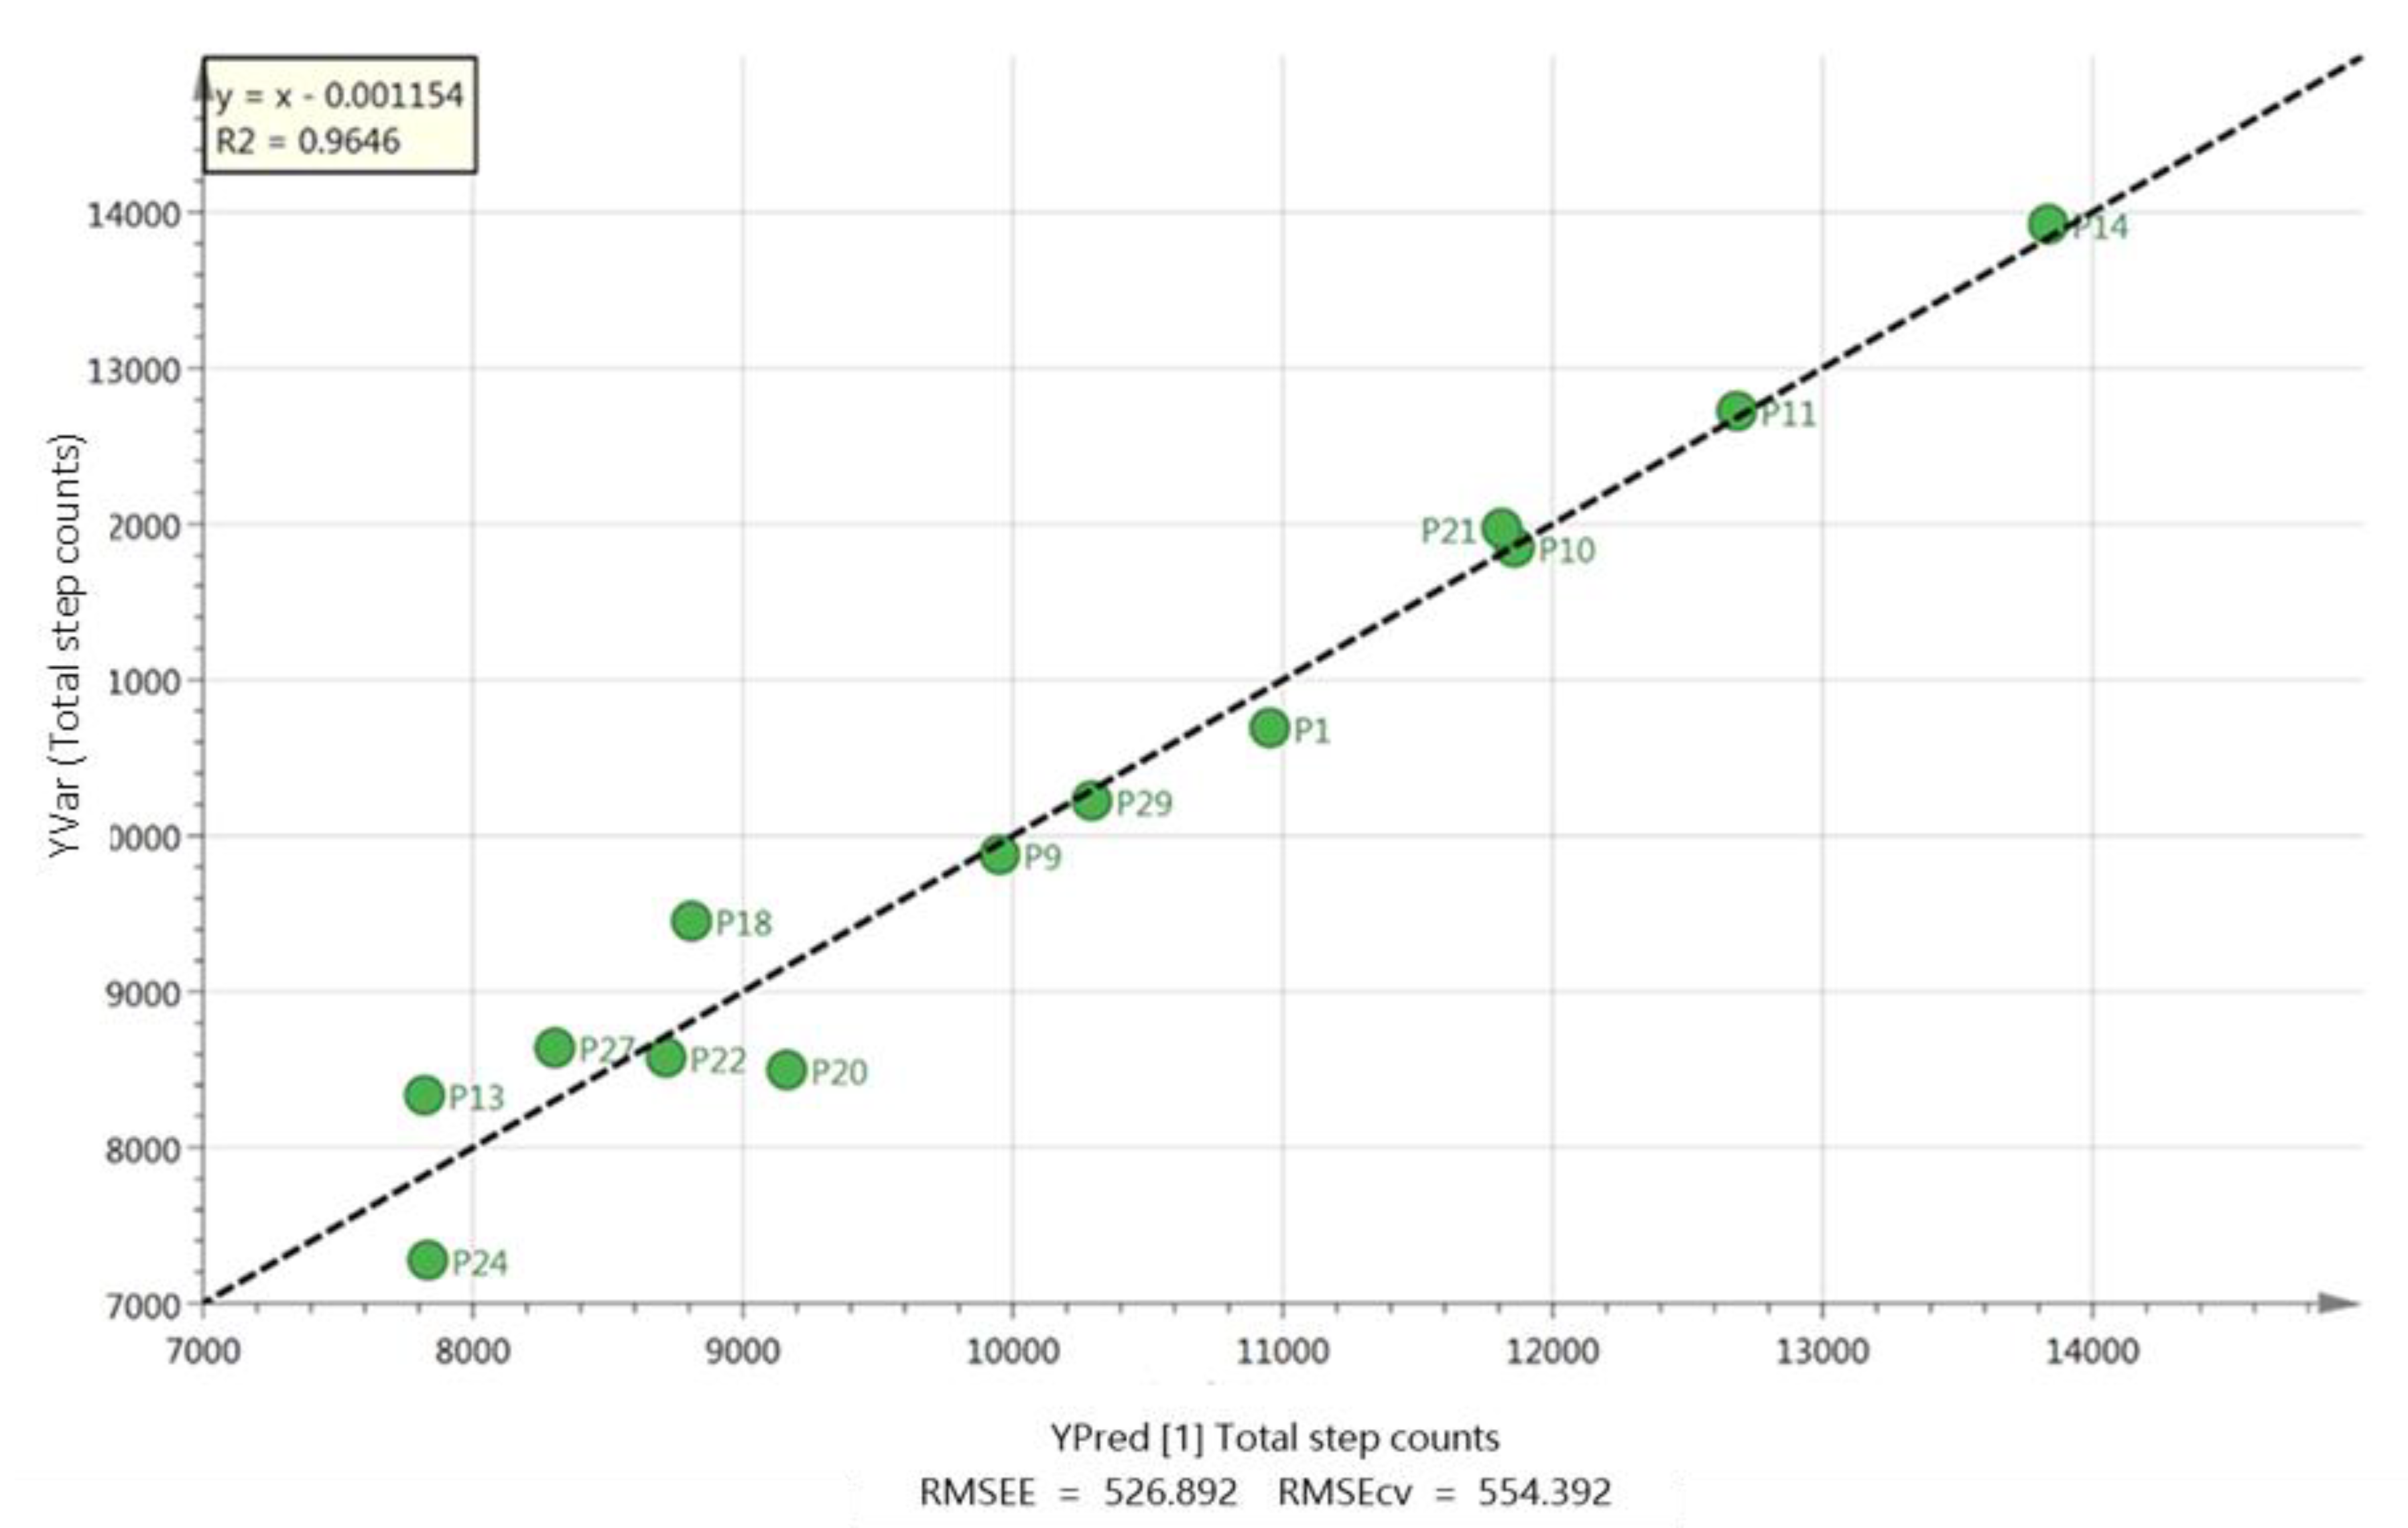
2.5. Habitual Physical Activity and Sedentary Time
2.6. Dietary Intake
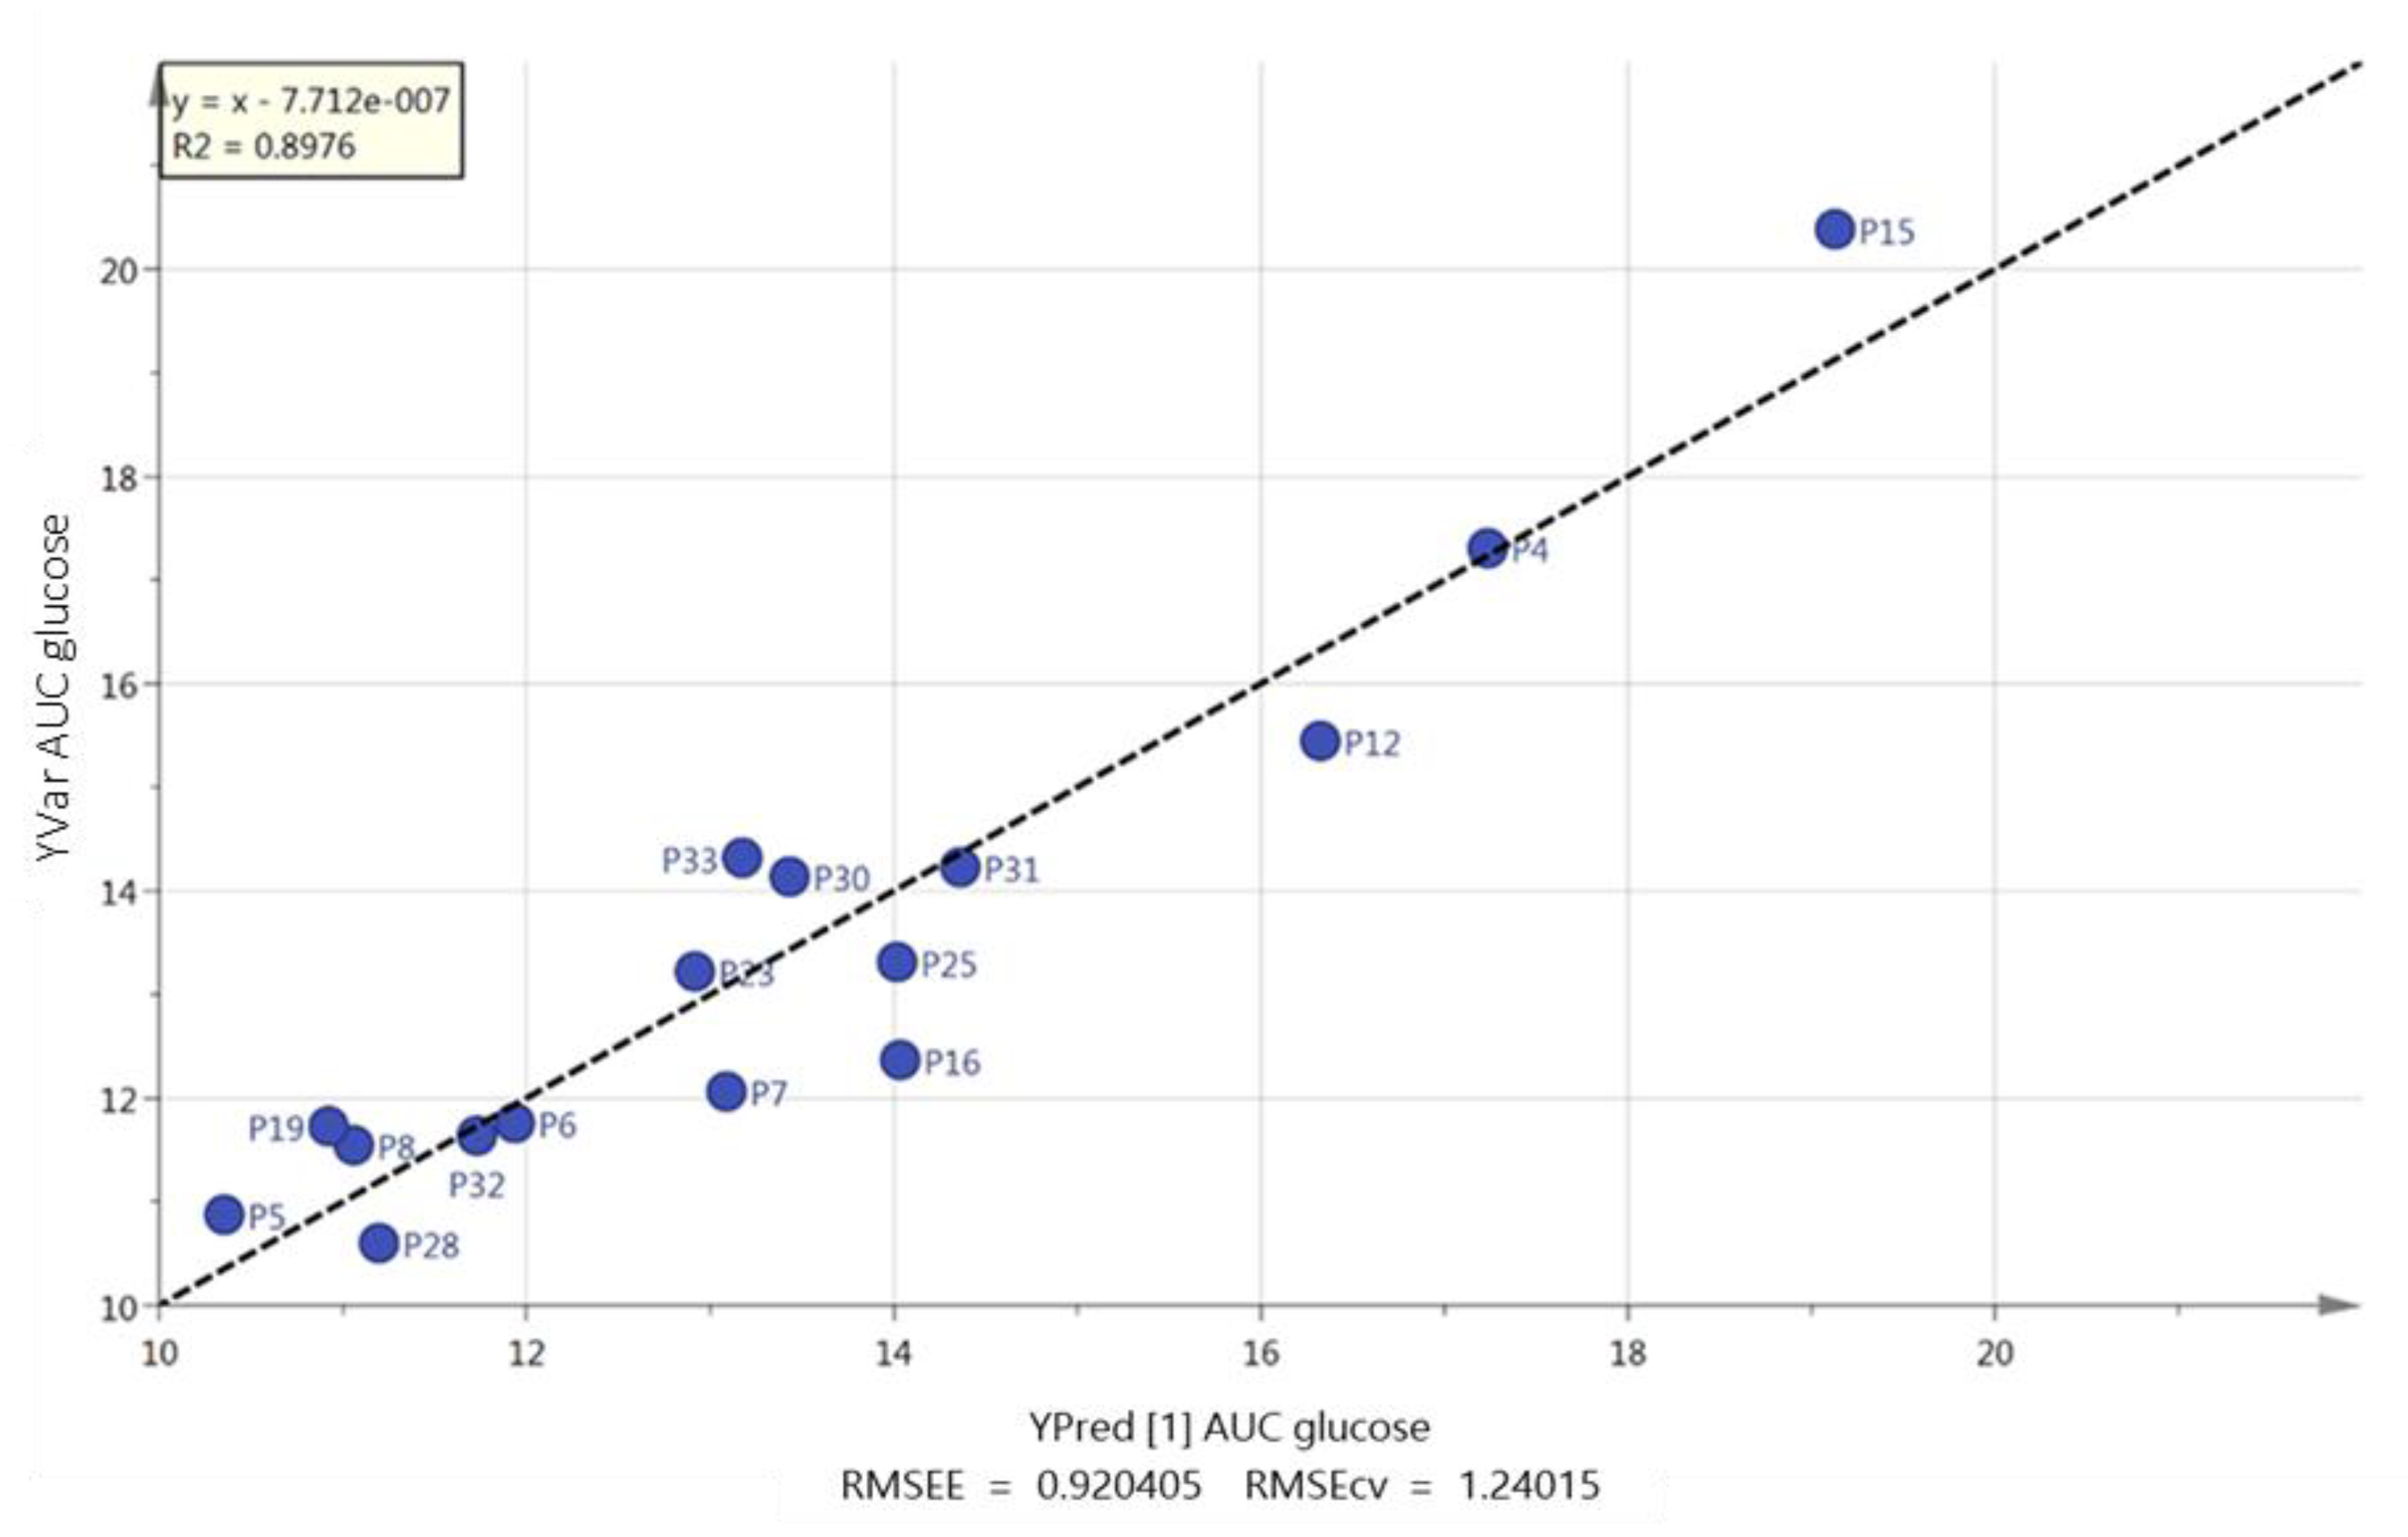
2.7. Correlations
3. Discussion
4. Materials and Methods
4.1. Chemicals and Solvents
4.2. Participants and Experimental Design
4.3. Visit 1
4.3.1. Anthropometry and Blood Pressure
4.3.2. Fasting Metabolic Assessment and Oral Glucose Tolerance Test
4.4. Visit 2
Maximum Oxygen Uptake Test
4.5. Habitual Physical Activity and Sedentary Time
4.6. Dietary Intake
4.7. Blood Sampling
4.8. Analytical Methods and Biochemical Analysis
4.8.1. LC-MS
4.8.2. LC-MS Sample Preparation and Calibration Series
4.8.3. Appetite-Related Hormones, Inflammatory and Metabolic Markers
4.9. Data Processing and Statistical Analysis
4.9.1. LC-MS
4.9.2. Appetite-Related Hormones, Inflammatory and Metabolic Markers
5. Conclusions
Supplementary Materials
Author Contributions
Funding
Acknowledgments
Conflicts of Interest
References
- Office for National Statistics 2011 Census. Key Statistics and Quick Statistics for Local Authorities in the United Kingdom; Office for National Statistics: Newport, UK, 2013. Available online: https://www.ons.gov.uk/peoplepopulationandcommunity/populationandmigration/populationestimates/datasets/2011censuskeystatisticsandquickstatisticsforlocalauthoritiesintheunitedkingdompart1 (accessed on 21 March 2018).
- Sattar, N.; Gill, J.M. Type 2 diabetes in migrant south Asians: Mechanisms, mitigation, and management. Lancet Diabetes Endocrinol. 2015, 3, 1004–1016. [Google Scholar] [CrossRef]
- Gholap, N.; Davies, M.; Patel, K.; Sattar, N.; Khunti, K. Type 2 diabetes and cardiovascular disease in South Asians. Prim. Care Diabetes 2011, 5, 45–56. [Google Scholar] [CrossRef]
- Khunti, K.; Morris, D.H.; Weston, C.L.; Gray, L.J.; Webb, D.R.; Davies, M.J. Joint prevalence of diabetes, impaired glucose regulation, cardiovascular disease risk and chronic kidney disease in South Asians and White Europeans. PLoS ONE 2013, 8, e55580. [Google Scholar] [CrossRef]
- Joshi, P.; Islam, S.; Pais, P.; Reddy, S.; Dorairaj, P.; Kazmi, K.; Pandey, M.R.; Haque, S.; Mendis, S.; Rangarajan, S.; et al. Risk factors for early myocardial infarction in South Asians compared with individuals in other countries. JAMA 2007, 297, 286–294. [Google Scholar] [CrossRef]
- Lear, S.A.; Humphries, K.H.; Kohli, S.; Birmingham, C.L. The use of BMI and waist circumference as surrogates of body fat differs by ethnicity. Obesity 2007, 15, 2817–2824. [Google Scholar] [CrossRef] [PubMed]
- Tziomalos, K.; Weerasinghe, C.N.; Mikhailidis, D.P.; Seifalian, A.M. Vascular risk factors in South Asians. Int. J. Cardiol. 2008, 128, 5–16. [Google Scholar] [CrossRef]
- Forouhi, N.G.; Sattar, N.; Tillin, T.; McKeigue, P.M.; Chaturvedi, N. Do known risk factors explain the higher coronary heart disease mortality in South Asian compared with European men? Prospective follow-up of the Southall and Brent studies, UK. Diabetologia 2006, 49, 2580–2588. [Google Scholar] [CrossRef] [PubMed]
- Boden, G. Interaction between free fatty acids and glucose metabolism. Curr. Opin. Clin. Nutr. Metab. Care 2002, 5, 545–549. [Google Scholar] [CrossRef]
- Boden, G.; Shulman, G. Free fatty acids in obesity and type 2 diabetes: Defining their role in the development of insulin resistance and beta-cell dysfunction. Eur. J. Clin. Investig. 2002, 3, 14–23. [Google Scholar] [CrossRef]
- Karpe, F.; Dickmann, J.R.; Frayn, K.N. Fatty Acids, Obesity, and Insulin Resistance: Time for a Reevaluation. Diabetes 2011, 60, 2441–2449. [Google Scholar] [CrossRef]
- Boden, G. Obesity, Insulin Resistance and Free Fatty Acids. Curr. Opin. Endocrinol. Diabetes Obes. 2011, 18, 139–143. [Google Scholar] [CrossRef]
- Capurso, C.; Capurso, A. From excess adiposity to insulin resistance: The role of free fatty acids. Vasc. Pharmacol. 2012, 57, 91–97. [Google Scholar] [CrossRef]
- Ralston, J.C.; Zulyniak, M.A.; Nielsen, D.E.; Clarke, S.; Badawi, A.; El-Sohemy, A.; Ma, D.W.; Mutch, D.M. Ethnic- and sex-specific associations between plasma fatty acids and markers of insulin resistance in healthy young adults. Nutr. Metab. 2013, 10, 42. [Google Scholar] [CrossRef]
- Hussain, S.S.; Bloom, S.R. The regulation of food intake by the gut-brain axis: Implications for obesity. Int. J. Obes. 2013, 37, 625–633. [Google Scholar] [CrossRef]
- Mente, A.; Razak, F.; Blankenberg, S.; Vuksan, V.; Davis, A.D.; Miller, R.; Teo, K.; Gerstein, H.; Sharma, A.M.; Yusuf, S.; et al. Ethnic variation in adiponectin and leptin levels and their association with adiposity and insulin resistance. Diabetes Care 2010, 33, 1629–1634. [Google Scholar] [CrossRef]
- Considine, R.V.; Sinha, M.K.; Heiman, M.L.; Kriauciunas, A.; Stephens, T.W.; Nyce, M.R. Serum immunoreactive-leptin concentrations in normal-weight and obese humans. N. Engl. J. Med. 1996, 334, 292–295. [Google Scholar] [CrossRef]
- Williams, E.D.; Stamatakis, E.; Chandola, T.; Hamer, M. Physical activity behaviour and coronary heart disease mortality among South Asian people in the UK: An observational longitudinal study. Heart 2011, 97, 655–659. [Google Scholar] [CrossRef]
- Yates, T.; Henson, J.; Edwardson, C.; Bodicoat, D.H.; Davies, M.J.; Khunti, K. Differences in levels of physical activity between White and South Asian populations within a healthcare setting: Impact of measurement type in a cross-sectional study. BMJ Open 2015, 5, e006181. [Google Scholar] [CrossRef]
- Williams, E.D.; Stamatakis, E.; Chandola, T.; Hamer, M. Assessment of physical activity levels in South Asians in the UK: Findings from the health survey for England. J. Epidemiol. Community Health 2011, 65, 517–521. [Google Scholar] [CrossRef]
- Rastogi, T.; Vaz, M.; Spiegelman, D.; Reddy, K.S.; Bharathi, A.V.; Stampfer, M.J.; Willet, W.C.; Ascherio, A. Physical activity and risk of coronary heart disease in India. Int. J. Epidemiol. 2004, 33, 759–767. [Google Scholar] [CrossRef]
- Mohan, V.; Gokulakrishnan, K.; Deepa, R.; Shanthirani, C.S.; Datta, M. Association of physical inactivity with components of metabolic syndrome and coronary artery disease—The Chennai Urban Population Study (CUPS no. 15). Diabet. Med. 2005, 22, 1206–1211. [Google Scholar] [CrossRef]
- Benjamini, Y.; Hochberg, Y. Controlling the false discovery rate: A practical and powerful approach to multiple testing. J. R. Stat. Soc. Ser. B 1995, 57, 289–300. [Google Scholar] [CrossRef]
- Xu, C.; He, J.; Jiang, H.; Zu, L.; Zhai, W.; Pu, S.; Xu, G. Direct effect of glucocorticoids on lipolysis in adipocytes. Mol. Endocrinol. 2009, 23, 1161–1170. [Google Scholar] [CrossRef]
- Reynolds, R.M.; Fischbacher, C.; Bhopal, R.; Byrne, C.D.; White, M.; Unwin, N.; Walker, B.R. Differences in cortisol concentrations in south asian and european men living in the United Kingdom. Clin. Endocrinol. 2006, 64, 530–534. [Google Scholar] [CrossRef]
- Langin, D.; Dicker, A.; Tavernier, G.; Hoffstedt, J.; Mairal, A.; Rydén, M.; Arner, E.; Sicard, A.; Jenkins, C.M.; Viguerie, N. Adipocyte lipases and defect of lipolysis in human obesity. Diabetes 2005, 54, 3190–3197. [Google Scholar] [CrossRef]
- Schreiber, R.; Xie, H.; Schweiger, M. Of mice and men: The physiological role of adipose triglyceride lipase (atgl). Biochim. Biophys. Acta 2018, 44, 97–112. [Google Scholar] [CrossRef]
- Gemmink, A.; Bakker, L.E.; Guigas, B.; Kornips, E.; Schaart, G.; Meinders, A.E.; Jazet, I.M.; Hesselink, M.K. Lipid droplet dynamics and insulin sensitivity upon a 5-day high-fat diet in Caucasians and South Asians. Sci. Rep. 2017, 7, 42393. [Google Scholar] [CrossRef]
- Russell, A.P.; Feilchenfeldt, J.; Schreiber, S.; Praz, M.; Crettenand, A.; Gobelet, C.; Meier, C.A.; Bell, D.R.; Kralli, A.; Giacobino, J.-P. Endurance training in humans leads to fiber type-specific increases in levels of peroxisome proliferator-activated receptor-γ coactivator-1 and peroxisome proliferator-activated receptor-α in skeletal muscle. Diabetes 2003, 52, 2874–2881. [Google Scholar] [CrossRef]
- Le Roux, C.W.; Patterson, M.; Vincent, R.P.; Hunt, C.; Ghatei, M.A.; Bloom, S.R. Postprandial plasma ghrelin is suppressed proportional to meal calorie content in normal-weight but not obese subjects. J. Clin. Endocrinol. Metab. 2005, 90, 1068–1071. [Google Scholar] [CrossRef]
- Abate, N.; Chandalia, M.; Snell, P.G.; Grundy, S.M. Adipose tissue metabolites and insulin resistance in nondiabetic Asian Indian men. J. Clin. Endocrinol. Metab. 2004, 89, 2750–2755. [Google Scholar] [CrossRef]
- Peters, M.J.; Ghouri, N.; McKeigue, P.; Forouhi, N.G.; Sattar, N. Circulating IL-6 concentrations and associated anthropometric and metabolic parameters in South Asian men and women in comparison to European whites. Cytokine 2013, 61, 29–32. [Google Scholar] [CrossRef]
- Raji, A.; Seely, E.W.; Arky, R.A.; Simonson, D.C. Body fat distribution and insulin resistance in healthy Asian Indians and Caucasians. J. Clin. Endocrinol. Metab. 2001, 86, 5366–5371. [Google Scholar] [CrossRef]
- Anand, S.S.; Razak, F.; Yi, Q.; Davis, B.; Jacobs, R.; Vuksan, V.; Lonn, E.; Teo, K.; McQueen, M.; Yusuf, S. C-Reactive Protein as a Screening Test for Cardiovascular Risk in a Multiethnic Population. Arterioscler. Thromb. Vasc. Biol. 2004, 24, 1509–1515. [Google Scholar] [CrossRef]
- Bastard, J.P.; Jardel, C.; Delattre, J.; Hainque, B.; Bruckert, E.; Oberlin, F. Evidence for a link between adipose tissue interleukin-6 content and serum C-reactive protein concentrations in obese subjects. Circulation 1999, 99, 2221–2222. [Google Scholar] [CrossRef]
- Arjunan, S.P.; Deighton, K.; Bishop, N.C.; King, J.; Reischak-Oliveira, A.; Rogan, A.; Sedgwick, M.; Thackray, A.E.; Webb, D.; Stensel, D.J. The effect of prior walking on coronary heart disease risk markers in South Asian and European men. Eur. J. Appl. Physiol. 2015, 115, 2641–2651. [Google Scholar] [CrossRef]
- Arjunan, S.P.; Bishop, N.C.; Reischak-Oliveira, A.; Stensel, D.J. Exercise and coronary heart disease risk markers in South Asian and European men. Med. Sci. Sports Exerc. 2013, 45, 1261–1268. [Google Scholar] [CrossRef]
- Ghouri, N.; Purves, D.; McConnachie, A.; Wilson, J.; Gill, J.M.; Sattar, N. Lower cardiorespiratory fitness contributes to increased insulin resistance and fasting glycaemia in middle-aged South Asian compared with European men living in the UK. Diabetologia 2013, 56, 2238–2249. [Google Scholar] [CrossRef]
- Biddle, G.J.H.; Edwardson, C.L.; Rowlands, A.V.; Davies, M.J.; Bodicoat, D.H.; Hardeman, W.; Eborall, H.; Sutton, S.; Griffin, S.; Khunti, K.; et al. Differences in objectively measured physical activity and sedentary behaviour between white Europeans and south Asians recruited from primary care: Cross-sectional analysis of the PROPELS trial. BMC Public Health 2019, 19, 95. [Google Scholar] [CrossRef]
- Iliodromiti, S.; Ghouri, N.; Celis-Morales, C.A.; Sattar, N.; Lumsden, M.A.; Gill, J.M. Should Physical Activity Recommendations for South Asian Adults Be Ethnicity-Specific? Evidence from a Cross-Sectional Study of South Asian and White European Men and Women. PLoS ONE 2016, 11, e0160024. [Google Scholar] [CrossRef]
- Hall, L.M.; Moran, C.N.; Milne, G.R.; Wilson, J.; MacFarlane, N.G.; Forouhi, N.G.; Hariharan, N.; Salt, I.P.; Sattar, N.; Gill, J.M. Fat oxidation, fitness and skeletal muscle expression of oxidative/lipid metabolism genes in South Asians: Implications for insulin resistance? PLoS ONE 2010, 5, e14197. [Google Scholar] [CrossRef]
- Kodama, S.; Saito, K.; Tanaka, S.; Maki, M.; Yachi, Y.; Asumi, M.; Sugawara, A.; Totsuka, K.; Shimano, H.; Ohashi, Y.; et al. Cardiorespiratory fitness as a quantitative predictor of all-cause mortality and cardiovascular events in healthy men and women: A meta-analysis. JAMA 2009, 301, 2024–2035. [Google Scholar] [CrossRef]
- Dhurandhar, N.V.; Schoeller, D.; Brown, A.W.; Heymsfield, S.B.; Thomas, D.; Sørensen, T.I.; Speakman, J.R.; Jeansonne, M.; Allison, D.B. Energy Balance Measurement Working Group. Int. J. Obes. 2015, 39, 1109–1113. [Google Scholar] [CrossRef]
- Faul, F.; Erdfelder, E.; Lang, A.G.; Buchner, A. G*Power 3: A flexible statistical power analysis program for the social, behavioral, and biomedical sciences. Behav. Res. Methods 2007, 39, 175–191. [Google Scholar] [CrossRef]
- Chandalia, M.; Lin, P.; Seenivasan, T.; Livingston, E.H.; Snell, P.G.; Grundy, S.M.; Abate, N. Insulin resistance and body fat distribution in South Asian men compared to Caucasian men. PLoS ONE 2007, 2, e812. [Google Scholar] [CrossRef]
- Thomas, S.; Reading, J.; Shephard, R.J. Revision of the Physical Activity Readiness Questionnaire (PAR-Q). Can. J. Sport Sci. 1992, 17, 338–345. [Google Scholar]
- Freedson, P.S.; Melanson, E.; Sirard, J. Calibration of the Computer Science and Applications, Inc. accelerometer. Med. Sci. Sports Exerc. 1998, 30, 777–781. [Google Scholar] [CrossRef]
- Matthews, D.R.; Hosker, J.P.; Rudenski, A.S.; Naylor, B.A.; Treacher, D.F.; Turner, R.C. Homeostasis model assessment: Insulin resistance and beta-cell function from fasting plasma glucose and insulin concentrations in man. Diabetologia 1985, 28, 412–419. [Google Scholar] [CrossRef]
- Matsuda, M.; DeFronzo, R.A. Insulin sensitivity indices obtained from oral glucose tolerance testing: Comparison with the euglycemic insulin clamp. Diabetes Care 1999, 22, 1462–1470. [Google Scholar] [CrossRef]
- Cohen, J. Statistical Power Analysis for the Behavioural Sciences, 2nd ed.; Lawrence Erlbaum Associates: Hillsdale, NJ, USA, 1988; pp. 22–25. [Google Scholar]


| South Asians (n = 16) | White Europeans (n = 16) | White Europeans vs. South Asians 95% CI a | Effect Size | |
|---|---|---|---|---|
| Age (years) | 30 (8) | 36 (8) | −11 to 0.04 | 0.72 |
| Stature (cm) | 176.3 (6.9) | 179.3 (4.7) | −7.2 to 1.3 | 0.49 |
| Body mass (kg) | 79.4 (14.6) | 80.5 (8.4) | −9.7 to 7.5 | 0.09 |
| Body mass index (kg·m−2) | 25.7 (5.2) | 25.2 (3.3) | −2.6 to 3.7 | 0.12 |
| Fat-free mass (kg) | 57.4 (5.3) | 64.5 (5.7) | −11.2 to −3.2 * | 1.29 |
| Fat mass (kg) | 22.1 (11.0) | 16.0 (6.9) | −0.5 to 12.7 * | 0.66 |
| Body fat (%) | 26.4 (9.0) | 19.5 (7.0) | 1.1 to 12.8 * | 0.86 |
| Waist Circumference (cm) | 87.8 (13.4) | 85.5 (6.6) | −5.4 to 9.9 | 0.21 |
| Resting sBP (mmHg) | 120 (11) | 122 (10) | −10 to 5 | 0.23 |
| Resting dBP (mmHg) | 78 (8) | 77 (11) | −6 to 7 | 0.05 |
| O2max (L·min−1) | 2.97 (0.55) | 4.00 (0.60) | −1.44 to −0.61 * | 1.79 |
| O2max (mL·kg−1·min−1) | 38 (9) | 50 (8) | −18 to −5 * | 1.36 |
| Free Fatty Acid | South Asians (n = 16) | White Europeans (n = 16) | RT (min) | m/z | p Value SA/WE | Ratio of Mean Conc. SA/WE |
|---|---|---|---|---|---|---|
| Laurate | 29.8 (12.2) | 28.3 (14.5) | 8.3 | 199.169 | 0.040 | 1.092 |
| Myristate | 48.0 (44.8) | 33.5 (34.3) | 11.5 | 227.200 | 0.011 | 1.478 |
| Pentadecenoate | 12.5 (7.9) | 12.3 (4.5) | 10.9 | 239.200 | 0.224 | 1.032 |
| Pentadecanoic | 13.5 (21.5) | 12.5 (26.7) | 13.3 | 241.216 | 0.214 | 1.111 |
| Palmitoleic | 51.3 (66.8) | 36.3 (60.5) | 12.4 | 253.216 | 0.137 | 1.371 |
| Palmitate | 81.0 (33.3) | 54.8 (30.6) | 15.2 | 255.232 | 0.004 | 1.487 |
| Linolenic | 17.8 (30.1) | 13.8 (35.0) | 11.6 | 277.216 | 0.017 | 1.328 |
| Linoleate | 322.3 (31.2) | 206.0 (44.7) | 13.6 | 279.232 | 0.005 | 1.621 |
| Oleate | 633.8 (43.4) | 473.5 (42.5) | 16.1 | 281.247 | 0.081 | 1.317 |
| Stearic | 193.5 (29.8) | 155.3 (28.6) | 19.2 | 283.263 | 0.095 | 1.227 |
| Eicosapentaenoic | 9.3 (19.7) | 10.3 (37.9) | 11.5 | 301.216 | 0.449 | 0.899 |
| Eicosatetraenoic | 25 (30.9) | 25.3 (35.9) | 13.4 | 303.232 | 0.958 | 0.972 |
| Eicosatrienoic | 7.0 (27.2) | 6.5 (27.0) | 14.8 | 305.247 | 0.554 | 1.059 |
| Eicosadienoic | 12.2 (12.3) | 11.5 (14.7) | 17.1 | 307.263 | 0.215 | 1.068 |
| Eicosenoic | 14.0 (24.9) | 13.3 (37.6) | 19.8 | 309.279 | 0.666 | 1.022 |
| Arachidate | 35.3 (59.2) | 49.0 (53.4) | 23.1 | 311.294 | 0.074 | 0.681 |
| Docosahexaenoic | 18.3 (43.0) | 25.3 (69.9) | 13.1 | 327.232 | 0.100 | 0.683 |
| Tricosanoate | 20.0 (53.3) | 16.5 (47.2) | 28.1 | 353.341 | 0.456 | 1.179 |
| Lignocerate | 13.4 (49.5) | 10.8 (29.1) | 29.6 | 367.357 | 0.250 | 1.225 |
| South Asians (n = 16) | White Europeans (n = 16) | Model 1 a | Model 2 b | |||
|---|---|---|---|---|---|---|
| White Europeans vs. South Asians 95% CI c | Effect Size | White Europeans vs. South Asians 95% CI c | Effect Size | |||
| Acylated ghrelin (pg·mL−1) | 35.7 (25.8 to 49.4) | 67.7 (48.8 to 93.7) | −67 to −16% * | 1.00 | −59 to 5% | 0.65 |
| Total peptide YY (pg·mL−1) | 90.3 (80.0 to 101.8) | 83.8 (74.3 to 94.5) | −9 to 28% | 0.31 | −9 to 33% | 0.39 |
| Leptin (ng·mL−1) | 6.11 (3.76 to 9.92) | 2.13 (1.31 to 3.46) | 44 to 470% * | 1.11 | −1 to 91% | 0.33 |
| C-reactive protein (µg·mL−1) | 0.89 (0.57 to 1.38) | 0.42 (0.27 to 0.65) | 14 to 298% * | 0.87 | −17 to 197% | 0.52 |
| Interleukin-6 (pg·mL−1) d | 0.71 (0.49 to 1.03) | 0.45 (0.32 to 0.64) | −5 to 161% | 0.86 | −19 to 119% | 0.54 |
| TC (mmol·L−1) | 4.37 (4.04 to 4.73) | 4.28 (3.96 to 4.63) | −9 to 14% | 0.13 | −11 to 14% | 0.03 |
| HDL-C (mmol·L−1) | 1.10 (0.98 to 1.24) | 1.32 (1.17 to 1.48) | −29 to −1% * | 0.78 | −22 to 8% | 0.36 |
| TC/HDL-C ratio | 3.97 (3.50 to 4.51) | 3.25 (2.86 to 3.69) | 2 to 47% * | 0.80 | −8 to 30% | 0.35 |
| LDL-C (mmol·L−1) | 2.72 (2.42 to 3.06) | 2.45 (2.18 to 2.76) | −6 to 31% | 0.45 | −12 to 25% | 0.20 |
| Triacylglycerol (mmol·L−1) | 1.16 (0.91 to 1.48) | 0.81 (0.63 to 1.03) | 1 to 102% * | 0.74 | −18 to 48% | 0.20 |
| South Asians (n = 16) | White Europeans (n = 16) | Model 1 a | Model 2 b | |||
|---|---|---|---|---|---|---|
| White Europeans vs. South Asians 95% CI c | Effect Size | White Europeans vs. South Asians 95% CI c | Effect Size | |||
| Glucose | ||||||
| Fasted (mmol·L−1) | 4.50 (4.28 to 4.74) | 4.71 (4.47 to 4.96) | −11 to 3% | 0.45 | −12 to 3% | 0.51 |
| 2 h (mmol·L−1) | 4.78 (4.11 to 5.56) | 4.16 (3.58 to 4.83) | −7 to 42% | 0.47 | −14 to 35% | 0.25 |
| Insulin | ||||||
| Fasted (µU·mL−1) | 7.21 (4.90 to 10.60) | 4.22 (2.87 to 6.20) | −1 to 195% | 1.06 | −18 to 118% | 0.58 |
| 2 h (µU·mL−1) | 23.49 (10.32 to 53.49) | 5.84 (2.56 to 13.29) | 26 to 1188% * | 1.28 | −10 to 391% | 0.68 |
| HOMA-IR | 1.50 (1.00 to 2.26) | 0.91 (0.60 to 1.36) | −7 to 195% | 0.94 | −23 to 109% | 0.44 |
| Insulin sensitivity index | 5.62 (3.32 to 9.49) | 14.41 (8.53 to 24.36) | −81 to −18% * | 1.22 | −65 to 1% | 0.68 |
© 2019 by the authors. Licensee MDPI, Basel, Switzerland. This article is an open access article distributed under the terms and conditions of the Creative Commons Attribution (CC BY) license (http://creativecommons.org/licenses/by/4.0/).
Share and Cite
Benedetti, S.; Al-Tannak, N.F.; Alzharani, M.; Moir, H.J.; Stensel, D.J.; Thackray, A.E.; Naughton, D.P.; Dorak, M.T.; Spendiff, O.; Hill, N.; et al. Plasma Free Fatty Acids Metabolic Profile with LC-MS and Appetite-Related Hormones in South Asian and White European Men in Relation to Adiposity, Physical Activity and Cardiorespiratory Fitness: A Cross-Sectional Study. Metabolites 2019, 9, 71. https://doi.org/10.3390/metabo9040071
Benedetti S, Al-Tannak NF, Alzharani M, Moir HJ, Stensel DJ, Thackray AE, Naughton DP, Dorak MT, Spendiff O, Hill N, et al. Plasma Free Fatty Acids Metabolic Profile with LC-MS and Appetite-Related Hormones in South Asian and White European Men in Relation to Adiposity, Physical Activity and Cardiorespiratory Fitness: A Cross-Sectional Study. Metabolites. 2019; 9(4):71. https://doi.org/10.3390/metabo9040071
Chicago/Turabian StyleBenedetti, Simone, Naser F. Al-Tannak, Mansour Alzharani, Hannah J. Moir, David J. Stensel, Alice E. Thackray, Declan P. Naughton, Mehmet T. Dorak, Owen Spendiff, Natasha Hill, and et al. 2019. "Plasma Free Fatty Acids Metabolic Profile with LC-MS and Appetite-Related Hormones in South Asian and White European Men in Relation to Adiposity, Physical Activity and Cardiorespiratory Fitness: A Cross-Sectional Study" Metabolites 9, no. 4: 71. https://doi.org/10.3390/metabo9040071
APA StyleBenedetti, S., Al-Tannak, N. F., Alzharani, M., Moir, H. J., Stensel, D. J., Thackray, A. E., Naughton, D. P., Dorak, M. T., Spendiff, O., Hill, N., Watson, D. G., & Allgrove, J. (2019). Plasma Free Fatty Acids Metabolic Profile with LC-MS and Appetite-Related Hormones in South Asian and White European Men in Relation to Adiposity, Physical Activity and Cardiorespiratory Fitness: A Cross-Sectional Study. Metabolites, 9(4), 71. https://doi.org/10.3390/metabo9040071