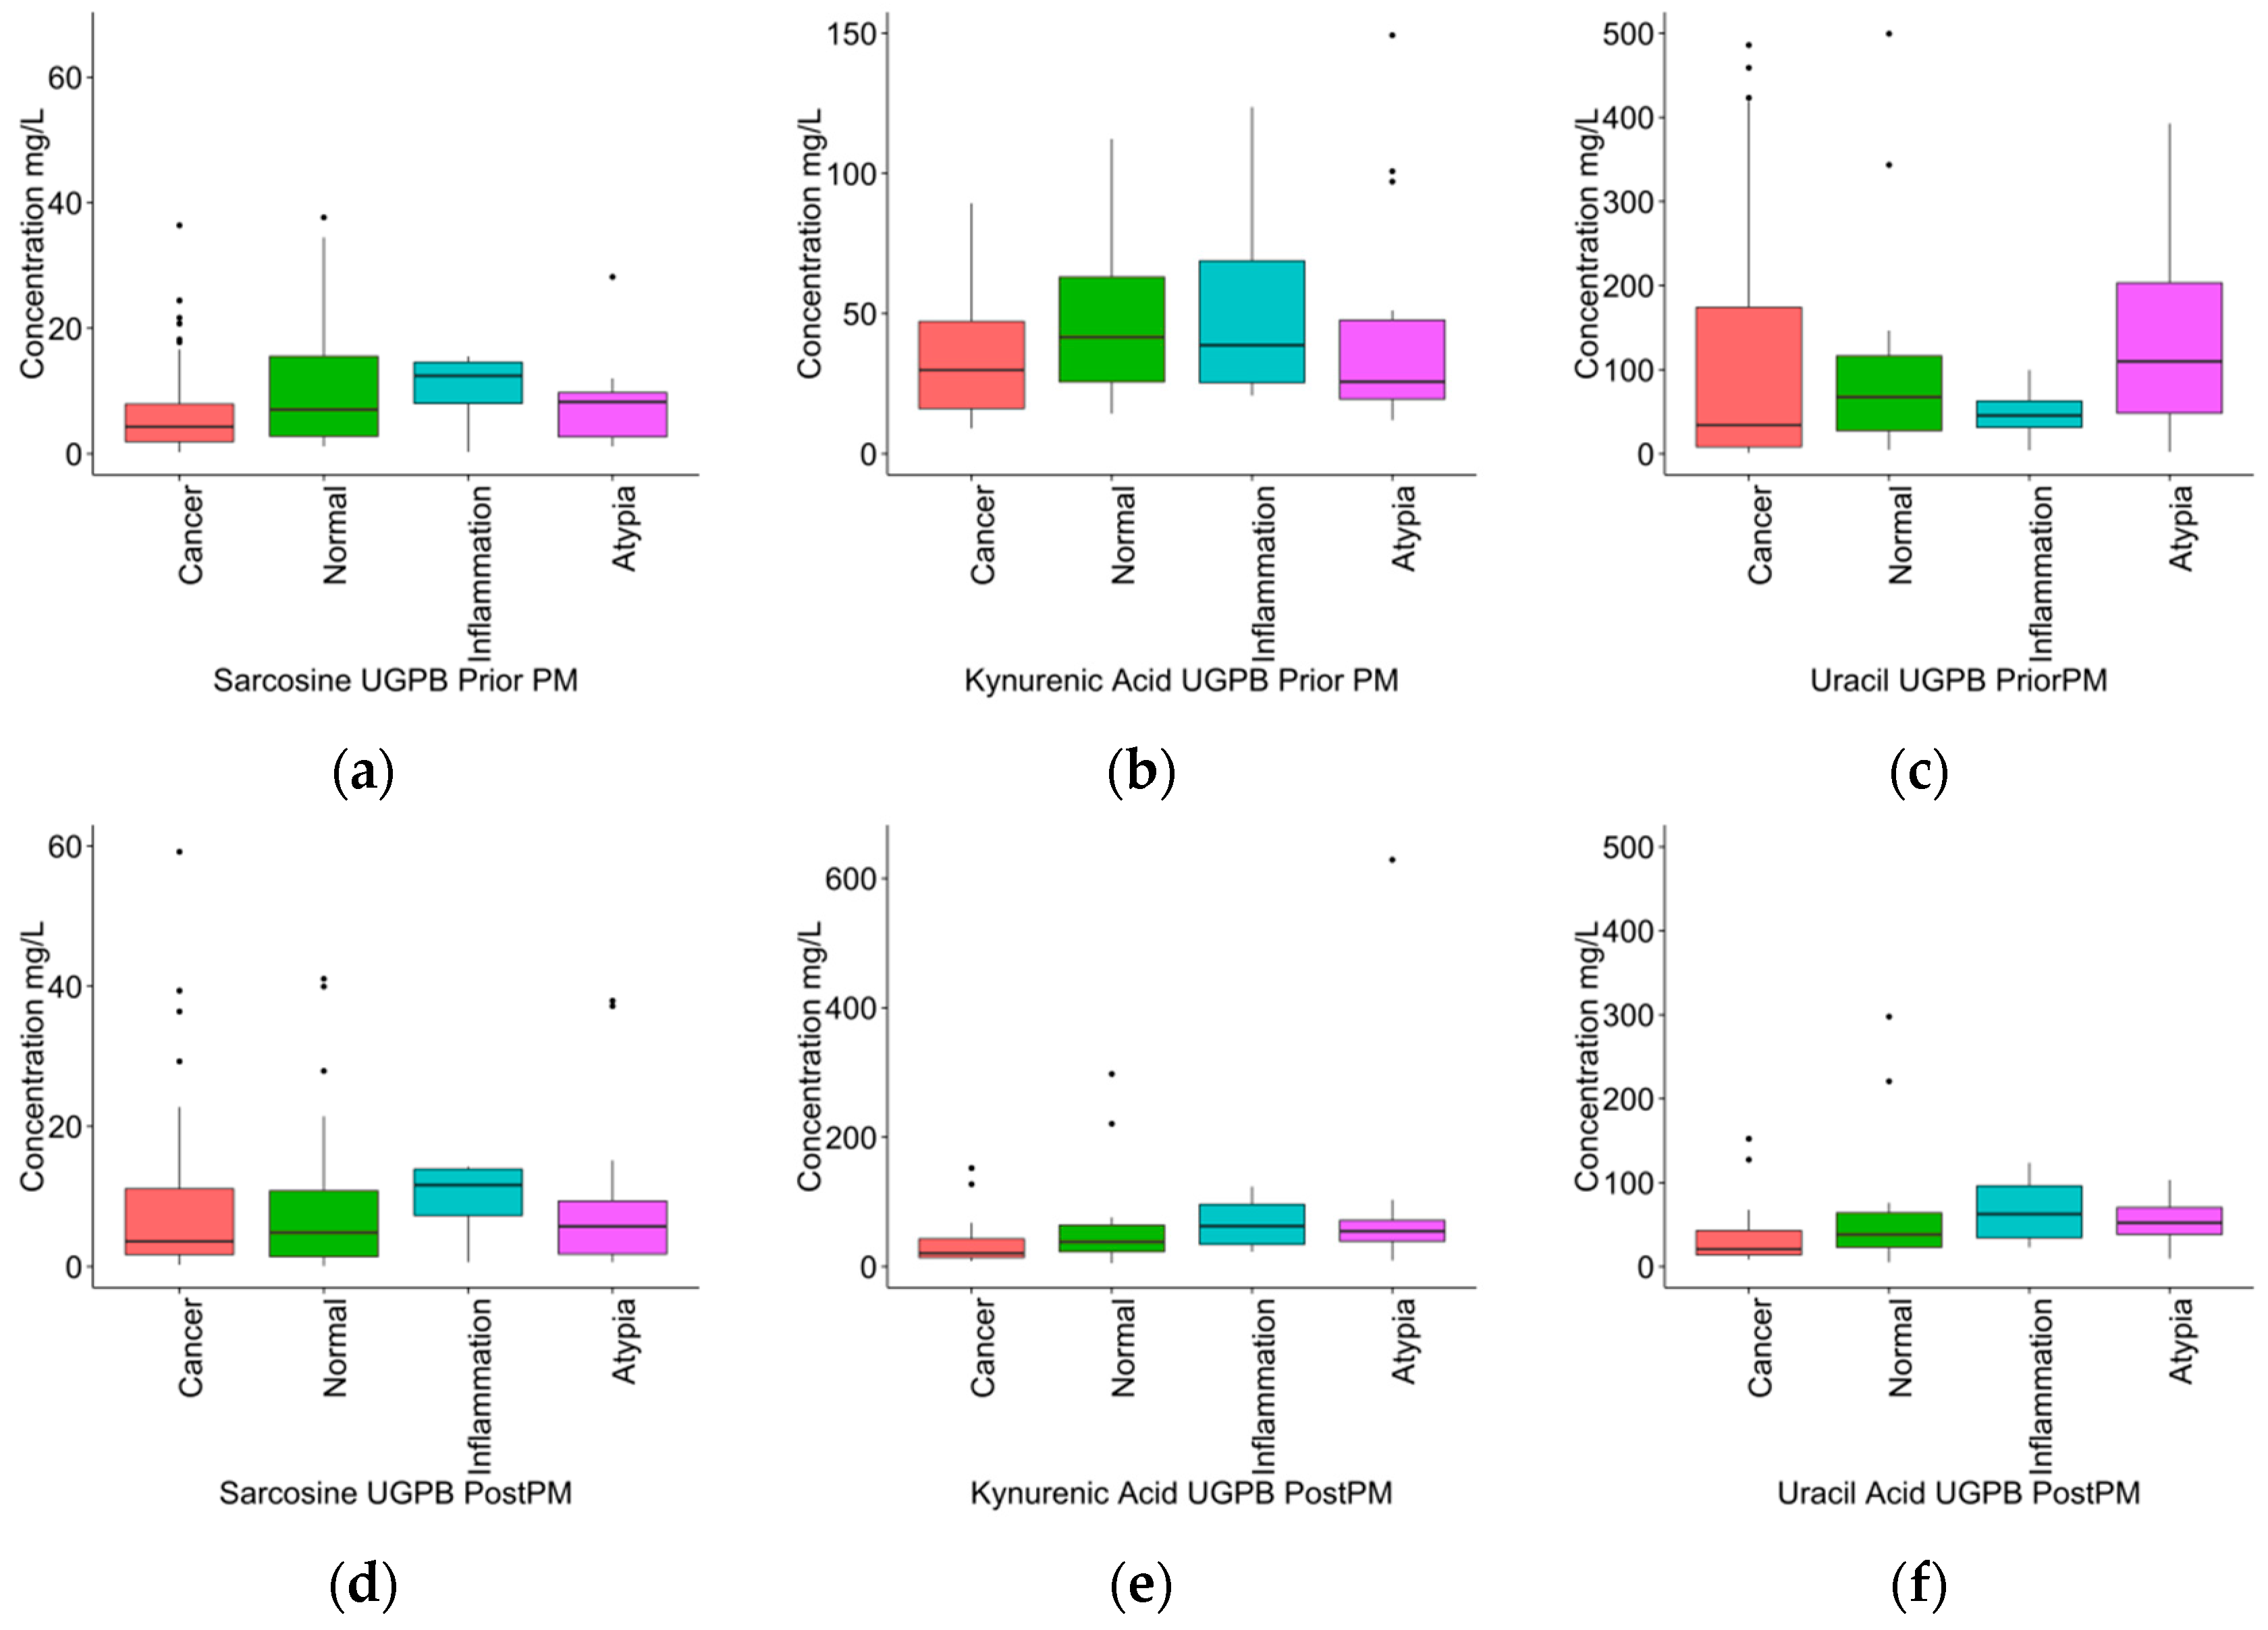
Initially, UGPB group was studied in order to investigate any correlation between the levels of sarcosine, kynurenic acid, and uracil in urine samples with the histopathologic results such as positive or negative in cancer, atypia, and inflammation. LC-MS/MS results from prior and post prostatic massage (PM) were treated separately. Multivariate statistical analysis showed that the studied variables could not contribute to differentiation of the healthy participants from those with cancer, inflammation, or atypia. In
Table 4, results from univariate statistical analysis of the urine metabolic data from pre- and post-PM can be observed. Although there were no statistical significant observations, in general sarcosine presented at higher concentration levels in case of inflammation for both pre- and post-PM categories and uracil levels were found increased in participants with normal results after UGPB only in samples that collected after PM. With regard to kynurenic acid, the average concentration in samples collected prior to PM was higher than the average concentration found in healthy subjects after UGPB; the case of post-PM urine was increased in patients with atypia. Box plots of sarcosine, uracil, and kynurenic acid in the UGPB group are shown in
Figure 1.
In the second step, concentration levels of the studied metabolites in patients with positive histopathologic results after UGPB procedure and patients from group A (RP) were compared to the rest of the patients in group B, with histopathologic results negative in cancer, atypia, and inflammation. With regards to group B, only data from pre-PM urine samples were taken into consideration. In
Table 5 results from non-parametric statistical analysis are presented. Again, differences observed between the concentration levels of metabolites in the studied groups did not present any statistical significance. However, sarcosine was still found at slightly higher levels in urine samples of patients with inflammation of the prostatic tissue, uracil decreased in urine samples of patients with atypia and overall, patients with normal histopathologic results had the highest concentrations of kynurenic acid.
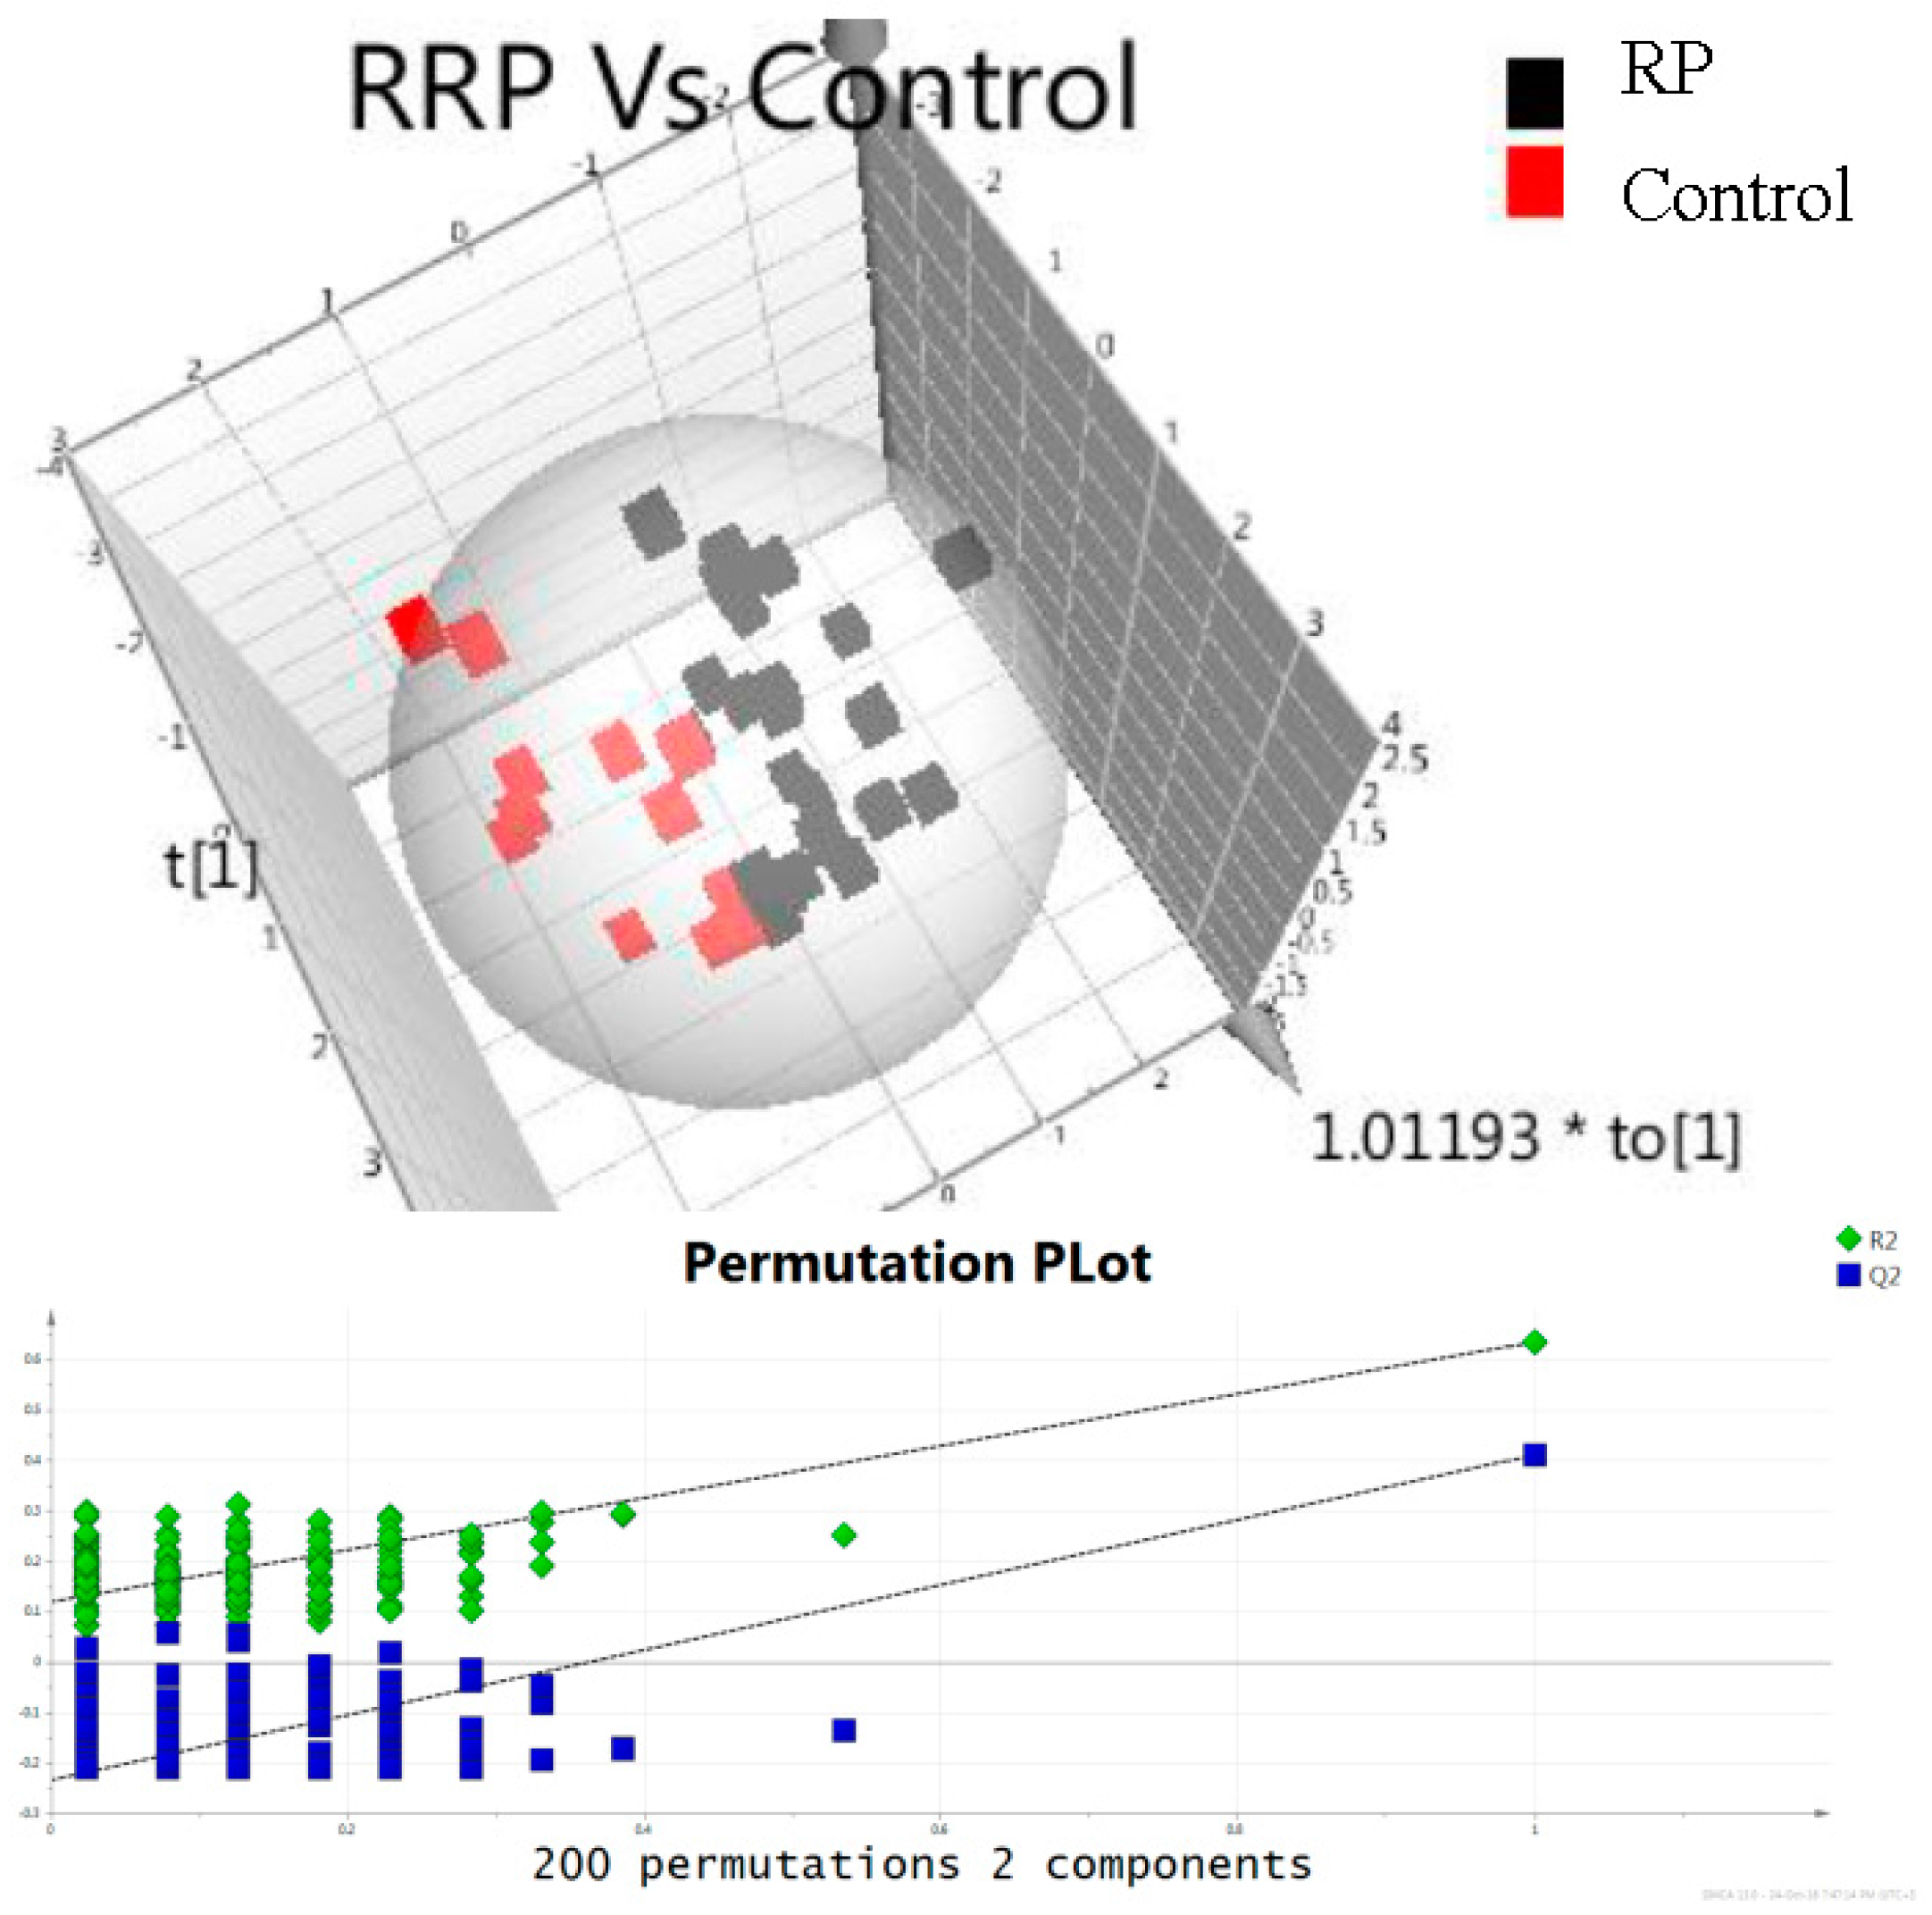
Finally, concentrations of metabolites in urine samples of patients in the three groups were examined (groups A, B, and C). Multivariate statistical analysis was performed in order to find any correlation between the studied metabolites and prostate cancer. In
Figure 2, 3D Orthogonal Partial Least Square Discriminant analysis score plot of data obtained from samples of patients in group A and C is illustrated. Evaluation of the data set was performed on PLS-DA model using permutation test in order to guard against model overfitting. Results showed that the predictive value of the model is satisfactory. The data set provides robust models with high predictability as suggested by R2Y (cum) and Q2 values (0.634 and 0.410). In
Table 6, results from univariate statistical analysis are shown. Participants with PCa undergoing RP presented highest sarcosine and uracil concentrations compare to those undergoing UGPB and controls (
p = 0.01,
Table 6). In the case of kynurenic acid, statistically significant higher concentration levels were observed in the control group compared to group A (
p = 0.019) and B (
p = 0.004).
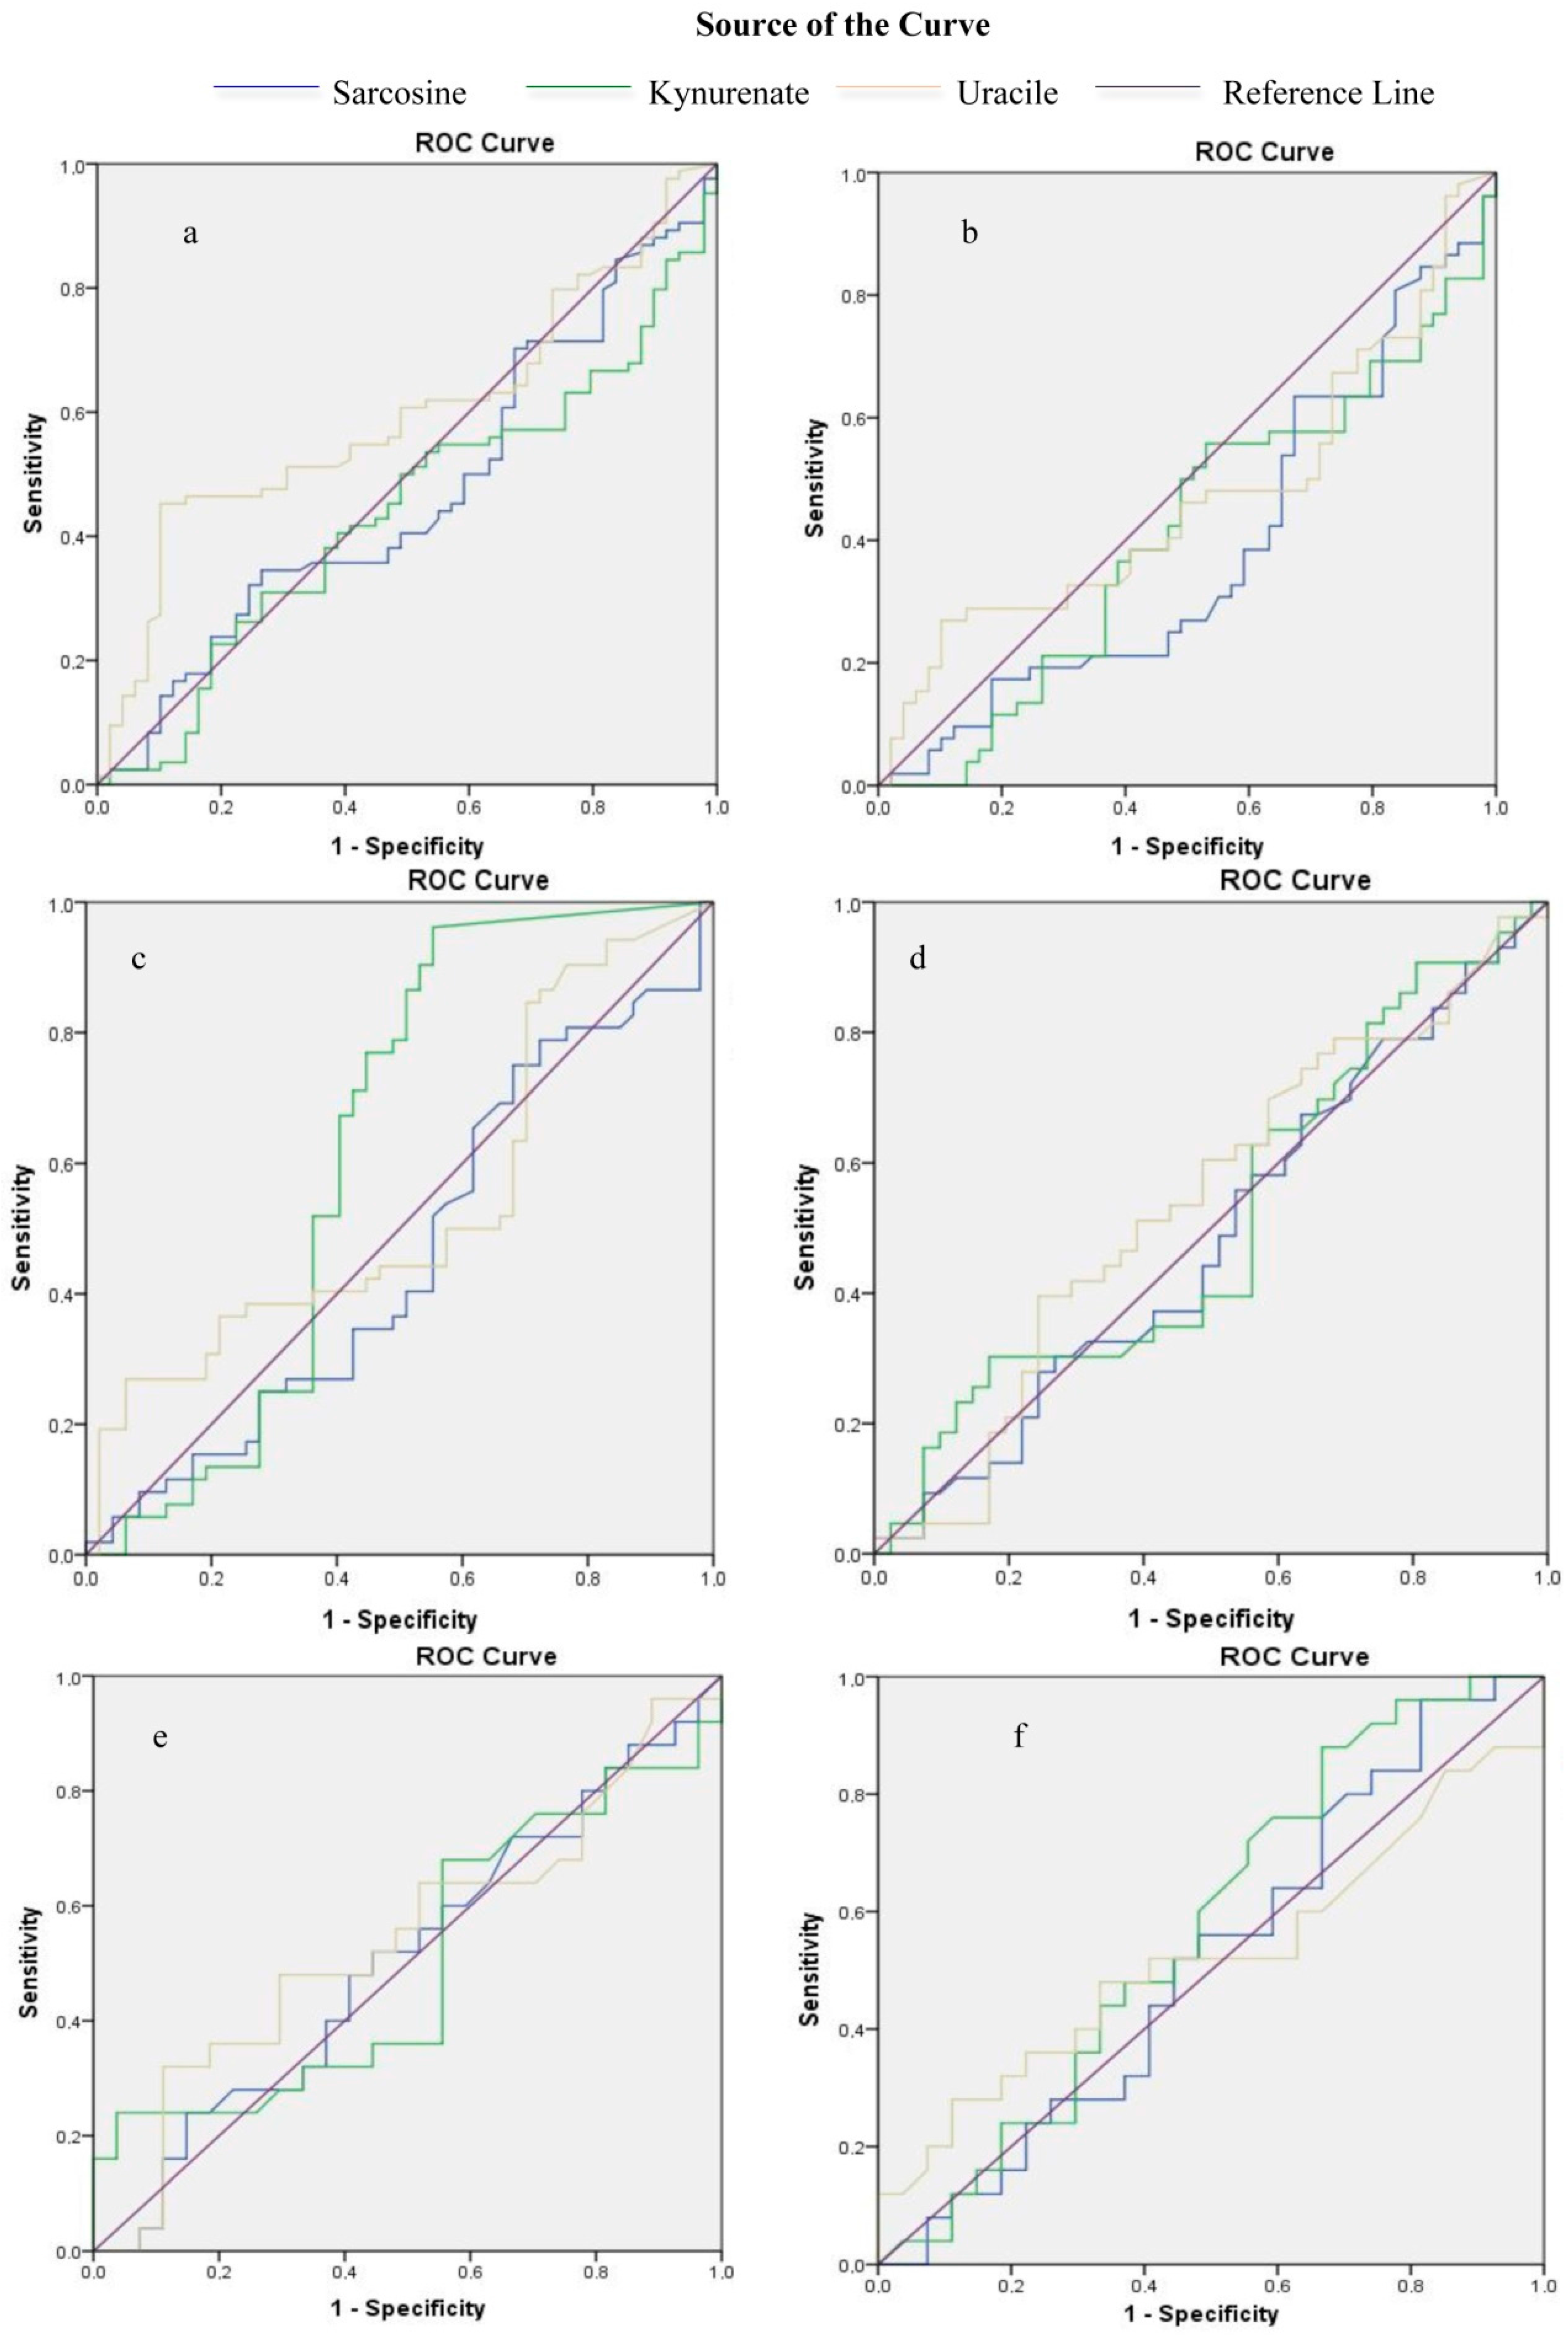
In order to investigate the diagnostic value of endogenous metabolites, ROC analysis was performed. Biopsy results were used as a cut-off point between positive and negative results. Initially, analysis was performed for all participants and it was observed that both sarcosine (AUC: 0.47,
p = 0.554) and kynurenic acid (AUC: 0.44,
p = 0.251), had no diagnostic value. Uracil (AUC: 0.59,
p = 0.066) showed the highest diagnostic value although not statistically significant (
Figure 3a,
Table S1 in
Supplementary Materials). In patients undergoing UGPB none of the studied metabolites detected in pre-PM samples showed diagnostic potential (sarcosine: AUC: 0.38,
p = 0.044, kynurenic acid: AUC: 0.41,
p = 0.128, uracil AUC: 0.47,
p = 0.594). Kynurenic acid in post-PM urine samples presented the highest significant diagnostic value (AUC: 0.62,
p = 0.041) compared to sarcosine and uracil (sarcosine: AUC: 0.46,
p = 0.473, uracil: AUC: 0.54,
p = 0.492) (
Figure 3b,c,
Tables S2 and S3 in
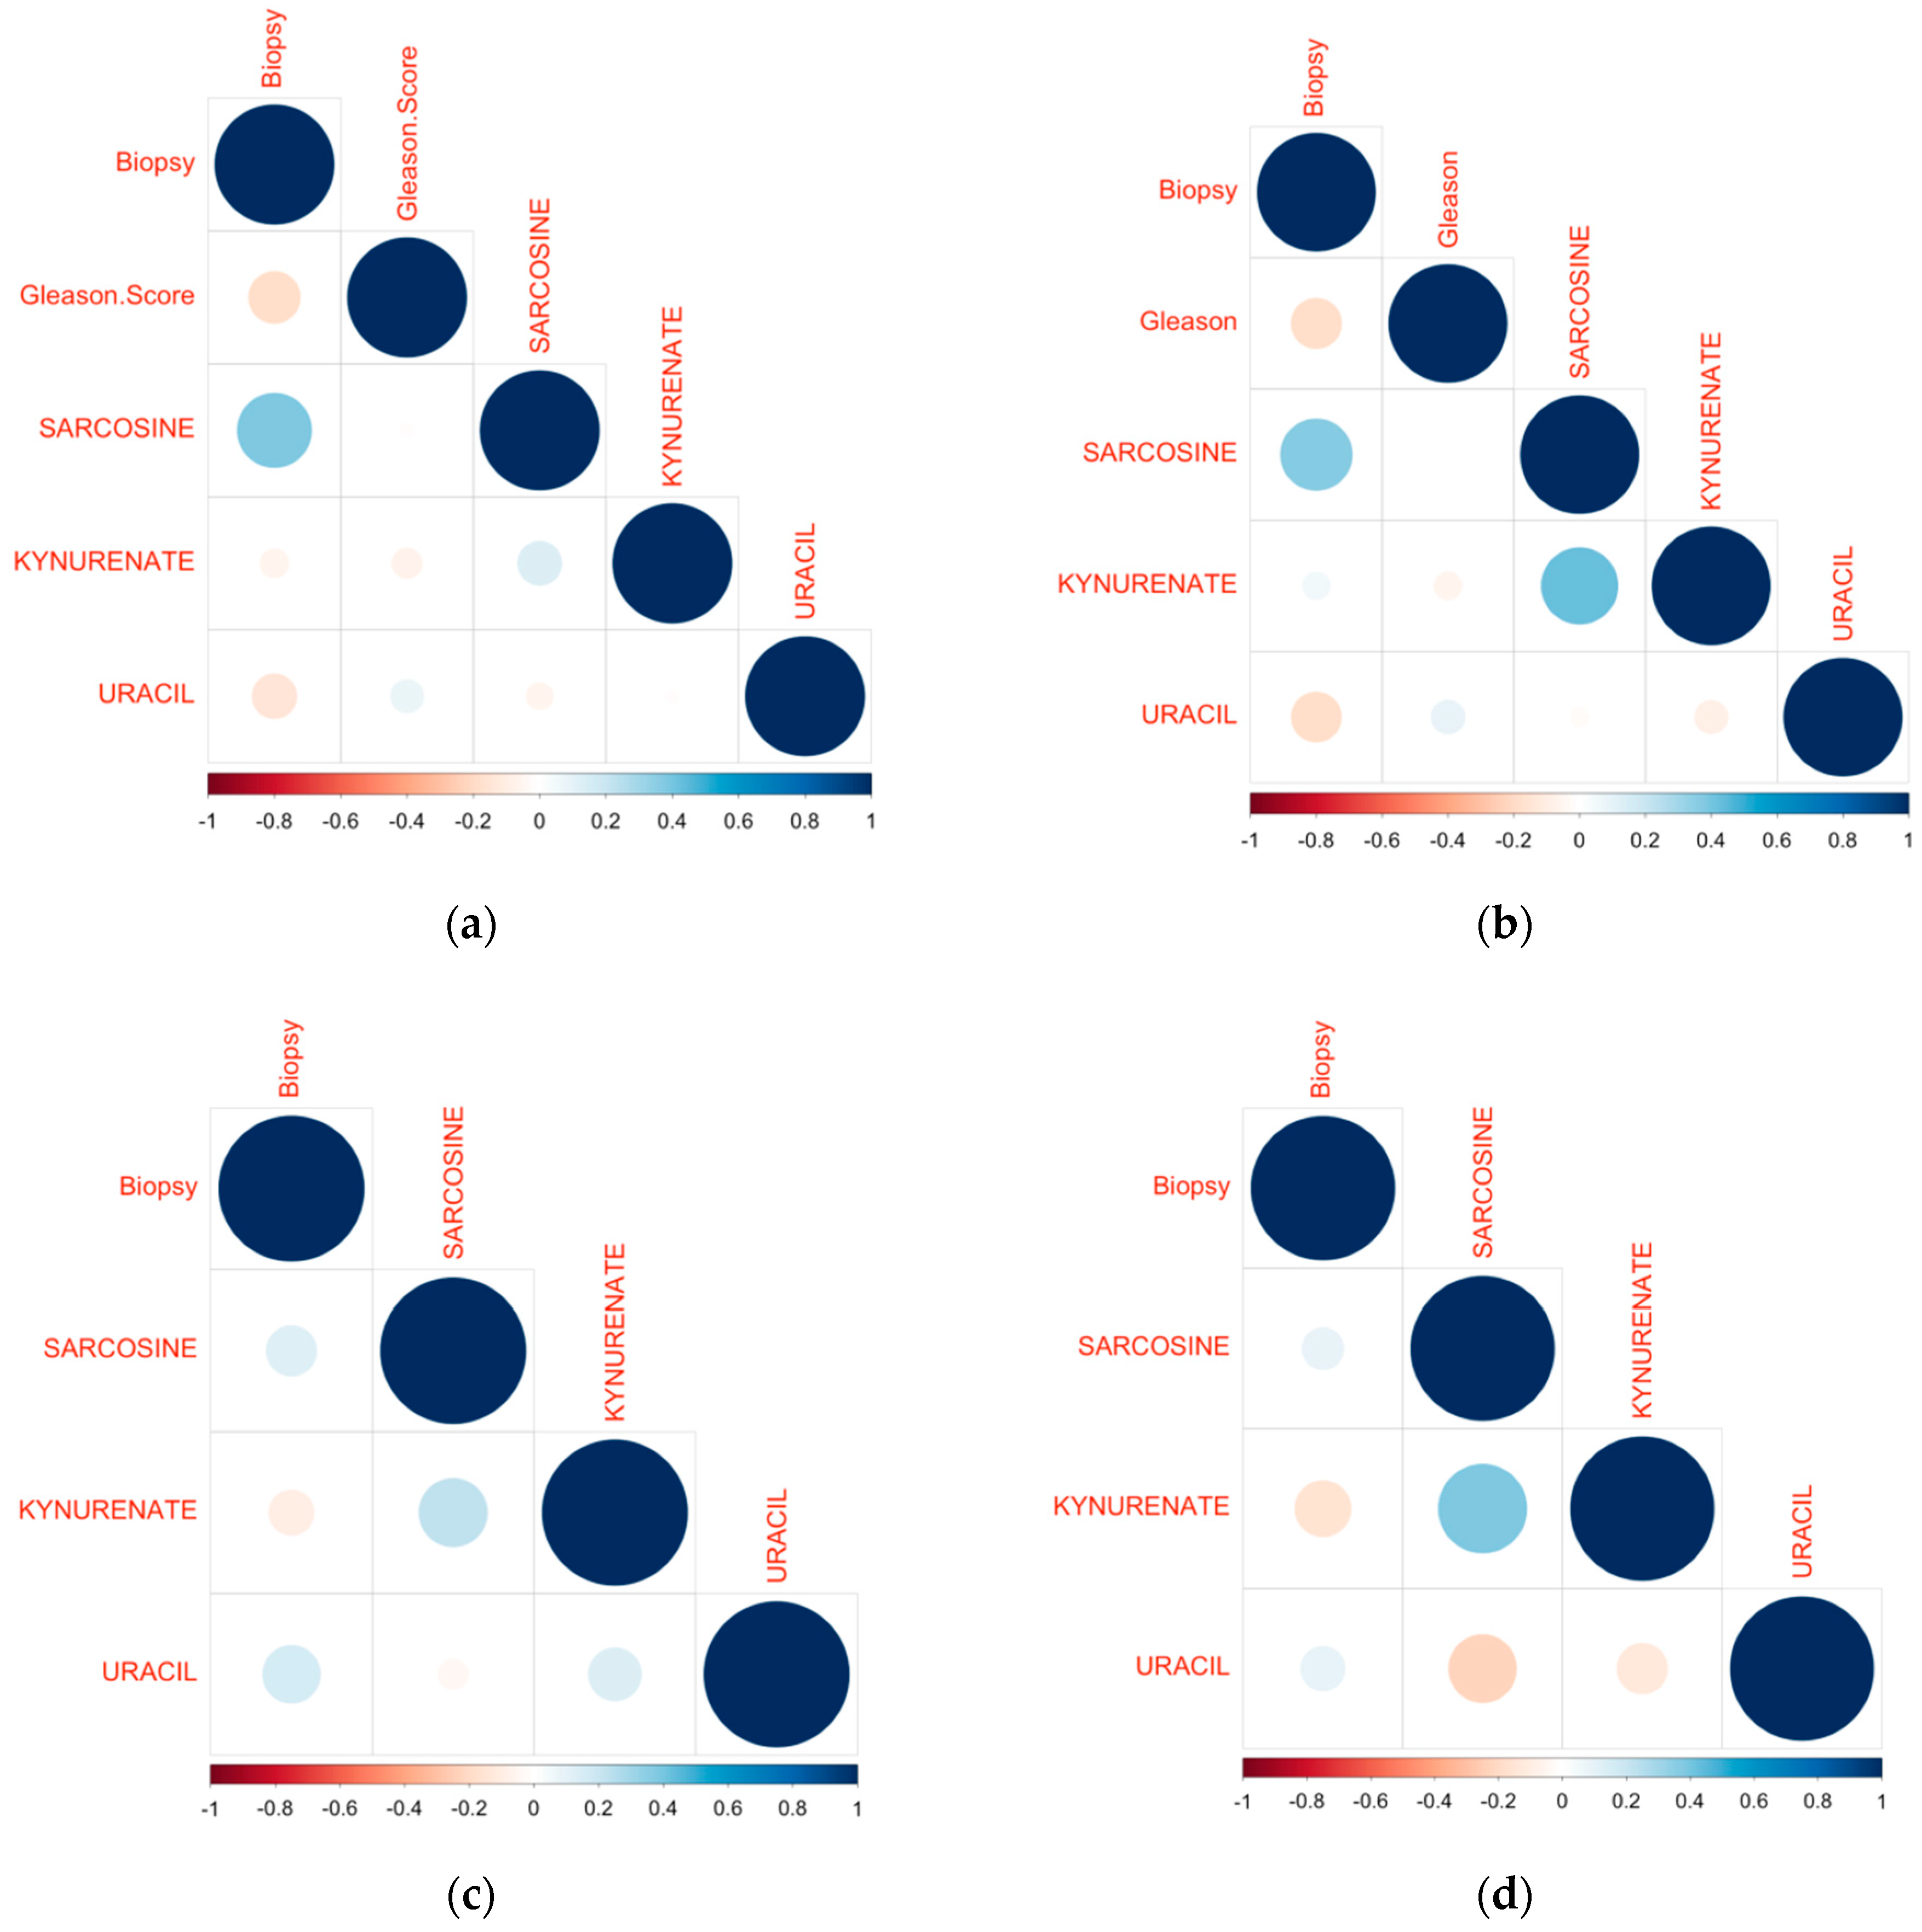
Supplementary Material). Pearson correlation was also performed on data from patients in group B found positive in prostate cancer. In
Figure 4a,b (Pearson correlation heatmap) it can be observed that sarcosine correlates positively with biopsy results in both pre- and post-PM cases.
Figure 4c,d presents the Pearson correlation heatmap with regard to patients from group B found negative in prostate cancer. For both pre- and post-PM cases, uracil and sarcosine correlate positively, while kynurenic acid correlates negatively with biopsy results. ROC curves were also used to investigate the diagnostic value of endogenous metabolites in the monitoring of PCa progression. Gleason score was used as a cut-off point between high and low aggression. Again, results from urine samples of all participants did not show any predictive value, for sarcosine (AUC: 0.48,
p = 0.819), kynurenic acid (AUC: 0.51,
p = 0.858), and uracil (AUC: 0.54,
p = 0.525) (statistically non-significant,
Figure 3d,
Table S4 in
Supplementary Materials). Low diagnostic value was observed for uracil in pre-PM urine samples of patients undergoing UGPB (uracil: AUC: 0.54,
p = 0.595, sarcosine: AUC: 0.51,
p = 0.927, kynurenic acid: AUC: 0.5,
p = 0.985), while kynurenic acid showed a slightly increased diagnostic value in post-PM urine samples (kynurenic acid: AUC: 0.57,
p = 0.36, sarcosine: AUC: 0.52,
p = 0.84, uracil: AUC: 0.52,
p = 0.777) (
Figure 3e,f,
Tables S5 and S6 in
Supplementary Materials), however both findings were not statistically significant.
Additionally, Pearson correlation was performed in order to assess any correlation between the detected metabolites in patients with prostate cancer from group B and Gleason score, and only kynurenic acid was found to slightly correlate negatively (−0.2) with Gleason score.


