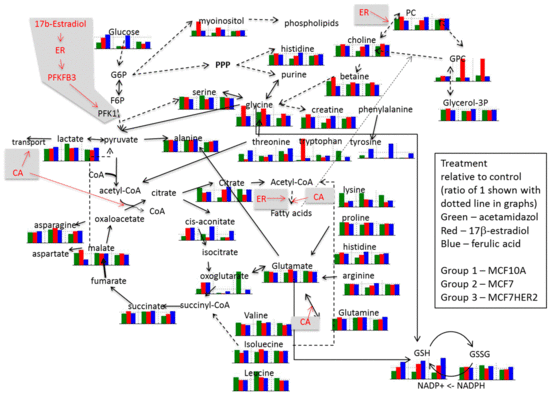
Metabolic Effect of Estrogen Receptor Agonists on Breast Cancer Cells in the Presence or Absence of Carbonic Anhydrase Inhibitors
Abstract
:1. Introduction
2. Results and Discussion
3. Experimental Section
3.1. Reagents
3.2. Cell Culture and Western Blot
3.3. Cell Viability and Western Blot
3.4. Hydrophilic and Lipophilic Metabolites Extraction
3.5. NMR Experimentation and Preprocessing
3.6. Metabolite Quantification
4. Conclusions
Supplementary Materials
Supplementary File 1Acknowledgments
Author Contributions
Conflicts of Interest
References
- Curtis, C.; Shah, S.P.; Chin, S.-F.; Turashvili, G.; Rueda, O.M.; Dunning, M.J.; Speed, D.; Lynch, A.G.; Samarajiwa, S.; Yuan, Y.; et al. The genomic and transcriptomic architecture of 2,000 breast tumours reveals novel subgroups. Nature 2012, 486, 346–352. [Google Scholar] [CrossRef] [PubMed]
- Denkert, C.; Bucher, E.; Hilvo, M.; Salek, R.; Oresic, M.; Griffin, J.; Brockmoeller, S.; Klauschen, F.; Loibl, S.; Barupal, D.K.; et al. Metabolomics of human breast cancer: New approaches for tumor typing and biomarker discovery. Genome. Med. 2012, 4, 37. [Google Scholar] [PubMed]
- Lage, H. Drug resistance in breast cancer. Cancer Ther. 2003, 1, 81–91. [Google Scholar]
- Viale, G. The current state of breast cancer classification. Ann. Oncol. 2012, 23 (Suppl. 10), x207–x210. [Google Scholar] [CrossRef] [PubMed]
- Biswas, D.K.; Cruz, A.P.; Gansberger, E.; Pardee, A.B. Epidermal growth factor-induced nuclear factor kappa B activation: A major pathway of cell-cycle progression in estrogen-receptor negative breast cancer cells. Proc. Natl. Acad. Sci. USA 2000, 97, 8542–8547. [Google Scholar] [CrossRef] [PubMed]
- Ahmed, S.; Sami, A.; Xiang, J. HER2-directed therapy: Current treatment options for HER2-positive breast cancer. Breast Cancer 2015, 22, 101–116. [Google Scholar] [CrossRef] [PubMed]
- Vilquin, P.; Cohen, P.; Maudelonde, T.; Tredan, O.; Treilleux, I.; Bachelot, T.; Heudel, P.-E. [New therapeutical strategies in metastatic hormone-dependent breast cancer]. Bull. Cancer 2015, 102, 367–380. [Google Scholar] [CrossRef] [PubMed]
- Perillo, B.; Sasso, A.; Abbondanza, C.; Palumbo, G. 17beta-estradiol inhibits apoptosis in MCF-7 cells, inducing bcl-2 expression via two estrogen-responsive elements present in the coding sequence. Mol. Cell. Biol. 2000, 20, 2890–2901. [Google Scholar] [CrossRef] [PubMed]
- Kahlert, S.; Nuedling, S.; van Eickels, M.; Vetter, H.; Meyer, R.; Grohe, C. Estrogen receptor alpha rapidly activates the IGF-1 receptor pathway. J. Biol. Chem. 2000, 275, 18447–18453. [Google Scholar] [CrossRef] [PubMed]
- Imbert-Fernandez, Y.; Telang, S.; Chesney, J. Simultaneous inhibition of the estrogen receptor and 6-phosphofructo-2-kinase (PFKFB3) for the treatment of ER+ breast cancer. Cancer Metab. 2014, 2, P29. [Google Scholar] [CrossRef]
- Nieva, C.; Marro, M.; Santana-Codina, N.; Rao, S.; Petrov, D.; Sierra, A. The Lipid Phenotype of Breast Cancer Cells Characterized by Raman Microspectroscopy: Towards a Stratification of Malignancy. PLoS ONE 2012, 7, e46456. [Google Scholar] [CrossRef] [PubMed]
- Belkaid, A.; Duguay, S.R.; Ouellette, R.J.; Surette, M.E. 17β-estradiol induces stearoyl-CoA desaturase-1 expression in estrogen receptor-positive breast cancer cells. BMC Cancer 2015, 15, 440. [Google Scholar] [CrossRef] [PubMed]
- Noto, A.; Raffa, S.; De Vitis, C.; Roscilli, G.; Malpicci, D.; Coluccia, P.; Di Napoli, A.; Ricci, A.; Giovagnoli, M.R.; Aurisicchio, L.; et al. Stearoyl-CoA desaturase-1 is a key factor for lung cancer-initiating cells. Cell Death Dis. 2013, 4, e947. [Google Scholar] [CrossRef] [PubMed]
- Fritz, V.; Benfodda, Z.; Rodier, G.; Henriquet, C.; Iborra, F.; Avancès, C.; Allory, Y.; de la Taille, A.; Culine, S.; Blancou, H.; et al. Abrogation of de novo lipogenesis by stearoyl-CoA desaturase 1 inhibition interferes with oncogenic signaling and blocks prostate cancer progression in mice. Mol. Cancer Ther. 2010, 9, 1740–1754. [Google Scholar] [CrossRef] [PubMed]
- Barnett, D.H.; Sheng, S.; Howe Charn, T.; Waheed, A.; Sly, W.S.; Lin, C.Y.; Liu, E.T.; Katzenellenbogen, B.S. Estrogen Receptor Regulation of Carbonic Anhydrase XII through a Distal Enhancer in Breast Cancer. Cancer Res. 2008, 68, 3505–3515. [Google Scholar] [CrossRef] [PubMed]
- Carradori, S.; De Monte, C.; D’Ascenzio, M.; Secci, D.; Celik, G.; Ceruso, M.; Vullo, D.; Scozzafava, A.; Supuran, C.T. Salen and tetrahydrosalen derivatives act as effective inhibitors of the tumor-associated carbonic anhydrase XII—A new scaffold for designing isoform-selective inhibitors. Bioorg. Med. Chem. Lett. 2013, 23, 6759–6763. [Google Scholar] [CrossRef] [PubMed]
- Innocenti, A.; Beyza Öztürk Sarıkaya, S.; Gülçin, İ.; Supuran, C.T. Carbonic anhydrase inhibitors. Inhibition of mammalian isoforms I–XIV with a series of natural product polyphenols and phenolic acids. Bioorg. Med. Chem. 2010, 18, 2159–2164. [Google Scholar] [CrossRef] [PubMed]
- Breton, S. The cellular physiology of carbonic anhydrases. J. Pancreas 2001, 2, 159–164. [Google Scholar]
- Supuran, C.T. Carbonic anhydrases: Novel therapeutic applications for inhibitors and activators. Nat. Rev. Drug Discov. 2008, 7, 168–181. [Google Scholar] [CrossRef] [PubMed]
- Jamali, S.; Klier, M.; Ames, S.; Felipe Barros, L.; McKenna, R.; Deitmer, J.W.; Becker, H.M. Hypoxia-induced carbonic anhydrase IX facilitates lactate flux in human breast cancer cells by non-catalytic function. Sci. Rep. 2015, 5, 13605. [Google Scholar] [CrossRef] [PubMed]
- Supuran, C.T.; Winum, J.-Y. Carbonic anhydrase IX inhibitors in cancer therapy: An update. Future Med. Chem. 2015, 7, 1407–1414. [Google Scholar] [CrossRef] [PubMed]
- Gohil, K.J.; Kshirsagar, S.B.; Sahane, R.S. Ferulic acid—Comprehensive pharmacology of important bioflavonoid. Int. J. Pharm. Sci. Res. 2012, 3, 700–710. [Google Scholar]
- Chang, C.J.; Chiu, J.H.; Tseng, L.M.; Chang, C.H.; Chien, T.M.; Wu, C.W.; Lui, W.Y. Modulation of HER2 expression by ferulic acid on human breast cancer MCF7 cells. Eur. J. Clin. Invest. 2006, 36, 588–596. [Google Scholar] [CrossRef] [PubMed]
- Cuperlovic-Culf, M.; Touaibia, M.; St-Coeur, P.-D.; Poitras, J.; Morin, P., Jr.; Culf, A. Metabolic Effects of Known and Novel HDAC and SIRT Inhibitors in Glioblastomas Independently or Combined with Temozolomide. Metabolites 2014, 4, 807–830. [Google Scholar] [CrossRef] [PubMed]
- Lefort, N.; Brown, A.; Lloyd, V.; Ouellette, R.; Touaibia, M.; Culf, A.S.; Cuperlovic-Culf, M. 1H NMR metabolomics analysis of the effect of dichloroacetate and allopurinol on breast cancers. J. Pharm. Biomed. Anal. 2014, 93, 77–85. [Google Scholar] [CrossRef] [PubMed]
- Morin, P.J.; Ferguson, D.; LeBlanc, L.M.; Hébert, M.J.G.; Paré, A.F.; Jean-François, J.; Surette, M.E.; Touaibia, M.; Cuperlovic-Culf, M. NMR Metabolomics Analysis of the Effects of 5-Lipoxygenase Inhibitors on Metabolism in Glioblastomas. J. Proteome Res. 2013, 12, 2165–2176. [Google Scholar] [CrossRef] [PubMed]
- Serafim, T.L.; Carvalho, F.S.; Marques, M.P.M.; Calheiros, R.; Silva, T.; Garrido, J.; Milhazes, N.; Borges, F.; Roleira, F.; Silva, E.T.; et al. Lipophilic Caffeic and Ferulic Acid Derivatives Presenting Cytotoxicity against Human Breast Cancer Cells. Chem. Res. Toxicol. 2011, 24, 763–774. [Google Scholar] [CrossRef] [PubMed]
- Mojzych, M.; Bielawska, A.; Bielawski, K.; Ceruso, M.; Supuran, C.T. Pyrazolo[4,3-e][1,2,4]triazine sulfonamides as carbonic anhydrase inhibitors with antitumor activity. Bioorg. Med. Chem. 2014, 22, 2643–2647. [Google Scholar] [CrossRef] [PubMed]
- Stander, B.A.; Joubert, F.; Tu, C.; Sippel, K.H.; McKenna, R.; Joubert, A.M. Signaling Pathways of ESE-16, an Antimitotic and Anticarbonic Anhydrase Estradiol Analog, in Breast Cancer Cells. PLoS ONE 2013, 8, e53853. [Google Scholar] [CrossRef]
- Tennant, D.A.; Durán, R.V.; Gottlieb, E. Targeting metabolic transformation for cancer therapy. Nat. Rev. Cancer 2010, 10, 267–277. [Google Scholar] [CrossRef] [PubMed]
- Gottschalk, M.; Ivanova, G.; Collins, D.M.; Eustace, A.; O’Connor, R.; Brougham, D.F. Metabolomic studies of human lung carcinoma cell lines using in vitro 1H NMR of whole cells and cellular extracts. NMR Biomed. 2008, 21, 809–819. [Google Scholar] [CrossRef] [PubMed]
- Cuperlovic-Culf, M.; Ferguson, D.; Culf, A.; Morin, P.; Touaibia, M. 1H NMR Metabolomics Analysis of Glioblastoma Subtypes: Correlation between metabolomics and gene expression characteristic. J. Biol. Chem. 2012, 287, 20164–20175. [Google Scholar] [CrossRef] [PubMed]
- Meadows, A.L.; Kong, B.; Berdichevsky, M.; Roy, S.; Rosiva, R.; Blanch, H.W.; Clark, D.S. Metabolic and Morphological Differences between Rapidly Proliferating Cancerous and Normal Breast Epithelial Cells. Biotechnol. Prog. 2008, 24, 334–341. [Google Scholar] [CrossRef] [PubMed]
- Vousden, K.H.; Ryan, K.M. p53 and metabolism. Nat. Rev. Cancer 2009, 9, 691–700. [Google Scholar] [CrossRef] [PubMed]
- Yecies, J.L.; Manning, B.D. mTOR links oncogenic signaling to tumor cell metabolism. J. Mol. Med. 2011, 89, 221–228. [Google Scholar] [CrossRef] [PubMed]
- Aboagye, E.O.; Bhujwalla, Z.M. Malignant transformation alters membrane choline phospholipid metabolism of human mammary epithelial cells. Cancer Res. 1999, 59, 80–84. [Google Scholar] [PubMed]
- Espenshade, P.J. SREBPs: Sterol-regulated transcription factors. J. Cell Sci. 2006, 119, 973–976. [Google Scholar] [CrossRef] [PubMed]
- Santos, C.R.; Schulze, A. Lipid metabolism in cancer. Febs J. 2012, 279, 2610–2623. [Google Scholar] [CrossRef] [PubMed]
- St-Coeur, P.-D.; Touaibia, M.; Cuperlovic-Culf, M.; Morin, P.J. Leveraging Metabolomics to Assess the Next Generation of Temozolomide-based Therapeutic Approaches for Glioblastomas. Genomics, Proteomics Bioinform. 2013, 11, 199–206. [Google Scholar] [CrossRef] [PubMed]
- Savorani, F.; Tomasi, G.; Engelsen, S.B. icoshift: A versatile tool for the rapid alignment of 1D NMR spectra. J. Magn. Reson. 2010, 202, 190–202. [Google Scholar] [CrossRef] [PubMed]
- Tusher, V.G.; Tibshirani, R.; Chu, G. Significance analysis of microarrays applied to the ionizing radiation response. Proc. Natl. Acad. Sci. USA 2001, 98, 5116–5121. [Google Scholar] [CrossRef] [PubMed]
- Wishart, D.S.; Jewison, T.; Guo, A.C.; Wilson, M.; Knox, C.; Liu, Y.; Djoumbou, Y.; Mandal, R.; Aziat, F.; Dong, E.; et al. HMDB 3.0—The Human Metabolome Database in 2013. Nucleic Acids Res. 2012, 41, D801–D807. [Google Scholar] [CrossRef] [PubMed]
- Lewis, I.A.; Karsten, R.H.; Norton, M.E.; Tonelli, M.; Westler, W.M.; Markley, J.L. NMR Method for Measuring Carbon-13 Isotopic Enrichment of Metabolites in Complex Solutions. Anal. Chem. 2010, 82, 4558–4563. [Google Scholar] [CrossRef] [PubMed]


© 2016 by the authors; licensee MDPI, Basel, Switzerland. This article is an open access article distributed under the terms and conditions of the Creative Commons Attribution (CC-BY) license (http://creativecommons.org/licenses/by/4.0/).
Share and Cite
Belkaid, A.; Čuperlović-Culf, M.; Touaibia, M.; Ouellette, R.J.; Surette, M.E. Metabolic Effect of Estrogen Receptor Agonists on Breast Cancer Cells in the Presence or Absence of Carbonic Anhydrase Inhibitors. Metabolites 2016, 6, 16. https://doi.org/10.3390/metabo6020016
Belkaid A, Čuperlović-Culf M, Touaibia M, Ouellette RJ, Surette ME. Metabolic Effect of Estrogen Receptor Agonists on Breast Cancer Cells in the Presence or Absence of Carbonic Anhydrase Inhibitors. Metabolites. 2016; 6(2):16. https://doi.org/10.3390/metabo6020016
Chicago/Turabian StyleBelkaid, Anissa, Miroslava Čuperlović-Culf, Mohamed Touaibia, Rodney J. Ouellette, and Marc E. Surette. 2016. "Metabolic Effect of Estrogen Receptor Agonists on Breast Cancer Cells in the Presence or Absence of Carbonic Anhydrase Inhibitors" Metabolites 6, no. 2: 16. https://doi.org/10.3390/metabo6020016
APA StyleBelkaid, A., Čuperlović-Culf, M., Touaibia, M., Ouellette, R. J., & Surette, M. E. (2016). Metabolic Effect of Estrogen Receptor Agonists on Breast Cancer Cells in the Presence or Absence of Carbonic Anhydrase Inhibitors. Metabolites, 6(2), 16. https://doi.org/10.3390/metabo6020016


