
Thermogenic Activation of Adipose Tissue by Caffeine During Strenuous Exercising and Recovery: A Double-Blind Crossover Study
 ,
,  , ,
, ,
Abstract
1. Introduction
2. Materials and Methods
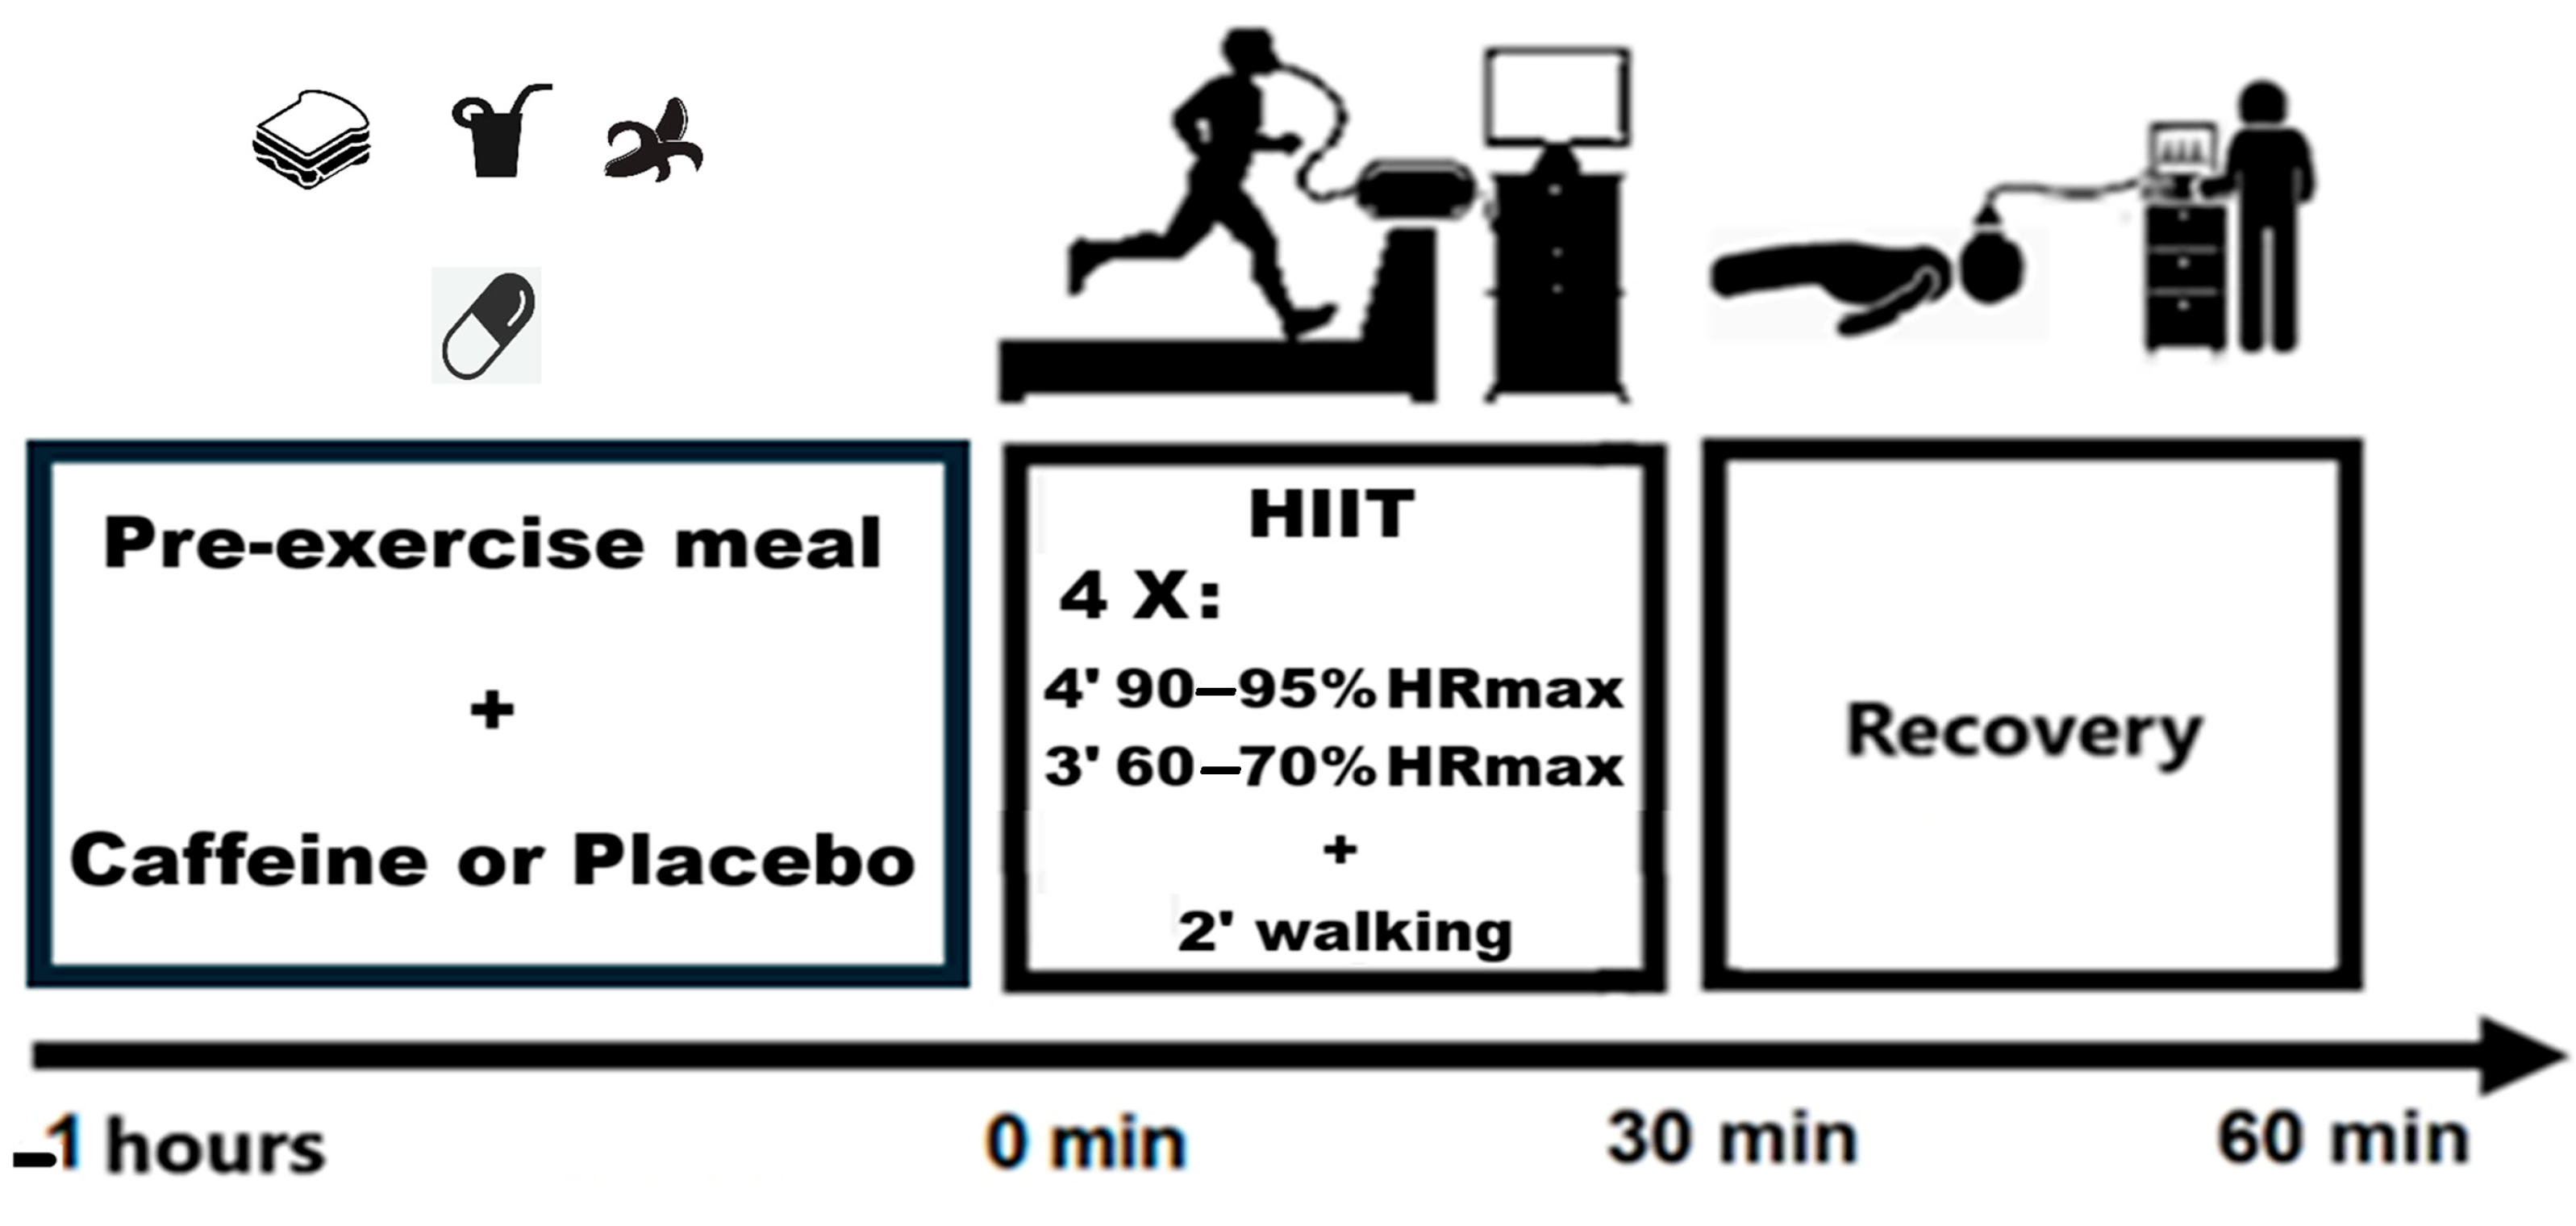
2.1. Experimental Approach
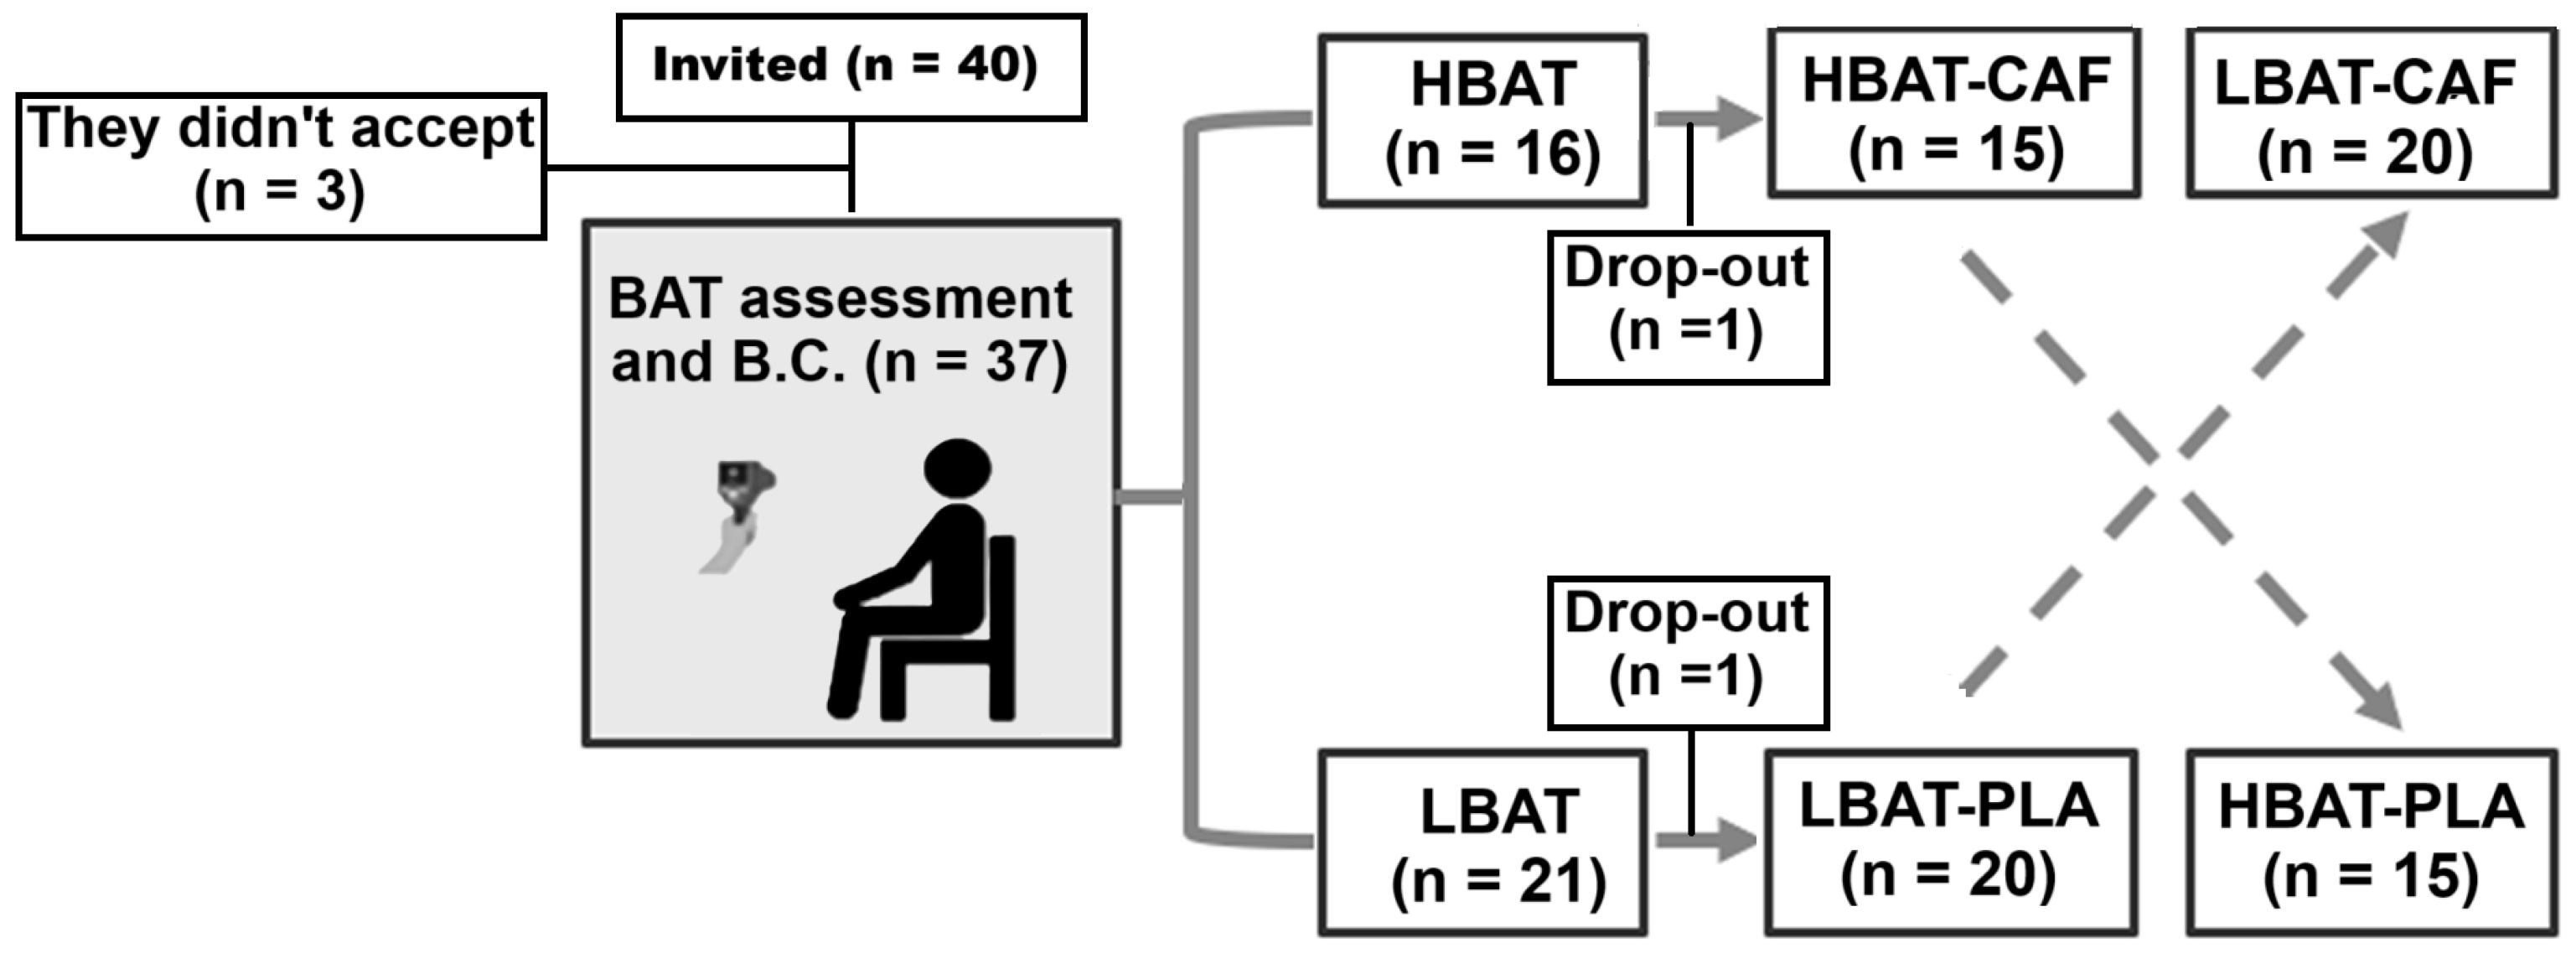
2.2. Participants
2.3. BAT Protocol and Classification
2.4. Pre-Exercise Breakfast and Supplement
2.5. High-Intensity Interval Exercise, Recovery Protocol, and Ergospirometric Measurements
2.6. Data Analysis
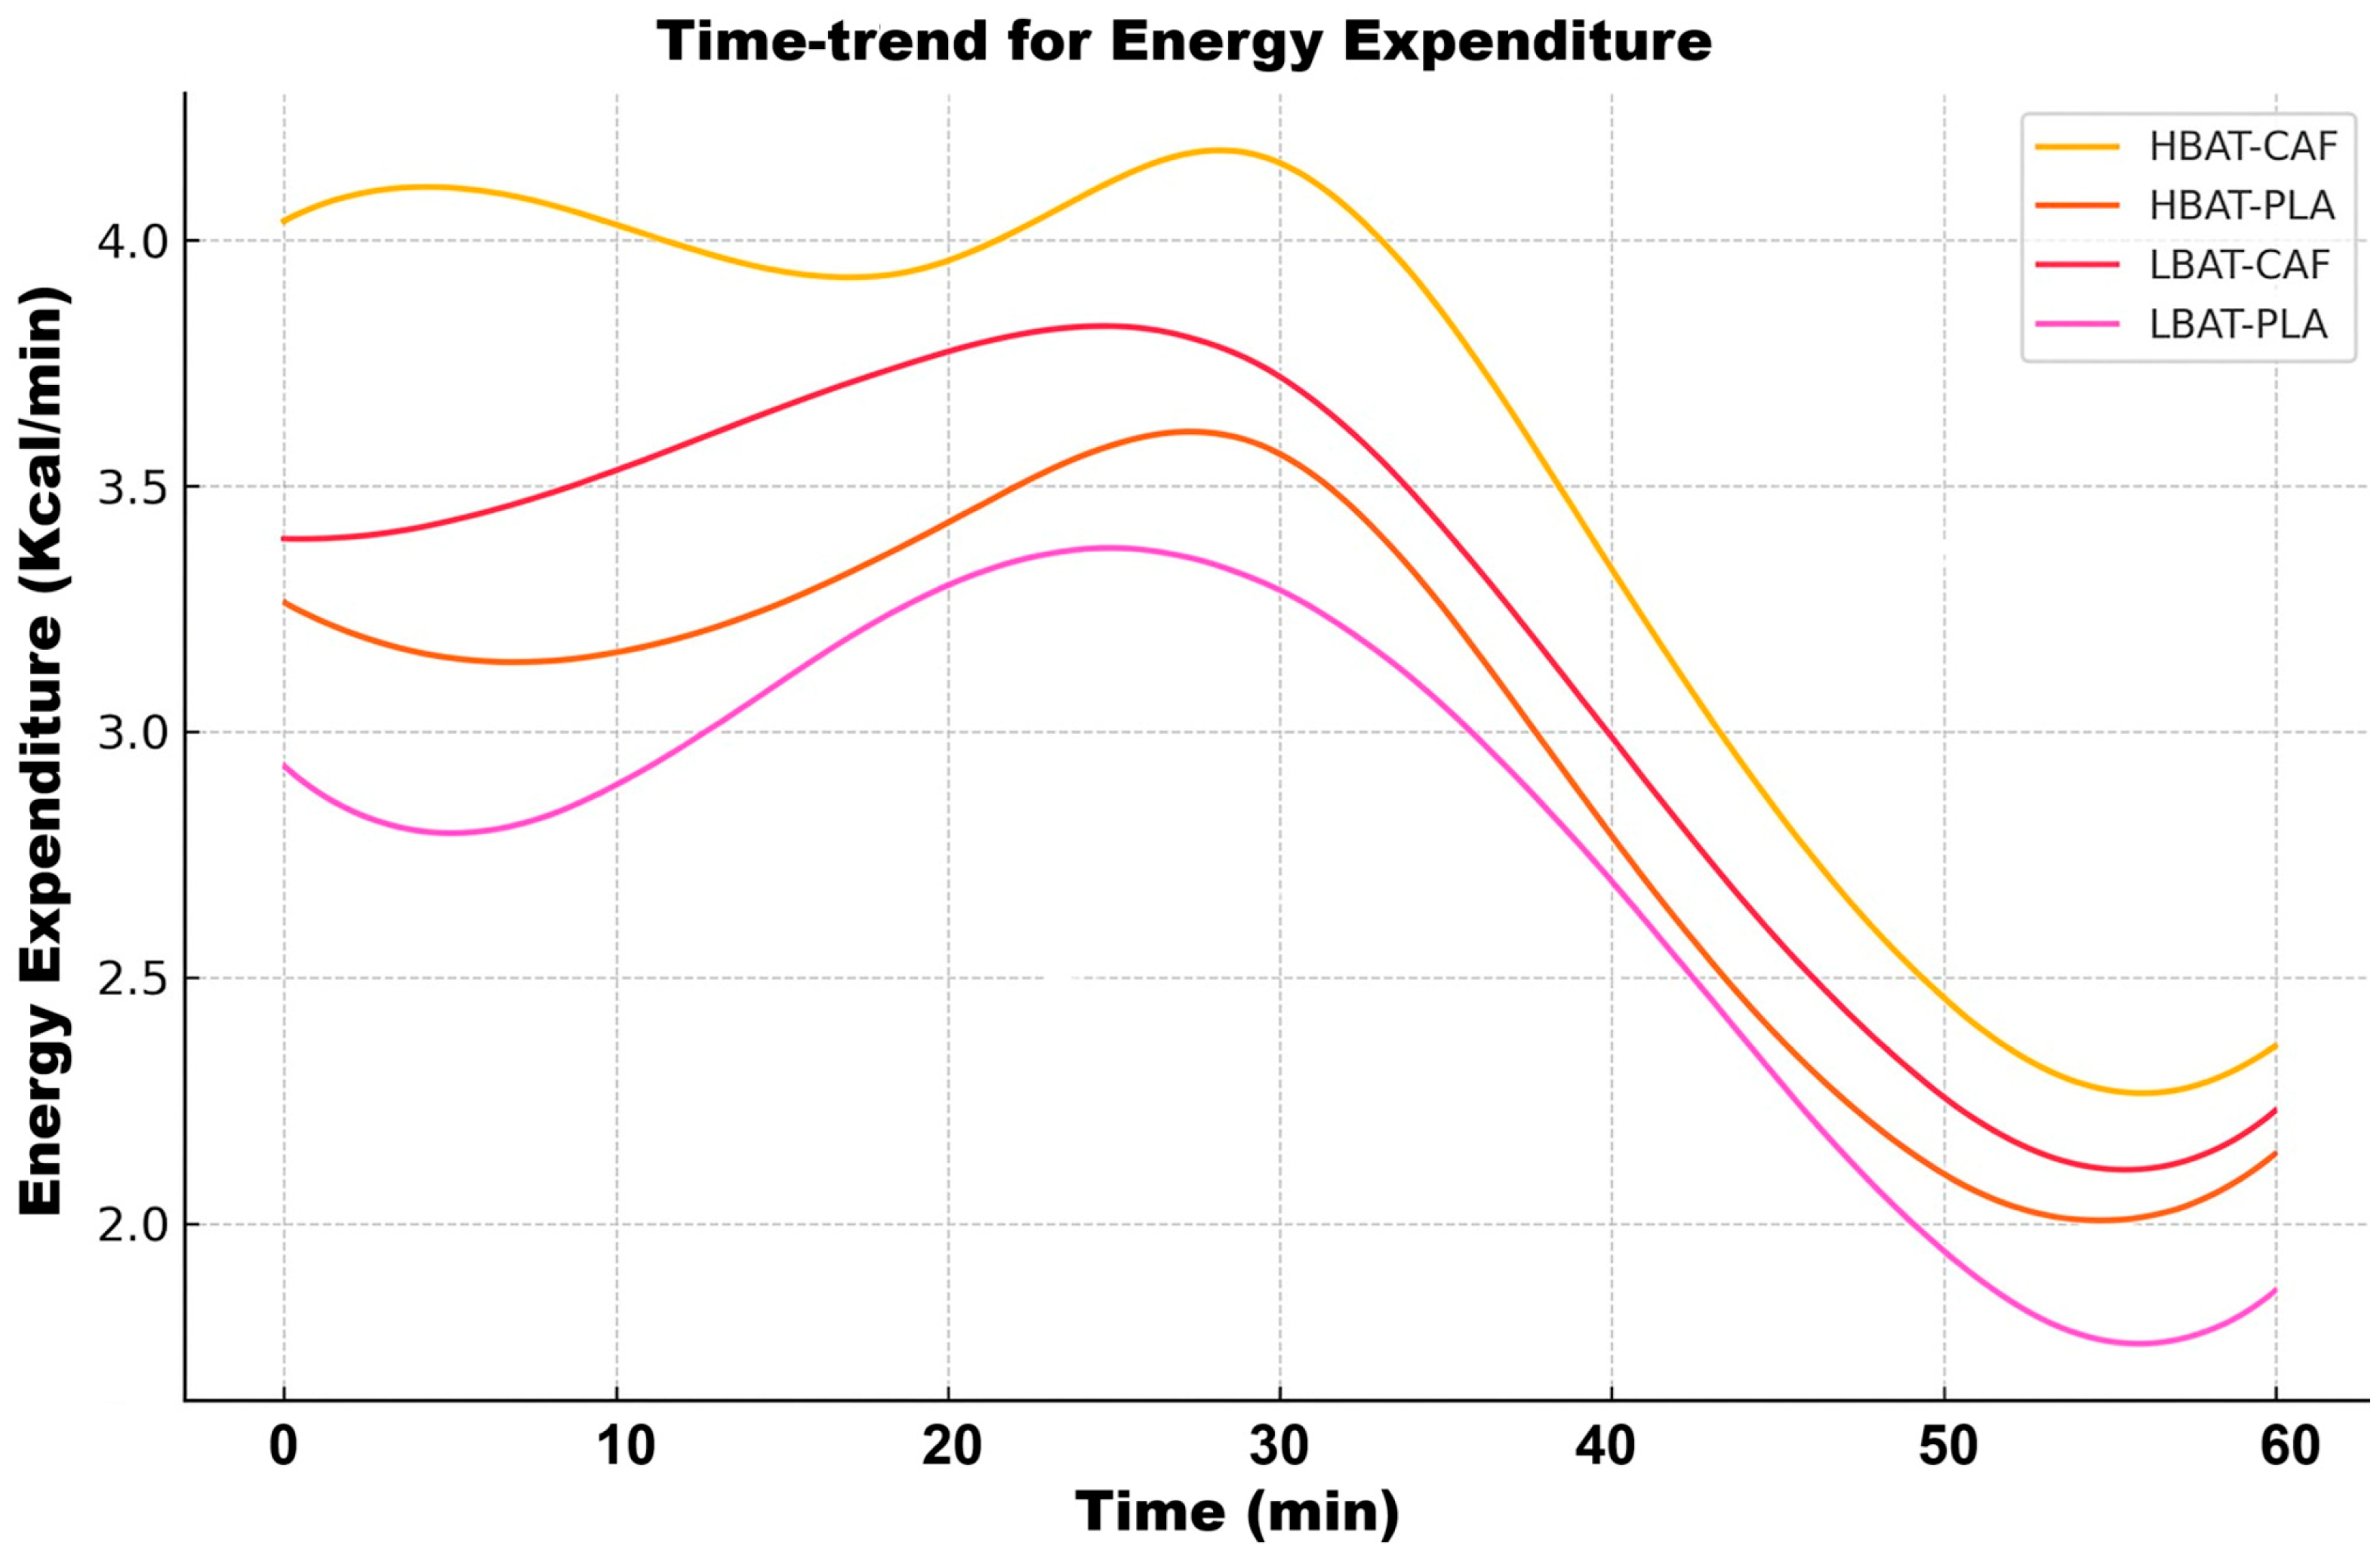
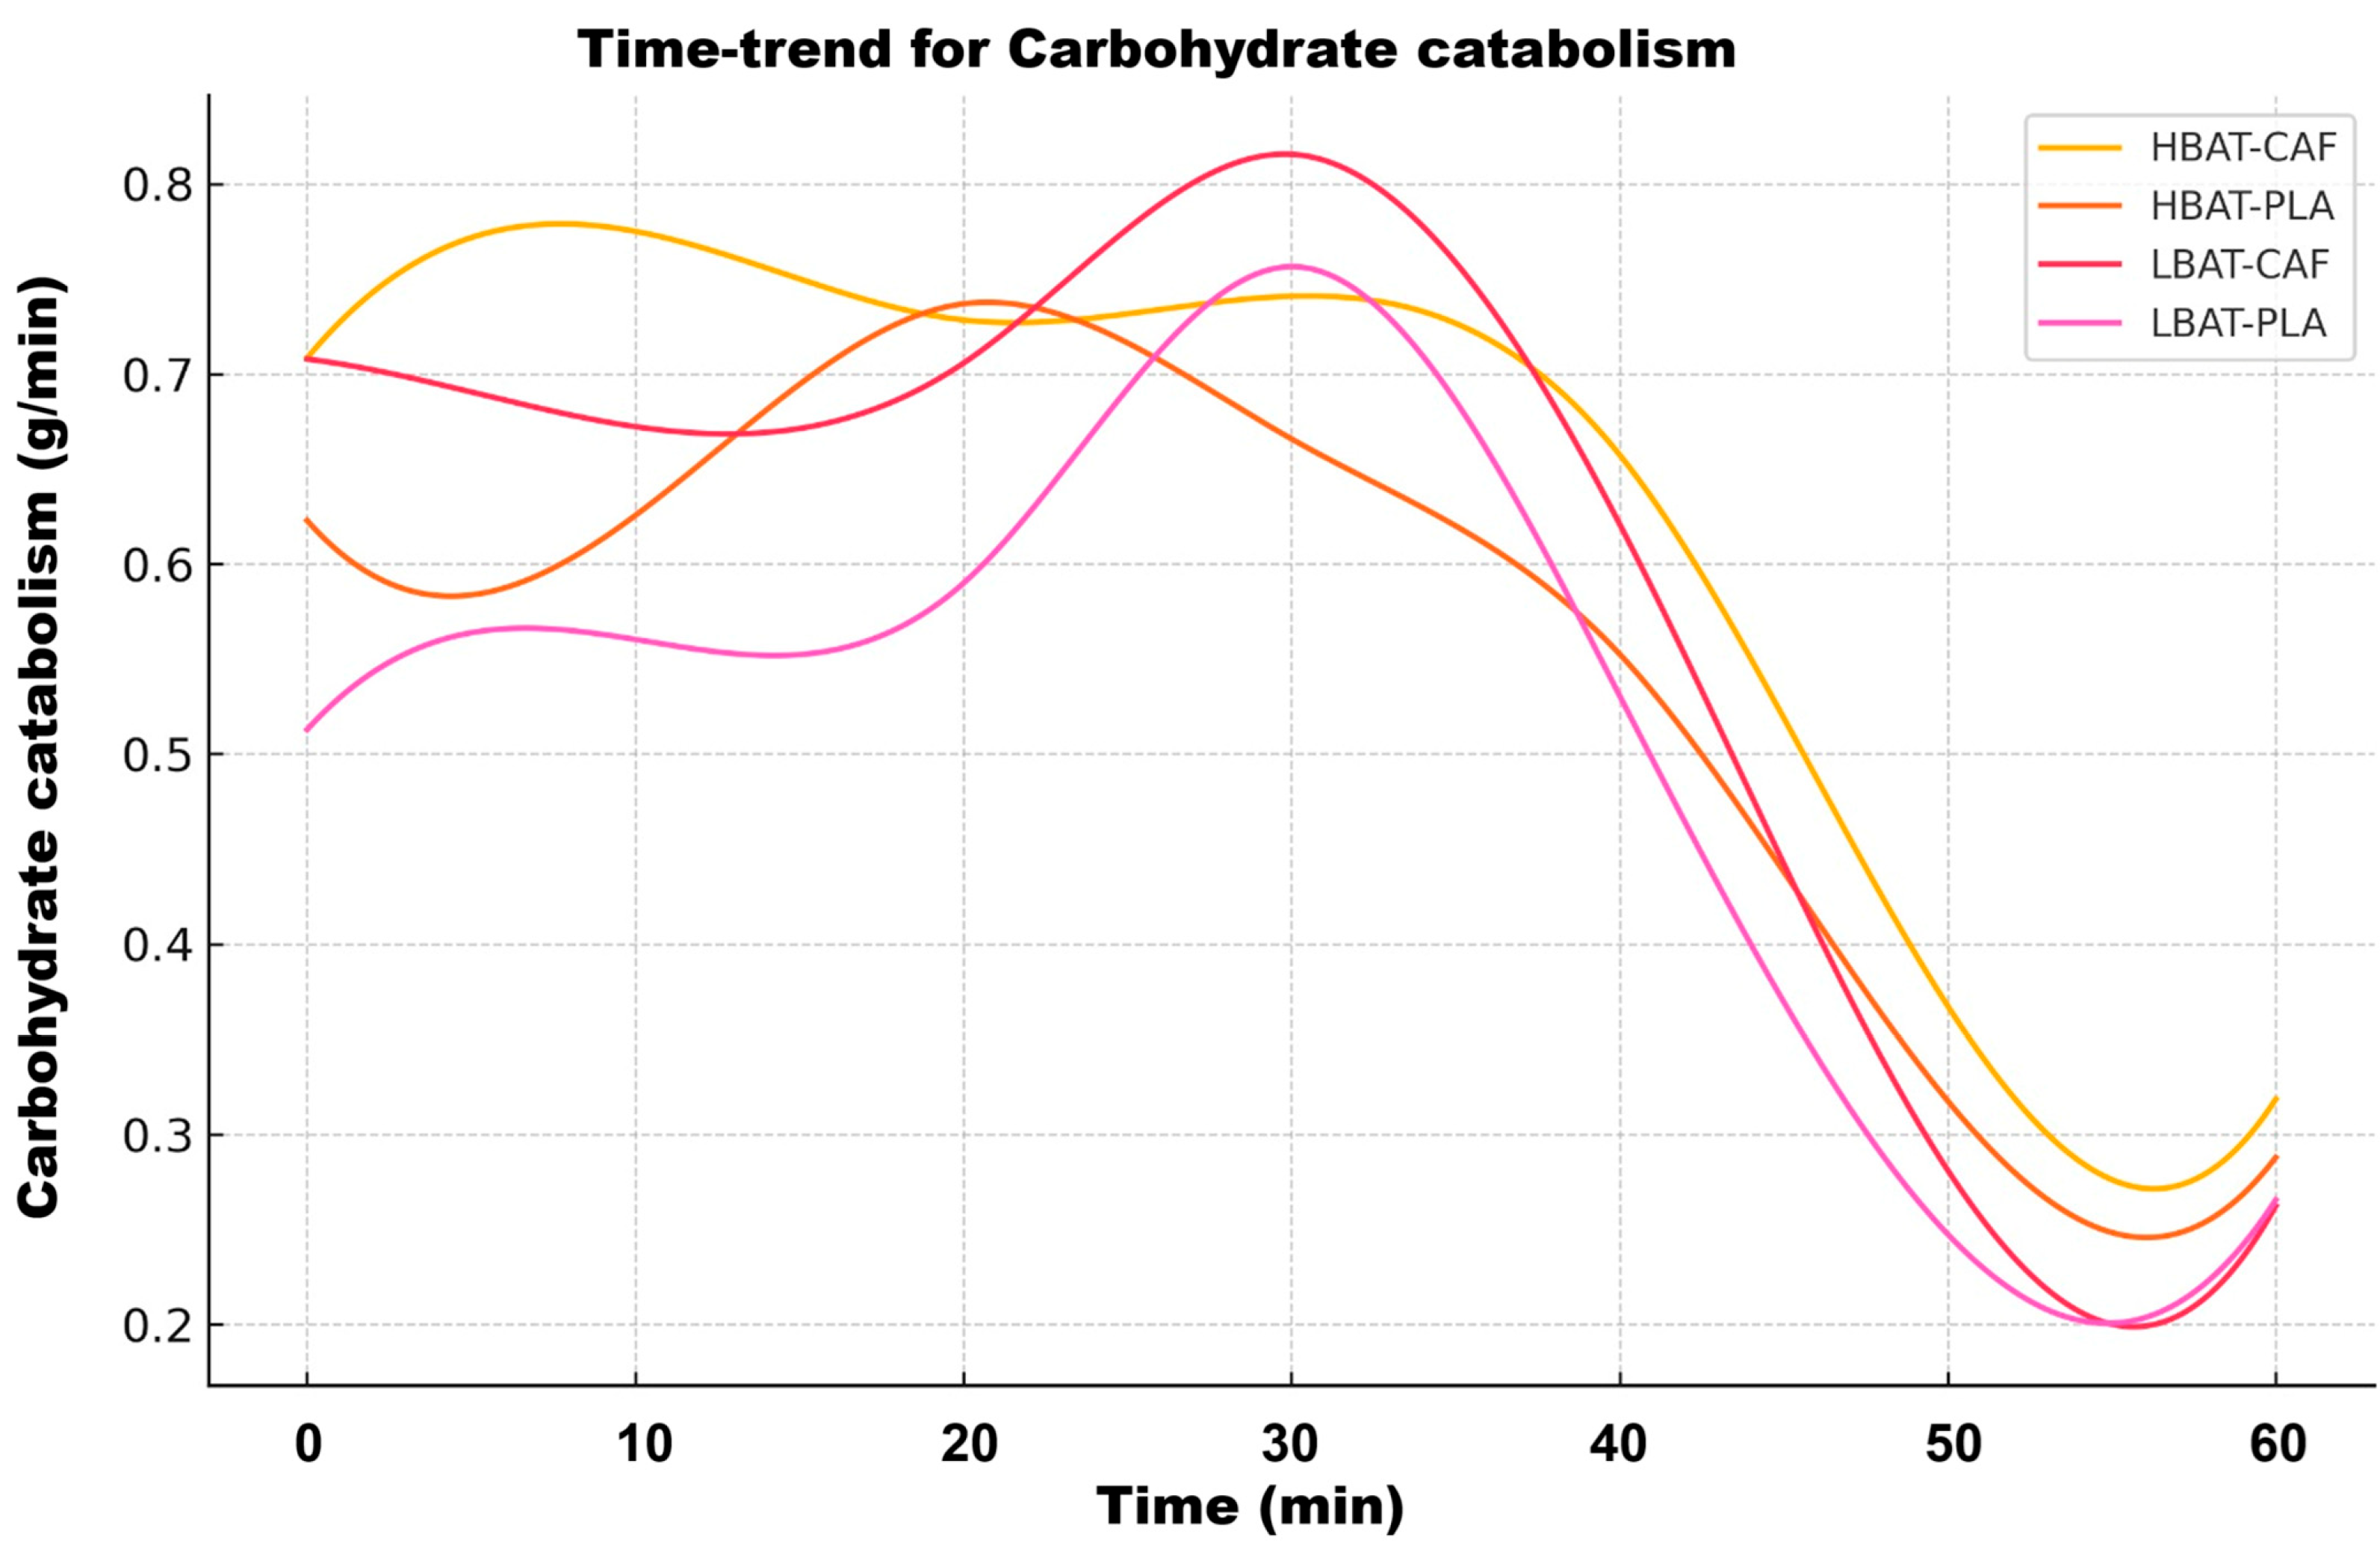
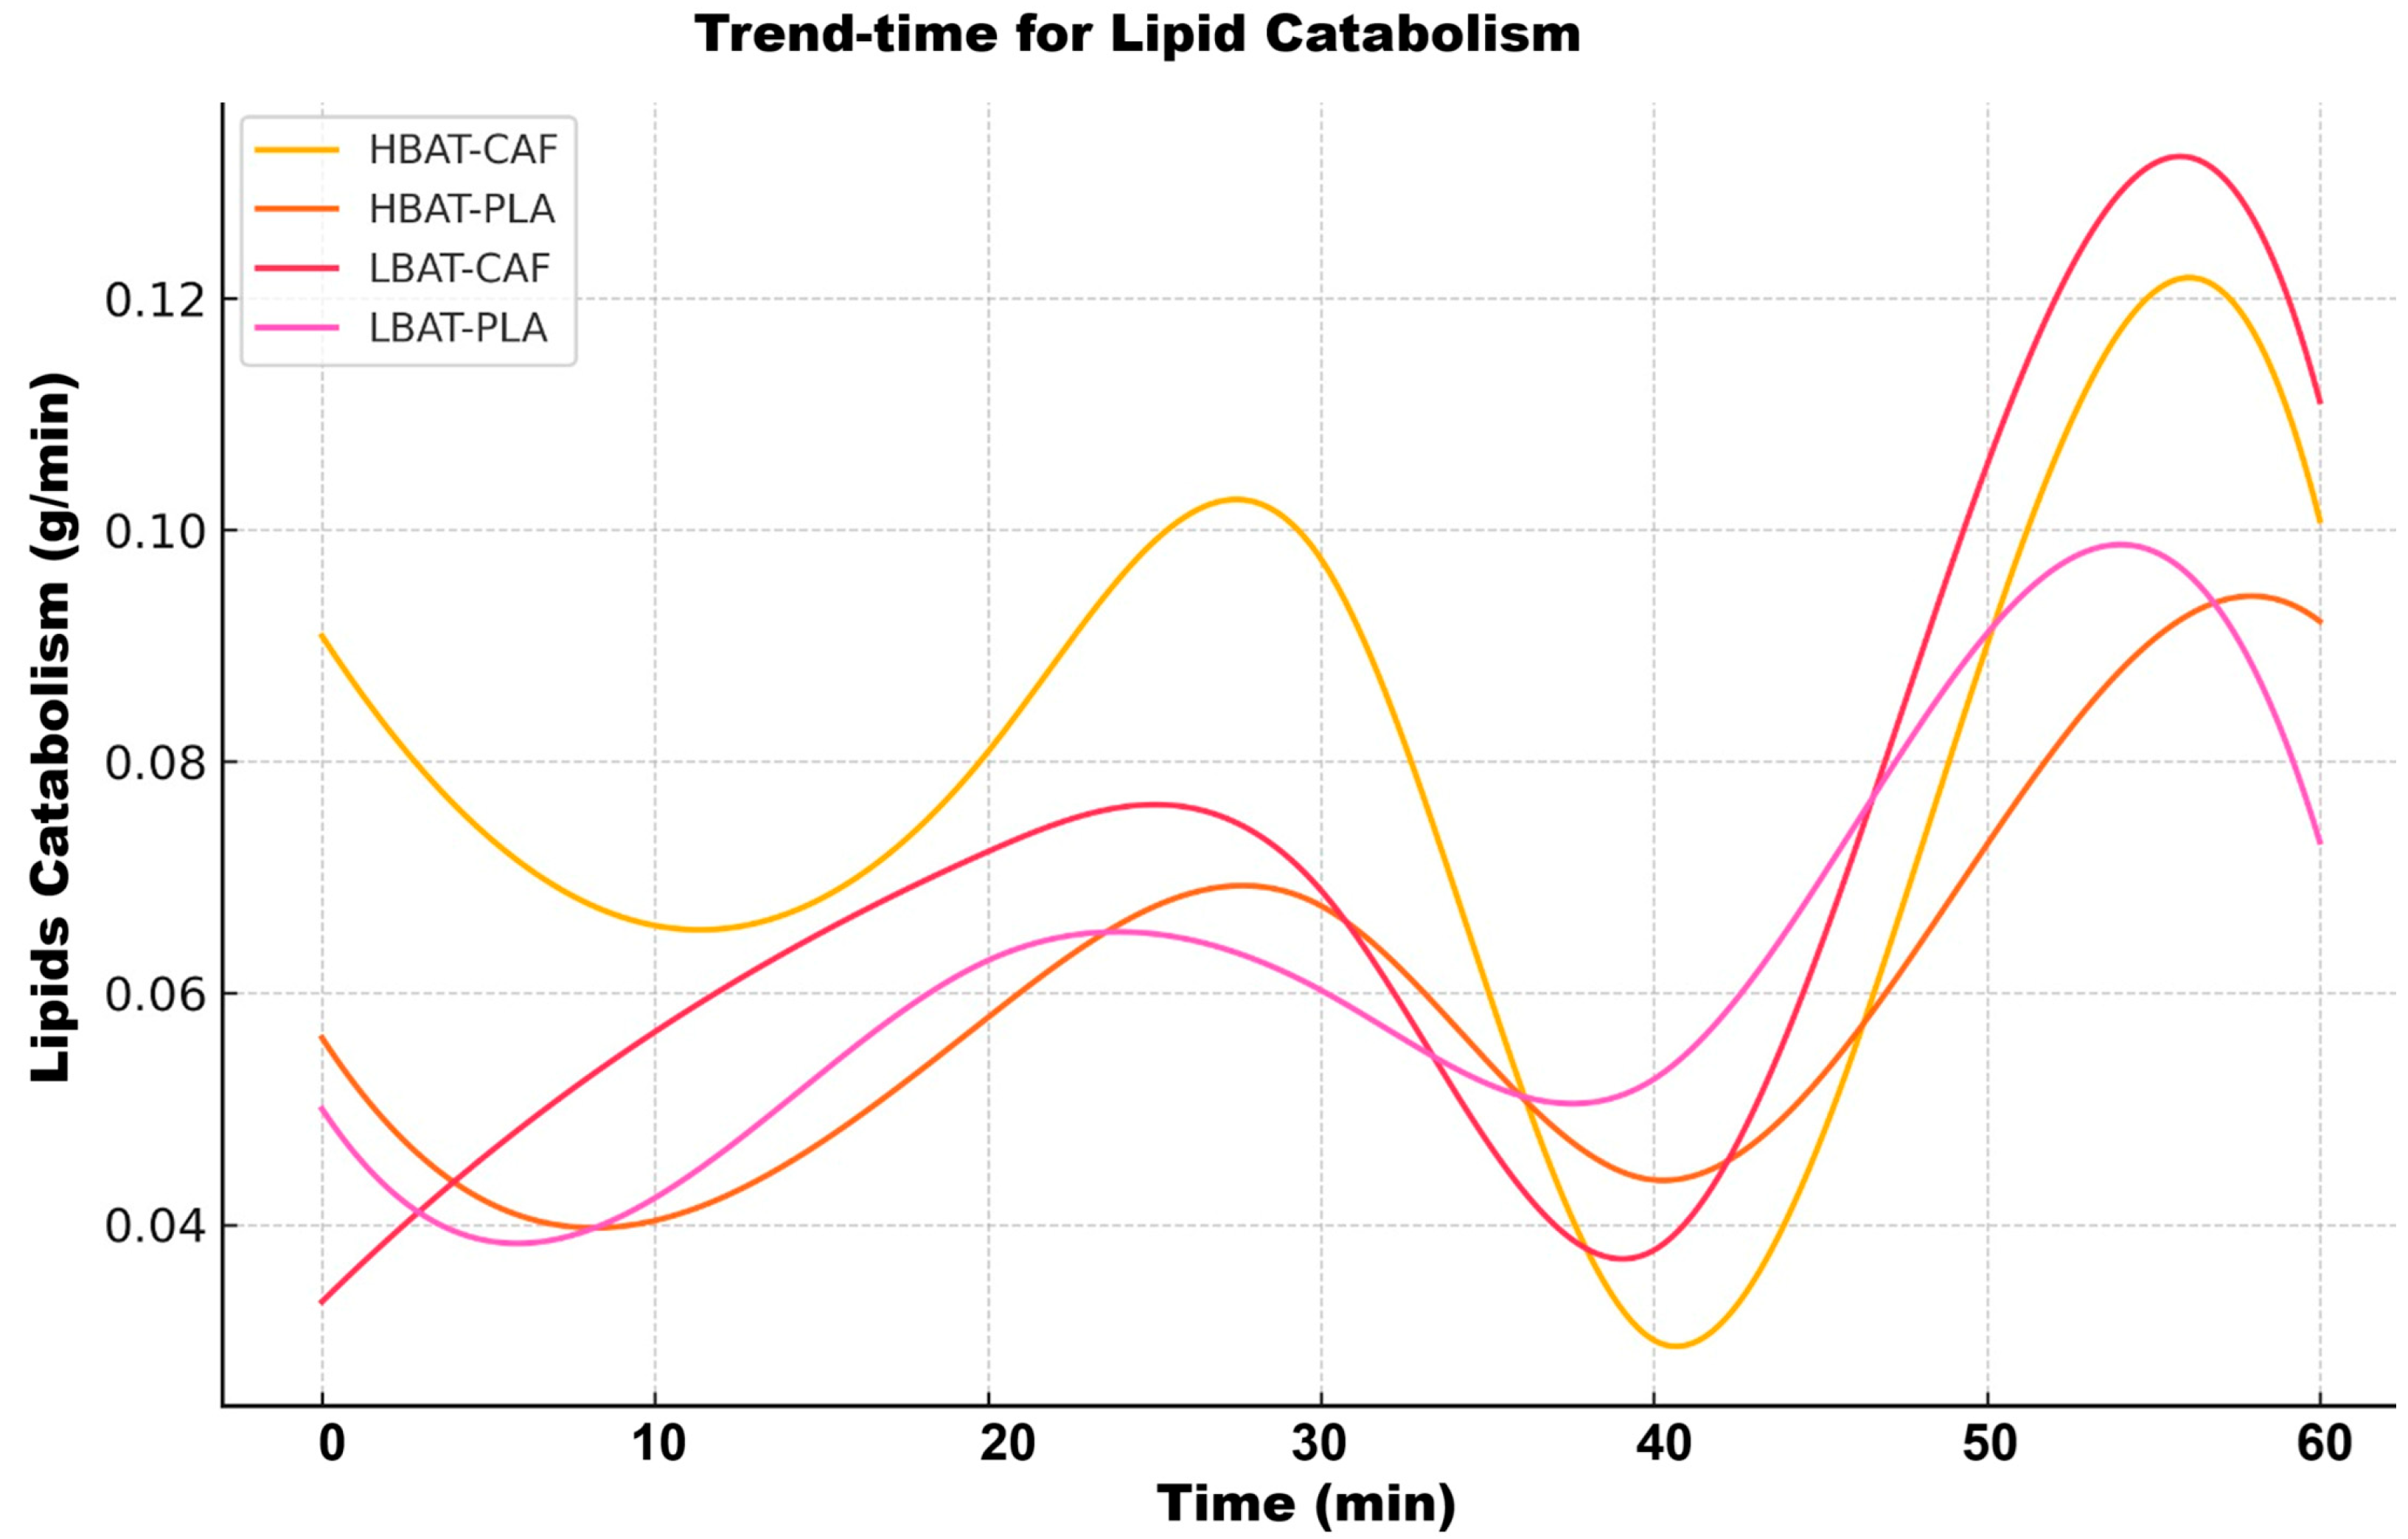
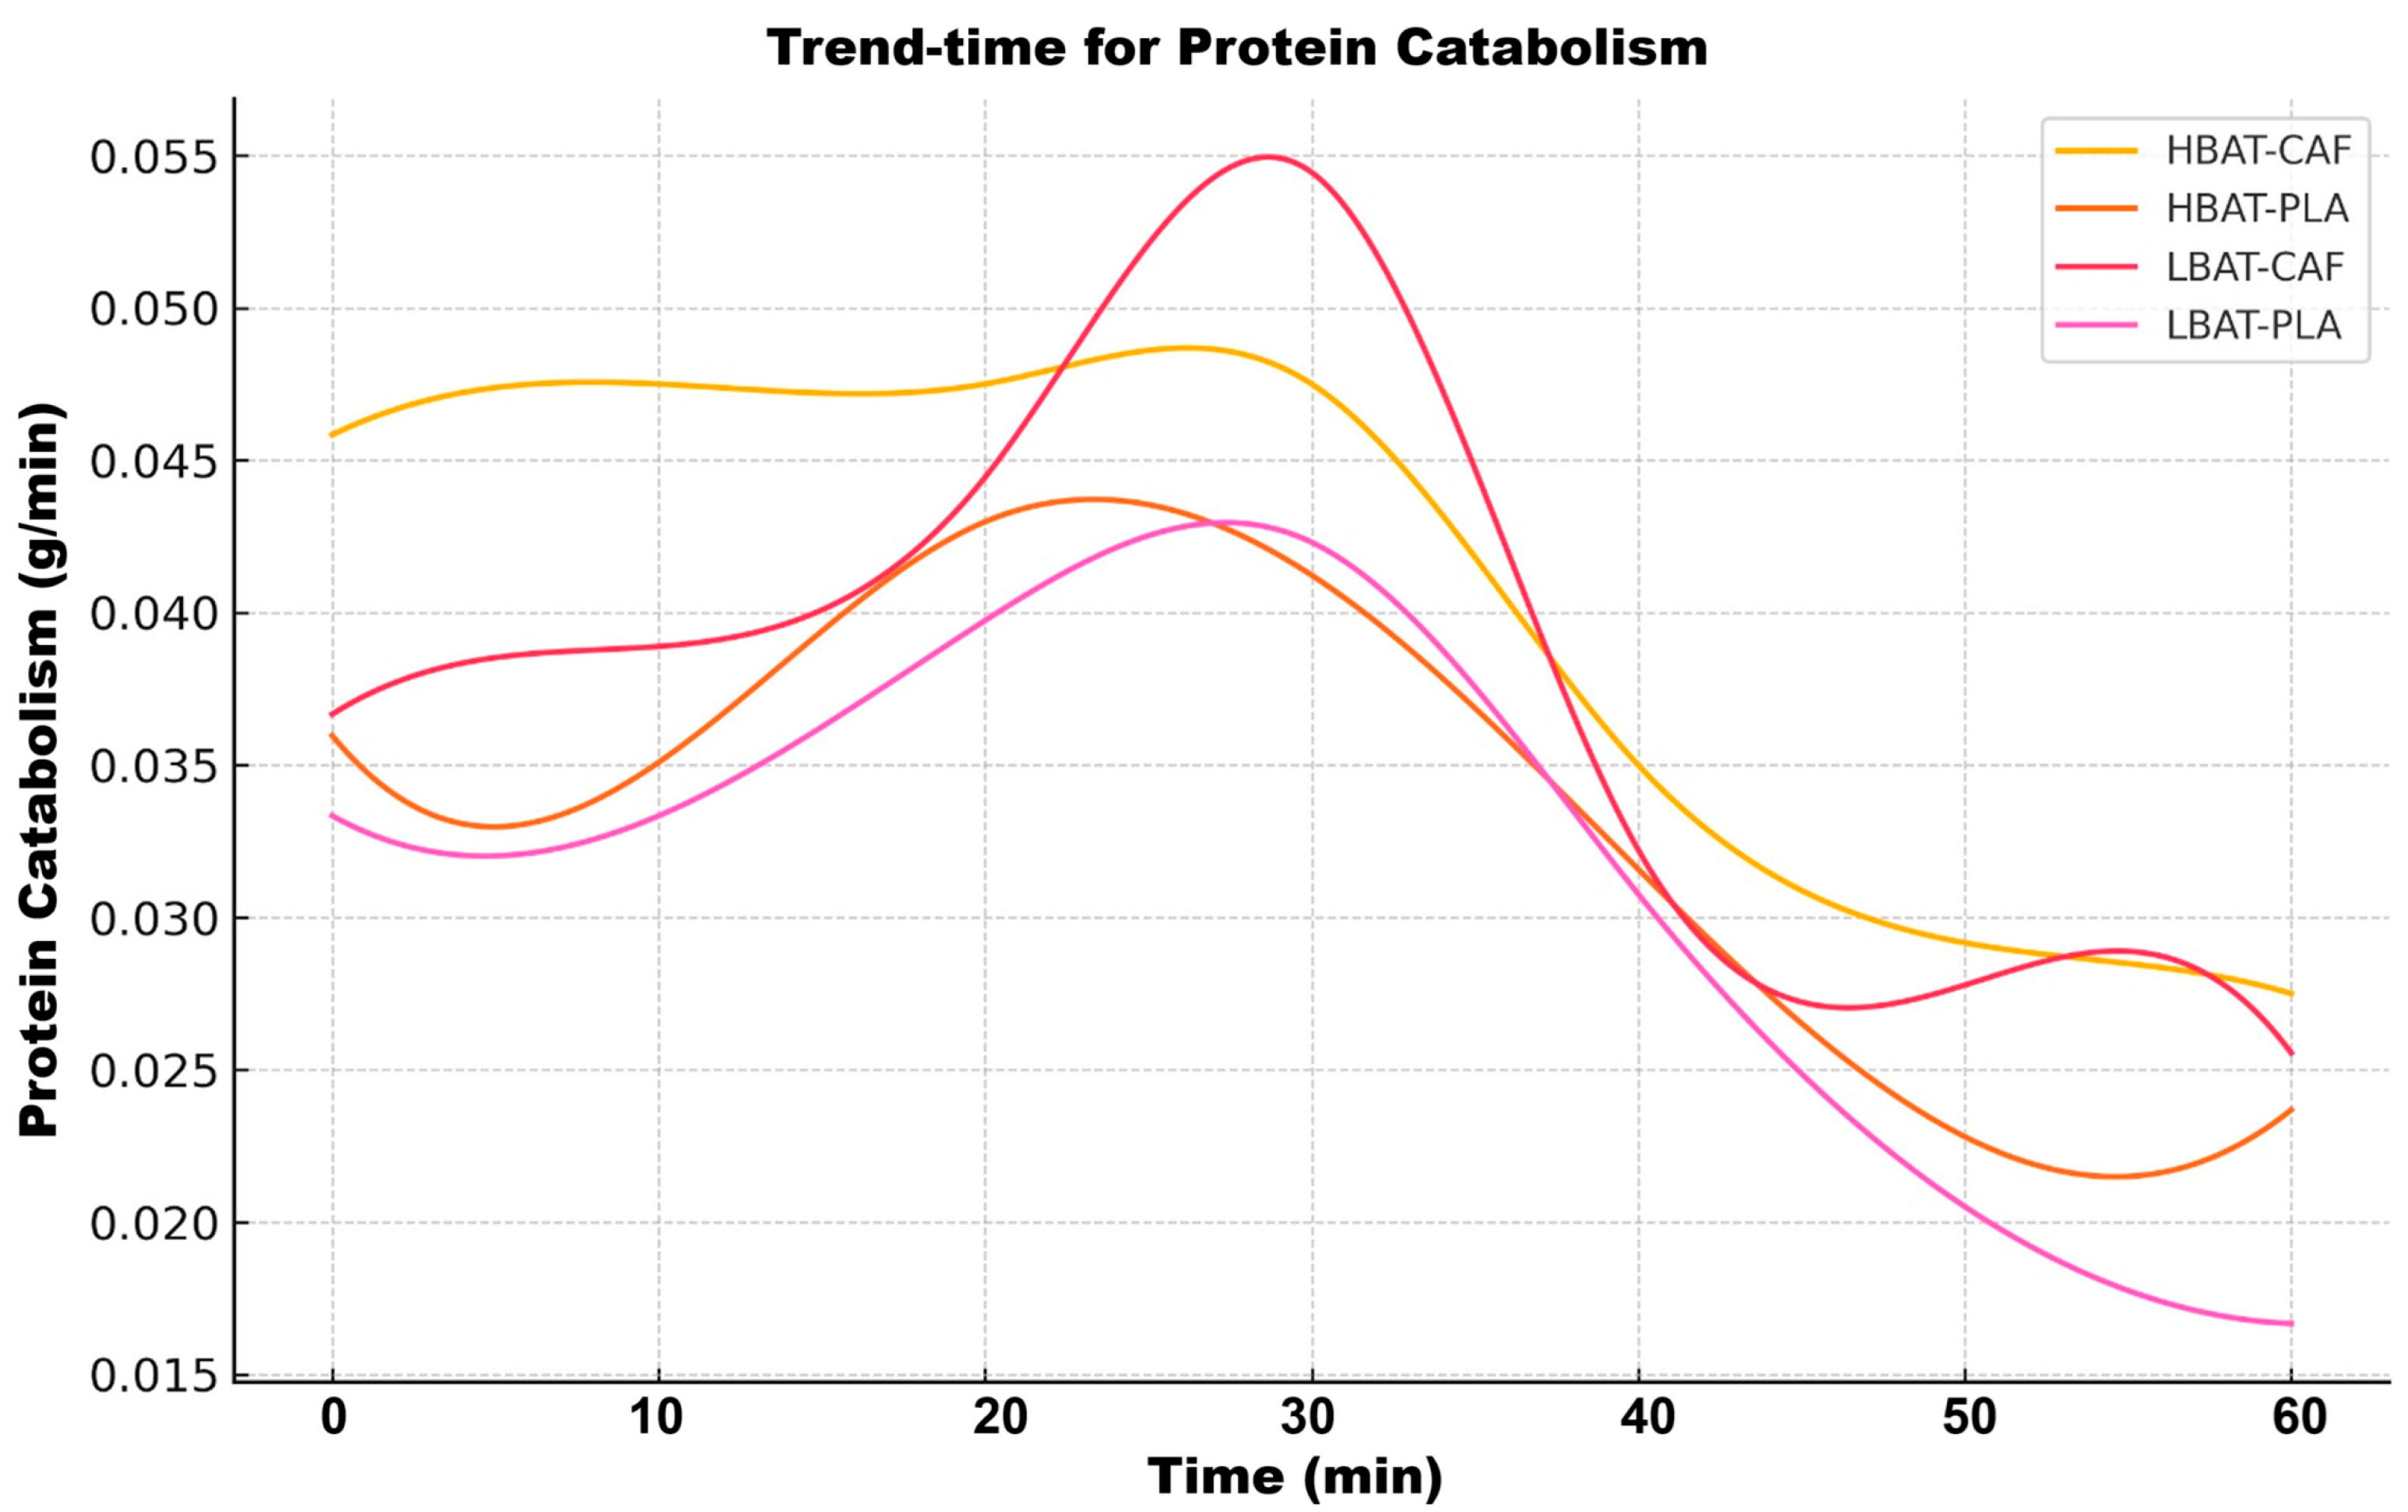
3. Results
4. Discussion
5. Conclusions
Author Contributions
Funding
Institutional Review Board Statement
Informed Consent Statement
Data Availability Statement
Acknowledgments
Conflicts of Interest
Abbreviations
| BAT | Brown adipose tissue |
| HBAT | High brown adipose tissue |
| LBAT | Low brown adipose tissue |
| CAF | Caffeine |
| PLA | Placebo |
| EE | Energy expenditure |
| CHO | Carbohydrate |
| LIP | Lipid |
| PTN | Protein |
| HIIE | High-intensity interval exercise |
| HRmax | Maximum heartrate |
| 18F-FDG PET/CT | 18F-fludeoxyglucose positron emission tomography |
| IRT | Infrared thermography |
| UCP-1 | Uncoupling protein 1 |
| PGC-1α | Peroxisome proliferator-activated receptor-gamma coactivator |
| SNS | Sympathetic nervous system |
References
- Scheele, C.; Wolfrum, C. Brown adipose crosstalk in tissue plasticity and human metabolism. Endocr. Rev. 2020, 41, 53–65. [Google Scholar] [CrossRef]
- Yang, F.T.; Stanford, K.I. Batokines: Mediators of inter-tissue communication (a mini-review). Curr. Obes. Rep. 2022, 11, 1–9. [Google Scholar] [CrossRef]
- Raiko, J.; Orava, J.; Savisto, N.; Virtanen, K.A. High brown fat activity correlates with cardiovascular risk factor levels cross-sectionally and subclinical atherosclerosis at 5-year follow-up. Arterioscler. Thromb. Vasc. Biol. 2020, 40, 1289–1295. [Google Scholar] [CrossRef] [PubMed]
- Singh, R.; Barrios, A.; Dirakvand, G.; Pervin, S. Human brown adipose tissue and metabolic health: Potential for therapeutic avenues. Cells 2021, 10, 3030. [Google Scholar] [CrossRef]
- Van Schaik, L.; Kettle, C.; Green, R.; Irving, H.R.; Rathner, J.A. Effects of caffeine on brown adipose tissue thermogenesis and metabolic homeostasis: A review. Front. Neurosci. 2021, 15, 621356. [Google Scholar] [CrossRef] [PubMed]
- Gatidis, S.; Schmidt, H.; Pfannenberg, C.A.; Nikolaou, K.; Schick, F.; Schwenzer, N.F. Is it possible to detect activated brown adipose tissue in humans using single-time-point infrared thermography under thermoneutral conditions? Impact of BMI and subcutaneous adipose tissue thickness. PLoS ONE 2016, 11, e0151152. [Google Scholar] [CrossRef] [PubMed]
- Mostafa, N.M.; Mohamadien, N.R.; Sayed, M.H. Brown adipose tissue (BAT) activation at 18 F-FDG PET/CT: Correlation with clinicopathological characteristics in breast cancer. Egypt. J. Radiol. Nucl. Med. 2021, 52, 62. [Google Scholar] [CrossRef]
- Law, J.M.; Morris, D.E.; Robinson, L.J.; Symonds, M.E.; Budge, H. Semi-automated analysis of supraclavicular thermal images increases speed of brown adipose tissue analysis without increasing variation in results. Curr. Res. Physiol. 2021, 4, 177–182. [Google Scholar] [CrossRef]
- Leitner, B.P.; Huang, S.; Brychta, R.J.; Duckworth, C.J.; Baskin, A.S.; McGehee, S.; Tal, I.; Dieckmann, W.; Gupta, G.; Kolodny, G.M. Mapping of human brown adipose tissue in lean and obese young men. Proc. Natl. Acad. Sci. USA 2017, 114, 8649–8654. [Google Scholar] [CrossRef]
- Jang, C.; Jalapu, S.; Thuzar, M.; Law, P.W.; Jeavons, S.; Barclay, J.L.; Ho, K.K. Infrared thermography in the detection of brown adipose tissue in humans. Physiol. Rep. 2014, 2, e12167. [Google Scholar] [CrossRef]
- Pérez, D.I.V.; Soto, D.A.S.; Barroso, J.M.; Dos Santos, D.A.; Queiroz, A.C.C.; Miarka, B.; Brito, C.J.; Quintana, M.S. Physically active men with high brown adipose tissue activity showed increased energy expenditure after caffeine supplementation. J. Therm. Biol. 2021, 99, 103000. [Google Scholar] [CrossRef]
- Jimenez-Pavon, D.; Corral-Perez, J.; Sánchez-Infantes, D.; Villarroya, F.; Ruiz, J.R.; Martinez-Tellez, B. Infrared thermography for estimating supraclavicular skin temperature and BAT activity in humans: A systematic review. Obesity 2019, 27, 1932–1949. [Google Scholar] [CrossRef] [PubMed]
- El Hadi, H.; Frascati, A.; Granzotto, M.; Silvestrin, V.; Ferlini, E.; Vettor, R.; Rossato, M. Infrared thermography for indirect assessment of activation of brown adipose tissue in lean and obese male subjects. Physiol. Meas. 2016, 37, N118. [Google Scholar] [CrossRef]
- Nirengi, S.; Wakabayashi, H.; Matsushita, M.; Domichi, M.; Suzuki, S.; Sukino, S.; Suganuma, A.; Kawaguchi, Y.; Hashimoto, T.; Saito, M. An optimal condition for the evaluation of human brown adipose tissue by infrared thermography. PLoS ONE 2019, 14, e0220574. [Google Scholar] [CrossRef] [PubMed]
- van der Lans, A.A.J.J.; Vosselman, M.J.; Hanssen, M.J.W.; Brans, B.; van Marken Lichtenbelt, W.D. Supraclavicular Skin Temperature and BAT Activity in Lean Healthy Adults. J. Physiol. Sci. 2016, 66, 77–83. [Google Scholar] [CrossRef]
- Velickovic, K.; Wayne, D.; Leija, H.A.L.; Bloor, I.; Morris, D.E.; Law, J.; Budge, H.; Sacks, H.; Symonds, M.E.; Sottile, V. Caffeine exposure induces browning features in adipose tissue in vitro and in vivo. Sci. Rep. 2019, 9, 9104. [Google Scholar] [CrossRef]
- Sun, L.; Camps, S.G.; Goh, H.J.; Govindharajulu, P.; Schaefferkoetter, J.D.; Townsend, D.W.; Verma, S.K.; Velan, S.S.; Sun, L.; Sze, S.K. Capsinoids activate brown adipose tissue (BAT) with increased energy expenditure associated with subthreshold 18-fluorine fluorodeoxyglucose uptake in BAT-positive humans confirmed by positron emission tomography scan. Am. J. Clin. Nutr. 2018, 107, 62–70. [Google Scholar] [CrossRef]
- Symonds, M.E.; Aldiss, P.; Pope, M.; Budge, H. Recent advances in our understanding of brown and beige adipose tissue: The good fat that keeps you healthy. F1000Research 2018, 7, 1129. [Google Scholar] [CrossRef] [PubMed]
- Yamada, A.K.; Pimentel, G.D.; Pickering, C.; Cordeiro, A.V.; Silva, V.R. Effect of caffeine on mitochondrial biogenesis in the skeletal muscle–A narrative review. Clin. Nutr. ESPEN 2022, 51, 1–6. [Google Scholar] [CrossRef]
- Zhu, Y.; Qi, Z.; Ding, S. Exercise-Induced adipose tissue thermogenesis and Browning: How to explain the conflicting findings? Int. J. Mol. Sci. 2022, 23, 13142. [Google Scholar] [CrossRef]
- Bartness, T.J.; Liu, Y.; Shrestha, Y.B.; Ryu, V. Neural innervation of white adipose tissue and the control of lipolysis. Front. Neuroendocrinol. 2014, 35, 473–493. [Google Scholar] [CrossRef]
- Yoneshiro, T.; Matsushita, M.; Hibi, M.; Tone, H.; Takeshita, M.; Yasunaga, K.; Katsuragi, Y.; Kameya, T.; Sugie, H.; Saito, M. Tea catechin and caffeine activate brown adipose tissue and increase cold-induced thermogenic capacity in humans. Am. J. Clin. Nutr. 2017, 105, 873–881. [Google Scholar] [CrossRef] [PubMed]
- Moreira, D.G.; Costello, J.T.; Brito, C.J.; Adamczyk, J.G.; Ammer, K.; Bach, A.J.; Costa, C.M.; Eglin, C.; Fernandes, A.A.; Fernández-Cuevas, I. Thermographic imaging in sports and exercise medicine: A Delphi study and consensus statement on the measurement of human skin temperature. J. Therm. Biol. 2017, 69, 155–162. [Google Scholar] [CrossRef]
- de Carvalho, R.; Sabbag, L.; Battistella, L. Ergospirometry. Cardiopulmonary exercise test, methodology and interpretation. Arq. Bras. Cardiol. 1998, 71, 719–724. [Google Scholar]
- Magkos, F.; Kavouras, S.A. Caffeine Use in Sports, Pharmacokinetics in Man, and Cellular Mechanisms of Action. Crit. Rev. Food Sci. Nutr. 2005, 45, 535–562. [Google Scholar] [CrossRef]
- Guest, N.S.; VanDusseldorp, T.A.; Nelson, M.T.; Grgic, J.; Schoenfeld, B.J.; Jenkins, N.D.M.; Arent, S.M.; Antonio, J.; Stout, J.R.; Trexler, E.T.; et al. International society of sports nutrition position stand: Caffeine and exercise performance. J. Int. Soc. Sports Nutr. 2021, 18, 1. [Google Scholar] [CrossRef] [PubMed]
- Jeukendrup, A.E.; Wallis, G.A. Measurement of Substrate Oxidation During Exercise by Means of Gas Exchange Measurements. Int. J. Sports Med. 2005, 26, S28–S37. [Google Scholar] [CrossRef]
- Gonzalez, J.T.; Veasey, R.C.; Rumbold, P.L.S.; Stevenson, E.J. Breakfast and exercise contingently affect postprandial metabolism and energy balance in physically active males. Br. J. Nutr. 2013, 110, 721–732. [Google Scholar] [CrossRef] [PubMed]
- Tjønna, A.E.; Lee, S.J.; Rognmo, Ø.; Stølen, T.O.; Bye, A.; Haram, P.M.; Loennechen, J.P.; Al-Share, Q.Y.; Skogvoll, E.; Slørdahl, S.A. Aerobic interval training versus continuous moderate exercise as a treatment for the metabolic syndrome: A pilot study. Circulation 2008, 118, 346–354. [Google Scholar] [CrossRef]
- Tanaka, H.; Monahan, K.D.; Seals, D.R. Age-predicted maximal heart rate revisited. J. Am. Coll. Cardiol. 2001, 37, 153–156. [Google Scholar] [CrossRef]
- Alcantara, J.M.; Sanchez-Delgado, G.; Amaro-Gahete, F.J.; Galgani, J.E.; Ruiz, J.R. Impact of the method used to select gas exchange data for estimating the resting metabolic rate, as supplied by breath-by-breath metabolic carts. Nutrients 2020, 12, 487. [Google Scholar] [CrossRef] [PubMed]
- De V Weir, J. New methods for calculating metabolic rate with special reference to protein metabolism. J. Physiol. 1949, 109, 1–9. [Google Scholar] [CrossRef] [PubMed]
- Frayn, K. Calculation of substrate oxidation rates in vivo from gaseous exchange. J. Appl. Physiol. 1983, 55, 628–634. [Google Scholar] [CrossRef]
- Cavanaugh, J.E.; Neath, A.A. The Akaike information criterion: Background, derivation, properties, application, interpretation, and refinements. Wiley Interdiscip. Rev. Comput. Stat. 2019, 11, e1460. [Google Scholar] [CrossRef]
- Chen, K.Y.; Brychta, R.J.; Sater, Z.A.; Cassimatis, T.M.; Cero, C.; Fletcher, L.A.; Israni, N.S.; Johnson, J.W.; Lea, H.J.; Linderman, J.D. Opportunities and challenges in the therapeutic activation of human energy expenditure and thermogenesis to manage obesity. J. Biol. Chem. 2020, 295, 1926–1942. [Google Scholar] [CrossRef] [PubMed]
- Zhao, Y.; Yang, L.; Huang, Z.; Lin, L.; Zheng, G. Synergistic effects of caffeine and catechins on lipid metabolism in chronically fed mice via the AMP-activated protein kinase signaling pathway. Eur. J. Nutr. 2017, 56, 2309–2318. [Google Scholar] [CrossRef]
- Zouhal, H.; Jacob, C.; Delamarche, P.; Gratas-Delamarche, A. Catecholamines and the effects of exercise, training and gender. Sports Med. 2008, 38, 401–423. [Google Scholar] [CrossRef]
- Athanasiou, N.; Bogdanis, G.C.; Mastorakos, G. Endocrine responses of the stress system to different types of exercise. Rev. Endocr. Metab. Disord. 2023, 24, 251–266. [Google Scholar] [CrossRef]
- Flouris, A.D.; Dinas, P.C.; Valente, A.; Andrade, C.M.B.; Kawashita, N.H.; Sakellariou, P. Exercise-induced effects on UCP1 expression in classical brown adipose tissue: A systematic review. Horm. Mol. Biol. Clin. Investig. 2017, 31, 20160048. [Google Scholar] [CrossRef]
- D’Amuri, A.; Sanz, J.M.; Capatti, E.; Di Vece, F.; Vaccari, F.; Lazzer, S.; Zuliani, G.; Dalla Nora, E.; Passaro, A. Effectiveness of high-intensity interval training for weight loss in adults with obesity: A randomised controlled non-inferiority trial. BMJ Open Sport Exerc. Med. 2021, 7, e001021. [Google Scholar] [CrossRef] [PubMed]
- Paoli, A.; Moro, T.; Marcolin, G.; Neri, M.; Bianco, A.; Palma, A.; Grimaldi, K. High-Intensity Interval Resistance Training (HIRT) influences resting energy expenditure and respiratory ratio in non-dieting individuals. J. Transl. Med. 2012, 10, 237. [Google Scholar] [CrossRef]
- Zhu, X.; Jiao, J.; Liu, Y.; Li, H.; Zhang, H. The Release of Lipolytic Hormones during Various High-Intensity Interval and Moderate-Intensity Continuous Training Regimens and Their Effects on Fat Loss. J. Sports Sci. Med. 2024, 23, 559–570. [Google Scholar] [CrossRef]
- Mekonen, W.; Schwaberger, G.; Lamprecht, M.; Hofmann, P. Whole Body Substrate Metabolism during Different Exercise Intensities with Special Emphasis on Blood Protein Changes in Trained Subjects—A Pilot Study. J. Funct. Morphol. Kinesiol. 2023, 8, 102. [Google Scholar] [CrossRef]
- Scheel, A.K.; Espelage, L.; Chadt, A. Many Ways to Rome: Exercise, Cold Exposure and Diet—Do They All Affect BAT Activation and WAT Browning in the Same Manner? Int. J. Mol. Sci. 2022, 23, 4759. [Google Scholar] [CrossRef]
- Li, L.; Zhou, Z.; Fang, J.; Liu, D.; Deng, C.; Chen, Y.; Ahasan, Z.; Zhu, W.; Cai, K. The characterization of metabolic changes in adipose tissues and muscles due to different exercise intensities by Dixon in healthy young men. Eur. J. Radiol. 2024, 177, 111559. [Google Scholar] [CrossRef] [PubMed]
- Zeng, Y.; Gao, L.; Shao, S.; Chen, X.; Zhang, P.; Zhang, R.; Zhou, X.; Zhao, J. Exploring the Effects of Exercise on Brown Adipose Tissue Volumes and T2 Values Using Magnetic Resonance Imaging at 7 Tesla. Res. Square. 2021. [Google Scholar] [CrossRef]
- Motiani, P.; Virtanen, K.A.; Motiani, K.K.; Eskelinen, J.J.; Middelbeek, R.J.; Goodyear, L.J.; Savolainen, A.M.; Kemppainen, J.; Jensen, J.; Din, M.U. Decreased insulin-stimulated brown adipose tissue glucose uptake after short-term exercise training in healthy middle-aged men. Diabetes Obes. Metab. 2017, 19, 1379–1388. [Google Scholar] [CrossRef]
- Davis, R.A.; Halbrooks, J.E.; Watkins, E.E.; Fisher, G.; Hunter, G.R.; Nagy, T.R.; Plaisance, E.P. High-intensity interval training and calorie restriction promote remodeling of glucose and lipid metabolism in diet-induced obesity. Am. J. Physiol. Endocrinol. Metab. 2017, 313, E243–E256. [Google Scholar] [CrossRef] [PubMed]
- Sari-Sarraf, V.; Parnian-khajehdizaj, N.; Amirsasan, R. High-intensity interval training and continuous training with intermittent calorie restriction in overweight women: Effect on the inflammation and lipid profile. Spor Bilim. Araştırmaları Derg. 2020, 5, 230–246. [Google Scholar] [CrossRef]
- Michel, J.M.; Godwin, J.S.; Plotkin, D.L.; Mesquita, P.H.; McIntosh, M.C.; Ruple, B.A.; Libardi, C.A.; Mobley, C.B.; Kavazis, A.N.; Roberts, M.D. Proteolytic markers associated with a gain and loss of leg muscle mass with resistance training followed by high-intensity interval training. Exp. Physiol. 2023, 108, 1268–1281. [Google Scholar] [CrossRef]
- Haun, C.T.; Roberts, M.D.; Romero, M.A.; Osburn, S.C.; Healy, J.C.; Moore, A.N.; Mobley, C.B.; Roberson, P.A.; Kephart, W.C.; Mumford, P.W. Concomitant external pneumatic compression treatment with consecutive days of high intensity interval training reduces markers of proteolysis. Eur. J. Appl. Physiol. 2017, 117, 2587–2600. [Google Scholar] [CrossRef] [PubMed]
- Mesquita, P.H.; Godwin, J.S.; Ruple, B.A.; Sexton, C.L.; McIntosh, M.C.; Mueller, B.J.; Osburn, S.C.; Mobley, C.B.; Libardi, C.A.; Young, K.C. Resistance training diminishes mitochondrial adaptations to subsequent endurance training in healthy untrained men. J. Physiol. 2023, 601, 3825–3846. [Google Scholar] [CrossRef] [PubMed]
- Liang, Y.; Chen, Y.; Yang, F.; Jensen, J.; Gao, R.; Yi, L.; Qiu, J. Effects of carbohydrate and protein supplement strategies on endurance capacity and muscle damage of endurance runners: A double blind, controlled crossover trial. J. Int. Soc. Sports Nutr. 2022, 19, 623–637. [Google Scholar] [CrossRef]
- Kertész, H.; Beyer, T.; London, K.; Saleh, H.; Chung, D.; Rausch, I.; Cal-Gonzalez, J.; Kitsos, T.; Kench, P.L. Reducing Radiation Exposure to Paediatric Patients Undergoing [18F]FDG-PET/CT Imaging. Mol. Imaging Biol. 2021, 23, 775–786. [Google Scholar] [CrossRef] [PubMed]


| Measure | Advantage for HBAT | Effect of Caffeine | Kinetic Pattern |
|---|---|---|---|
| Energy Expenditure | ↑ 25% | Strong for HBAT | Linear Decline |
| Carbohydrates | ↑ 40% | Sharp initial phase in HBAT | Biphasic Decay |
| Lipids | ↑ 15% * | Strong in LBAT | Late Peak |
| Proteins | Transitory peak | Specific effect in HBAT | Initial Rapid Decline |
Disclaimer/Publisher’s Note: The statements, opinions and data contained in all publications are solely those of the individual author(s) and contributor(s) and not of MDPI and/or the editor(s). MDPI and/or the editor(s) disclaim responsibility for any injury to people or property resulting from any ideas, methods, instructions or products referred to in the content. |
© 2025 by the authors. Licensee MDPI, Basel, Switzerland. This article is an open access article distributed under the terms and conditions of the Creative Commons Attribution (CC BY) license (https://creativecommons.org/licenses/by/4.0/).
Share and Cite
Soto, D.A.S.; Pérez, D.I.V.; Souza, M.R.d.; Reis, M.L.G.; Almeida, N.R.; Miarka, B.; Aedo-Muñoz, E.; Oyarzo, A.I.A.; Sillero-Quintana, M.; Queiroz, A.C.C.; et al. Thermogenic Activation of Adipose Tissue by Caffeine During Strenuous Exercising and Recovery: A Double-Blind Crossover Study. Metabolites 2025, 15, 517. https://doi.org/10.3390/metabo15080517
Soto DAS, Pérez DIV, Souza MRd, Reis MLG, Almeida NR, Miarka B, Aedo-Muñoz E, Oyarzo AIA, Sillero-Quintana M, Queiroz ACC, et al. Thermogenic Activation of Adipose Tissue by Caffeine During Strenuous Exercising and Recovery: A Double-Blind Crossover Study. Metabolites. 2025; 15(8):517. https://doi.org/10.3390/metabo15080517
Chicago/Turabian StyleSoto, Dany Alexis Sobarzo, Diego Ignácio Valenzuela Pérez, Mateus Rossow de Souza, Milena Leite Garcia Reis, Naiara Ribeiro Almeida, Bianca Miarka, Esteban Aedo-Muñoz, Armin Isael Alvarado Oyarzo, Manuel Sillero-Quintana, Andreia Cristiane Carrenho Queiroz, and et al. 2025. "Thermogenic Activation of Adipose Tissue by Caffeine During Strenuous Exercising and Recovery: A Double-Blind Crossover Study" Metabolites 15, no. 8: 517. https://doi.org/10.3390/metabo15080517
APA StyleSoto, D. A. S., Pérez, D. I. V., Souza, M. R. d., Reis, M. L. G., Almeida, N. R., Miarka, B., Aedo-Muñoz, E., Oyarzo, A. I. A., Sillero-Quintana, M., Queiroz, A. C. C., & Brito, C. J. (2025). Thermogenic Activation of Adipose Tissue by Caffeine During Strenuous Exercising and Recovery: A Double-Blind Crossover Study. Metabolites, 15(8), 517. https://doi.org/10.3390/metabo15080517