

Metabolomic Patterns at Birth of Preterm Newborns with Extrauterine Growth Restriction: Towards Putative Markers of Nutritional Status

 , , , , , , and
Abstract
1. Introduction
2. Materials and Methods
2.1. Study Population
2.2. Sample Collection and Preparation
2.3. Metabolomic Analysis
2.4. Statistical Data Analysis
3. Results
4. Discussion
5. Conclusions
Author Contributions
Funding
Institutional Review Board Statement
Informed Consent Statement
Data Availability Statement
Conflicts of Interest
Abbreviations
| BPD | Bronchopulmonary dysplasia |
| EOS | Early onset sepsis |
| EUGR | Extrauterine growth restriction |
| GA | Gestational age |
| IUGR | Intrauterine growth restriction |
| LOS | Late onset sepsis |
| MPO | myeloperoxidase |
| NAD | nicotinamide adenine dinucleotide |
| NMDA | N-methyl-D-aspartate |
| NEC | Necrotizing enterocolitis |
| NICU | Neonatal Intensive Care Unit |
| PMA | Postmenstrual Age |
| PN | Parenteral nutrition |
| ROP | Retinopathy of prematurity |
| SGA | Small for gestational age |
| VLBWI | Very Low Birth Weight Infants |
| PCA | Principal Component Analysis |
| PLS2C | PLS for classification |
| MCC | Matthews correlation coefficient |
| MCCcv | Matthews correlation coefficient calculated by cross-validation |
References
- Embleton, N.E.; Pang, N.; Cooke, R.J. Postnatal Malnutrition and Growth Retardation: An Inevitable Consequence of Current Recommendations in Preterm Infants? Pediatrics 2001, 107, 270–273. [Google Scholar] [CrossRef]
- Cooke, R.J.; Ainsworth, S.B.; Fenton, A.C. Postnatal growth retardation: A universal problem in preterm infants. Arch. Dis. Child. Fetal Neonatal Ed. 2004, 89, F428. [Google Scholar] [CrossRef]
- Thureen, P.J.; Hay, W.W. Early aggressive nutrition in preterm infants. Semin. Neonatol. 2001, 6, 403–415. [Google Scholar] [CrossRef]
- Mihatsch, W.A.; Braegger, C.; Bronsky, J.; Cai, W.; Campoy, C.; Carnielli, V.; Darmaun, D.; Desci, T.; Domellöf, M.; Embleton, N.; et al. ESPGHAN/ESPEN/ESPR/CSPEN guidelines on pediatric parenteral nutrition. Clin. Nutr. 2018, 37, 2303–2305. [Google Scholar] [CrossRef]
- Embleton, N.D.M.; Moltu, S.J.; Lapillonne, A.; Akker, C.H.v.D.; Carnielli, V.; Fusch, C.; Gerasimidis, K.; van Goudoever, J.B.; Haiden, N.M.; Iacobelli, S.; et al. Enteral Nutrition in Preterm Infants (2022): A Position Paper from the ESPGHAN Committee on Nutrition and Invited Experts. J. Pediatr. Gastroenterol. Nutr. 2023, 76, 248–268. [Google Scholar] [CrossRef] [PubMed]
- Parkinson, J.R.C.; Hyde, M.J.; Gale, C.; Santhakumaran, S.; Modi, N. Preterm Birth and the Metabolic Syndrome in Adult Life: A Systematic Review and Meta-analysis. Pediatrics 2013, 131, e1240–e1263. [Google Scholar] [CrossRef] [PubMed]
- Peila, C.; Spada, E.; Giuliani, F.; Maiocco, G.; Raia, M.; Cresi, F.; Bertino, E.; Coscia, A. Extrauterine growth restriction: Definitions and predictability of outcomes in a cohort of very low birth weight infants or preterm neonates. Nutrients 2020, 12, 1224. [Google Scholar] [CrossRef]
- Tozzi, M.G.; Moscuzza, F.; Michelucci, A.; Lorenzoni, F.; Cosini, C.; Ciantelli, M.; Ghirri, P. ExtraUterine Growth Restriction (EUGR) in preterm infants: Growth patterns, nutrition, and epigenetic markers. A pilot study. Front. Pediatr. 2018, 6, 408. [Google Scholar] [CrossRef] [PubMed]
- Clark, R.H.; Thomas, P.; Peabody, J. Extrauterine Growth Restriction Remains a Serious Problem in Prematurely Born Neonates. Pediatrics 2003, 111, 986–990. [Google Scholar] [CrossRef]
- Fenton, T.R.; Kim, J.H. A Systematic Review and Meta-Analysis to Revise the Fenton Growth Chart for Preterm Infants. BMC Pediatr. 2013, 13, 59. Available online: http://www.biomedcentral.com/1471-2431/13/59 (accessed on 4 May 2025). [CrossRef]
- Villar, J.; Giuliani, F.; Bhutta, Z.A.; Bertino, E.; Ohuma, E.O.; Ismail, L.C.; Barros, F.C.; Altman, D.G.; Victora, C.; Noble, J.A.; et al. Postnatal growth standards for preterm infants: The Preterm Postnatal Follow-up Study of the INTERGROWTH-21st Project. Lancet Glob. Health 2015, 3, e681–e691. [Google Scholar] [CrossRef]
- Ehrenkranz, R.A. Extrauterine growth restriction: Is it preventable? J. Pediatr. 2014, 90, 1–3. [Google Scholar] [CrossRef]
- Makker, K.; Ji, Y.; Hong, X.; Wang, X. Antenatal and neonatal factors contributing to extra uterine growth failure (EUGR) among preterm infants in Boston Birth Cohort (BBC). J. Perinatol. 2021, 41, 1025–1032. [Google Scholar] [CrossRef]
- Stoll, B.J.; Hansen, N.I.; Bell, E.F.; Shankaran, S.; Laptook, A.R.; Walsh, M.C.; Hale, E.C.; Newman, N.S.; Schibler, K.; Carlo, W.A.; et al. Neonatal outcomes of extremely preterm infants from the NICHD Neonatal Research Network. Pediatrics 2010, 126, 443–456. [Google Scholar] [CrossRef]
- Figueras-Aloy, J.; Palet-Trujols, C.; Matas-Barceló, I.; Botet-Mussons, F.; Carbonell-Estrany, X.; Cat, C. Extrauterine growth restriction in very preterm infant: Etiology, diagnosis, and 2-year follow-up. Eur. J. Pediatr. 2020, 179, 1469–1479. [Google Scholar] [CrossRef]
- Gao, L.; Shen, W.; Wu, F.; Mao, J.; Liu, L.; Chang, Y.-M.; Zhang, R.; Ye, X.-Z.; Qiu, Y.-P.; Ma, L.; et al. Real-time predictive model of extrauterine growth retardation in preterm infants with gestational age less than 32 weeks. Sci. Rep. 2024, 14, 1–13. [Google Scholar] [CrossRef]
- Cusick, S.E.; Georgieff, M.K. The Role of Nutrition in Brain Development: The Golden Opportunity of the “First 1000 Days”. J. Pediatr. 2016, 175, 16–21. [Google Scholar] [CrossRef]
- Martin, C.R.; Brown, Y.F.; Ehrenkranz, R.A.; O’Shea, T.M.; Allred, E.N.; Belfort, M.B.; McCormick, M.C.; Leviton, A.; the Extremely Low Gestational Age Newborns Study Investigators. Nutritional practices and growth velocity in the first month of life in extremely premature infants. Pediatrics 2009, 124, 649–657. [Google Scholar] [CrossRef]
- Carraro, S.; Giordano, G.; Reniero, F.; Perilongo, G.; Baraldi, E. Metabolomics: A New Frontier for Research in Pediatrics. J. Pediatr. 2009, 154, 638–644. [Google Scholar] [CrossRef]
- Dudzik, D.; Platas, I.I.; Renau, M.I.; Esponera, C.B.; Mendoza, B.d.R.H.d.; Lerin, C.; Ramón-Krauel, M.; Barbas, C. Plasma Metabolome Alterations Associated with Extrauterine Growth Restriction. Nutrients 2020, 12, 1188. [Google Scholar] [CrossRef]
- Duan, J.; Zhong, Q.; Luo, L.; Ning, Y.; Qi, Z.; Wang, S.; Liang, K. Metabolomic profiling of human feces and plasma from extrauterine growth restriction infants. Pediatr. Res. 2024, 97, 2097–2105. [Google Scholar] [CrossRef]
- Priante, E.; Verlato, G.; Stocchero, M.; Giordano, G.; Pirillo, P.; Bonadies, L.; Visentin, S.; Moschino, L.; Baraldi, E. Metabolomic profiling of intrauterine growth-restricted preterm infants: A matched case–control study. Pediatr. Res. 2023, 93, 1599–1608. [Google Scholar] [CrossRef]
- Sumner, L.W.; Amberg, A.; Barrett, D.; Beale, M.H.; Beger, R.; Daykin, C.A.; Fan, T.W.-M.; Fiehn, O.; Goodacre, R.; Griffin, J.L.; et al. Proposed minimum reporting standards for chemical analysis. Metabolomics 2007, 3, 211–221. [Google Scholar] [CrossRef]
- Stocchero, M.; De Nardi, M.; Scarpa, B. PLS for classification. Chemom. Intell. Lab. Syst. 2021, 216, 104374. [Google Scholar] [CrossRef]
- Stocchero, M. Relevant and irrelevant predictors in PLS2. J. Chemom. 2020, 34, e3237. [Google Scholar] [CrossRef]
- Bin, P.; Huang, R.; Zhou, X. Oxidation Resistance of the Sulfur Amino Acids: Methionine and Cysteine. Biomed. Res. Int. 2017, 2017, 9584932. [Google Scholar] [CrossRef]
- Ulrich, K.; Jakob, U. The role of thiols in antioxidant systems. Free. Radic. Biol. Med. 2019, 140, 14–27. [Google Scholar] [CrossRef]
- Rehman, T.; Shabbir, M.A.; Inam-Ur-Raheem, M.; Manzoor, M.F.; Ahmad, N.; Liu, Z.-W.; Ahmad, M.H.; Siddeeg, A.; Abid, M.; Aadil, R.M. Cysteine and homocysteine as biomarker of various diseases. Food Sci. Nutr. 2020, 8, 4696–4707. [Google Scholar] [CrossRef]
- Muthuraman, A.; Ramesh, M.; Shaikh, S.A.; Aswinprakash, S.; Jagadeesh, D. Physiological and Pathophysiological Role of Cysteine Metabolism in Human Metabolic Syndrome. Drug Metab. Lett. 2021, 14, 177–192. [Google Scholar] [CrossRef]
- Saugstad, O.D. Oxidative Stress in the Newborn—A 30-Year Perspective. Biol. Neonate 2005, 88, 228–236. [Google Scholar] [CrossRef]
- Murthi, P.; Wallace, E.M.; Walker, D.W. Altered placental tryptophan metabolic pathway in human fetal growth restriction. Placenta 2017, 52, 62–70. [Google Scholar] [CrossRef]
- Boldyrev, A.A.; Aldini, G.; Derave, W. Physiology and Pathophysiology of Carnosine. Physiol. Rev. 2013, 93, 1803–1845. [Google Scholar] [CrossRef]
- Rashid, C.S.; Bansal, A.; Simmons, R.A. Oxidative Stress, Intrauterine Growth Restriction, and Developmental Programming of Type 2 Diabetes. Physiology 2018, 33, 348–359. [Google Scholar] [CrossRef]
- Cong, J.; Zhang, L.; Li, J.; Wang, S.; Gao, F.; Zhou, G. Effects of dietary supplementation with carnosine on growth performance, meat quality, antioxidant capacity and muscle fiber characteristics in broiler chickens. J. Sci. Food Agric. 2017, 97, 3733–3741. [Google Scholar] [CrossRef]
- Zhang, X.; Song, L.; Cheng, X.; Yang, Y.; Luan, B.; Jia, L.; Xu, F.; Zhang, Z. Carnosine pretreatment protects against hypoxia–ischemia brain damage in the neonatal rat model. Eur. J. Pharmacol. 2011, 667, 202–207. [Google Scholar] [CrossRef]
- Curi, R.; Lagranha, C.J.; Doi, S.Q.; Sellitti, D.F.; Procopio, J.; Pithon-Curi, T.C.; Corless, M.; Newsholme, P. Molecular mechanisms of glutamine action. J. Cell Physiol. 2005, 204, 392–401. [Google Scholar] [CrossRef]
- Cruzat, V.F.; Pantaleão, L.C.; Donato, J.; de Bittencourt, P.I.H.; Tirapegui, J. Oral supplementations with free and dipeptide forms of l-glutamine in endotoxemic mice: Effects on muscle glutamine-glutathione axis and heat shock proteins. J. Nutr. Biochem. 2014, 25, 345–352. [Google Scholar] [CrossRef]
- Cruzat, V.; Macedo Rogero, M.; Noel Keane, K.; Curi, R.; Newsholme, P. Glutamine: Metabolism and Immune Function, Supplementation and Clinical Translation. Nutrients 2018, 10, 1564. [Google Scholar] [CrossRef]
- Ciorba, M.A. Kynurenine pathway metabolites: Relevant to vitamin B-6 deficiency and beyond123. Am. J. Clin. Nutr. 2013, 98, 863–864. [Google Scholar] [CrossRef]
- Chen, C.-F.; Liu, T.-Z.; Lan, W.-H.; Wu, L.-A.; Tsai, C.-H.; Chiou, J.-F.; Tsai, L.-Y. Novel spectrophotometric method for the quantitation of urinary xanthurenic acid and its application in identifying individuals with hyperhomocysteinemia associated with vitamin b6 deficiency. BioMed Res. Int. 2013, 2013, 678476. [Google Scholar] [CrossRef]
- Oxenkrug, G.F. Increased Plasma Levels of Xanthurenic and Kynurenic Acids in Type 2 Diabetes. Mol. Neurobiol. 2015, 52, 805–810. [Google Scholar] [CrossRef]
- Palosaari, S.; Koivula, M.K.; Nicholas, A.; Risteli, L.; Risteli, J. Homocitrulline: An Analog and Confounder Related to Citrulline. In Protein Deimination in Human Health and Disease; Springer Science Business Media LLC: New York, NY, USA, 2014; pp. 367–376. [Google Scholar] [CrossRef]
- Wu, H.Q.; Ungerstedt, U.; Schwarcz, R. l-α-Aminoadipic acid as a regulator of kynurenic acid production in the hippocampus: A microdialysis study in freely moving rats. Eur. J. Pharmacol. 1995, 281, 55–61. [Google Scholar] [CrossRef]
- Wang, T.J.; Ngo, D.; Psychogios, N.; Dejam, A.; Larson, M.G.; Vasan, R.S.; Ghorbani, A.; O’sUllivan, J.; Cheng, S.; Rhee, E.P.; et al. 2-Aminoadipic acid is a biomarker for diabetes risk. J. Clin. Invest. 2013, 123, 4309–4317. [Google Scholar] [CrossRef]
- Fanos, V.; Fanni, C.; Ottonello, G.; Noto, A.; Dessì, A.; Mussap, M. Metabolomics in adult and pediatric nephrology. Molecules 2013, 18, 4844–4857. [Google Scholar] [CrossRef] [PubMed] [PubMed Central]
- Fanos, V.; Atzori, L.; Makarenko, K.; Melis, G.B.; Ferrazzi, E. Metabolomics application in maternal-fetal medicine. BioMed Res. Int. 2013, 2013, 720514. [Google Scholar] [CrossRef] [PubMed] [PubMed Central]

| Characteristic | EUGR (n = 16) | Non-EUGR (n = 16) | p |
|---|---|---|---|
| Birth weight, g | 1026.88 ± 327.01 | 1111.18 ± 306.86 | 0.34 |
| Gestational age, weeks | 29.1 ± 2.1 | 28.6 ± 1.6 | 0.121 |
| Male sex | 6 (37.5%) | 4 (25%) | 0.613 |
| Female sex | 10 (62.5%) | 12 (75%) | 0.613 |
| Multiple pregnancy | 4 (25%) | 6 (37.5%) | 0.613 |
| Cesarean delivery | 14 (87.5%) | 14 (87.5%) | 0.678 |
| Complete prenatal steroids | 4 (25%) | 8 (50%) | 0.421 |
| Apgar score at 5 min | 8.0 (7.0–8.0) | 8.0 (7.0–8.0) | 0.658 |
| IUGR | 3 (19%) | 0 (0%) | 0.226 |
| BPD | 7 (43.8%) | 3 (18.8%) | 0.435 |
| EOS | 1 (6.3%) | 1 (6.3%) | 1.000 |
| LOS | 6 (37.5%) | 2 (12.5%) | 0.251 |
| ROP grade | 1 (0–1) | 0 (0–1.5) | 0.559 |
| Days to full enteral feeding | 26.9 ± 14.3 | 17.5 ± 8.2 | <0.001 |
| Weight at 36 weeks GA, g | 1782 ± 196 | 2325 ± 292 | <0.001 |
| z-score weight at 36 weeks GA | −2.09 ± 0.55 | −0.88 ± 0.51 | <0.001 |
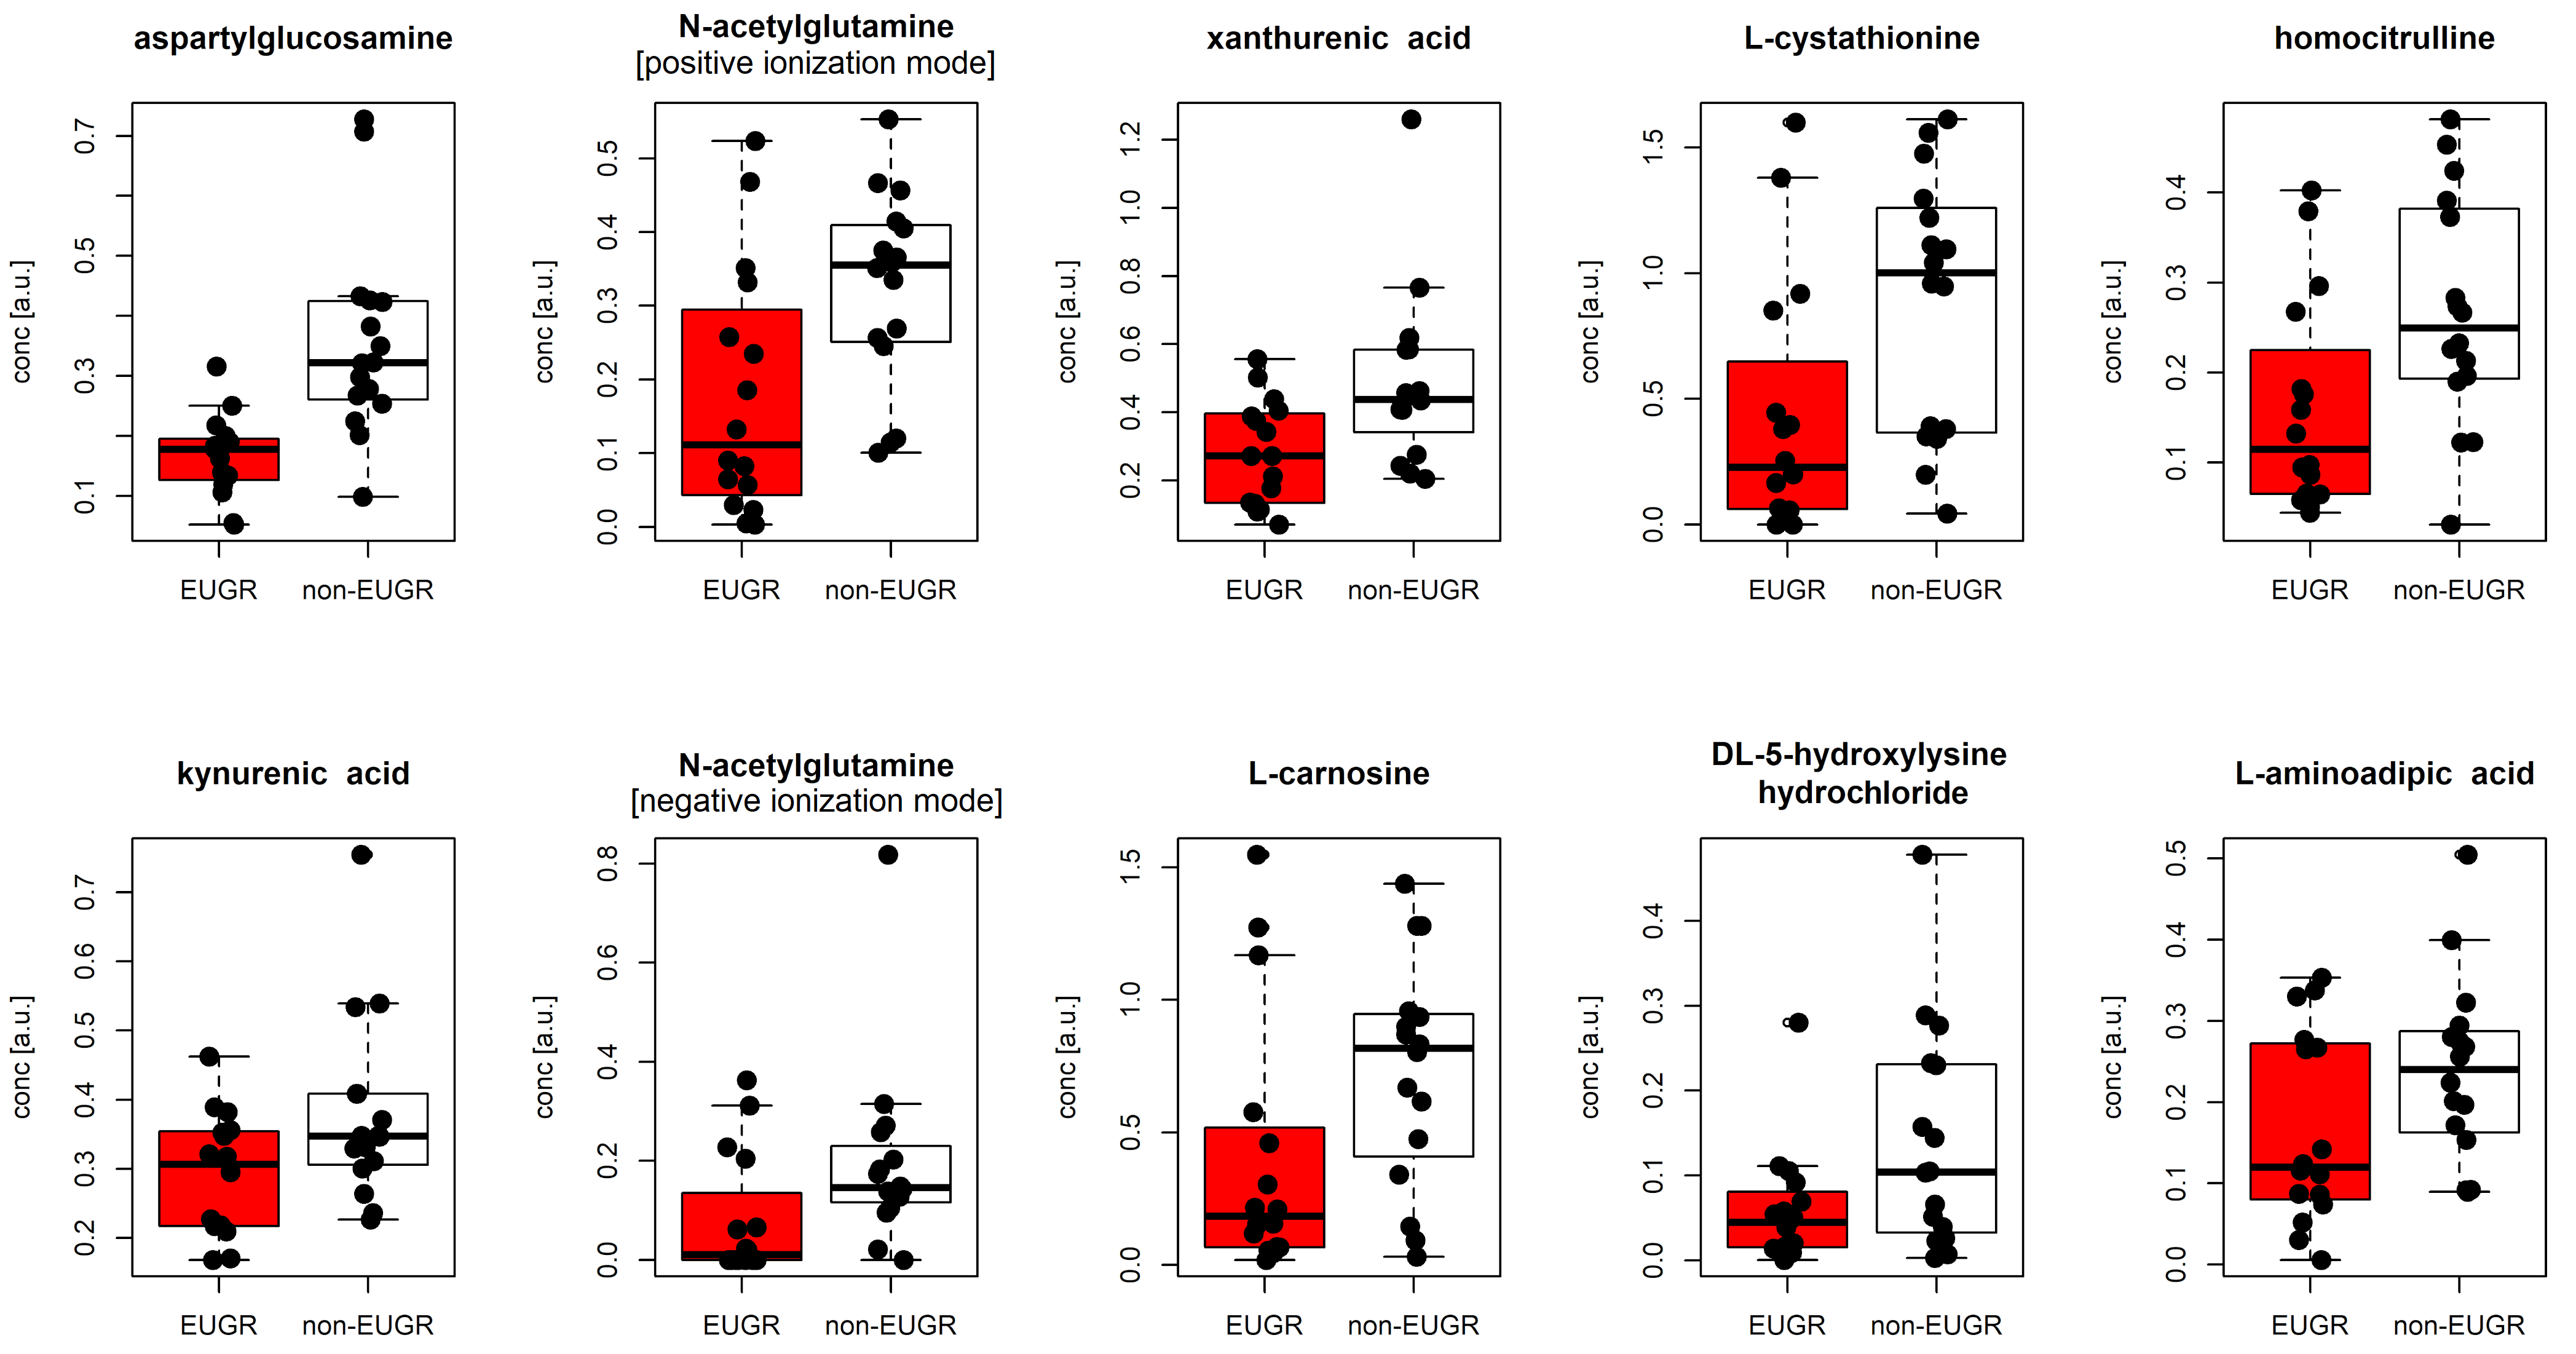
| Name | plogREG | pMW | MCC | MCCcv | EUGR | Non-EUGR |
|---|---|---|---|---|---|---|
| aspartylglucosamine | 0.005 | 1.87 × 10⁻⁵ | 0.689 | 0.683 | 0.177 [0.063] | 0.322 [0.160] |
| N-acetylglutamine [positive ionization mode] | 0.018 | 6.61 × 10⁻³ | 0.445 | 0.438 | 0.111 [0.226] | 0.355 [0.153] |
| N-acetylglutamine [negative ionization mode] | 0.061 | 1.21 × 10⁻² | 0.500 | 0.415 | 0.011 [0.100] | 0.146 [0.094] |
| xanthurenic acid | 0.019 | 4.48 × 10⁻³ | 0.408 | 0.378 | 0.272 [0.258] | 0.437 [0.209] |
| L-cystathionine | 0.028 | 1.89 × 10⁻² | 0.378 | 0.378 | 0.228 [0.484] | 1.000 [0.866] |
| homocitrulline | 0.029 | 1.70 × 10⁻² | 0.438 | 0.396 | 0.115 [0.138] | 0.250 [0.183] |
| kynurenic acid | 0.057 | 6.15 × 10⁻² | 0.313 | 0.207 | 0.307 [0.136] | 0.347 [0.100] |
| L-carnosine | 0.061 | 3.52 × 10⁻² | 0.441 | 0.438 | 0.183 [0.422] | 0.818 [0.499] |
| DL-5-hydroxylysine hydrochloride | 0.061 | 6.15 × 10⁻² | 0.346 | 0.318 | 0.045 [0.059] | 0.104 [0.195] |
| L-aminoadipic acid | 0.092 | 9.38 × 10⁻² | 0.282 | 0.250 | 0.120 [0.186] | 0.240 [0.117] |
Disclaimer/Publisher’s Note: The statements, opinions and data contained in all publications are solely those of the individual author(s) and contributor(s) and not of MDPI and/or the editor(s). MDPI and/or the editor(s) disclaim responsibility for any injury to people or property resulting from any ideas, methods, instructions or products referred to in the content. |
© 2025 by the authors. Licensee MDPI, Basel, Switzerland. This article is an open access article distributed under the terms and conditions of the Creative Commons Attribution (CC BY) license (https://creativecommons.org/licenses/by/4.0/).
Share and Cite
Meneghelli, M.; Verlato, G.; Stocchero, M.; Righetto, A.; Priante, E.; Zanetto, L.; Pirillo, P.; Giordano, G.; Baraldi, E. Metabolomic Patterns at Birth of Preterm Newborns with Extrauterine Growth Restriction: Towards Putative Markers of Nutritional Status. Metabolites 2025, 15, 518. https://doi.org/10.3390/metabo15080518
Meneghelli M, Verlato G, Stocchero M, Righetto A, Priante E, Zanetto L, Pirillo P, Giordano G, Baraldi E. Metabolomic Patterns at Birth of Preterm Newborns with Extrauterine Growth Restriction: Towards Putative Markers of Nutritional Status. Metabolites. 2025; 15(8):518. https://doi.org/10.3390/metabo15080518
Chicago/Turabian StyleMeneghelli, Marta, Giovanna Verlato, Matteo Stocchero, Anna Righetto, Elena Priante, Lorenzo Zanetto, Paola Pirillo, Giuseppe Giordano, and Eugenio Baraldi. 2025. "Metabolomic Patterns at Birth of Preterm Newborns with Extrauterine Growth Restriction: Towards Putative Markers of Nutritional Status" Metabolites 15, no. 8: 518. https://doi.org/10.3390/metabo15080518
APA StyleMeneghelli, M., Verlato, G., Stocchero, M., Righetto, A., Priante, E., Zanetto, L., Pirillo, P., Giordano, G., & Baraldi, E. (2025). Metabolomic Patterns at Birth of Preterm Newborns with Extrauterine Growth Restriction: Towards Putative Markers of Nutritional Status. Metabolites, 15(8), 518. https://doi.org/10.3390/metabo15080518