
Assessment of Fatty Acid Concentrations Among Blood Matrices

 , , , , and
Abstract
1. Introduction
2. Materials and Methods
Methods
3. Results
4. Discussion
5. Conclusions
Author Contributions
Funding
Institutional Review Board Statement
Informed Consent Statement
Data Availability Statement
Acknowledgments
Conflicts of Interest
References
- Ichihara, K.; Fukubayashi, Y. Preparation of fatty acid methyl esters for gas-liquid chromatography. J. Lipid Res. 2010, 51, 635–640. [Google Scholar] [CrossRef] [PubMed]
- Masood, A.; Stark, K.D.; Salem, N. A simplified and efficient method for the analysis of fatty acid methyl esters suitable for large clinical studies. J. Lipid Res. 2005, 46, 2299–2305. [Google Scholar] [CrossRef] [PubMed]
- Eder, K. Gas chromatographic analysis of fatty acid methyl esters. J. Chromatogr. B Biomed. Appl. 1995, 671, 113–131. [Google Scholar] [CrossRef] [PubMed]
- Heird, W.C.; Lapillonne, A. The role of essential fatty acids in development. Annu. Rev. Nutr. 2005, 25, 549–571. [Google Scholar] [CrossRef] [PubMed]
- Chaudry, A.; McClinton, S.; Moffat, L.E.; Wahle, K.W. Essential fatty acid distribution in the plasma and tissue phospholipids of patients with benign and malignant prostatic disease. Br. J. Cancer 1991, 64, 1157–1160. [Google Scholar] [CrossRef] [PubMed]
- Aleryani, S.L.; Cluette-Brown, J.E.; Khan, Z.A.; Hasaba, H.; De Heredia, L.L.; Laposata, M. Fatty acid methyl esters are detectable in the plasma and their presence correlates with liver dysfunction. Clin. Chim. Acta 2005, 359, 141–149. [Google Scholar] [CrossRef] [PubMed]
- Bicalho, B.; David, F.; Rumplel, K.; Kindt, E.; Sandra, P. Creating a fatty acid methyl ester database for lipid profiling in a single drop of human blood using high resolution capillary gas chromatography and mass spectrometry. J. Chromatogr. A 2008, 1211, 120–128. [Google Scholar] [CrossRef] [PubMed]
- Hodson, L.; Gunn, P.J. The regulation of hepatic fatty acid synthesis and partitioning: The effect of nutritional state. Nat. Rev. Endocrinol. 2019, 15, 689–700. [Google Scholar]
- Calder, P.C. Functional roles of fatty acids and their effects on human health. J. Parenter. Enter. Nutr. 2015, 39, 18S–32S. [Google Scholar] [CrossRef] [PubMed]
- Brenna, J.T.; Plourde, M.; Stark, K.D.; Jones, P.J.; Lin, Y.H. Best practices for the design, laboratory analysis, and reporting of trials involving fatty acids. Am. J. Clin. Nutr. 2018, 108, 211–227. [Google Scholar] [CrossRef] [PubMed]
- Kume, A.; Miyazaki, T.; Kitamura, Y.; Oshida, K.; Yanagisawab, N.; Takizawa, H.; Fujii, K.; Kiyanagi, T.; Sumiyoshi, K.; Ohmura, H.; et al. High levels of saturated very long-chain fatty acid (hexacosanoic acid; C26: 0) in whole blood are associated with metabolic syndrome in Japanese men. Diabetes Res. Clin. Pract. 2008, 80, 259–264. [Google Scholar] [CrossRef] [PubMed]
- Hodge, A.M.; English, D.R.; O’Dea, K.; Sinclair, A.J.; Makrides, M.; Gibson, R.A.; Giles, G.G. Plasma phospholipid and dietary fatty acids as predictors of type 2 diabetes: Interpreting the role of linoleic acid. Am. J. Clin. Nutr. 2007, 86, 189–197. [Google Scholar] [CrossRef]
- Molendi-Coste, O.; Legry, V.; Leclercq, I.A. Why and how meet n-3 PUFA dietary recommendations? Gynecol. Obstet. Fertil. 2016, 44, 706–711. [Google Scholar] [CrossRef] [PubMed]
- Liu, Z.; Lin, S.; Weng, R.; Liu, Y.; Li, T.; Su, X.; Yu, C. Fatty acid profiling of blood cell membranes by gas chromatography with mass spectrometry. J. Sep. Sci. 2016, 39, 3964–3972. [Google Scholar] [CrossRef]
- Wu, J.; Marklund, M.; Imamura, F.; Tintle, N.; Korat, A.V.A.; de Goede, J.; Zhou, X.; Yang, W.-S.; de Oliveira Otto, M.C.; Kröger, J.; et al. Omega-6 fatty acid biomarkers and incident type 2 diabetes: Pooled analysis of individual-level data for 39 740 adults from 20 prospective cohort studies. Lancet Diabetes Endocrinol. 2017, 5, 965–974. [Google Scholar] [CrossRef] [PubMed]
- Buchanan, C.D.; Lust, C.A.; Burns, J.L.; Hillyer, L.M.; Martin, S.A.; Wittert, G.A.; Ma, D.W. Analysis of major fatty acids from matched plasma and serum samples reveals highly comparable absolute and relative levels. Prostaglandins Leukot. Essent. Fat. Acids 2021, 168, 102268. [Google Scholar] [CrossRef] [PubMed]
- Rangel-Huerta, O.D.; Aguilera, C.M.; Mesa, M.D.; Gil, A. Omega-3 long-chain polyunsaturated fatty acids supplementation on inflammatory biomakers: A systematic review of randomized clinical trials. Br. J. Nutr. 2012, 107 (Suppl. 2), S159–S170. [Google Scholar] [CrossRef] [PubMed]
- Spector, A.A. Fatty acid binding to plasma albumin. J. Lipid Res. 1975, 16, 165–179. [Google Scholar] [CrossRef]
- Viscarra, J.A.; Ortiz, R.M. Cellular mechanisms regulating fuel metabolism in mammals: Role of adipose tissue and lipids during prolonged food deprivation. Metabolism 2013, 62, 889–897. [Google Scholar] [CrossRef]
- Vianey-Liaud, C.; Divry, P.; Gregersen, N.; Mathieu, M. The inborn errors of mitochondrial fatty acid oxidation. J. Inherit. Metab. Dis. 1987, 10, 159–198. [Google Scholar] [CrossRef] [PubMed]


| FAME Analyte | Molecular Weight | Target Ion m/z | Reference Ion 1 m/z | Reference Ion 2 m/z | Similarity Index * |
|---|---|---|---|---|---|
| Methyl butyrate (C4:0) | 102 | 74 | 71 | 79 | 98 |
| Methyl caproate (C6:0) | 130 | 74 | 87 | 99 | 98 |
| Methyl caprylate (C8:0) | 158 | 74 | 87 | 55 | 97 |
| Methyl decanoate (C10:0) | 186 | 74 | 87 | 55 | 97 |
| Methyl undecanoate (C11:0) | 200 | 74 | 87 | 55 | 96 |
| Methyl dodecanoate (C12:0) | 214 | 74 | 87 | 55 | 96 |
| Methyl tridecanoate (C13:0) | 228 | 74 | 87 | 55 | 97 |
| Methyl myristate (C14:0) | 242 | 74 | 87 | 55 | 96 |
| Methyl myristoleate (C14:1 [cis-9]) | 240 | 55 | 74 | 69 | 96 |
| Methyl pentadecanoate (C15:0) | 256 | 74 | 87 | 55 | 96 |
| Methyl pentadecenoate (C15:1 [cis-10]) | 254 | 55 | 74 | 69 | 94 |
| Methyl palmitate (C16:0) | 270 | 74 | 87 | 75 | 96 |
| Methyl palmitoleate (C16:1 [cis-9]) | 268 | 55 | 69 | 74 | 96 |
| Methyl heptadecanoate (C17:0) | 284 | 74 | 87 | 55 | 97 |
| Methyl heptadecenoate (C17:1 [cis-10]) | 282 | 55 | 69 | 97 | 95 |
| Methyl stearate (C18:0) | 298 | 74 | 87 | 75 | 96 |
| Methyl octadecenoate (C18:1 [trans-9]) | 296 | 55 | 69 | 83 | 95 |
| Methyl oleate (C18:1 [cis-9]) | 296 | 55 | 69 | 97 | 95 |
| Methyl linoleaidate (C18:2 [trans-9,12]) | 312 | 74 | 87 | 55 | 95 |
| Methyl linoleate (C18:2 [cis-9,12]) | 294 | 81 | 67 | 95 | 96 |
| Methyl arachidate (C20:0) | 294 | 81 | 67 | 95 | 96 |
| Methyl linolenate (C18:3 [cis-6,9,12]) | 326 | 74 | 87 | 75 | 93 |
| Methyl eicosenoate (C20:1 [cis-11]) | 292 | 79 | 67 | 80 | 96 |
| Methyl linolenate (C18:3 [cis-9,12,15]) | 324 | 55 | 69 | 97 | 96 |
| Methyl heneicosanoate (C21:0) | 292 | 79 | 67 | 95 | 94 |
| Methyl eicosadienoate (C20:2 [cis-11,14]) | 340 | 74 | 87 | 75 | 92 |
| Methyl behenate (C22:0 FAME) | 322 | 81 | 67 | 95 | 95 |
| Methyl eicosatrienoate (C20:3 [cis-8,11,14]) | 354 | 74 | 87 | 354 | 95 |
| Methyl erucate (C22:1 [cis-13]) | 320 | 79 | 80 | 67 | 95 |
| Methyl eicosatrienoate (C20:3 [cis-11,14,17]) | 352 | 55 | 69 | 83 | 91 |
| Methyl arachidonate (C20:4 [cis-5,8,11,14]) | 368 | 74 | 87 | 79 | 88 |
| Methyl tricosanoate (C23:0) | 318 | 79 | 91 | 80 | 97 |
| Methyl docosadienoate (C22:2 [cis-13,16]) | 350 | 81 | 67 | 95 | 95 |
| Methyl lignocerate (C24:0) | 382 | 74 | 87 | 382 | 96 |
| Methyl cis 5,8,11,14,17-eicosapentaenoate | 316 | 79 | 91 | 93 | 98 |
| Methyl nervonate (C24:1 [cis-15]) | 380 | 55 | 69 | 83 | 91 |
| Methyl docosahexaenoate (cis-4,7,10,13,16,19) | 342 | 74 | 91 | 67 | 97 |
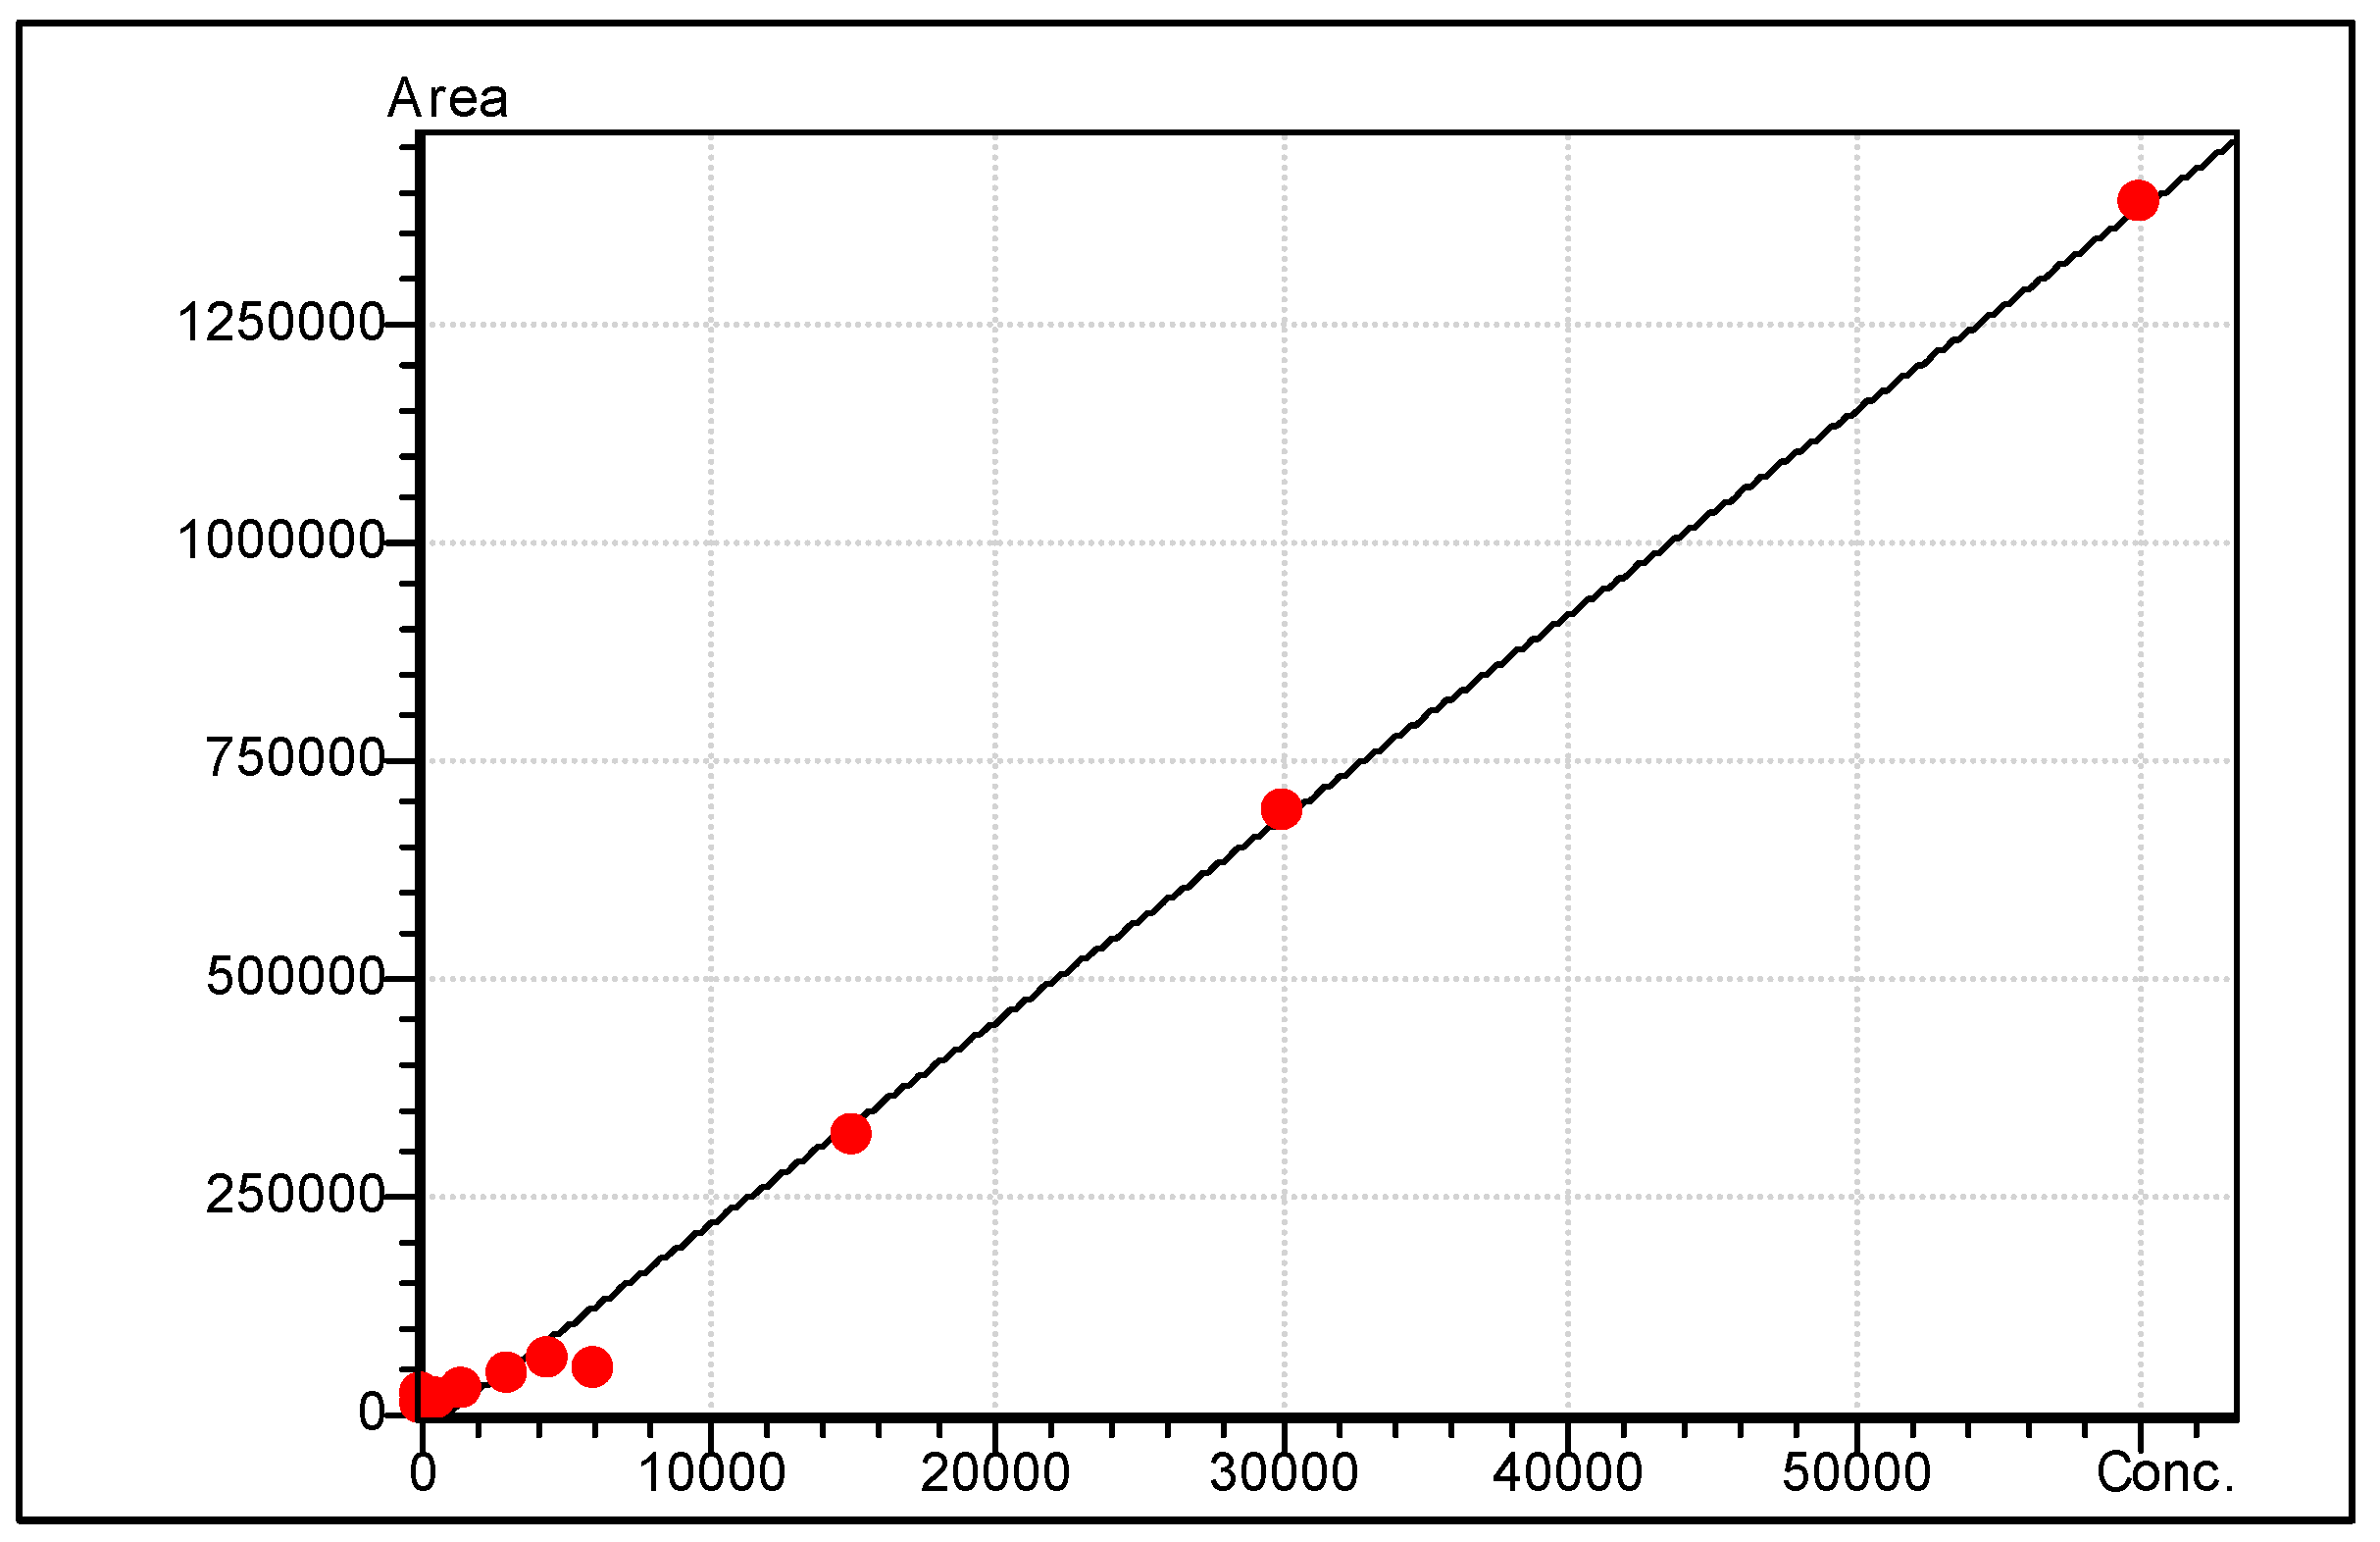
| FAME Analyte | RT (mins) | R2 | Range of Linearity (ng/mL) | Limit of Detection (ng/mL) | S/N at Lowest Calibrator | Fatty Acid Classification |
|---|---|---|---|---|---|---|
| Methyl butyrate (C4:0) | 16.795 | 0.998 | 10,000–40,000 | 2625.236 | 16.41 | SCFA |
| Methyl caproate (C6:0) | 22.685 | 0.99 | 2000–40,000 | 766.3273 | 6.56 | SCFA |
| Methyl caprylate (C8:0) | 28.39 | 0.997 | 1000–40,000 | 586.615 | 10.89 | MCFA |
| Methyl decanoate (C10:0) | 33.525 | 0.997 | 1000–40,000 | 97.74512 | 11.23 | MCFA |
| Methyl undecanoate (C11:0) | 38.855 | 0.993 | 2000–20,000 | 181.1912 | 2.61 | MCFA |
| Methyl dodecanoate (C12:0) | 38.065 | 0.997 | 1000–40,000 | 544.8326 | 18.83 | MCFA |
| Methyl tridecanoate (C13:0) | 40.125 | 0.998 | 1000–40,000 | 407.3278 | 16.39 | LCFA |
| Methyl myristate (C14:0) | 42.09 | 0.998 | 1000–40,000 | 526.8825 | 20.42 | LCFA |
| Methyl pentadecanoate (C15:0) | 43.935 | 0.998 | 1000–20,000 | 422.2703 | 11.7 | LCFA |
| Methyl palmitate (C16:0) | 45.72 | 0.995 | 1500–60,000 | 1898.594 | 49.13 | LCFA |
| Methyl heptadecanoate (C17:0) | 47.36 | 0.997 | 500–20,000 | 146.9132 | 7.21 | LCFA |
| Methyl stearate (C18:0) | 48.98 | 0.994 | 1000–40,000 | 196.9079 | 3.48 | LCFA |
| Methyl linolenate (C18:3 [cis-6,9,12]) | 51.965 | 0.996 | 200–20,000 | 104.1717 | 12.96 | LCFA |
| Methyl eicosatrienoate (C20:3 [cis-8,11,14]) | 54.855 | 0.997 | 500–20,000 | 102.9729 | 7.64 | LCFA |
| Methyl lignocerate (C24:0) | 57.905 | 0.997 | 2000–40,000 | 1248.4 | 7.59 | LCFA |
| Methyl docosahexaenoate (cis-4,7,10,13,16,19) | 63.84 | 0.999 | 500–20,000 | 11,453.34 | 18.1 | LCFA |
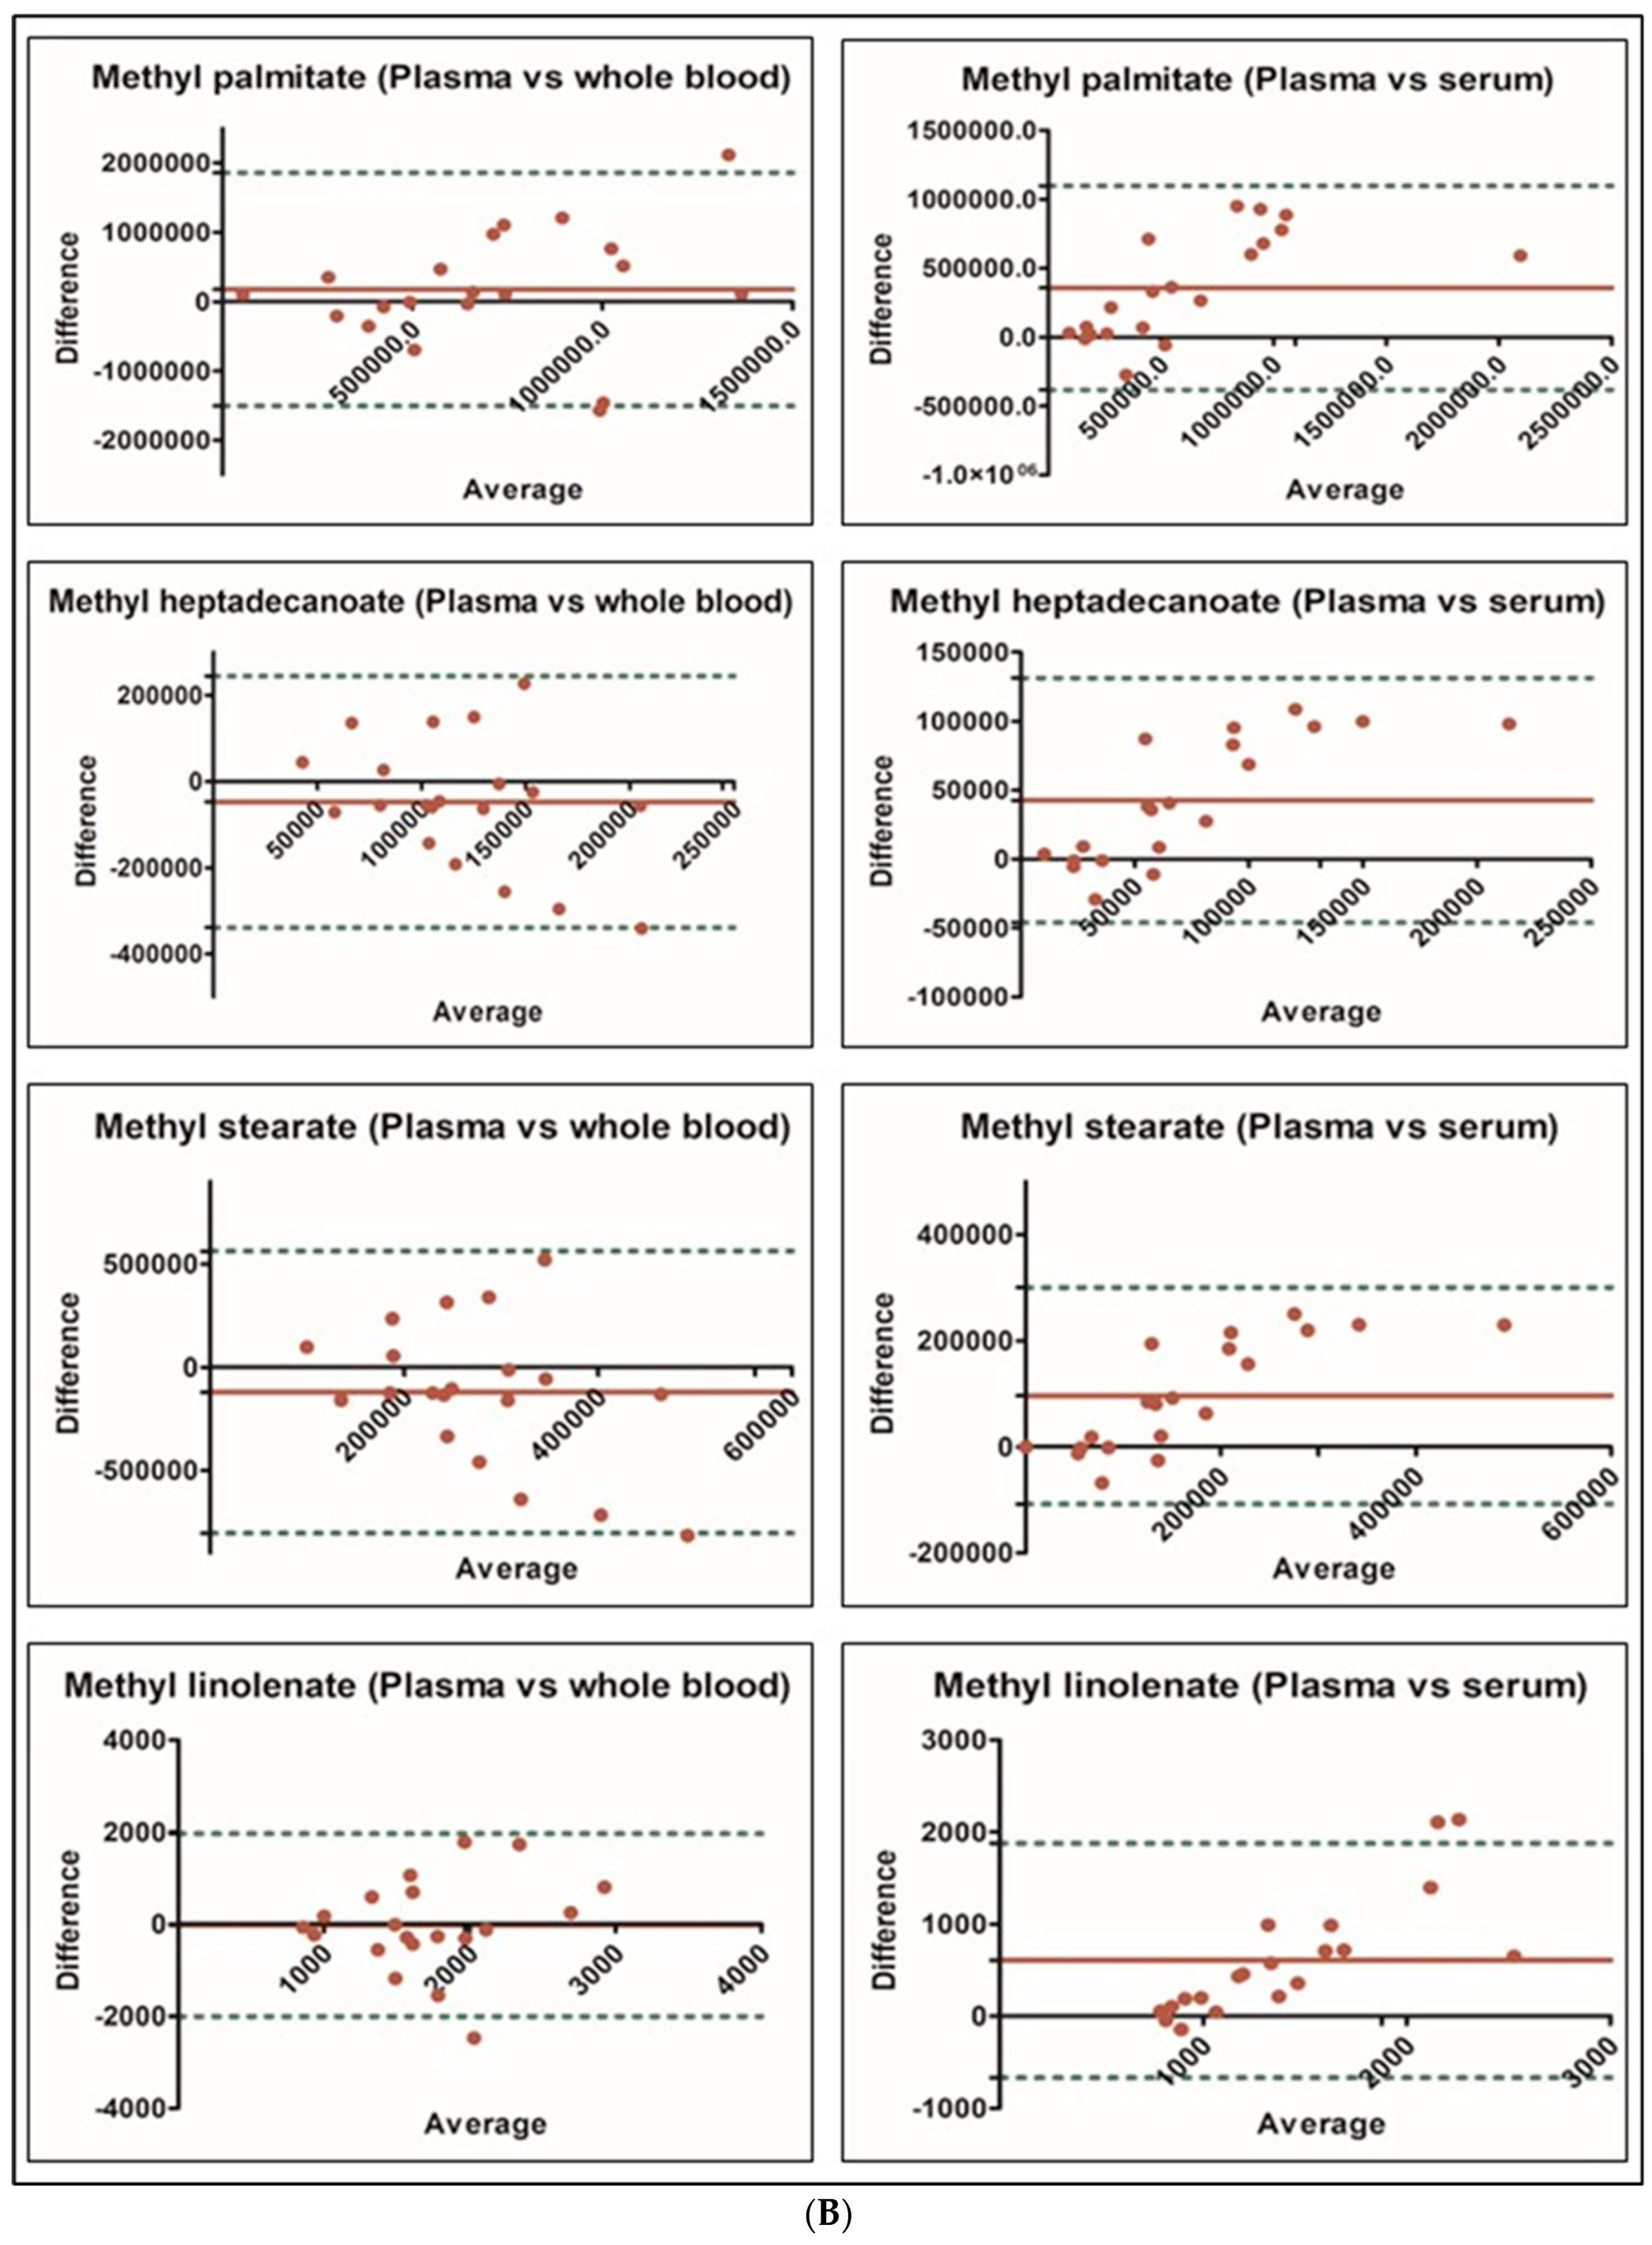
| Analyte | Serum (ng/mL) (Mean ± SD) n = 20 | Plasma (ng/mL) (Mean ± SD) n = 20 | p Value * | Whole Blood (ng/mL) (Mean ± SD) n = 20 | p Value * |
|---|---|---|---|---|---|
| Methyl undecanoate | 1133 ± 338 | 976 ± 197 | 0.009 | 1174 ± 327 | 0.581 |
| Methyl dodecanoate | 20,816 ± 34,185 | 41,783 ± 51,524 | 0.001 | 13,877 ± 9803 | 0.019 |
| Methyl myristate | 43,959 ± 60,502 | 80,079 ± 94,666 | 0.001 | 39,522 ± 29,581 | 0.769 |
| Methyl pentadecanoate | 3873 ± 2798 | 6668 ± 5289 | <0.001 | 4769 ± 334 | 0.413 |
| Methyl palmitate | 440,097 ± 372,885 | 798,127 ± 611,299 | <0.001 | 620,542 ± 488,730 | 0.366 |
| Methyl heptadecanoate | 52,902 ± 35,047 | 95,470 ± 69,660 | <0.001 | 142,662 ± 100,234 | 0.004 |
| Methyl stearate | 120,966 ± 79,896 | 217,303 ± 160,222 | <0.001 | 338,242 ± 235,317 | 0.003 |
| Methyl linolenate | 1104 ± 325 | 1709 ± 805 | <0.001 | 1734 ± 666 | 0.002 |
| Methyl docosahexaenoate | 11,952 ± 5712 | 10,236 ± 2353 | 0.145 | 9966 ± 9579 | 0.903 |
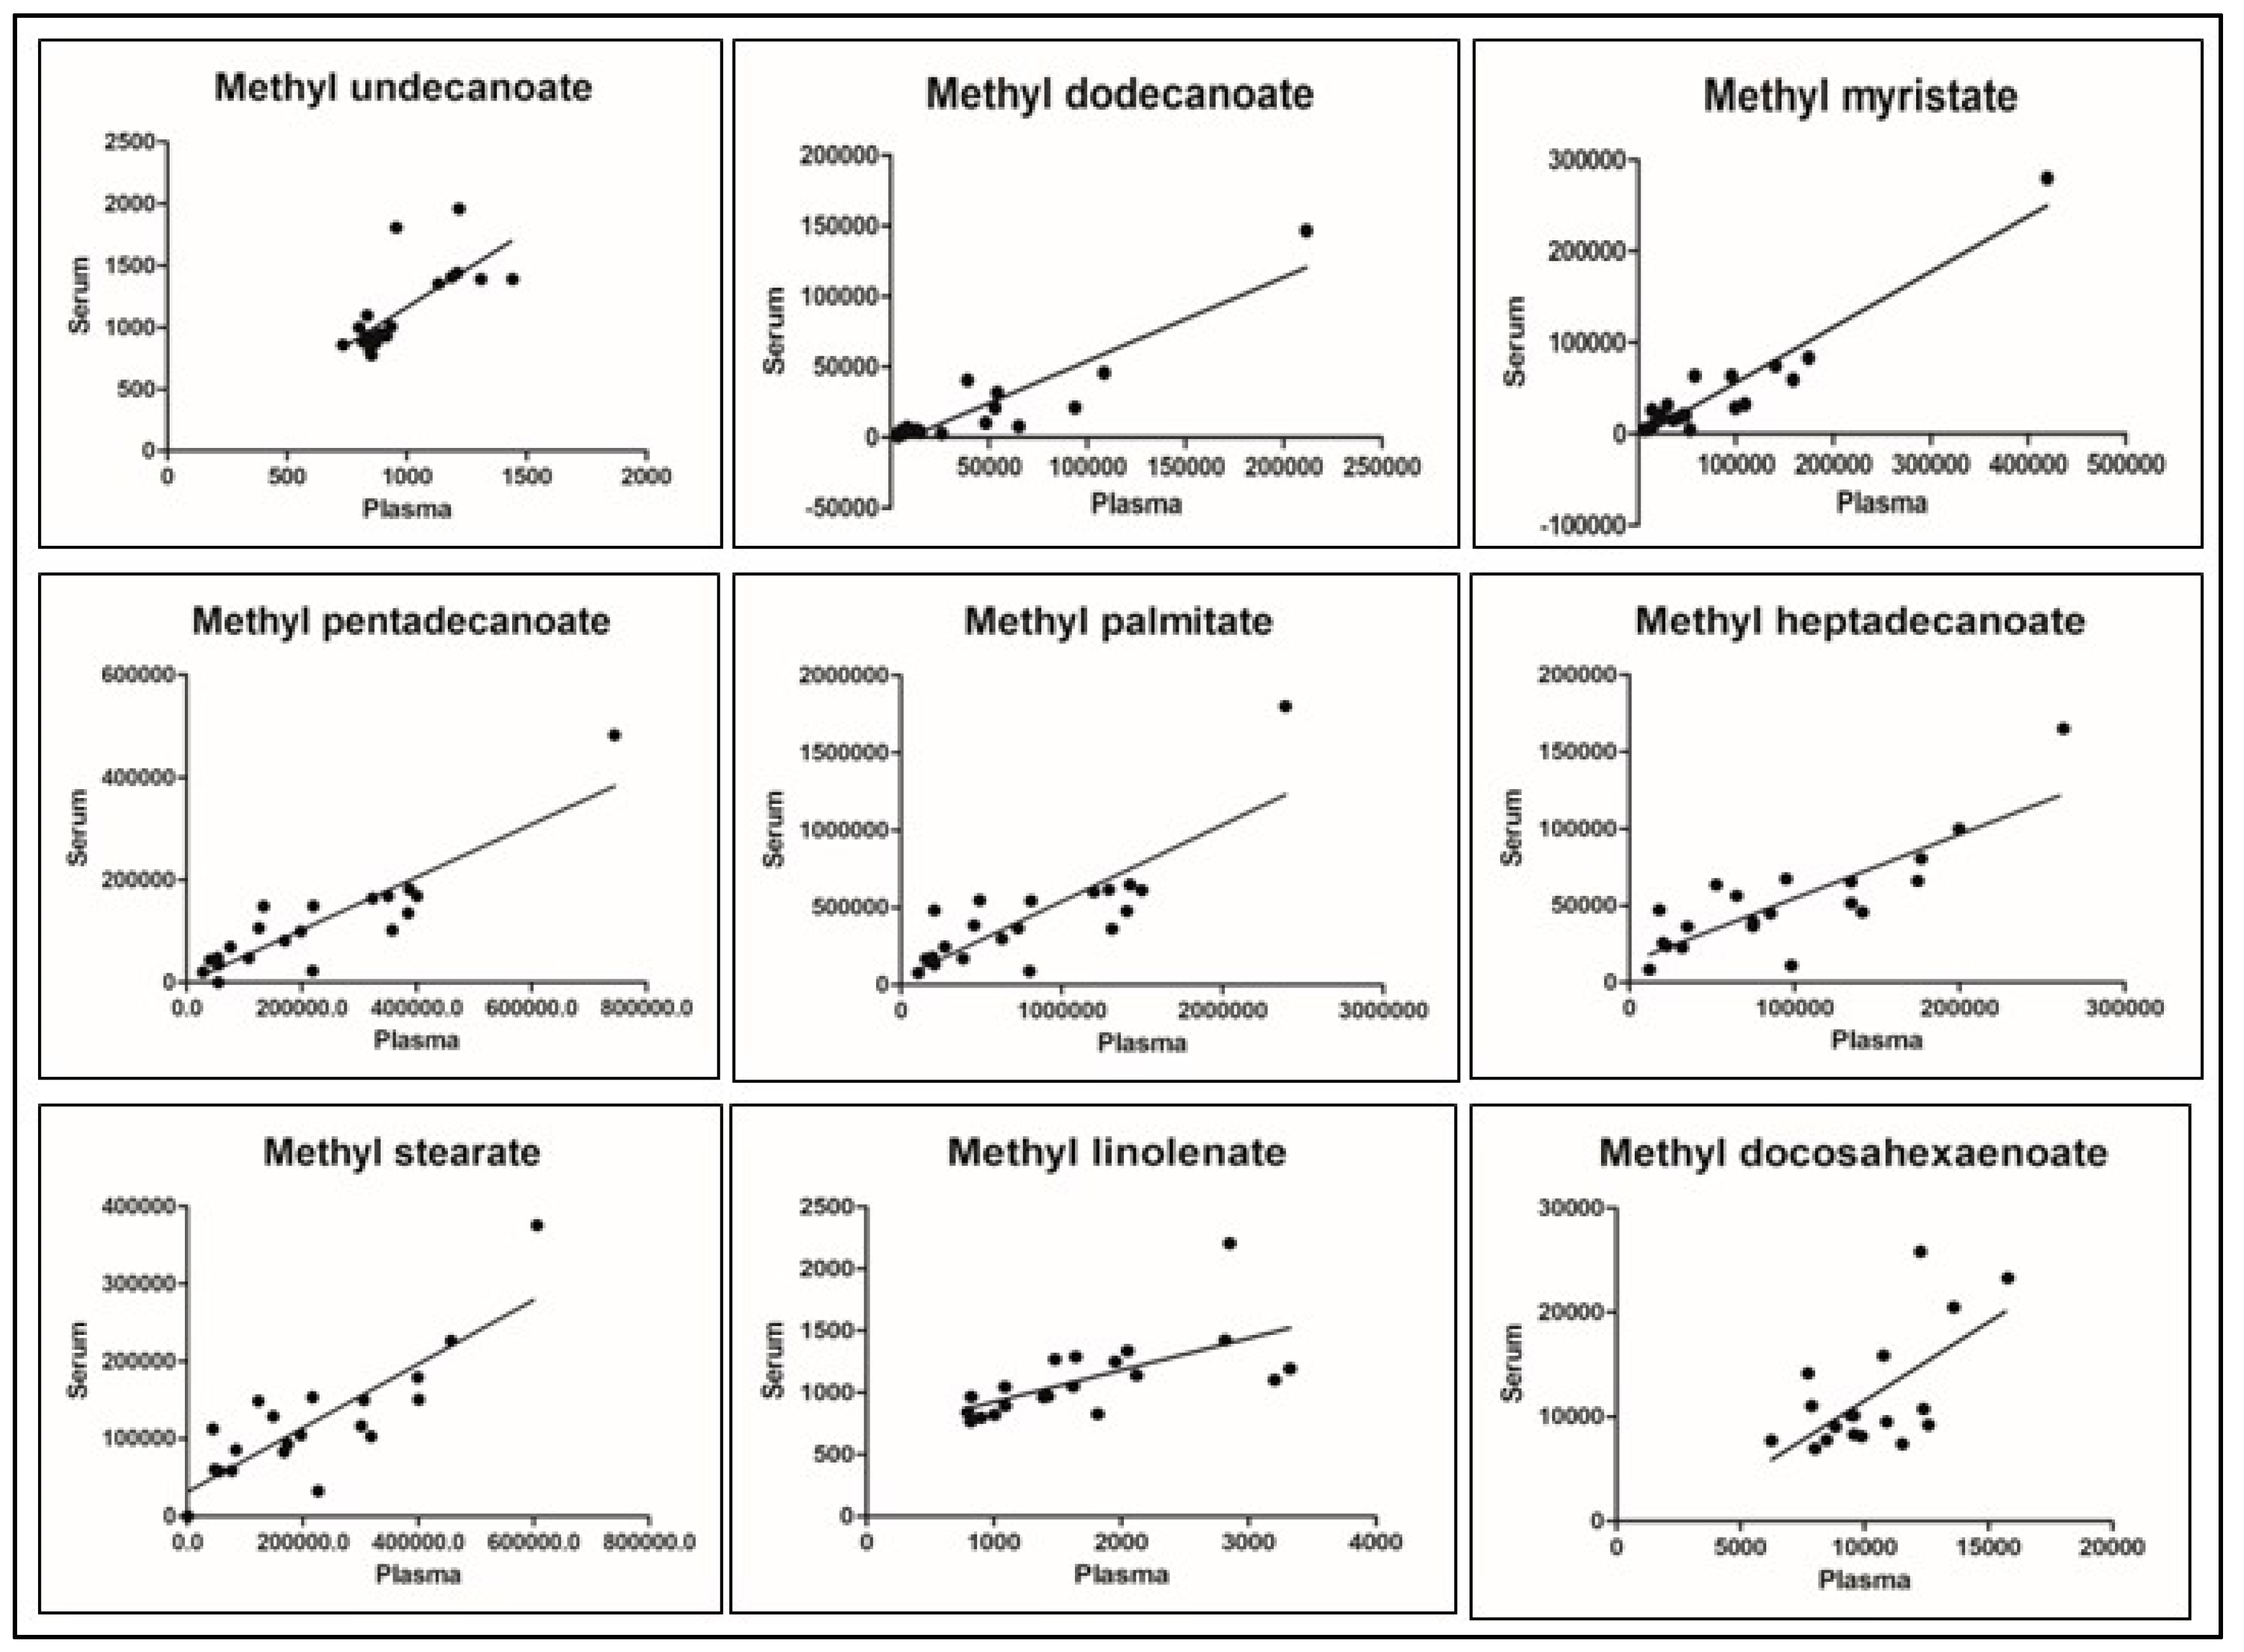
| Analyte | Serum & Plasma | Plasma & Whole Blood | Serum & Whole Blood | |||
|---|---|---|---|---|---|---|
| r Value | p Value * | r Value | p Value * | r Value | p Value * | |
| Methyl undecanoate | 0.717 | <0.001 | 0.711 | <0.001 | 0.516 | 0.020 |
| Methyl dodecanoate | 0.910 | <0.001 | 0.337 | 0.158 | 0.224 | 0.388 |
| Methyl myristate | 0.950 | <0.001 | 0.030 | 0.901 | 0.024 | 0.92 |
| Methyl pentadecanoate | 0.914 | <0.001 | −0.168 | 0.478 | −0.147 | 0.549 |
| Methyl palmitate | 0.813 | <0.001 | −0.207 | 0.381 | −0.135 | 0.569 |
| Methyl heptadecanoate | 0.826 | <0.001 | −0.519 | 0.019 | −0.469 | 0.037 |
| Methyl stearate | 0.830 | <0.001 | −0.536 | 0.015 | −0.479 | 0.033 |
| Methyl linolenate | 0.638 | 0.002 | 0.059 | 0.806 | −0.193 | 0.414 |
| Methyl docosahexaenoate | 0.634 | 0.005 | 0.135 | 0.583 | 0.276 | 0.268 |
| Analyte | Serum as Predictor of Plasma (Y = a + bx) | p Value * | Whole Blood as Predictor of Plasma (Y = a + bx) | p Value * |
|---|---|---|---|---|
| Methyl undecanoate | 501.01 + 0.419 (Serum conc) | 0.0003 | 472.63 + 0.428 (Whole blood conc) | 0.0004 |
| Methyl dodecanoate | 14,580.37 + 1.39 (Serum conc) | <0.0001 | 19,127.34 + 1.71 (Whole blood conc) | 0.15 |
| Methyl myristate | 14,748.35 + 1.48 (Serum conc) | <0.0001 | 76,320.13 + 0.095 (Whole blood conc) | 0.901 |
| Methyl pentadecanoate | 46,650.13 + 1.5363 (Serum conc) | <0.0001 | 270,415.40 − 0.3098 (Whole blood conc) | 0.405 |
| Methyl palmitate | 211,899.97 + 1.33 (Serum conc) | <0.0001 | 958,883.32 − 0.2591 (Whole blood conc) | 0.38 |
| Methyl heptadecanoate | 8577.06 + 1.64 (Serum conc) | <0.0001 | 146,948.56 − 0.3608 (Whole blood conc) | 0.018 |
| Methyl stearate | 16,045.88 + 1.6637 (Serum conc) | <0.001 | 340,736.99 − 0.3649 (Whole blood conc) | 0.015 |
| Methyl linolenate | −40.3462 + 1.58 (Serum conc) | 0.002 | 1586.054 + 0.07 (Whole blood conc) | 0.806 |
| Methyl docosahexaenoate | 7116.83 + 0.26 (Serum conc) | 0.004 | 9906.94 + 0.03 (Whole blood conc) | 0.58 |
Disclaimer/Publisher’s Note: The statements, opinions and data contained in all publications are solely those of the individual author(s) and contributor(s) and not of MDPI and/or the editor(s). MDPI and/or the editor(s) disclaim responsibility for any injury to people or property resulting from any ideas, methods, instructions or products referred to in the content. |
© 2025 by the authors. Licensee MDPI, Basel, Switzerland. This article is an open access article distributed under the terms and conditions of the Creative Commons Attribution (CC BY) license (https://creativecommons.org/licenses/by/4.0/).
Share and Cite
Mallimoggala, Y.; Biswas, M.; Lewis, L.E.S.; Belle, V.S.; Asok, A.; Bolar Suryakanth, V. Assessment of Fatty Acid Concentrations Among Blood Matrices. Metabolites 2025, 15, 482. https://doi.org/10.3390/metabo15070482
Mallimoggala Y, Biswas M, Lewis LES, Belle VS, Asok A, Bolar Suryakanth V. Assessment of Fatty Acid Concentrations Among Blood Matrices. Metabolites. 2025; 15(7):482. https://doi.org/10.3390/metabo15070482
Chicago/Turabian StyleMallimoggala, Ysphaneendra, Monalisa Biswas, Leslie Edward S. Lewis, Vijetha Shenoy Belle, Arjun Asok, and Varashree Bolar Suryakanth. 2025. "Assessment of Fatty Acid Concentrations Among Blood Matrices" Metabolites 15, no. 7: 482. https://doi.org/10.3390/metabo15070482
APA StyleMallimoggala, Y., Biswas, M., Lewis, L. E. S., Belle, V. S., Asok, A., & Bolar Suryakanth, V. (2025). Assessment of Fatty Acid Concentrations Among Blood Matrices. Metabolites, 15(7), 482. https://doi.org/10.3390/metabo15070482