Article

EM Dipeptide Enhances Milk Protein Secretion: Evidence from Integrated Metabolomic and Transcriptomic Analysis

by
Yuqing Liu
1,†,
Yuhao Yan
1,†,
Runjun Yang
2,
Xiaohui Li
3,
Chuang Zhai
1,
Xuan Wu
1,
Xibi Fang
2,* and
Boqun Liu
1,*
1
College of Food Science and Engineering, Jilin University, Changchun 130062, China
2
College of Animal Science, Jilin University, Changchun 130062, China
3
Center of Animal Experiment, College of Basic Medical Sciences, Jilin University, Changchun 130021, China
*
Authors to whom correspondence should be addressed.
These authors contributed equally to this work.
Metabolites 2025, 15(7), 476; https://doi.org/10.3390/metabo15070476
Submission received: 6 June 2025 / Revised: 29 June 2025 / Accepted: 8 July 2025 / Published: 14 July 2025
(This article belongs to the Section Nutrition and Metabolism)

Abstract

Background/Objectives: Breast milk provides essential nutrition and immune protection to support infant growth and development. However, insufficient breast milk remains a serious issue, and bioactive peptides represent a potential strategy to promote lactation. In this study, we investigated the impact of a methionine-containing dipeptide, EM, on MCF-10A mammary epithelial cells. Methods: MCF-10A cells were treated with EM, and cell proliferation and the expression of key milk protein genes were assessed. Integrated transcriptomic and untargeted metabolomic analyses were performed to identify EM-induced changes in metabolic and gene expression pathways. Results: EM treatment significantly enhanced cell proliferation and upregulated the expression of key milk protein genes (CSN1S1 (casein alpha-S1, encoding alpha-S1 casein), CSN2 (casein beta, encoding beta-casein), and CSN3 (casein kappa, encoding kappa-casein)) at both transcriptional and protein levels compared to controls. Integrated transcriptomic and metabolomic analyses revealed that EM reprogrammed amino acid metabolism, lipid biosynthesis, and nutrient transport pathways. Core genes such as SLC7A11, APOE, and ABCA1 were identified as critical nodes linking metabolic and transcriptional networks. Conclusions: These findings indicate that EM may promote lactogenic activity by modulating metabolic and transcriptional networks in vitro, highlighting the potential of dipeptide-based nutritional interventions, which warrants further in vivo validation.

1. Introduction

Breast milk is the optimal source of nutrition and immune protection for newborns, providing essential macronutrients, bioactive molecules, and immunoglobulins, critical for infant growth and development [1,2,3]. The protein content of breast milk, particularly caseins and whey proteins, plays a pivotal role in supporting neonatal health, influencing gastrointestinal development, immune system maturation, and neurodevelopment [4,5]. Milk protein synthesis is tightly regulated by the uptake and metabolism of amino acids in mammary epithelial cells (MECs), which in turn activate key intracellular signaling pathways, notably the mammalian target of rapamycin (mTOR) and signal transducer and activator of transcription 5 (STAT5) pathways [6,7,8,9,10]. These pathways orchestrate the transcription of milk protein genes and the translation of caseins and whey proteins in response to nutrient and hormonal cues [11,12]. Although the exact prevalence is uncertain, challenges related to insufficient lactation are frequently reported in both clinical and community settings, particularly during early postpartum [13].
Recent studies in ruminant species have demonstrated that small bioactive peptides can enhance lactation performance by stimulating these key pathways [7,14,15]. Specifically, methionine-containing dipeptides, such as Met-Lys, Met-Phe, and Met-Trp, have been shown to promote casein synthesis in bovine mammary epithelial cells by activating nutrient-sensing and anabolic signaling cascades [7,16,17]. These findings suggest that methionine-rich dipeptides may serve as promising functional ingredients for improving milk production.
However, despite compelling evidence from livestock models, the effects of methionine-containing dipeptides on human mammary epithelial cells (MCF-10A) remain poorly understood [18,19]. Whether similar mechanisms of enhanced amino acid transport, metabolic reprogramming, and milk protein synthesis occur in human cells has not been systematically investigated [20]. Given the differences between ruminant and human lactation physiology, direct evaluation in human cell models is necessary to assess the potential applicability of dipeptide supplementation strategies [21,22].
In this context, we selected a methionine-containing dipeptide, EM, characterized by high transport efficiency via the peptide transporter 1 (PepT1) peptide transporter, to explore its lactogenic effects in MCF-10A [23,24]. We hypothesized that EM could enhance cell proliferation and stimulate milk protein synthesis by reprogramming transcriptional and metabolic pathways [25]. To test this hypothesis, we conducted an integrated omics study combining transcriptomic and untargeted metabolomic analyses to elucidate the molecular mechanisms underlying EM-induced lactogenic activity. The findings aim to provide new insights into the functional roles of dipeptides in human lactation and offer a basis for developing novel nutritional interventions for maternal and infant health.

2. Materials and Methods

2.1. Cell Culture and Treatment

The MCF-10A normal human mammary epithelial cell line (non-tumorigenic) was purchased from the Cell Resource Center, IBMS, CAMS/PUMC (Beijing, China). The MCF-10A cells were cultured in Dulbecco’s Modified Eagle Medium/Nutrient Mixture F-12 (DMEM/F-12; Corning, Corning, NY, USA) supplemented with 10 μg/mL insulin (Solarbio, Beijing, China), 0.5 μg/mL hydrocortisone (Solarbio, Beijing, China), 20 ng/mL epidermal growth factor (EGF; Peprotech, Rocky Hill, NJ, USA), 100 ng/mL cholera toxin (Absin, Shanghai, China), and 10% fetal bovine serum (FBS; Tianhang Biotechnology, Huzhou, Zhejiang, China) under the condition of 37 °C and 5% CO2. The MCF-10A cells were subcultured using 0.05% trypsin (Thermo Fisher Scientific, Waltham, MA, USA) upon reaching 80–90% confluence. To detect the effect of methionine on the MCF-10A cells, they were cultured in six-well plates (Biofil, Guangzhou, Guangdong, China). When the cells converged to 70%, the culture medium was replaced with serum-free DMEM/F-12 for 12 h to synchronize the cell cycle and simulate a nutrient-deprived environment [26]. To simulate lactation conditions, cells were treated with human prolactin (hPRL, Y-S Biotechnology, Shanghai, China) and various concentrations of EM (0, 50, 100, and 150 μg/mL) for 24 h to induce milk protein expression [27].

2.2. Cell Viability

To evaluate the effect of EM concentration on MCF-10A cell viability, cells were cultured in 96-well plates (Biofil, Guangzhou, Guangdong, China) and cultured until approximately 70% confluence. Serum starvation was then performed for 12 h to synchronize cell growth. Cells were subsequently treated with EM at concentrations of 0, 50, 100, and 150 μg/mL, together with prolactin (1 μg/mL) to simulate lactogenic conditions. Each treatment was performed in sextuplicate (n = 6). At 24 and 48 h post-treatment, the culture medium was removed, and cells were washed once with Phosphate-buffered saline (PBS; Thermo Fisher Scientific, Waltham, MA, USA). A total of 100 μL of Cell Counting Kit-8 (CCK-8) working solution (1:9 dilution of CCK-8 reagent (Beyotime, Shanghai, China) in complete medium) was added to each well. After 30 min of incubation at 37 °C, absorbance was measured at 450 nm using a microplate reader (YongChuang SM600, Shanghai, China) [26]. Cell viability was calculated based on absorbance values.

2.3. 5-Ethynyl-2′-Deoxyuridine (EdU) Incorporation Assay for Cell Proliferation

To evaluate the effect of EM dipeptide methionine concentration on MCF-10A cell proliferation, an EdU incorporation assay was conducted using a commercial kit (Beyotime, Shanghai, China). Cells were cultured in 24-well plates (Biofil, Guangzhou, Guangdong, China) and treated accordingly. After EdU labeling and nuclear counterstaining with Hoechst, fluorescence images were acquired under an inverted fluorescence microscope (Nikon TE2000, Tokyo, Japan) using identical exposure settings (exposure time: 500 ms; gain: 1.0) to ensure consistency across samples [28]. Fluorescence images were analyzed using ImageJ software (version 1.53c, NIH, Bethesda, MD, USA). Raw image files were first converted to 8-bit grayscale, and background was subtracted using the “Rolling Ball” algorithm (radius = 50 pixels). Regions of interest (ROIs) corresponding to individual cells or specific staining areas were selected either manually or automatically. Mean fluorescence intensity (MFI) was measured for each ROI using the “Measure” function.
For cell counting, Hoechst-stained nuclei were identified using automatic thresholding and counted with the “Analyze Particles” function (size: 50–1000 pixels2, circularity: 0.5–1.0). EdU-positive cells were similarly identified in the red fluorescence channel, and the percentage of EdU-positive cells was calculated by dividing the number of EdU-positive cells by the total number of nuclei.

2.4. RNA Extraction and Quantitative Real-Time PCR (qRT-PCR)

Total RNA was extracted from MCF-10A cells using a commercial kit (FastPure Cell/Tissue Total RNA Isolation Kit; Vazyme, Nanjing, Jiangsu, China), and RNA concentration was determined using a NanoDrop 2000 spectrophotometer (Thermo Fisher Scientific, Waltham, MA, USA). cDNA was synthesized from 1 μg of total RNA using a reverse transcription kit (Tiangen Biotech, Beijing, China). Quantitative real-time PCR (qRT-PCR) was performed using gene-specific primers designed with Primer Premier 6.0 (Premier Biosoft, Palo Alto, CA, USA) and SYBR Green Master Mix (ABclonal, Wuhan, Hubei, China) on a standard qRT-PCR platform. The cycling conditions were as follows: initial denaturation at 95 °C for 3 min, followed by 40 cycles of 95 °C for 5 s and 60 °C for 30 s. Relative gene expression levels were calculated using the 2−ΔΔCt method [29]. The internal reference gene is β-actin (primer sequences shown in Table 1).

2.5. Immunofluorescence Assay

MCF-10A cells at appropriate density were seeded into glass-bottom culture dishes (Nest, Wuxi, Jiangsu, China). After treatment with EM, when cell density reached approximately 50%, cells were fixed with 4% paraformaldehyde (Biosharp, Hefei, Anhui, China) for 22 min, followed by permeabilization with 0.1% Triton X-100 (Bio Basic, Toronto, ON, Canada) for 5–10 min [30]. Cells were then blocked with 5% bovine serum albumin (BSA; Sigma-Aldrich, Darmstadt, Germany) for 30 min at 4 °C. The cells were incubated overnight at 4 °C with anti-beta-casein (CSN2) primary antibody (Proteintech, Wuhan, Hubei, China). After washing three times with PBST (PBS containing 0.1% Tween-20), cells were incubated with fluorescein isothiocyanate (FITC)-conjugated secondary antibody (Proteintech, Wuhan, Hubei, China) at 37 °C for 2 h in the dark. Nuclei were counterstained with Hoechst (Beyotime, Shanghai, China) for 10 min. Fluorescence signals were visualized using an inverted fluorescence microscope (Nikon TE2000, Tokyo, Japan).

2.6. RNA-Seq and Transcriptomic Data Analysis

MCF-10A cells were treated with 100 μg/mL of EM, and total RNA was extracted using TRIzol reagent (Invitrogen, Carlsbad, CA, USA) according to the manufacturer’s protocol [31]. Transcriptome sequencing and bioinformatic analysis were performed by Kaitai Biotechnology Co., Ltd. (Hangzhou, Zhejiang, China). Each group included three biological replicates (n = 6 in total). RNA libraries were prepared using the Illumina TruSeq RNA Sample Preparation Kit and sequenced on the Illumina platform. Raw sequencing reads underwent quality control and adapter trimming. Sequencing metrics, including raw and clean read counts, Q20, and Q30 values, are listed in Table 2. Clean reads were aligned to the human reference genome (GRCh38) using HISAT2 (v2.2.1; Daehwan Kim Lab, Baltimore, MD, USA), and alignment statistics are provided in Table 3. Gene expression levels were quantified using HTSeq (v2.0.1; European Molecular Biology Laboratory, Heidelberg, Baden-Württemberg, Germany), and differential expression analysis was performed using the edgeR package (v3.42.4; Walter and Eliza Hall Institute of Medical Research, Melbourne, Victoria, Australia). Genes with an adjusted p-value (false discovery rate, FDR) < 0.05, calculated using the Benjamini–Hochberg procedure, were considered significantly differentially expressed. Functional enrichment analysis of Differentially expressed genes (DEGs) was carried out using the clusterProfiler R package (v4.2.1), based on the Gene Ontology (GO) (http://geneontology.org/, accessed on 7 July 2025) and Kyoto Encyclopedia of Genes and Genomes (KEGG) databases (https://www.genome.jp/kegg/, accessed on 7 July 2025), with a p-value cutoff of 0.05.

2.7. Untargeted Metabolomics Analysis

MCF-10A cells were treated with 100 μg/mL of EM, as described in Section 2.1. Untargeted metabolomic profiling was performed by Kaitai Biotechnology Co., Ltd. (Hangzhou, Zhejiang, China), with three biological replicates per group (n = 3 per group, 6 in total). Raw Liquid Chromatography-Tandem Mass Spectrometry (LC-MS/MS) data were preprocessed for statistical analysis. Principal Component Analysis (PCA) and Partial Least Squares-Discriminant Analysis (PLS-DA) were performed to assess metabolic variation, and differential metabolites were identified using t-tests or ANOVA (p < 0.05). Identified metabolites were annotated and analyzed using KEGG and MetaboAnalyst for pathway and network enrichment [32].

2.8. Multi-Omics Integration of Transcriptome and Metabolome

To elucidate the coordinated molecular mechanisms underlying the lactogenic effect of EM, transcriptomic and metabolomic datasets were integrated through a pathway- and correlation-based strategy. DEGs and significantly altered metabolites identified from transcriptome and untargeted metabolomics analyses, respectively, were first annotated using KEGG identifiers. Shared molecules were identified by mapping differentially expressed genes and altered metabolites to common KEGG pathways using compound–gene co-annotation in MetaboAnalyst 5.0. These matched features were used to identify shared or functionally related pathways. Joint enrichment analysis was performed using MetaboAnalyst 5.0, incorporating both transcript and metabolite data to visualize coordinated biological processes. Metabolites and DEGs involved in common pathways were subjected to correlation analysis using Pearson correlation coefficients, with |r| > 0.8 and p < 0.05 set as significance thresholds. Strongly correlated gene–metabolite pairs were used to construct interaction networks.
Network visualization and topology analysis were conducted using Cytoscape 3.9.1 [33]. Lactation-related pathways, including those involved in amino acid transport and metabolism, lipid biosynthesis, and protein synthesis, were particularly highlighted to identify functional modules potentially regulated by EM.

2.9. Quantitative Real-Time PCR (qRT-PCR) Validation of Selected DEGs

To validate the transcriptomic findings, we selected 50 DEGs associated with 17 lactation-related KEGG pathways (as shown in Table 4) for qRT-PCR analysis. MCF-10A cells were seeded in 6-well plates and cultured until reaching approximately 70% confluence. Subsequently, cells were serum-starved for 12 h, consistent with the conditions described in Section 2.1. Following starvation, cells were treated with one of the following conditions in the presence of prolactin to induce lactogenic signaling: 100 μg/mL EM, 100 μg/mL EM-D (an isomeric form of EM), 33.4 μg/mL EMEMEM (a trimeric form of EM). A control group treated with prolactin alone was included to account for the effects of lactogenic stimulation. qRT-PCR analysis of the 50 selected DEGs was performed as described in Section 2.4, using β-actin as the reference gene. Gene-specific primers are listed in Table 1.

2.10. Statistical Analysis

All experiments were repeated at least three times independently, and the data are presented as mean ± standard error (SEM). Statistical analysis was performed using R language (v4.2.1), GraphPad Prism 9, and SPSS 26.0 software, and the significance threshold was set at p < 0.05.

3. Results

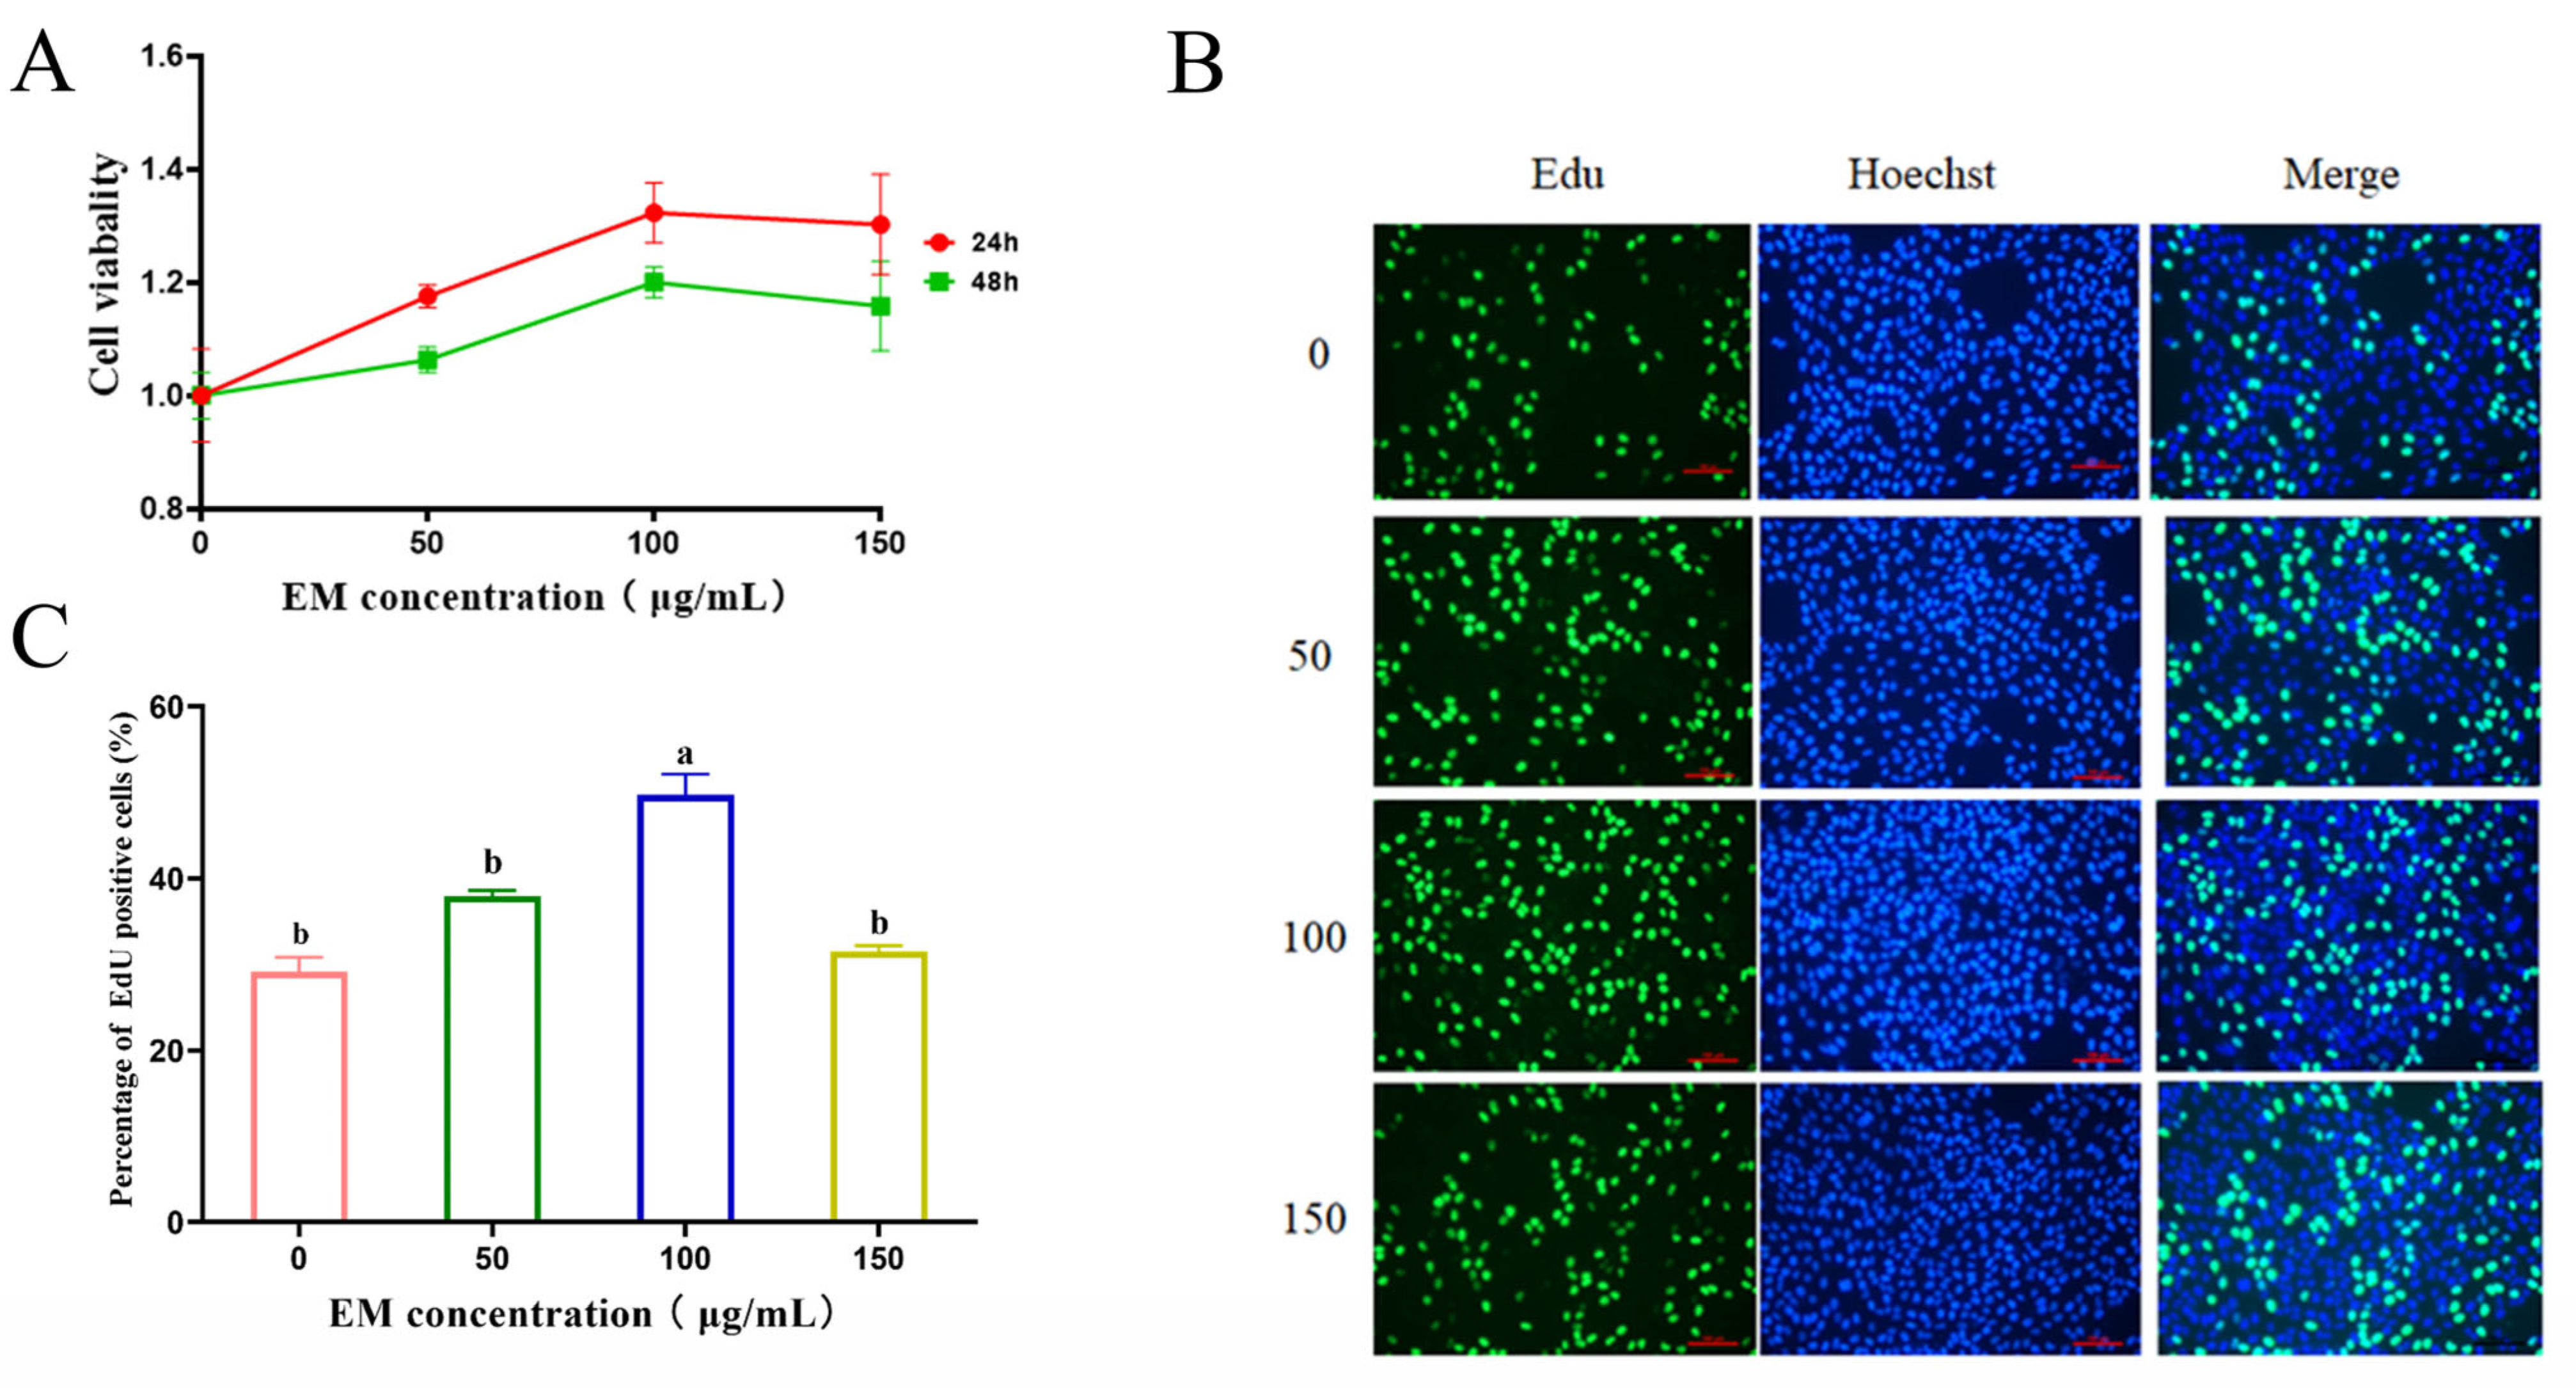
3.1. EM Promotes MCF-10A Cell Proliferation

To determine whether EM promotes the proliferation of mammary epithelial cells—a critical step for subsequent milk protein synthesis—CCK-8 and EdU assays were performed. Cells were serum-starved for 12 h prior to treatment, and viability was evaluated accordingly. EM treatment enhanced MCF-10A cell proliferation in a dose-dependent manner, with the effect observed at 100 μg/mL after both 24 and 48 h. At 150 μg/mL, cell viability showed a slight decrease, possibly indicating cytotoxicity at higher concentrations (Figure 1A). EdU staining further supported these findings, with a marked increase in DNA-synthesizing cells at 100 μg/mL (Figure 1B), as confirmed by quantification in Figure 1C (p < 0.05). These results suggest that EM promotes mammary epithelial cell proliferation, which may contribute to greater epithelial cell numbers, improved mammary gland structure and function, and ultimately, enhanced milk protein synthesis [28,34].

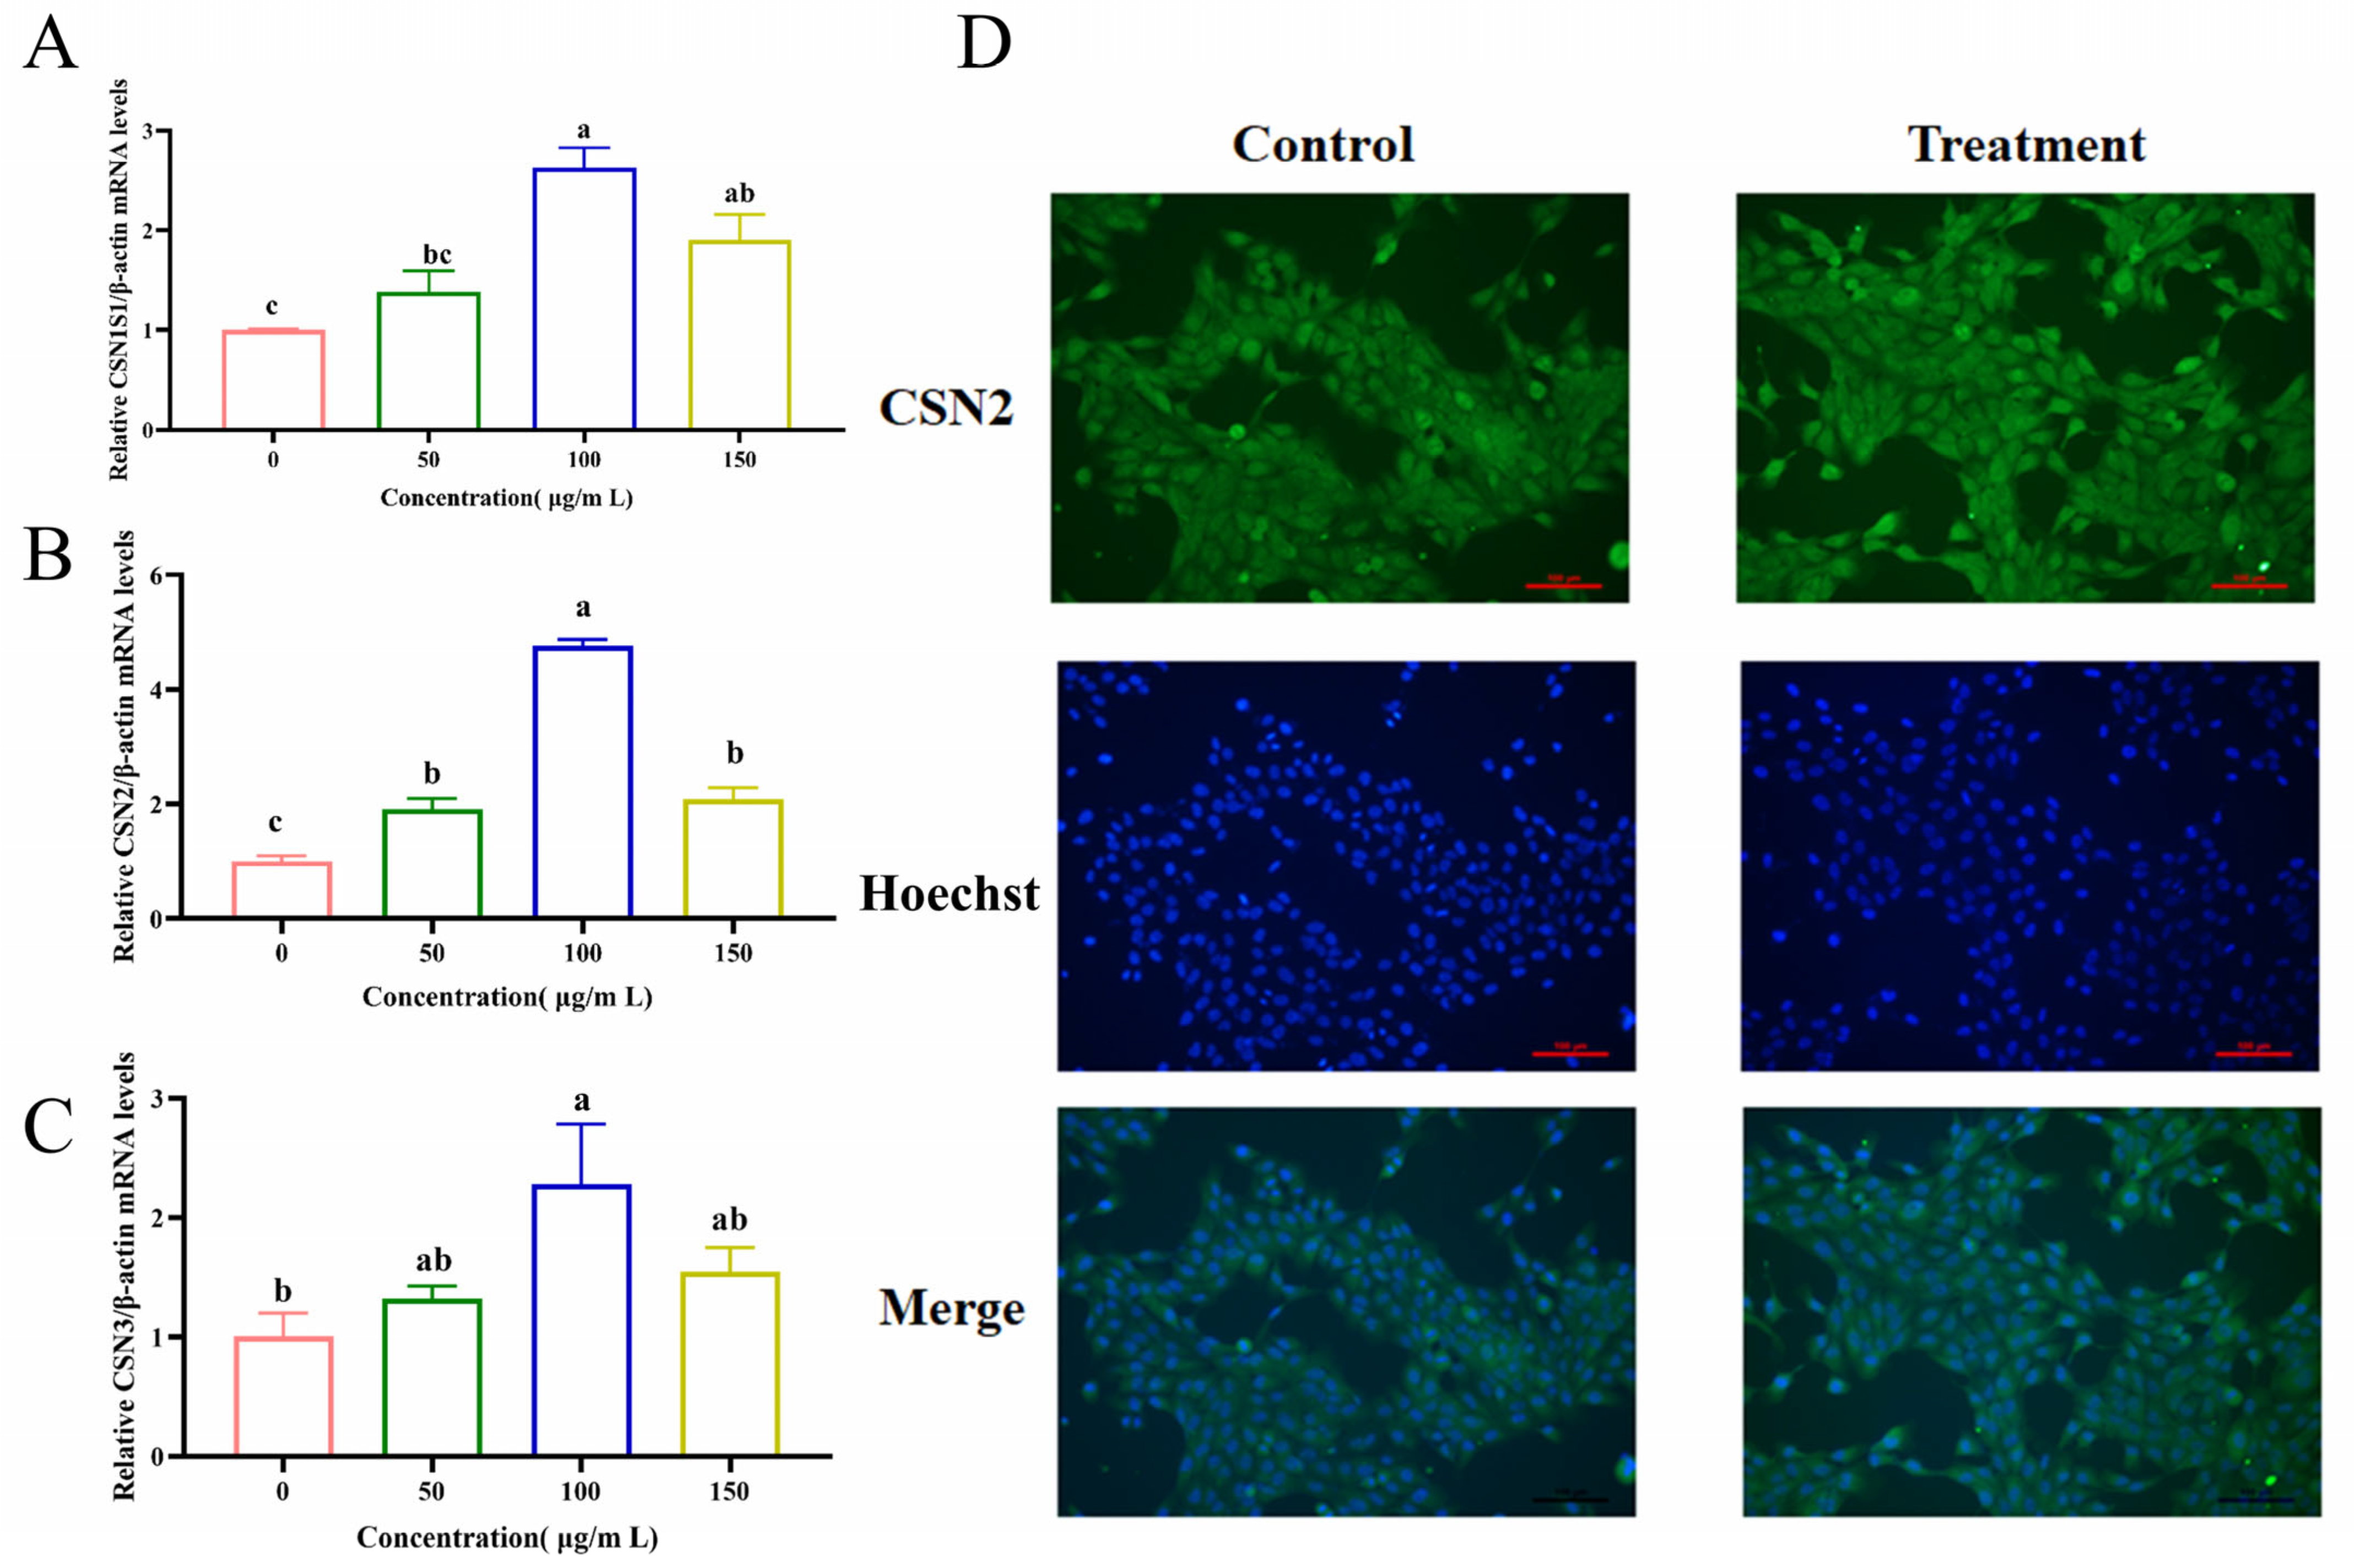
3.2. EM Enhances Milk Protein Synthesis at the Transcriptional and Protein Levels

To determine whether EM promotes lactation-related functional protein synthesis, we measured the mRNA expression of three major milk protein genes—CSN1S1, CSN2, and CSN3—using qRT- PCR. As shown in Figure 2A–C, EM treatment significantly upregulated the expression of all three genes in a dose-dependent manner. The highest induction of CSN1S1 (p < 0.05), CSN2 (p < 0.05), and CSN3 (p > 0.05) was observed at 100 μg/mL. A slight reduction at 150 μg/mL was observed, though expression remained significantly elevated compared to the untreated control (Figure 2A–C).
To validate these transcriptional changes at the protein level, we performed immunofluorescence staining for β-casein (CSN2). EM-treated cells exhibited visibly enhanced green fluorescence compared to controls, indicating increased β-casein expression (Figure 2D). Importantly, all imaging was performed under identical exposure settings, and cells were cultured to a controlled confluency (50%) prior to fixation to ensure consistent cell density across groups. Nuclei were counterstained with Hoechst to assess cell number, which confirmed comparable nuclear density between treatment and control groups. These findings confirm that the increase in β-casein signal reflects elevated per-cell protein expression, rather than a change in cell number. Thus, EM enhances milk protein synthesis at both the transcriptional and translational levels in MCF-10A cells.

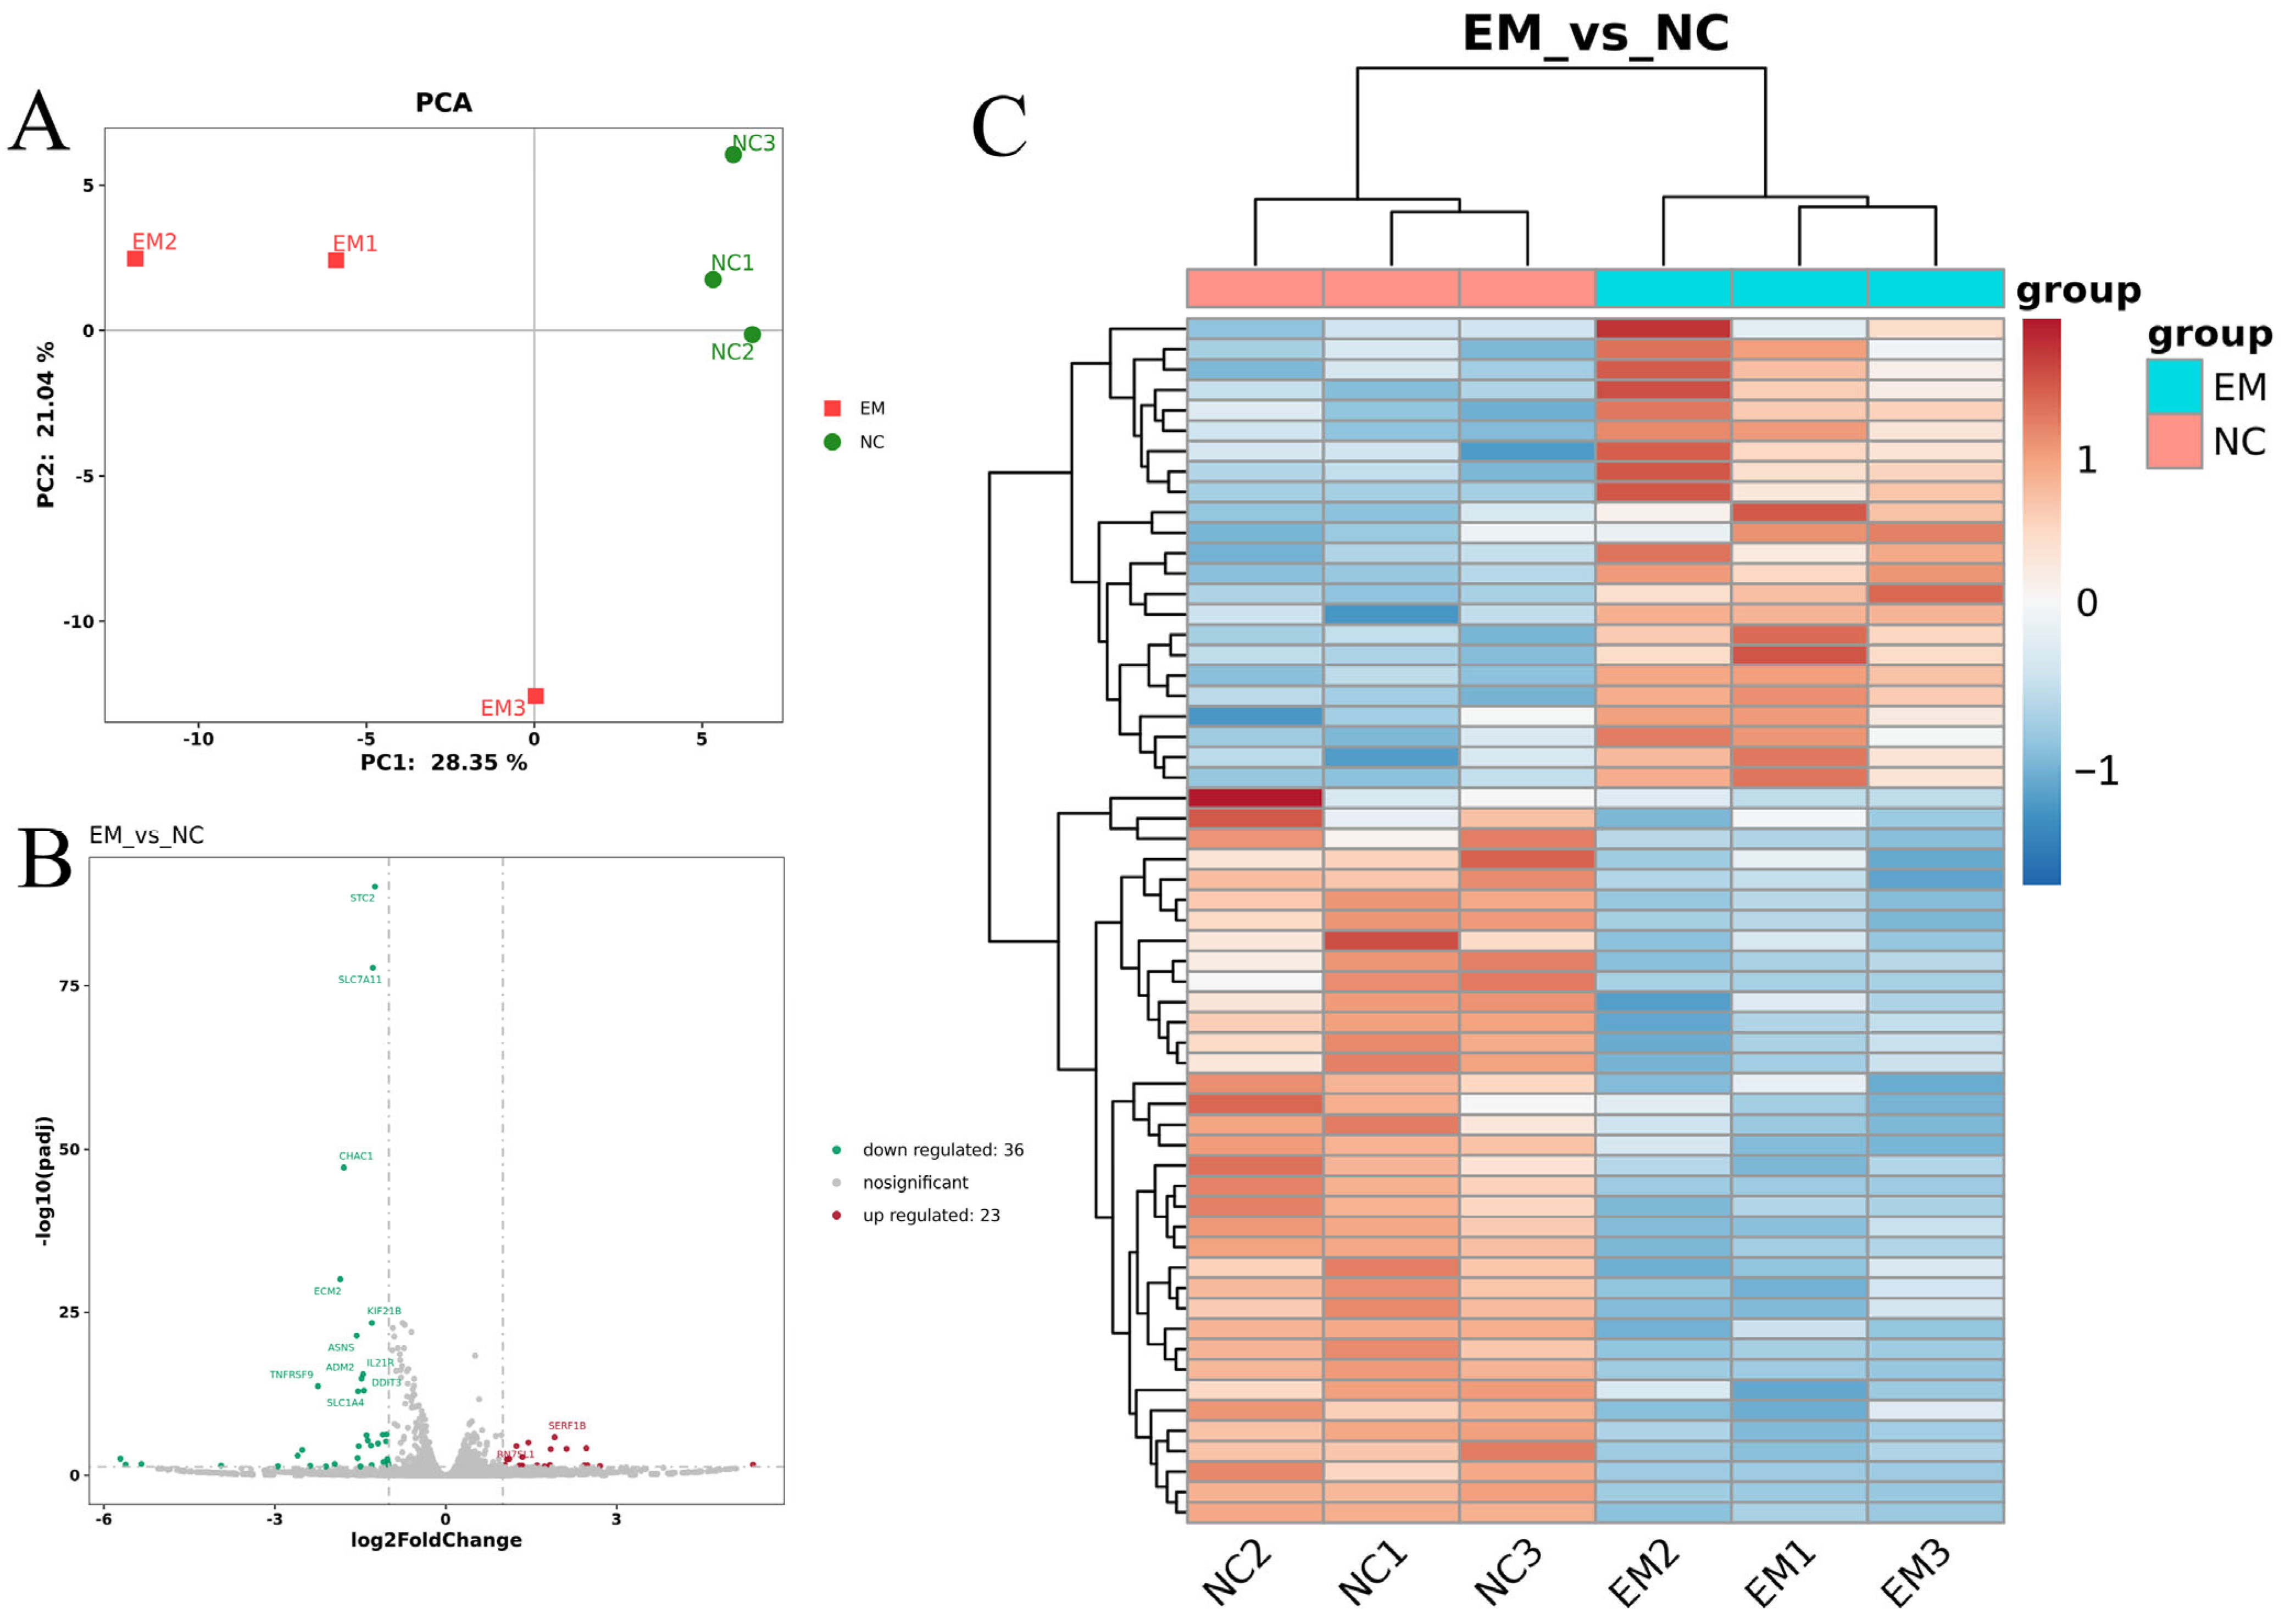
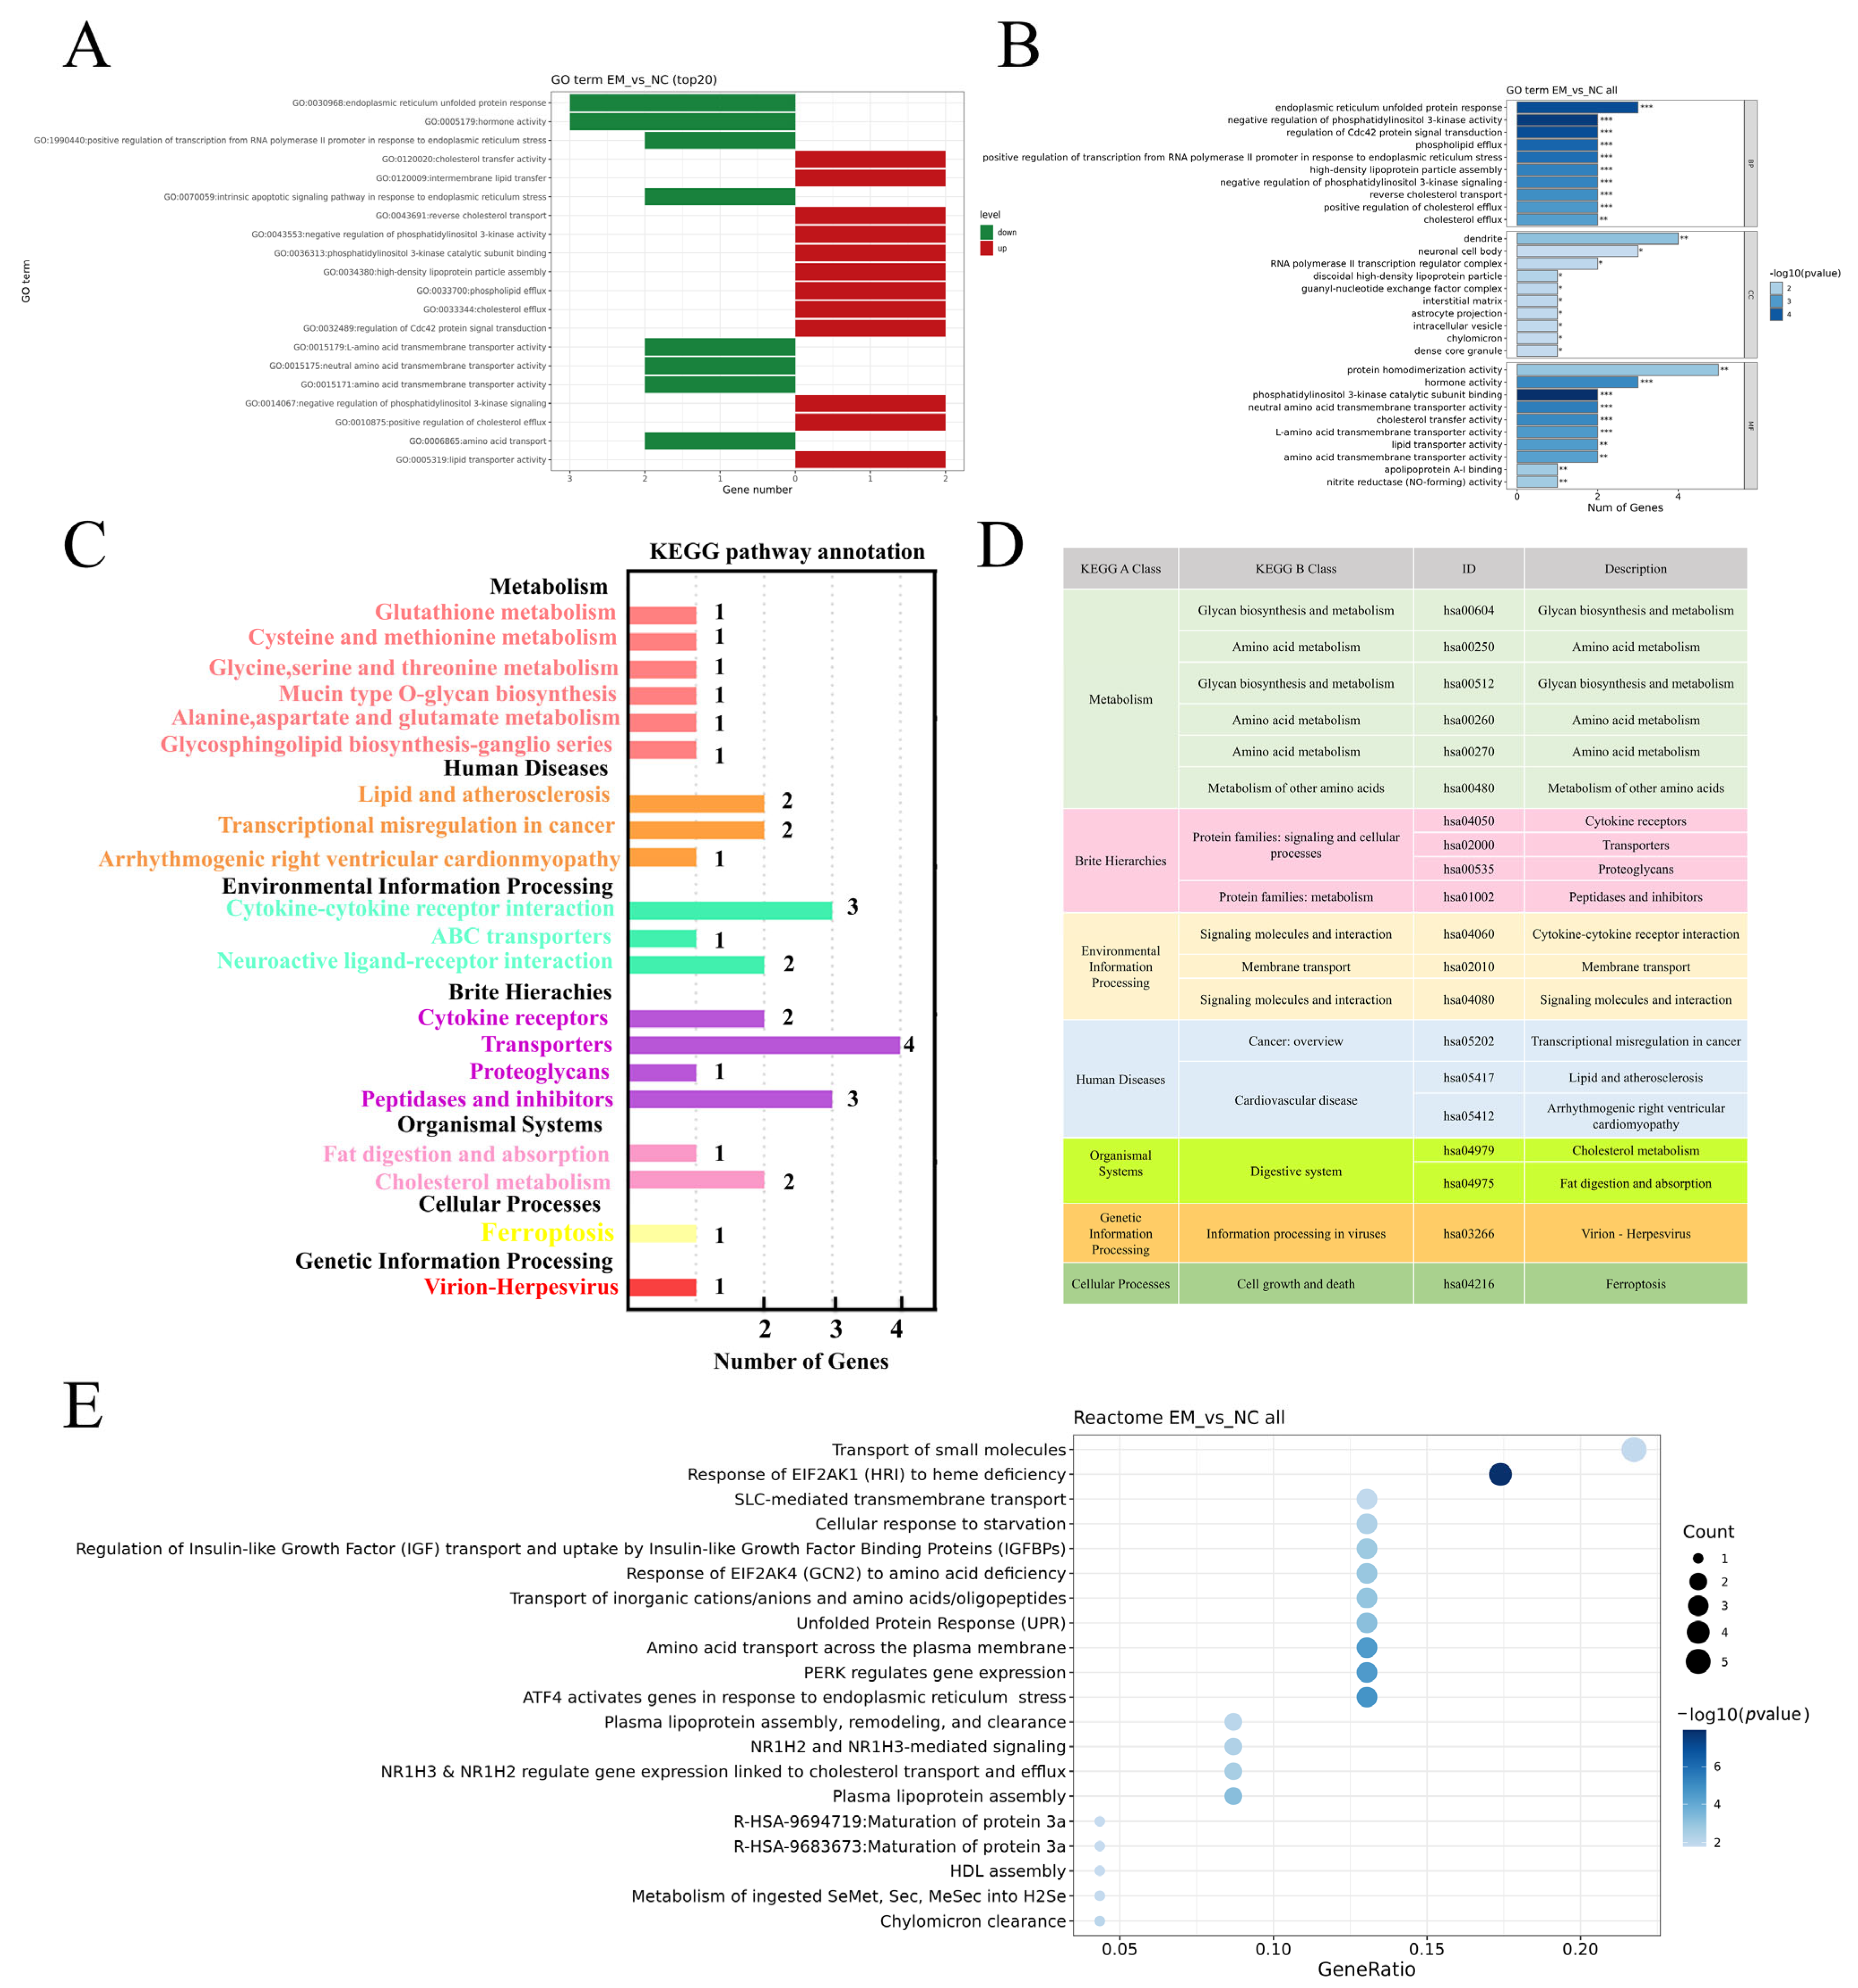
3.3. EM Reprograms Transcription to Promote Lactation

To investigate the global transcriptomic changes induced by EM treatment, we performed RNA sequencing analysis on MCF-10A cells treated with EM and untreated controls (NC). Principal component analysis (PCA) revealed a clear separation between the EM and NC groups, with PC1 and PC2 explaining 28.35% and 21.04% of the variance, respectively (Figure 3A), indicating distinct overall gene expression profiles.
Differential expression analysis identified a total of 59 DEGs between the two groups, including 23 upregulated and 36 downregulated genes (adjusted p < 0.05, |log2FC| ≥ 1) (Figure 3B). Notably, several DEGs such as CSN2, CSN1S1, and GAMT were significantly upregulated in the EM group, suggesting potential roles in milk protein synthesis and metabolic regulation.
Hierarchical clustering of the DEGs demonstrated clear within-group consistency and distinct separation between EM-treated and control samples based on their expression profiles (Figure 3C). The heatmap further illustrates that the transcriptional response to EM treatment involved coordinated regulation of genes associated with epithelial function and biosynthetic activity.
To explore the biological significance of the (DEGs) between EM-treated and control (NC) groups, we conducted GO, KEGG, and Reactome enrichment analyses. GO enrichment analysis showed that upregulated genes were enriched in biological processes such as endoplasmic reticulum unfolded protein response, amino acid transmembrane transport, and transcriptional regulation in response to stress. Downregulated genes were associated with lipid transport and cholesterol efflux (Figure 4A,B). KEGG analysis identified enriched pathways including amino acid metabolism, ABC transporters, cytokine–cytokine receptor interaction, and protein digestion and absorption. These pathways were mainly classified under metabolism, environmental information processing, and organismal systems (Figure 4C,D). Reactome analysis revealed significant enrichment in pathways such as transport of small molecules, EIF2AK1/EIF2AK4 response to stress, ATF4 and PERK signaling, SLC-mediated transmembrane transport, IGF transport and uptake, and plasma lipoprotein assembly (Figure 4E).

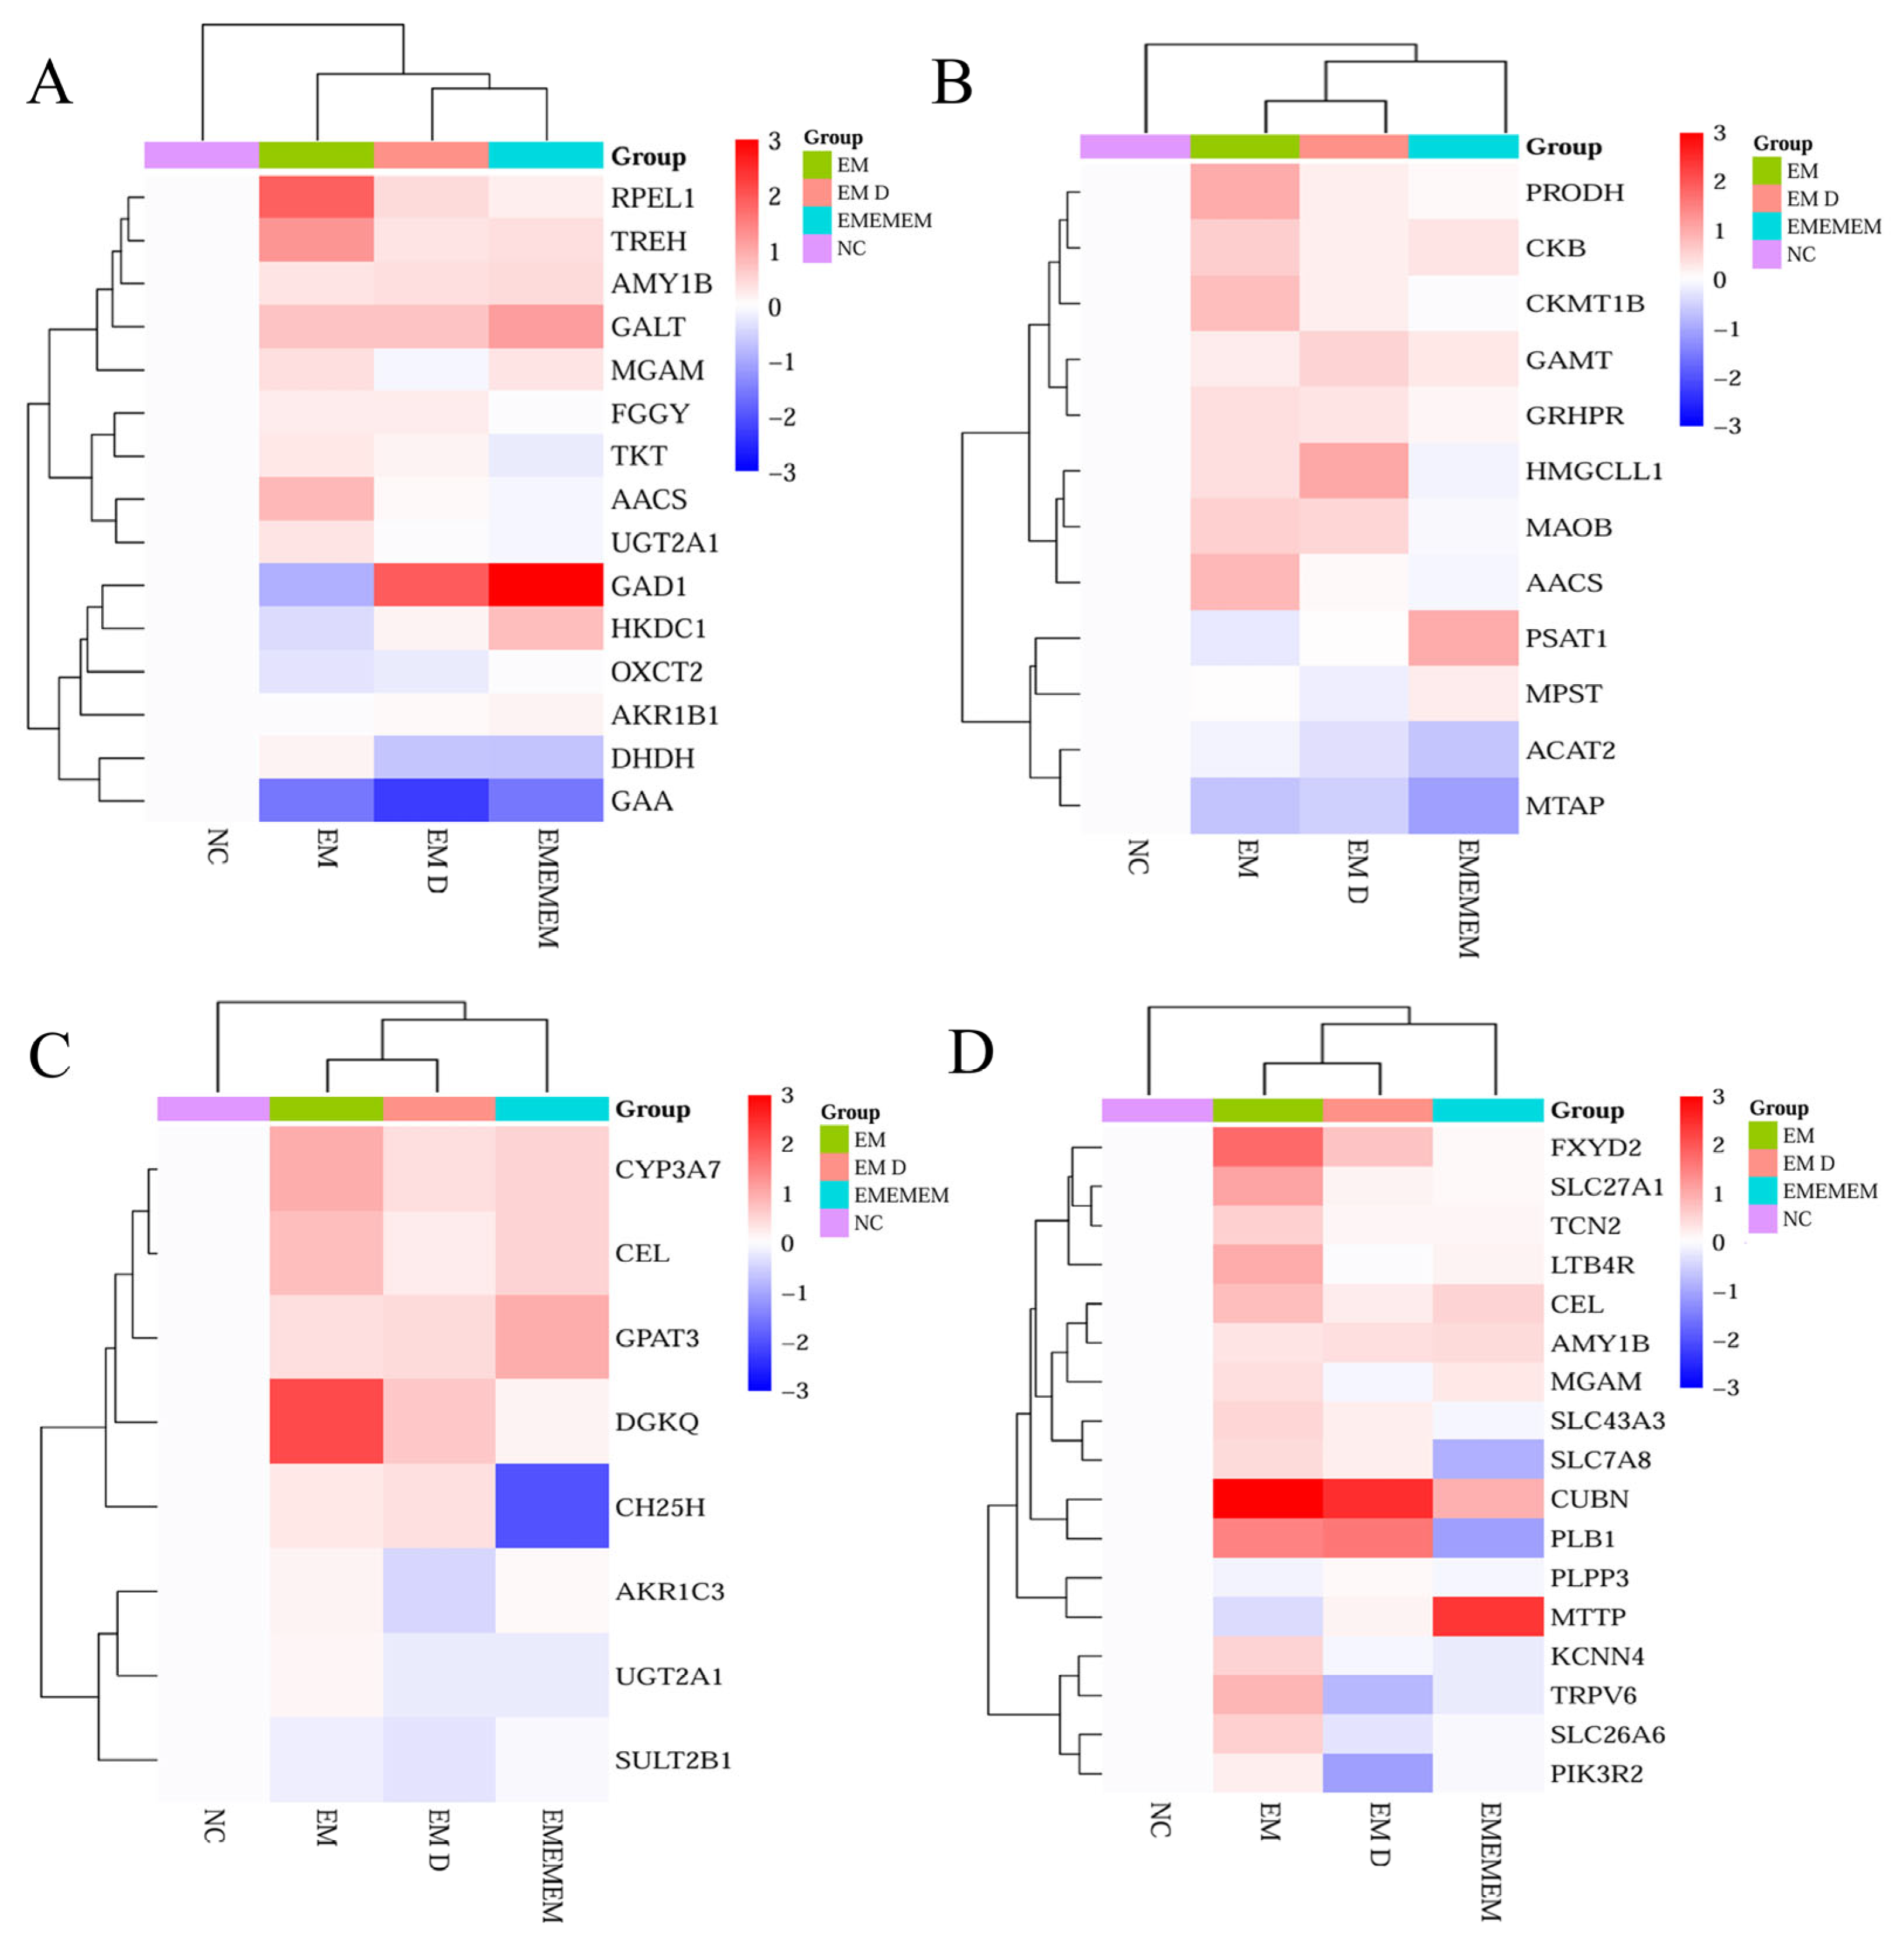
3.4. EM Reprograms Metabolism to Support Milk Component Synthesis

To investigate the metabolic effects of EM treatment, untargeted metabolomic profiling was performed using LC-MS/MS in both positive and negative ion modes. As shown in Figure 5A, PLS-DA score plots demonstrated clear separation between the EM and NC groups, indicating distinct global metabolic profiles. Differential metabolite screening is shown in Figure 5B, with volcano plots illustrating numerous significantly altered metabolites in both ionization modes (VIP > 1, |log2FC| > 1, p < 0.05). To identify common metabolic alterations, a combined volcano plot (Figure 5C) was generated, showing the total number and distribution of significantly upregulated and downregulated metabolites across modes. Unsupervised hierarchical clustering of all differential metabolites is shown in Figure 5D, where metabolite abundance patterns clearly distinguished EM from NC samples, indicating consistent treatment-dependent metabolic changes. Figure 5E presents the KEGG pathway enrichment analysis. EM-induced differential metabolites were significantly enriched in pathways related to amino acid metabolism (e.g., valine, leucine, isoleucine biosynthesis, cysteine and methionine metabolism), protein and mineral absorption, ABC transporters, and AMPK signaling. A detailed summary of the enriched KEGG pathways and associated differential metabolites is provided in Table 5.

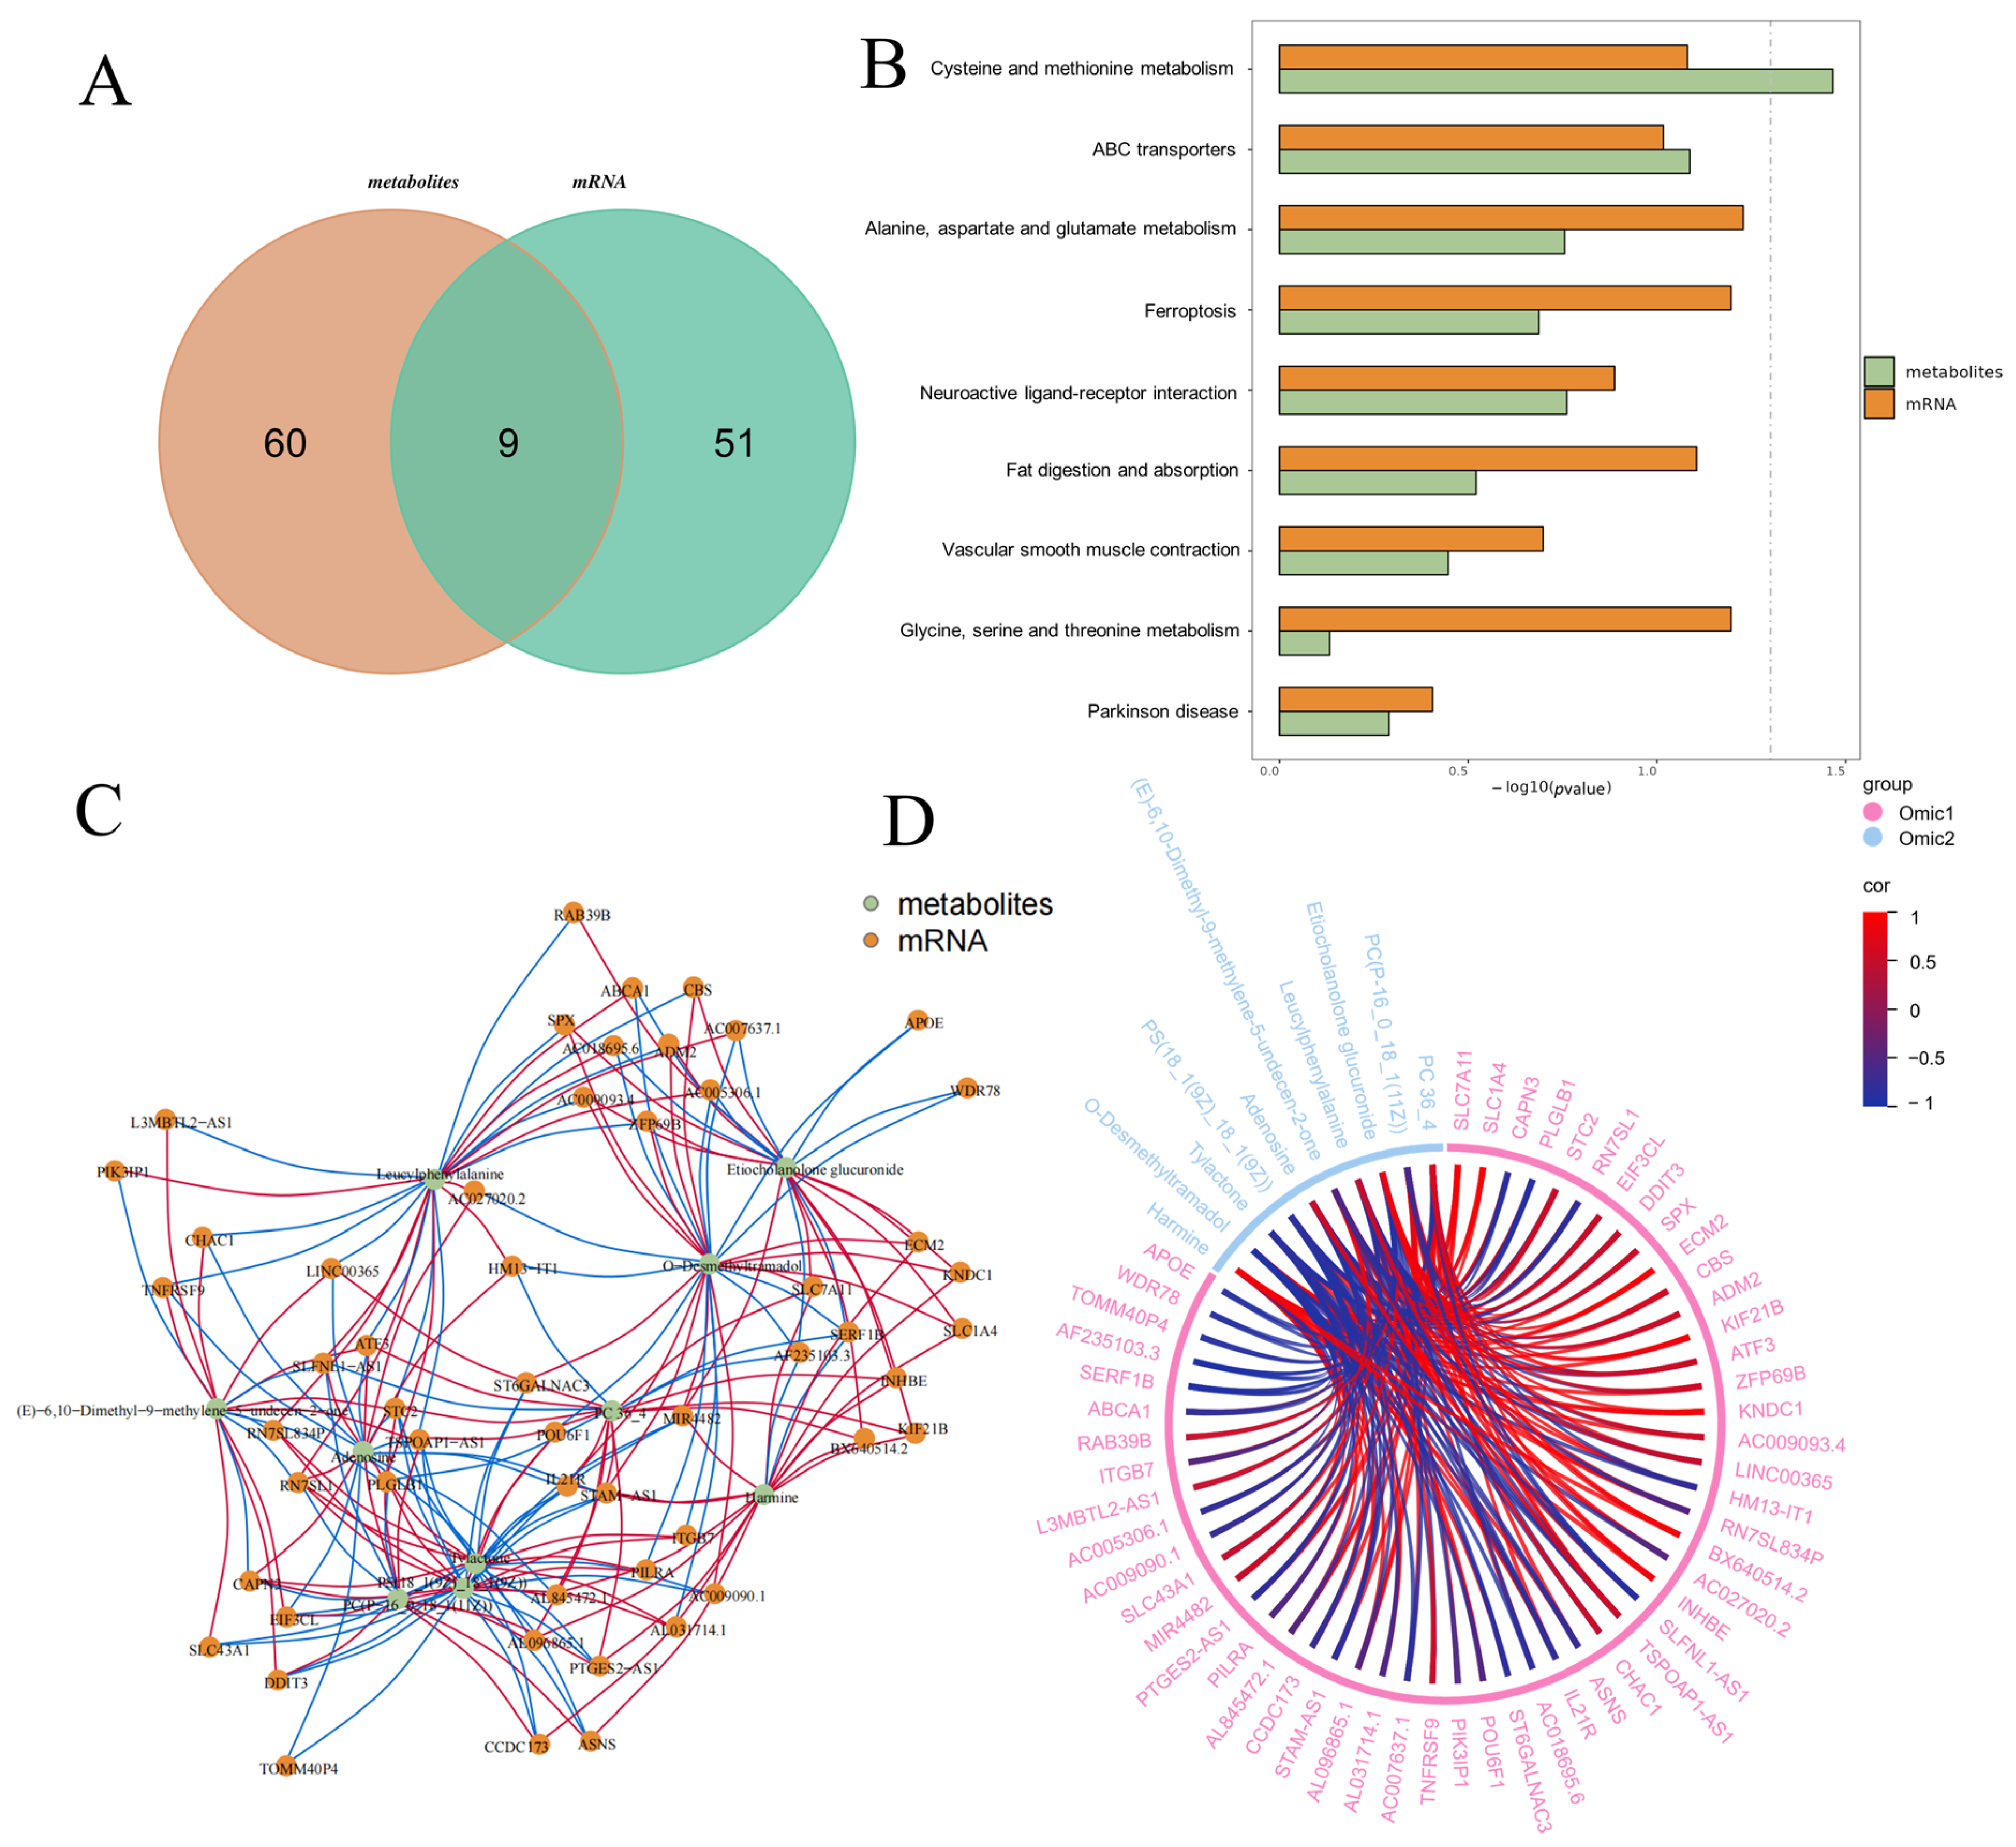
3.5. Integrated Omics Reveal Core Lactogenic Regulatory Networks Induced by EM

To elucidate the molecular mechanisms underlying EM-induced lactogenic and metabolic changes in mammary epithelial cells, we performed integrative analyses of transcriptomic and metabolomic datasets. A Venn diagram (Figure 6A) revealed that 9 KEGG pathways were significantly altered in both omics layers, suggesting the presence of shared regulatory targets influenced by EM. KEGG pathway enrichment analysis (Figure 6B) demonstrated that several metabolic pathways—including cysteine and methionine metabolism, ABC transporters, glutamate and alanine metabolism, and fat digestion and absorption—were enriched in both mRNA and metabolite datasets. This overlap indicates a potential convergence of transcriptional and metabolic regulation in amino acid and lipid handling under EM treatment. To further investigate transcript–metabolite relationships, we constructed a multi-omics correlation network (Figure 6C). Notably, multiple metabolites were found to be significantly correlated with key genes involved in cellular metabolism, transport, and signaling. Red and blue edges in the network represent positive and negative correlations, respectively, highlighting the complex and bidirectional nature of EM-driven regulatory interactions.
Moreover, a chord diagram (Figure 6D) illustrated robust associations between selected mRNAs and metabolites across both omics layers. Key lactogenic and metabolic regulators (e.g., CSN2, SLC family genes, ABC transporters) were tightly linked to small-molecule metabolites involved in energy metabolism, implying a coordinated regulatory mechanism whereby EM modulates both gene expression and metabolic outputs to support mammary cell function. Thus, even with a limited number of directly overlapping features, the consistent enrichment of shared pathways and strong cross-omic correlations provide robust evidence for a coordinated lactogenic regulatory network. These findings collectively underscore the systemic impact of EM on cellular metabolic pathways and gene networks, offering insight into the molecular underpinnings of its lactogenic and metabolic effects.

3.6. Validation of Differential Genes of Differential Metabolites

To validate the transcriptomic findings, representative DEGs involved in carbohydrate, amino acid, lipid metabolism, and nutrient absorption were evaluated by qRT-PCR across four groups (NC, EM, EM D-configuration, and EMEMEM). Gene expression levels are presented as normalized log2(fold change) and visualized using cluster-based heatmaps. In the carbohydrate metabolism module, 15 genes were analyzed, including those associated with sugar interconversion (GALT, FGGY), starch and sucrose hydrolysis (AMY1B, TREH, MGAM), the pentose phosphate pathway (TKT, RPEL1), and energy-related enzymes (HKDC1, GAD1, OXCT2) (Figure 7A). For amino acid metabolism, 12 genes were examined, encompassing pathways related to arginine and proline metabolism (PRODH, CKB, CKMT1B), methionine metabolism (GAMT), glycine and serine utilization (GRHPR, PSAT1, MAOB), and other auxiliary processes (AACS, MPST, MTAP) (Figure 7B). Eight genes involved in lipid metabolism were tested, including those related to bile acid biosynthesis (CH25H), lipid hydrolysis (CEL), glycerolipid remodeling (DGKQ), and steroid hormone metabolism (CYP3A7, AKR1C3, SULT2B1) (Figure 7C). For nutrient absorption, 17 genes were assessed, including those involved in mineral uptake (TRPV6, SLC26A6), vitamin and lipid absorption (PLB1, PLPP3, MTTP, CUBN), amino acid transport (SLC7A8, KCNN4), and carbohydrate digestion (AMY1B, MGAM). Additional regulators (PIK3R2, FXYD2) were included based on their KEGG pathway relevance (Figure 7D).
The qRT-PCR validation of key transport genes revealed that the promotion of lactation by EM is governed by a complex regulatory network rather than a single signaling pathway. The coordinated upregulation of genes involved in carbohydrate metabolism, amino acid utilization, lipid remodeling, and nutrient absorption underscores the multifactorial nature of lactogenic regulation. These findings highlight lactation as a highly integrated physiological process requiring synchronized metabolic and transcriptional support.

4. Discussion

In this study, we demonstrated that the methionine-containing dipeptide EM significantly enhanced the proliferation ofMCF-10A and promoted the synthesis of major milk proteins at both the transcriptional and protein levels [7,25]. Integrated transcriptomic and metabolomic analyses further revealed that EM treatment induced a coordinated reprogramming of metabolic and gene expression pathways associated with amino acid metabolism, nutrient absorption, and biosynthetic processes essential for lactation [35].
Our findings are consistent with previous reports that small peptides, particularly methionine-containing dipeptides, can activate key signaling pathways such as mTOR and PI3K-AKT to stimulate milk protein synthesis in ruminants (e.g., bovine and caprine mammary gland cells) [25]. However, most existing studies have been confined to animal models. Here, to our knowledge, this study provides the first demonstration of EM’s lactogenic effects in an in vitro human mammary epithelial model, although we acknowledge that despite a comprehensive literature search, some relevant reports may not have been captured. This highlights the potential of dipeptide-based strategies to modulate human milk biosynthesis at the cellular level [36].
Through RNA-seq analysis, we observed that EM treatment significantly upregulated genes involved in carbohydrate, amino acid, and lipid metabolism, as well as nutrient transport pathways such as ABC transporters [36,37,38]. These changes are critical for supporting the elevated energy and substrate demands of lactating cells. Metabolomic profiling further confirmed broad remodeling of amino acid pools, lipid intermediates, and carbohydrate derivatives, consistent with enhanced biosynthetic capacity. Notably, cysteine and methionine metabolism, glycine, serine, and threonine metabolism, and alanine, aspartate, and glutamate metabolism were among the most significantly affected pathways, underscoring the centrality of amino acid metabolism in EM-induced lactogenesis [39].
The integrated omics correlation analysis revealed strong associations between amino acid-derived metabolites and nutrient transporter genes, suggesting a synchronized regulation between metabolite availability and transporter expression [17,40,41]. Such coordinated responses are essential for efficient substrate uptake and utilization during milk component synthesis [42]. These findings imply that EM not only serves as a nutritional precursor but may also act as a metabolic signaling molecule to reprogram cellular metabolic fluxes toward lactation [14,43].
Importantly, our study addresses a critical knowledge gap regarding the impact of dipeptides on human mammary function [44,45]. Previous work has largely focused on free amino acid supplementation, overlooking the potential advantages of dipeptide forms, which exhibit higher bioavailability and faster cellular uptake via PepT1 transporters [46,47]. Our results suggest that dipeptide-based interventions may warrant investigation as potential interventions pending safety and efficacy studies, particularly in populations with increased nutritional needs [14].
Although MCF-10A is a widely used, non-tumorigenic human mammary epithelial line, it exhibits basal-like traits and lacks the specialized phenotype, hormonal responsiveness, and high secretory capacity of fully differentiated lactating cells [48,49]. Therefore, our in vitro findings must be interpreted with caution, and validation in primary human cells or in vivo lactation models will be essential. We employed three biological replicates per group for both transcriptomic and metabolomic analyses, in line with common exploratory omics practice; while clustering and quality control metrics support the robustness of major trends, this small sample size limits statistical power and generalizability [50]. EM concentrations (50, 100, 150 μg/mL) were chosen based on precedent in peptide bioactivity assays and our own CCK-8/EdU tests, which showed no cytotoxicity up to 150 μg/mL and optimal proliferative responses at 50–100 μg/mL. However, the systemic exposure, bioavailability, and safety of these doses remain untested in vivo, necessitating comprehensive pharmacokinetic and toxicity studies to establish physiological relevance and guide translational development. Secondly, while we identified key metabolic and transcriptional shifts, the upstream signaling cascades (e.g., mTORC1 activation, STAT5 phosphorylation) were not directly examined and warrant further investigation [14,25]. Finally, the long-term safety and efficacy of EM supplementation for promoting lactation remain to be explored.
In conclusion, this study provides new insights into the molecular mechanisms by which the methionine-containing dipeptide EM enhances lactogenic activity in human mammary epithelial cells. These findings suggest that EM holds promise as a functional ingredient for supporting lactation and maternal health. Future research should focus on elucidating the signaling pathways involved, validating the effects in vivo, and exploring its application in functional foods or nutritional supplements designed for breastfeeding mothers [38].

5. Conclusions

In summary, this study suggests that the methionine-containing dipeptide EM significantly promotes the proliferation of human mammary epithelial cells and enhances milk protein synthesis. Through integrated transcriptomic and metabolomic analyses, we revealed that EM induces metabolic and transcriptional reprogramming in pathways potentially relevant to amino acid metabolism, lipid biosynthesis, and nutrient transport, which may be associated with lactogenic functions. These findings provide new insights into the potential application of dipeptide-based strategies to improve lactation performance. Future research should focus on validating these effects in vivo and exploring the underlying signaling mechanisms to facilitate the development of functional foods for maternal and infant health.

Author Contributions

Conceptualization, B.L. and X.F.; methodology, Y.L., Y.Y. and R.Y.; investigation, Y.L., Y.Y., R.Y., X.L. and C.Z.; data curation, X.W. and C.Z.; formal analysis, Y.L. and Y.Y.; visualization, Y.Y. and X.W.; writing—original draft, Y.L. and Y.Y.; writing—review and editing, B.L. and X.F.; supervision and project administration, B.L. All authors have read and agreed to the published version of the manuscript.

Funding

This research was funded by the Jilin Province Science and Technology Development Plan Project (20240404037ZP), the National Natural Science Foundation of China (32101942), the Fundamental Research Funds for the Central Universities (2023-JCXK-20), and the Jilin University Lixin Excellent Young Teacher Training Program.

Institutional Review Board Statement

Not applicable.

Informed Consent Statement

Not applicable.

Data Availability Statement

The data presented in this study are available in the main article.

Conflicts of Interest

The authors declare no conflicts of interest.

Abbreviations

The following abbreviations are used in this manuscript:
AbbreviationFull Term
ABCATP-binding cassette (transporters)
AICAR5-Aminoimidazole-4-carboxamide ribonucleotide
AMPKAMP-activated protein kinase
ATF4Activating transcription factor 4
CCK-8Cell Counting Kit-8
CSN1S1/CSN2/CSN3Casein genes (alpha-S1, beta, and kappa-casein)
DEGDifferentially expressed gene
DMEM/F-12Dulbecco’s Modified Eagle Medium/Nutrient Mixture F-12
EdU5-ethynyl-2′-deoxyuridine
EIF2AK1/EIF2AK4Eukaryotic translation initiation factor 2 alpha kinase 1/4
EMMethionine-containing dipeptide
FBSFetal bovine serum
GOGene ontology
KEGGKyoto Encyclopedia of Genes and Genomes
LC-MS/MSLiquid chromatography–tandem mass spectrometry
MCF-10AHuman mammary epithelial cell line MCF-10A
mTORMammalian target of rapamycin
PBSPhosphate-buffered saline
PCAPrincipal component analysis
PepT1Peptide transporter 1
PERKProtein kinase RNA-like endoplasmic reticulum kinase
PI3KPhosphoinositide 3-kinase
PLS-DAPartial least squares discriminant analysis
qRT-PCRQuantitative real-time polymerase chain reaction
RNA-seqRNA sequencing
SAMS-adenosylmethionine
VIPVariable importance in projection

References

  1. Garwolińska, D.; Namieśnik, J.; Kot-Wasik, A.; Hewelt-Belka, W. Chemistry of Human Breast Milk-A Comprehensive Review of the Composition and Role of Milk Metabolites in Child Development. J. Agric. Food Chem. 2018, 66, 11881–11896. [Google Scholar] [CrossRef] [PubMed]
  2. Ramiro-Cortijo, D.; Singh, P.; Liu, Y.; Medina-Morales, E.; Yakah, W.; Freedman, S.D.; Martin, C.R. Breast Milk Lipids and Fatty Acids in Regulating Neonatal Intestinal Development and Protecting against Intestinal Injury. Nutrients 2020, 12, 534. [Google Scholar] [CrossRef] [PubMed]
  3. Thai, J.D.; Gregory, K.E. Bioactive Factors in Human Breast Milk Attenuate Intestinal Inflammation during Early Life. Nutrients 2020, 12, 581. [Google Scholar] [CrossRef] [PubMed]
  4. Gridneva, Z.; Tie, W.J.; Rea, A.; Lai, C.T.; Ward, L.C.; Murray, K.; Hartmann, P.E.; Geddes, D.T. Human Milk Casein and Whey Protein and Infant Body Composition over the First 12 Months of Lactation. Nutrients 2018, 10, 1332. [Google Scholar] [CrossRef] [PubMed]
  5. Sangild, P.T.; Vonderohe, C.; Melendez Hebib, V.; Burrin, D.G. Potential Benefits of Bovine Colostrum in Pediatric Nutrition and Health. Nutrients 2021, 13, 2551. [Google Scholar] [CrossRef] [PubMed]
  6. Li, B.; Khan, M.Z.; Khan, I.M.; Ullah, Q.; Cisang, Z.M.; Zhang, N.; Wu, D.; Huang, B.; Ma, Y.; Khan, A.; et al. Genetics, environmental stress, and amino acid supplementation affect lactational performance via mTOR signaling pathway in bovine mammary epithelial cells. Front. Genet. 2023, 14, 1195774. [Google Scholar] [CrossRef] [PubMed]
  7. Pan, F.; Li, P.; Hao, G.; Liu, Y.; Wang, T.; Liu, B. Enhancing Milk Production by Nutrient Supplements: Strategies and Regulatory Pathways. Animals 2023, 13, 419. [Google Scholar] [CrossRef] [PubMed]
  8. Qi, H.; Wang, L.; Zhang, M.; Wang, Z.; Gao, X.; Li, M. Methionine and leucine induce ARID1A degradation to promote mTOR expression and milk synthesis in mammary epithelial cells. J. Nutr. Biochem. 2021, 101, 108924. [Google Scholar] [CrossRef] [PubMed]
  9. Han, M.; Zhang, M. The regulatory mechanism of amino acids on milk protein and fat synthesis in mammary epithelial cells: A mini review. Anim. Biotechnol. 2021, 34, 402–412. [Google Scholar] [CrossRef] [PubMed]
  10. Qi, H.; Yu, M.; Fan, X.; Zhou, Y.; Zhang, M.; Gao, X. Methionine and Leucine Promote mTOR Gene Transcription and Milk Synthesis in Mammary Epithelial Cells through the eEF1Bα-UBR5-ARID1A Signaling. J. Agric. Food Chem. 2024, 72, 11733–11745. [Google Scholar] [CrossRef] [PubMed]
  11. Rezaei, R.; Wu, Z.; Hou, Y.; Bazer, F.W.; Wu, G. Amino acids and mammary gland development: Nutritional implications for milk production and neonatal growth. J. Anim. Sci. Biotechnol. 2016, 7, 20. [Google Scholar] [CrossRef] [PubMed]
  12. Zhang, M.C.; Zhao, S.G.; Wang, S.S.; Luo, C.C.; Gao, H.N.; Zheng, N.; Wang, J.Q. d-Glucose and amino acid deficiency inhibits casein synthesis through JAK2/STAT5 and AMPK/mTOR signaling pathways in mammary epithelial cells of dairy cows. J. Dairy Sci. 2018, 101, 1737–1746. [Google Scholar] [CrossRef] [PubMed]
  13. Huang, Y.; Liu, Y.; Yu, X.Y.; Zeng, T.Y. The rates and factors of perceived insufficient milk supply: A systematic review. Matern. Child Nutr. 2022, 18, e13255. [Google Scholar] [CrossRef] [PubMed]
  14. Wei, X.; Han, N.; Liu, H. Supplementation of Methionine Dipeptide Enhances the Milking Performance of Lactating Dairy Cows. Animals 2024, 14, 1339. [Google Scholar] [CrossRef] [PubMed]
  15. Zhou, M.; Xu, L.; Zhao, F.; Liu, H. Regulation of Milk Protein Synthesis by Free and Peptide-Bound Amino Acids in Dairy Cows. Biology 2021, 10, 1044. [Google Scholar] [CrossRef] [PubMed]
  16. Yang, J.X.; Wang, C.H.; Xu, Q.B.; Zhao, F.Q.; Liu, J.X.; Liu, H.Y. Methionyl-Methionine Promotes α-s1 Casein Synthesis in Bovine Mammary Gland Explants by Enhancing Intracellular Substrate Availability and Activating JAK2-STAT5 and mTOR-Mediated Signaling Pathways. J. Nutr. 2015, 145, 1748–1753. [Google Scholar] [CrossRef] [PubMed]
  17. Liu, H.Y.; Wei, X.S.; Dai, W.T.; Xu, L.B.; Wang, C.; Liu, J.X. The functional and regulatory entities underlying free and peptide-bound amino acid transporters in the bovine mammary gland. JDS Commun. 2023, 4, 235–239. [Google Scholar] [CrossRef] [PubMed]
  18. Qi, Y.; Xu, Y. The role and molecular mechanisms of amino acids in enhancing mammary gland milk synthesis - a comprehensive review. Food Res. Int. 2025, 211, 116355. [Google Scholar] [CrossRef] [PubMed]
  19. Gilbreath, K.R.; Bazer, F.W.; Satterfield, M.C.; Wu, G. Amino Acid Nutrition and Reproductive Performance in Ruminants. Adv. Exp. Med. Biol. 2021, 1285, 43–61. [Google Scholar] [CrossRef] [PubMed]
  20. Neville, M.C.; McFadden, T.B.; Forsyth, I. Hormonal Regulation of Mammary Differentiation and Milk Secretion. J. Mammary Gland. Biol. Neoplasia 2002, 7, 49–66. [Google Scholar] [CrossRef] [PubMed]
  21. Neville, M.C.; Morton, J. Physiology and Endocrine Changes Underlying Human Lactogenesis II. J. Nutr. 2001, 131, 3005S–3008S. [Google Scholar] [CrossRef] [PubMed]
  22. Macias, H.; Hinck, L. Mammary gland development. Wiley Interdiscip. Rev. Dev. Biol. 2012, 1, 533–557. [Google Scholar] [CrossRef] [PubMed]
  23. Brandsch, M. Drug transport via the intestinal peptide transporter PepT1. Curr. Opin. Pharmacol. 2013, 13, 881–887. [Google Scholar] [CrossRef] [PubMed]
  24. Daniel, H. Molecular and integrative physiology of intestinal peptide transport. Annu. Rev. Physiol. 2004, 66, 361–384. [Google Scholar] [CrossRef] [PubMed]
  25. Li, P.; Fang, X.; Hao, G.; Li, X.; Cai, Y.; Yan, Y.; Zan, L.; Yang, R.; Liu, B. Methionine Promotes Milk Protein Synthesis via the PI3K-mTOR Signaling Pathway in Human Mammary Epithelial Cells. Metabolites 2023, 13, 1149. [Google Scholar] [CrossRef] [PubMed]
  26. Pirkmajer, S.; Chibalin, A.V. Serum starvation: Caveat emptor. Am. J. Physiol. Cell Physiol. 2011, 301, C272–C279. [Google Scholar] [CrossRef] [PubMed]
  27. Hennighausen, L.; Robinson, G.W. Interpretation of cytokine signaling through the transcription factors STAT5A and STAT5B. Genes Dev. 2008, 22, 711–721. [Google Scholar] [CrossRef] [PubMed]
  28. Salic, A.; Mitchison, T.J. A chemical method for fast and sensitive detection of DNA synthesis in vivo. Proc. Natl. Acad. Sci. USA 2008, 105, 2415–2420. [Google Scholar] [CrossRef] [PubMed]
  29. Livak, K.J.; Schmittgen, T.D. Analysis of Relative Gene Expression Data Using Real-Time Quantitative PCR and the 2−ΔΔCT Method. Methods 2001, 25, 402–408. [Google Scholar] [CrossRef] [PubMed]
  30. Jamur, M.C.; Oliver, C. Permeabilization of cell membranes. Methods Mol. Biol. 2010, 588, 63–66. [Google Scholar] [CrossRef] [PubMed]
  31. Chomczynski, P.; Sacchi, N. Single-step method of RNA isolation by acid guanidinium thiocyanate-phenol-chloroform extraction. Anal. Biochem. 1987, 162, 156–159. [Google Scholar] [CrossRef] [PubMed]
  32. Pang, Z.; Chong, J.; Zhou, G.; de Lima Morais, D.A.; Chang, L.; Barrette, M.; Gauthier, C.; Jacques, P.; Li, S.; Xia, J. MetaboAnalyst 5.0: Narrowing the gap between raw spectra and functional insights. Nucleic. Acids. Res. 2021, 49, W388–W396. [Google Scholar] [CrossRef] [PubMed]
  33. Shannon, P.; Markiel, A.; Ozier, O.; Baliga, N.S.; Wang, J.T.; Ramage, D.; Amin, N.; Schwikowski, B.; Ideker, T. Cytoscape: A software environment for integrated models of biomolecular interaction networks. Genome. Res. 2003, 13, 2498–2504. [Google Scholar] [CrossRef] [PubMed]
  34. Kobayashi, K. Culture Models to Investigate Mechanisms of Milk Production and Blood-Milk Barrier in Mammary Epithelial Cells: A Review and a Protocol. J. Mammary Gland. Biol. Neoplasia 2023, 28, 8. [Google Scholar] [CrossRef] [PubMed]
  35. Bionaz, M.; Loor, J.J. Gene networks driving bovine milk fat synthesis during the lactation cycle. BMC Genom. 2008, 9, 366. [Google Scholar] [CrossRef] [PubMed]
  36. Bionaz, M.; Loor, J.J. Gene networks driving bovine mammary protein synthesis during the lactation cycle. Bioinform. Biol. Insights 2011, 5, 83–98. [Google Scholar] [CrossRef] [PubMed]
  37. Mauerer, R.; Ebert, S.; Langmann, T. High glucose, unsaturated and saturated fatty acids differentially regulate expression of ATP-binding cassette transporters ABCA1 and ABCG1 in human macrophages. Exp. Mol. Med. 2009, 41, 126–132. [Google Scholar] [CrossRef] [PubMed]
  38. Li, H.; La, S.K.; Zhang, L.Y.; Li, S.; Yu, Z.B.; Ao, L.M.; Gao, T.Y.; Huang, H.T. Metabolomics and amino acid profiling of plasma reveals the metabolite profiles associated with nitrogen utilisation efficiency in primiparous dairy cows. Animal 2024, 18, 101202. [Google Scholar] [CrossRef] [PubMed]
  39. Chen, C.; Hou, G.; Zeng, C.; Ren, Y.; Chen, X.; Peng, C. Metabolomic profiling reveals amino acid and carnitine alterations as metabolic signatures in psoriasis. Theranostics 2021, 11, 754–767. [Google Scholar] [CrossRef] [PubMed]
  40. Zhu, Y.; Bu, D.; Ma, L. Integration of Multiplied Omics, a Step Forward in Systematic Dairy Research. Metabolites 2022, 12, 225. [Google Scholar] [CrossRef] [PubMed]
  41. Shennan, D.B.; Peaker, M. Transport of milk constituents by the mammary gland. Physiol. Rev. 2000, 80, 925–951. [Google Scholar] [CrossRef] [PubMed]
  42. Baumgard, L.H.; Collier, R.J.; Bauman, D.E. A 100-Year Review: Regulation of nutrient partitioning to support lactation. J. Dairy Sci. 2017, 100, 10353–10366. [Google Scholar] [CrossRef] [PubMed]
  43. Chen, Q.; Zhao, F.-Q.; Ren, Y.; Han, J.; Liu, J.; Li, Y.; Liu, H. Parenterally Delivered Methionyl-Methionine Dipeptide During Pregnancy Enhances Mammogenesis and Lactation Performance Over Free Methionine by Activating PI3K-AKT Signaling in Methionine-Deficient Mice. J. Nutr. 2020, 150, 1186–1195. [Google Scholar] [CrossRef] [PubMed]
  44. van Sadelhoff, J.H.J.; Wiertsema, S.P.; Garssen, J.; Hogenkamp, A. Free Amino Acids in Human Milk: A Potential Role for Glutamine and Glutamate in the Protection Against Neonatal Allergies and Infections. Front. Immunol. 2020, 11, 1007. [Google Scholar] [CrossRef] [PubMed]
  45. Zhang, Z.; Adelman, A.S.; Rai, D.; Boettcher, J.; Lőnnerdal, B. Amino Acid Profiles in Term and Preterm Human Milk through Lactation: A Systematic Review. Nutrients 2013, 5, 4800–4821. [Google Scholar] [CrossRef] [PubMed]
  46. Wang, J.; Yan, X.; Lu, R.; Meng, X.; Nie, G. Peptide transporter 1 (PepT1) in fish: A review. Aquac. Fish. 2017, 2, 193–206. [Google Scholar] [CrossRef]
  47. Spanier, B. Transcriptional and functional regulation of the intestinal peptide transporter PEPT1. J. Physiol. 2014, 592, 871–879. [Google Scholar] [CrossRef] [PubMed]
  48. Qu, Y.; Han, B.; Yu, Y.; Yao, W.; Bose, S.; Karlan, B.Y.; Giuliano, A.E.; Cui, X. Evaluation of MCF10A as a Reliable Model for Normal Human Mammary Epithelial Cells. PLoS ONE 2015, 10, e0131285. [Google Scholar] [CrossRef] [PubMed]
  49. Thomas, E.; Lee-Pullen, T.; Rigby, P.; Hartmann, P.; Xu, J.; Zeps, N. Receptor activator of NF-κB ligand promotes proliferation of a putative mammary stem cell unique to the lactating epithelium. Stem. Cells 2012, 30, 1255–1264. [Google Scholar] [CrossRef] [PubMed]
  50. Pinu, F.R.; Beale, D.J.; Paten, A.M.; Kouremenos, K.; Swarup, S.; Schirra, H.J.; Wishart, D. Systems Biology and Multi-Omics Integration: Viewpoints from the Metabolomics Research Community. Metabolites 2019, 9, 76. [Google Scholar] [CrossRef] [PubMed]
Figure 1. Effects of EM treatment on the proliferation of MCF-10A cells. MCF-10A cells were treated with varying concentrations of EM (0, 50, 100, and 150 μg/mL). (A) Cell viability was measured by CCK-8 assay at 24 and 48 h. No significant differences were observed between groups (p > 0.05). (B) EdU staining was performed to assess DNA synthesis-based cell proliferation after 24 h of treatment. Nuclei were stained with Hoechst (blue), and EdU-positive proliferating cells were labeled with green fluorescence. Scale bar = 100 μm. (C) Quantification of EdU-positive cells (%) under each treatment condition. Data are presented as mean ± SEM (n = 3). Statistical analysis was performed using one-way ANOVA followed by Tukey’s multiple comparisons test. Different lowercase letters indicate significant differences between groups (p < 0.05).
Metabolites 15 00476 g001
Figure 2. EM treatment promotes the expression of milk protein genes and β-casein in MCF-10A cells. (AC) qRT-PCR analysis of the mRNA expression levels of CSN1S1 (A), CSN2 (B), and CSN3 (C) in MCF-10A cells treated with different concentrations of EM (0, 50, 100, and 150 μg/mL) for 24 h. Gene expression was normalized to β-actin and is presented as fold change relative to the untreated control group. Data are shown as mean ± SEM (n = 3). One-way ANOVA followed by Tukey’s post hoc test was used to determine statistical significance. Bars with different lowercase letters indicate significant differences (p < 0.05). (D) Immunofluorescence staining of β-casein (CSN2) protein in MCF-10A cells after treatment with 100 μg/mL EM or vehicle control. β-casein was labeled with FITC-conjugated secondary antibody (green), and nuclei were counterstained with Hoechst (blue). Merged images show clear cytoplasmic CSN2 signal. Images were captured using an inverted fluorescence microscope under identical exposure settings. Scale bar = 100 μm.
Metabolites 15 00476 g002
Figure 3. Transcriptome data quality control and sample distribution analysis. (A) Principal component analysis (PCA) plot demonstrating clear separation between EM-treated and control (NC) groups. (B) Volcano plot showing DEGs between groups, with significantly upregulated (red) and downregulated (green) genes (adjusted p < 0.05, |log2FC| ≥ 1). (C) Hierarchical clustering heatmap of differentially expressed genes, showing distinct clustering of EM and NC samples based on gene expression profiles.
Metabolites 15 00476 g003
Figure 4. Transcriptome analysis of EM-treated MCF-10A cells versus control. (A) GO enrichment of the top 20 (DEGs), showing biological processes enriched for upregulated (red) and downregulated (green) genes. (B) GO enrichment categorized by biological process (BP), cellular component (CC), and molecular function (MF); bar length indicates gene count, and color reflects −log10 (p-value). (C) KEGG pathway enrichment grouped by major biological functions. (D) KEGG classification summary showing pathway IDs, categories, and functional descriptions. (E) Reactome enrichment dot plot; dot size denotes gene count and color indicates enrichment significance. * p < 0.05, ** p < 0.01, *** p < 0.001.
Metabolites 15 00476 g004
Figure 5. Metabolomic profiling of EM-treated mammary epithelial cells. (A) PLS-DA score plots based on LC-MS/MS data in both positive and negative ion modes, illustrating sample distribution between EM and NC groups. (B) Volcano plots of significantly altered metabolites (VIP > 1, |log2FC| > 1, p < 0.05) under positive and negative ionization. (C) Combined volcano plot showing the overall distribution of significantly changed metabolites across both ionization modes. (D) Heatmap of all differential metabolites clustered by treatment group. Each row represents a metabolite and each column a sample; color scale indicates z-score normalized intensity. (E) KEGG pathway enrichment bubble plot of differential metabolites. Dot size represents the number of hits per pathway, and color reflects statistical significance (p-value).
Metabolites 15 00476 g005
Figure 6. Multi-omics integrative analysis reveals key transcript-metabolite interactions induced by EM treatment. (A) Venn diagram showing the overlap of significantly enriched KEGG pathways identified from transcriptomic and metabolomic datasets. (B) KEGG pathway enrichment analysis of differentially expressed genes and metabolites. Orange bars represent gene-enriched pathways, and green bars represent metabolite-enriched pathways. (C) Multi-omics network diagram showing the correlations between differential genes and metabolites. Nodes represent genes (orange) and metabolites (green); edges indicate significant correlations, with red lines for positive and blue lines for negative associations. (D) Chord diagram displaying significantly correlated mRNA-metabolite pairs shared across omics datasets. The thickness and color of connecting lines represent correlation strength and direction (red: positive; blue: negative).
Metabolites 15 00476 g006
Figure 7. Heatmap of qRT-PCR validation results for differentially expressed genes. (A) Carbohydrate metabolism. (B) Amino acid metabolism. (C) Lipid metabolism. (D) Nutrient absorption.
Metabolites 15 00476 g007
Table 1. The primer sequences used for qRT-PCR.
Gene Name Primer Sequence (5′-3′)
CSN1S1-FAGGGCACCTAATCAGAGGGT
CSN1S1-RAATTGATGGCACTTACAGAACTGG
CSN2-FGGAGAGGATGAACACCAGGATA
CSN2-RGCTGAGCAAGAGGCAGAATG
CSN3-FGCAGGTCCCTCAGCCTATTC
CSN3-RACAGCTCTCTGAGGGTAGGG
β-actin-FAGACCTGTACGCCAACACAG
β-actin-RCGCTCAGGAGGAGCAATGAT
MPST-FGCCGTGTCACTGCTTGATG
MPST-RGGTTCTCCTTGATGTCCTCGTA
PSAT1-FGTGTGCTGACTATGTGGTGAC
PSAT1-RGTTGAGGTTCCAGGTGCTTG
MTAP-FTCAACTACCAGGCGAACATCT
MTAP-RGGCACAAGAATGACTTCCATCA
GAMT-FGCCCATTGATGAGCATTGGAT
GAMT-RGGCGTGGTTCTTGATGAAGTT
GRHPR-FCCAGATGTCCTGACAGATACCA
GRHPR-RAGCCACCATTCTTCACTTCCT
MAOB-FGGCAGGACTTACACTCTTAGGA
MAOB-RAGACGCTCAACCTCATTCACT
ACAT2-FGGCTCCTCACTTGGCTTACT
ACAT2-RGCAACCTTGTCCTGATCTTCTC
HMGCLL1-FGGTATGTGTCTTGTGCTCTGG
HMGCLL1-RGCTAAGGCTTGTCCGTATGTG
AACS-FTGGCTGTCAGTGCTGGAAG
AACS-RCAGGAGGATGCTGCTCTTGA
PRODH-FAGAGCACAAGGAGATGGAGTC
PRODH-RCTCATTGGCGTAGAAGTAGGTG
CKMT1B-FGTGGCTGGAGATGAGGAGAC
CKMT1B-RTAGATCCGTGGTGTGCTTCAT
CKB-FCTCATCGACGACCACTTCCT
CKB-RATTGTCATTGTGCCAGATACCG
GAD1-FACAGCCTGGAAGAGAAGAGTC
GAD1-RTTGCGGACATAGTTGAGGAGTA
OXCT2-FGTTCAACGGCGACCACTTC
OXCT2-RCCACCTCCACGATCTCTTCC
RPEL1-FTGCCATCAAACCAGGAACCT
RPEL1-RTGTCAGAACCTACTCCACCATC
GAA-FCGTTCATGCCGCCATACTG
GAA-RTGTAGTCCAGGTCGTTCCAC
AKR1B1-FGATCGCAGCCAAGCACAATA
AKR1B1-RCAGCTCAACAAGGCACAGAC
GALT-FGCGTGATGATCTAGCCTCCA
GALT-RTCTGAGCCTGAGCAAGCATT
UGT2A1-FCCATAGACCAACTCCTCTCACA
UGT2A1-RGAGCAACAAGATCACCACAGAT
TKT-FAGTGATGGCGTTGCTACAGA
TKT-RGACCTGGAAGTCCTCATTGTTG
DHDH-FTCGGGCAGAATTTGGGAAGA
DHDH-RTGGAGGTGAACTGGACACAG
FGGY-FGCTGGCTGTCATCTGTGGA
FGGY-RACTCTGGCATCTGGCTGTG
AMY1B-FCGGCACAGTTATTCGCAAGT
AMY1B-RGTCCTCGTTGATTGTCATGGTT
MGAM-FTGACATACCGCACCACAGG
MGAM-RGCAGCCACCATCTCATCATAC
TREH-FTGCTACTTGACTCACACCAATG
TREH-RAGCGATTCAGGAGGTAGTTCTT
HKDC1-FGATGTGGTGAGCCGTCTGA
HKDC1-RTGCCAGTTCCGATGATGACA
CH25H-FGCTACAAGATCCACCCTGACT
CH25H-RTGCCACACGAAGAACTCCAT
CYP3A7-FTGCTCTAGTCAGAGTCCTTCAG
CYP3A7-RGGCTCCACTTACGGTCTCAT
AKR1C3-FGATGGTCACTTCATGCCTGTC
AKR1C3-RCAGTCCAACCTGCTCCTCAT
SULT2B1-FTCGGATGAAGGGCAAAGACA
SULT2B1-RAGCAGCGTGTAGTTGGACAT
GPAT3-FCTGGTTCTCGGCTTCATCCT
GPAT3-RCTCAAAGTCCCTTCCTCGTAGA
DGKQ-FCGTTCTCCGTACTGCTGTCT
DGKQ-RGTCTGCCGTGTCGTTCTCT
CEL-FCACATCTTCGCCAGCATCG
CEL-RAGTCCACCACAGTCTTCTTCTT
TRPV6-FGCCGAGATGAGCAGAACCT
TRPV6-RCAGCCTCCATCAGCACCAT
FXYD2-FGTGGACCCGTTCTACTATGACT
FXYD2-RATCTTCTGCTGAGGAGGATGAG
SLC43A3-FCTGGTGTGGCTGTCTGTGA
SLC43A3-RTGCTTCCTTCTGGTACTTCTGT
SLC26A6-FATCTTGCTGAACCTGGACCTT
SLC26A6-RCCACACCACACCTCTGCTT
PLB1-FTTGTGGATTCAGGCTCAAGAAC
PLB1-RGAGAGGAGAACCGTGCTAAGT
TCN2-FCTCTACCTGCTCGCTCTCAG
TCN2-RTTGTCCACCACGCTGTCAT
CUBN-FTCAGCAAGGATGTGGTGGTT
CUBN-RGTTCCAGCCAAGTTCGCATT
PLPP3-FCTTCGTGTCTGACCTCTTCAAG
PLPP3-RTGTTGTGGTGATTGTTCCTGTC
MTTP-FTGACAGCAGCATTATCCTCCA
MTTP-RCAGCCTTCATTCTGACACAACT
SLC27A1-FACCACAGGCACCTTCAAGAT
SLC27A1-RCCGAGCAGATGCGAGTGTA
LTB4R-FTCACTATGTCTGCGGAGTCAG
LTB4R-RAGCACAGGCTCATGTTCGT
KCNN4-FATGCTGCTGCGTCTCTACC
KCNN4-RGCGGAAGCGGACTTGATTG
SLC7A8-FGCCTTCCTGCTGGTCTTCA
SLC7A8-RATGTCCTCATTAGCCTCCTCTG
PIK3R2-FCACTTGGAAGAGCAGGAGGT
PIK3R2-RAAGCATCTCGGACTAGGAAGG
Table 2. Summary of transcriptome sequencing data statistics.
Sample_NameRaw_ReadsClean_ReadsQ20 (%)Q30 (%)
EM148,596,85447,342,49898.795.67
EM243,440,29842,454,23098.6995.65
EM357,191,98255,852,07898.8396.09
NC167,290,31666,527,49298.8396.06
NC261,570,63060,938,36698.7295.68
NC342,081,76240,672,60698.7195.66
Sequencing yielded > 96% clean reads across all samples, with Q20 > 98.7% and Q30 > 95.6%, indicating high base-calling accuracy. EM3 showed the greatest depth and quality. No quality differences were noted between EM and NC groups.
Table 3. Statistics of clean reads alignment rate to the reference genome.
Sample NameTotal ReadsTotal MappedMultiple MappedUniquely Mapped
EM147,342,49846,430,209 (98.07%)1,632,481 (3.45%)44,797,728 (94.62%)
EM242,454,23041,558,282 (97.89%)1,555,859 (3.66%)40,002,423 (94.22%)
EM355,852,07854,868,973 (98.24%)1,797,530 (3.22%)53,071,443 (95.02%)
NC166,527,49265,366,885 (98.26%)2,191,223 (3.29%)63,175,662 (94.96%)
NC260,938,36659,887,762 (98.28%)2,008,530 (3.3%)57,879,232 (94.98%)
NC340,672,60639,918,832 (98.15%)1,277,923 (3.14%)38,640,909 (95%)
Over 97.8% of clean reads were mapped to the reference genome, with more than 94% uniquely aligned and low multiple mapping rates (3.1–3.7%), reflecting high sequencing accuracy.
Table 4. Enrichment of differentially expressed genes in KEGG pathways related to lactation.
CategoryKEGG PathwayDEGs
Amino acid metabolismCysteine and methionine metabolismPSAT1, MPST, MTAP
Glycine, serine, and threonine metabolismGAMT, MAOB, GRHPR
Valine, leucine, and isoleucine degradationAACS, ACAT2, HMGCLL1
Arginine and proline metabolismPRODH, CKB, CKMT1B
Carbohydrate
metabolism
Butanoate metabolismGAD1, OXCT2, AACS
Pentose phosphate pathwayTKT, RPEL1
Galactose metabolismAKR1B15, AKR1B1, GALT
Pentose and glucuronate interconversionsFGGY, UGT2A1, DHDH
Starch and sucrose metabolismAMY1B, MGAM, TREH, HKDC1
Lipid metabolismPrimary bile acid biosynthesisCH25H, CYP27A1
Steroid hormone biosynthesisCYP3A7, UGT2A1, AKR1C3, SULT2B1
Glycerolipid metabolismCEL, DGKQ
Material absorptionMineral absorptionTRPV6, FXYD2, SLC26A6
Vitamin digestion and absorptionPLB1, TCN2, CUBN
Fat digestion and absorptionCEL, SLC27A1, PLPP3, MTTP
Protein digestion and absorptionSLC7A8, KCNN4, LTB4R
Carbohydrate digestion and absorptionPIK3R2, MGAM, HKDC1, AMY1B
Table 5. The lactation-related differential metabolites were enriched into the KEGG signaling pathway database.
Pathway IDPathway NameHitsCompound Namep-Value
hsa04978Mineral absorption4L-Alanine; L-Methionine; L-Asparagine; L-Valine0.007
hsa04974Protein digestion and absorption5L-Alanine; L-Methionine; L-Asparagine; L-Valine; Tyramine0.008
hsa00290Valine, leucine and isoleucine biosynthesis32-Ketobutyric acid; L-Valine; D-erythro-3-Methylmalate0.023
hsa00270Cysteine and methionine metabolism5L-Alanine; L-Methionine; 2-Ketobutyric acid; S-Adenosylmethioninamine; Methionine sulfoxide0.034
hsa00970Aminoacyl-tRNA biosynthesis4L-Alanine; L-Methionine; L-Asparagine; L-Valine0.051
hsa00051Fructose and mannose metabolism4Fructose 1,6-bisphosphate; D-Tagatose 1-phosphate; 2-dehydro-3-deoxy-L-rhamnonate; L-Fucono-1,5-lactone0.060
hsa02010ABC transporters7L-Alanine; L-Valine; Adenosine; Uridine; Phthalic acid; Xanthosine; Nickel cation0.081
hsa04152AMPK signaling pathway2Fructose 1,6-bisphosphate; AICAR0.127
hsa00250Alanine, aspartate and glutamate metabolism2L-Alanine; L-Asparagine0.175
hsa00750Vitamin B6 metabolism2D-Ribose 5-phosphate; 4-Pyridoxic acid0.185
hsa00330Arginine and proline metabolism3S-Adenosylmethioninamine; N(omega)-Hydroxyarginine; cis-3-Hydroxy-DL-proline0.288
hsa04975Fat digestion and absorption1Coenzyme A0.301
hsa00564Glycerophospholipid metabolism2Citicoline; Demanyl phosphate0.453
hsa00450
Selenocompound metabolism1L-Alanine0.526
hsa00470D-Amino acid metabolism2L-Alanine; L-Methionine0.564
hsa00400Phenylalanine, tyrosine and tryptophan biosynthesis1Fructose 1,6-bisphosphate0.620
hsa00500Starch and sucrose metabolism13-Ketosucrose0.641
hsa04977Vitamin digestion and absorption1Coenzyme A0.660
hsa00340Histidine metabolism1AICAR0.728
hsa00260Glycine, serine and threonine metabolism12-Ketobutyric acid0.735
hsa00360Phenylalanine metabolism12-Phenylethanol0.743
hsa00350Tyrosine metabolism1Tyramine0.886
Differential metabolites related to lactation were enriched in KEGG pathways, mainly involving amino acid metabolism, protein digestion and absorption, and energy-related processes.
Disclaimer/Publisher’s Note: The statements, opinions and data contained in all publications are solely those of the individual author(s) and contributor(s) and not of MDPI and/or the editor(s). MDPI and/or the editor(s) disclaim responsibility for any injury to people or property resulting from any ideas, methods, instructions or products referred to in the content.

