Article

The Effects of Dietary Supplementation of Chestnut Tannic Acid on the Growth Performance, Gut Morphology and Microbiota of Weaned Piglets

1
College of Animal Science and Veterinary Medicine, Henan Institute of Science and Technology, Xinxiang 453003, China
2
School of Food Science, Henan Institute of Science and Technology, Xinxiang 453003, China
*
Author to whom correspondence should be addressed.
These authors contributed equally to this work.
Metabolites 2025, 15(7), 477; https://doi.org/10.3390/metabo15070477
Submission received: 30 May 2025 / Revised: 29 June 2025 / Accepted: 12 July 2025 / Published: 15 July 2025
(This article belongs to the Section Animal Metabolism)

Abstract

Background/Objectives: This study investigated the effects of chestnut tannic acid (TA) on the growth performance, the expression of tight junction proteins and the composition of the gut microbiota of weaned piglets, which could provide novel insights into the application of TA in swine production. Methods: In a 42-day trial, 180 healthy, 21-day-old Duroc × Landrace × Yorkshire piglets were randomly assigned to a Control group and four treatment groups (TA1–4), fed commercial diets supplemented with 0, 0.06%, 0.12%, 0.18% or 0.24% TA. Each group had six replicates of six pigs each. Results: The average daily gain in all TA groups, the jejunal and ileal villus height and the villus height-to-crypt depth ratio in the TA3 and TA4 groups were markedly increased (p < 0.05). The mRNA levels of MUC2 and ZO-1 were upregulated in the TA3 group, as were those of MUC4 in the jejunum and ileum and claudin in the duodenum and ileum; glutathione peroxidase and total antioxidant capacity were upregulated in the duodenum and jejunum in the TA3 group, and total superoxide dismutase was increased in all the TA2 groups (p < 0.05). Conversely, the malondialdehyde significantly decreased in all the TA groups (p < 0.05). TA supplementation improved the alpha diversity of the intestinal microflora and augmented probiotic abundance while reducing that of pathogenic bacteria. The contents of acetic, isobutyric, valeric, isovaleric, hexanoic and propionic acids, as well as total short-chain fatty acids (SCFA), were higher in the TA2 and TA3 groups (p < 0.05). Conclusions: TA inclusion in piglet diets improved the intestinal environment by upregulating the antioxidant enzymes, improving intestinal morphology and promoting probiotic growth and SCFA production while reducing pathogenic bacterial abundance, consequently enhancing the gut barrier and the growth of weaned piglets.

1. Introduction

During weaning, the immune system of piglets is still underdeveloped, and their gut microbiota are imbalanced. Consequently, changes in feed traits and the environment can lead to a decrease in feed intake, impaired digestion and absorption, diarrhea and even death, which seriously affects the economic benefits of pig farms [1]. Farmers have traditionally added antibiotics to the feed of piglets to mitigate weaning stress; however, the long-term overuse of antibiotics has led to growing problems, such as the presence of drug residues in livestock products and bacterial resistance to antibiotics [2]. This underscores the need to find alternative environmentally friendly feed additives to replace antibiotics and alleviate weaning stress in piglets.
Tannins comprise a class of water-soluble polyphenolic compounds widely distributed in different tissues of plants, including the leaves, roots, fruit and epidermis [3]. The structure and content of tannins differ according to the type of plant, the growth phase of the plant and its environment, reflecting its multiple biological functions [4]. Based on their characteristics, tannins are used for a wide range of applications, especially in leather manufacturing [5]. Moreover, studies have shown that tannins have antioxidant, antibacterial, antiviral, anti-inflammatory, antiallergic and vasodilatory properties [6].
Chestnut tannic acid (TA) is mainly obtained from the European chestnut tree (Castanea sativa Mill; CAS number: 1401-55-4). One study demonstrated that TA supplementation affected the intestinal microbiota and short-chain fatty acid (SCFA) production of patients presenting with the diarrheal subtype of irritable bowel syndrome [7]. Liu et al. found that dietary TA supplementation improved the gut morphology and mucosal antioxidative capacity, digestive enzyme activities and volatile fatty acid composition in weaned piglets [8]. Another study showed that the dietary addition of 2 g/kg TA mitigated the reactive oxygen species-mediated damage to gut epithelial cells caused by heat stress in broilers [9]. Nuamah et al. found that the dietary addition of tannin improved the growth performance of weaned piglets by decreasing the feed conversion ratio and increasing the final body weight, as well as increased the serum immune indices and antioxidant capacity using a meta-analysis [10]. Moreover, recent studies have indicated that TA has potential prebiotic properties and can improve animal growth traits and health [11,12]. Nevertheless, the mechanism by which TA modulates the intestinal mucosal barrier and the gut microbiota remains ill-defined.
In this study, we hypothesized that TA could improve intestinal health in weaning piglets by influencing the expression of tight junction proteins and the composition of the gut microbiota. To test this possibility, we evaluated the effects of TA on growth traits, apparent digestibility of nutrients, intestinal morphology, tight junctional protein expression, the gut microbiota and the concentration of SCFAs in weaned piglets. Our findings provide novel insights into the application of chestnut TA in swine production.

2. Materials and Methods

2.1. Animals and Experimental Design

The animals and procedures were approved by the Animal Protection and Utilization Committee of the Henan Institute of Science and Technology, Xinxiang, China (Approval number: LLSC2024063). Tannic acid (70% content), extracted from chestnut wood, was purchased from Silvateam (Via Torre, S. Michele Mondovì, Cuneo, Italy). All animal-related procedures were approved by the Animal Protection and Utilization Committee of Henan Institute of Science and Technology, Xinxiang, China (Approval number 2023 HIST041). The animal experiments were performed at Xinxiang Lvfengyuan Agricultural Development Co., Ltd. (Xinxiang, China). A total of 180 healthy Duroc × Landrace × Yorkshire weaned piglets (average weight: 6.2 ± 0.13 kg; weanling age: 21 days; male and female in half) were provided by Xinxiang Lvfengyuan Agricultural Development Co., Ltd. and randomly divided into 5 groups, namely a Control group, fed a commercially available diet, and four TA treatment groups (TA1–4), fed the same diet but supplemented with 0.06%, 0.12%, 0.18% or 0.24% TA. Each group contained six replicates, with six pigs per replicate (sex-balanced). The dosage of TA added was selected based on previous studies [11,12]. The trial lasted for 49 days, including a 7-day pre-trial period. The basic diet was designed to meet the nutritional needs of weaned piglets according to National Research Council guidelines [13]. The ingredients and nutritional levels are listed in Supplementary Table S1. Throughout the trial, all pigs were reared in the same pigsty with good ventilation and under an appropriate temperature (23 ± 2 °C) and relative humidity (40–60%). All piglets had free access to feed and water. Management, disinfection, vaccination and deworming were performed according to the procedures of the pig farm. At the start and finish of the trial, all piglets were weighed, while their feed consumption was repeatedly recorded. Subsequently, the average daily gain (ADG), average daily feed intake (ADFI) and feed-to-gain ratio (F/G) of the piglets were determined. The incidence and severity of diarrhea in piglets were recorded throughout the experiment and were evaluated through fecal consistency scores at 08:00 and 17:00 h daily according to the criteria in Supplementary Table S2.

2.2. Sample Collection

At the end of the trial, the piglets were fasted for 12 h while retaining free access to water. Two piglets (one male and one female) per replicate, with a body weight close to the average for their replicate, were selected for euthanasia according to the procedures of the slaughterhouse. After slaughter, the abdominal cavity of the animals was immediately opened, and the intestine was separated. A 10 cm section was collected from the middle segment of the duodenum, jejunum and ileum. Each intestinal segment was cut longitudinally, and the intestinal contents were rinsed with normal pre-cooled, sterile saline. Approximately 2 cm of each segment were then sampled, fixed in a 4% paraformaldehyde solution and kept at room temperature for morphological analysis. After scraping with a sterilized slide on an ice bath, the gut mucosa of the remaining samples was placed in RNA-free tubes, immediately frozen in liquid nitrogen and stored at −80 °C for the determination of gene expression levels and antioxidant properties.
After excising the cecum, the contents of the middle part were dispensed into 1.5 mL sterile tubes and kept at −80 °C for analysis of cecal microbiota and SCFA contents.

2.3. Analysis of Intestinal Morphology

The jejunal and ileal samples previously fixed in 4% paraformaldehyde were washed overnight with distilled water, dehydrated with ethanol, embedded in paraffin, sliced and stained with hematoxylin and eosin. Finally, the villus height (VH) and crypt depth (CD) were observed and imaged with a light microscope (TE2000-S, Nikon, Tokyo, Japan), and the villus height-to-crypt depth (V/C) ratio was determined.

2.4. Analysis of Antioxidant Properties

After thawing, the intestinal mucosal samples were added to a pre-cooled normal saline (V: W = 9:1), homogenized in an ice-water bath for 2 min and then centrifuged at 4 °C and 3500 r/min for 10 min (Avanti J-E, Beckman Coulter, Inc., Brea, CA, USA). The supernatant was collected and used to measure the antioxidant parameters (malondialdehyde (MDA) contents, total superoxide dismutase (T-SOD) and glutathione peroxidase (GSH-Px) activities and total antioxidant capacity (T-AOC)) using the respective ELISA kits (Nanjing Jiancheng Institute of Biotechnology Co., Ltd., Nanjing, China).

2.5. Quantitative Real-Time PCR (qPCR)

Frozen samples of the intestinal mucosa were homogenized in 1 mL of Trizol reagent (TaKaRa, Beijing, China) for total RNA extraction. RNA concentration and quality were analyzed using a NanoDropND-1000 spectrophotometer (Thermo Fisher Scientific, Waltham, MA, USA). Reverse transcription was performed with the PrimeScript RT reagent Kit with gDNA Eraser (TaKaRa, Beijing, China) following the kit instructions. The relative levels of mRNAs of gut mucosal barrier-related genes were detected by qPCR and determined using the 2−ΔΔCt method. β-Actin served as the housekeeping gene. The sequences of the primers used for qPCR are presented in Supplementary Table S3, and their validation results were shown in Supplementary Figure S1.

2.6. Cecal Microbiota Assay

Total cecal bacterial DNA was extracted using the Omega Soil DNA Kit (v.D5625-01) (Omega Bio Tek, Norcross, GA, USA). Total DNA concentrations were evaluated using a NanoDropND-1000 spectrophotometer (Thermo Fisher Science). The V3–V4 hypervariable region of the bacterial 16S rRNA gene was PCR-amplified with forward primer 338F (5′-ACTCCTACGGGAGGCAGCA-3′) and reverse primer 806R (5′-GACTACHVGGGTWTCTAAT-3′). The obtained DNA fragments were sequenced on the Illumina NovaSeq6000 platform by Shanghai Paiseno Biotechnology Co., Ltd. (Shanghai, China).
The obtained raw tags were spliced and filtered to obtain clean tags. USEARCH (v.7.0.1090, https://drive5.com/usearch/(accessed on 15 September 2024) was used for clustering at ≥97% similarity, yielding representative operational taxonomic unit (OTU) sequences. The OTUs were compared to the Greengene database using RDP classifier (v.2.2) [14] for species annotation. D Species diversity and evenness were evaluated based on the alpha diversity index, and the t-test was used to assess the significance of inter-group differences using QIIME2 (version 2019.4) [15]. Beta diversity analysis was employed to evaluate the differences in species composition within and between groups with R packages Vegan (version v.3.2.0) [16]. Principal component analysis (PCA) based on OTU physical distances and principal coordinate analysis (PCoA) according to unweighted UniFrac distances were performed to visualize sample distribution. The significance of differences in microbial community structure between groups was evaluated using PERMANOVA (Adonis/PERMANOVA analysis). Linear discriminant analysis (LDA) effects size (LefSe) was used to identify marker species in each group using the Mann–Whitney test (LDA score ≥ 2) [17].

2.7. Assay for SCFAs in Cecal Contents

The SCFAs in cecal contents were separated and detected with an Agilent 1260 Infinity HPLC system (Agilent Technologies, Santa Clara, CA, USA) coupled to a SCIEX QTRAP 4500 mass spectrometer (Applied Biosystems, Framingham, MA, USA). Helium was used as the carrier gas, and the flow rate was 1 mL/min. The temperature program was set as follows: the initial temperature was 90 °C, ramping up to 100 °C at 20 °C/min, to 150 °C at 5 °C/min; then to 250 °C at 20 °C/min and held for 2 min [17]. The values of SCFAs were indicated by μg/g dry matter (DM).

2.8. Statistical Analysis

The trial data were analyzed with SPSS 22.0 software. One-way ANOVA was performed to determine the effects of the different concentrations of TA in the feed on a variety of indicators in the weaned piglets. Duncan’s method was used for multiple comparisons. All data are presented as means ± SEM, with p < 0.05 indicating significant differences.

3. Results

3.1. Growth Performance

As shown in Table 1, no differences in the initial body weight or F/G ratio were found among the groups (p > 0.05). Compared with the Control group, the final body weight and ADG of the weaned piglets were higher in all TA groups, while the ADFI was higher in the TA2, TA3 and TA4 groups (p < 0.05). Furthermore, the diarrhea index scores in the TA2 and TA3 groups were markedly reduced compared with those in the Control group (p < 0.05). The highest ADG, F/G and ADFI and lowest diarrhea index were found in the TA3 group. Interestingly, the effect on ADG of the TA4 group was lower with the TA3 group (p < 0.05).

3.2. Intestinal Morphology and Barrier Function

As shown in Table 2, compared with the Control group, the VH and V/C ratio was significantly increased in the jejunum of the TA2, TA3 and TA4 groups, and the ileum of all TA groups (p < 0.05), with the most prominent effect recorded in the TA3 group. No differences in the jejunal or ileal CD were detected among the groups (p > 0.05).
As shown in Figure 1A, compared with the Control group, the mRNA expression levels of MUC2 were significantly upregulated in the TA2 and TA3 groups; similarly, claudin mRNA levels were increased in all the TA treatment groups, as were those of ZO-1 in the TA3 group in the duodenum (p < 0.05). Additionally, in the jejunum (Figure 1B), compared with the Control group, the mRNA level of MUC2 was significantly upregulated in the TA2 and TA3 groups, and that of MUC4 was notably increased in the TA2, TA3 and TA4 groups, while ZO-1 transcript levels were markedly higher in all the TA treatment groups (p < 0.05). In the ileum (Figure 1C), the MUC2 and MUC4 mRNA expression levels were considerably upregulated in the TA3 and TA4 groups; claudin mRNA levels were significantly increased in the TA2, TA3 and TA4 groups; and ZO-1 expression levels were markedly higher in piglets of all the TA groups than in those of the Control group (p < 0.05). However, no differences in the mRNA levels of MUC4 in the duodenum or claudin in the jejunum were observed among the groups (p > 0.05).

3.3. Antioxidant Capacity

As shown in Table 3, compared with the Control group, the MDA tended to decrease in all the TA groups (p < 0.05); T-SOD activities were higher in the TA3 group (p < 0.05); GSH-Px and the T-AOC was significantly increased in the TA3 groups in the duodenum and jejunum (p < 0.05). Meanwhile, TA3 consistently enhanced T-SOD, GSH-Px (except Ileum) and T-AOC (except Ileum), and reduced MDA (p > 0.05). However, no differences in GSH-Px or T-AOC in the ileum were found among the groups (p > 0.05).

3.4. Cecal Microbiota

3.4.1. Analysis of Cecal Floral Abundance

As shown in Figure 2A, the species accumulation curve gradually flattened, indicating that the sequencing depth was sufficient to capture nearly all the species in the samples and adequately reflected species diversity. Additionally, 205 OTUs were shared among the groups, while 1902, 2086, 2455, 3074 and 1669 OTUs were unique to the Control, TA1, TA2, TA3 and TA4 groups, respectively (Figure 2B).

3.4.2. Analysis of the Alpha Diversity in the Cecal Flora

As shown in Table 4, compared with the control group, the Chao1 index was significantly higher in all the TA supplementation groups. Furthermore, the number of observed species was higher in the TA2 and TA3 groups than in the Control group, as was Faith’s-PD index in the TA3 group (p < 0.05). However, no differences in the Pielou, Shannon, Simpson or Good’s coverage indices were detected among the groups (p > 0.05).

3.4.3. Analysis of Beta Diversity in the Cecal Flora

As depicted in Figure 3A, principal component (PC) 1 and PC2 contributed 17.2% and 14.6% to the observed variance, respectively. Non-metric multidimensional scaling (NMDS) was employed to analyze species information in the samples in the form of dots, with the distance between the dots reflecting the degree of variation within and between groups (Figure 3B). A stress value of 0.18 was obtained in the NMDS analysis, which was less than the threshold of 0.20, indicating that NMDS accurately represented the degree of variation between samples.

3.4.4. Analysis of Cecal Flora Composition

The major taxa of the cecal microbiota of the piglets at the phylum level are shown in Table 5. Firmicutes and Bacteroidetes were the dominant phyla, accounting for more than 92% of the classified phyla. Compared to the Control group, the relative abundances of Firmicutes were higher in all the TA groups, while those of Bacteroidetes and Proteobacteria was lower in the TA2, TA3 and TA4 groups (p < 0.05). No differences in the relative abundances of Actinobacteria or Tenericutes were found among the groups (p > 0.05).
At the family level, the top six core cecal flora in the piglets were, in order of abundance, Lactobacillaceae, Prevotellaceae, Ruminococcaceae, Lachnospiraceae, Clostridiaceae and Streptococcaceae. The relative abundance of Lactobacillaceae was significantly higher in the TA2 and TA3 groups than in the Control group, as was that of Ruminococcaceae in the TA1, TA3 and TA4 groups and that of Clostridiaceae in all the TA groups. In contrast, the abundance of Prevotellaceae was notably lower in the TA2, TA3 and TA4 groups than in the Control group (p < 0.05). No differences in the relative abundance of Lachnospiraceae or Streptococcaceae were found among the groups (p > 0.05) (Table 6).
As shown in Table 7, at the genus level, the dominant cecal flora were Lactobacillus, Prevotella, Gemmiger, Streptococcus, Blautia, SMB53, Roseburia and Faecalibacterium, in order of abundance. There were no differences in the relative abundances of Gemmiger, Streptococcus, Blautia and Roseburia among the groups (p > 0.05). Additionally, the abundance of Lactobacillus was higher in the TA2 and TA3 groups than in the Control group, and a similar trend was observed for SMB53 in the TA3 and TA4 groups and Faecalibacterium in the TA1 and TA3 groups (p < 0.05). However, the prevalence of Prevotella was lower in piglets of the TA2, TA3 and TA4 groups than in those of the Control group (p < 0.05).

3.4.5. LefSe Species Variance Analysis

LefSe analysis revealed five distinct groups of significantly enriched biomarkers (LDA scores > 2.0, p < 0.05) in the cecal flora. As illustrated in Figure 4, the Control group exhibited the highest relative abundances of Slackia and Gollinsella. Meanwhile, Gemmiger and Oscillospira were most prevalent in the TA1 group; Lactobacillaceae, Lactobacillus, Lactobacillales and Bacilli dominated the TA2 group; the TA3 group showed the highest levels of Clostridiaceae, SMB53, Clostridium, Desulfovibrio, Deliaproterobacteria, Desulfovibrionales, Desulfovibrionaceae and Peptostreptococaceae; and Clostridia, Clostridiales, Lachnospiraceae, rc4_4, Peptococcaceae and Escherichia were most abundant in the TA4 group.

3.5. Analysis of SCFAs in Cecal Contents

The effects of TA on SCFA production in the cecum of the piglets are demonstrated in Table 8. The contents of acetic acid, isobutyric acid, valeric acid and total SCFAs were higher in the TA2 and TA3 groups than in the Control group, as were those of isovaleric acid and hexanoic acid in the TA2, TA3 and TA4 groups and propionic acid in the TA1, TA2 and TA3 groups (p < 0.05). However, no significant difference in the level of butyric acid was found among the groups (p > 0.05).

4. Discussion

Traditionally, dietary TA has been viewed as an antinutritional factor that negatively impacts animal feed intake and growth performance [18]. A study by Schiavone et al. showed that growth performance was significantly improved in broilers fed 0.2% natural extract of chestnut wood, with no adverse effects on organ health being detected [19]. In line with these reports, we observed that the dietary inclusion of 0.18% TA (TA3 group) significantly improved the ADG, while simultaneously decreasing diarrhea index scores in weaned piglets. However, some negative effects were noted with the addition of 0.24% TA (TA4 group) to the diet. This may be due to the ability of tannic acid to bind starch, proteins and digestive enzymes to form insoluble complexes, resulting in higher levels of tannic acid in diets that reduce palatability, nutrient digestibility and growth.
Villus height, crypt depth and their ratio are commonly used parameters for evaluating gut function and absorption status [20,21]. Zhao et al. found that the addition of 0.1% tannins to the diet of Hu sheep increased the VH in the jejunum and ileum and had a tendency to decrease CD in the ileum [22]. A separate study revealed that adding 0.2% TA to the diet decreased the CD and increased the V/C ratio in the duodenum, while 1.0% TA tended to reduce CD and VH in the ileum [12]. Our findings showed that supplementing the diet of weaned piglets with an appropriate amount of TA improved the VH and the V/C ratio and exerted a positive effect on the morphology of the gut mucosa. In turn, this enhanced the growth and intestinal health of the weaned piglets, with the best effect being achieved with the addition of 0.18% TA. Meanwhile, there was a dose-dependent effect of TA, with a reduced efficacy of TA4 (0.24%) indicating a dose-dependent threshold.
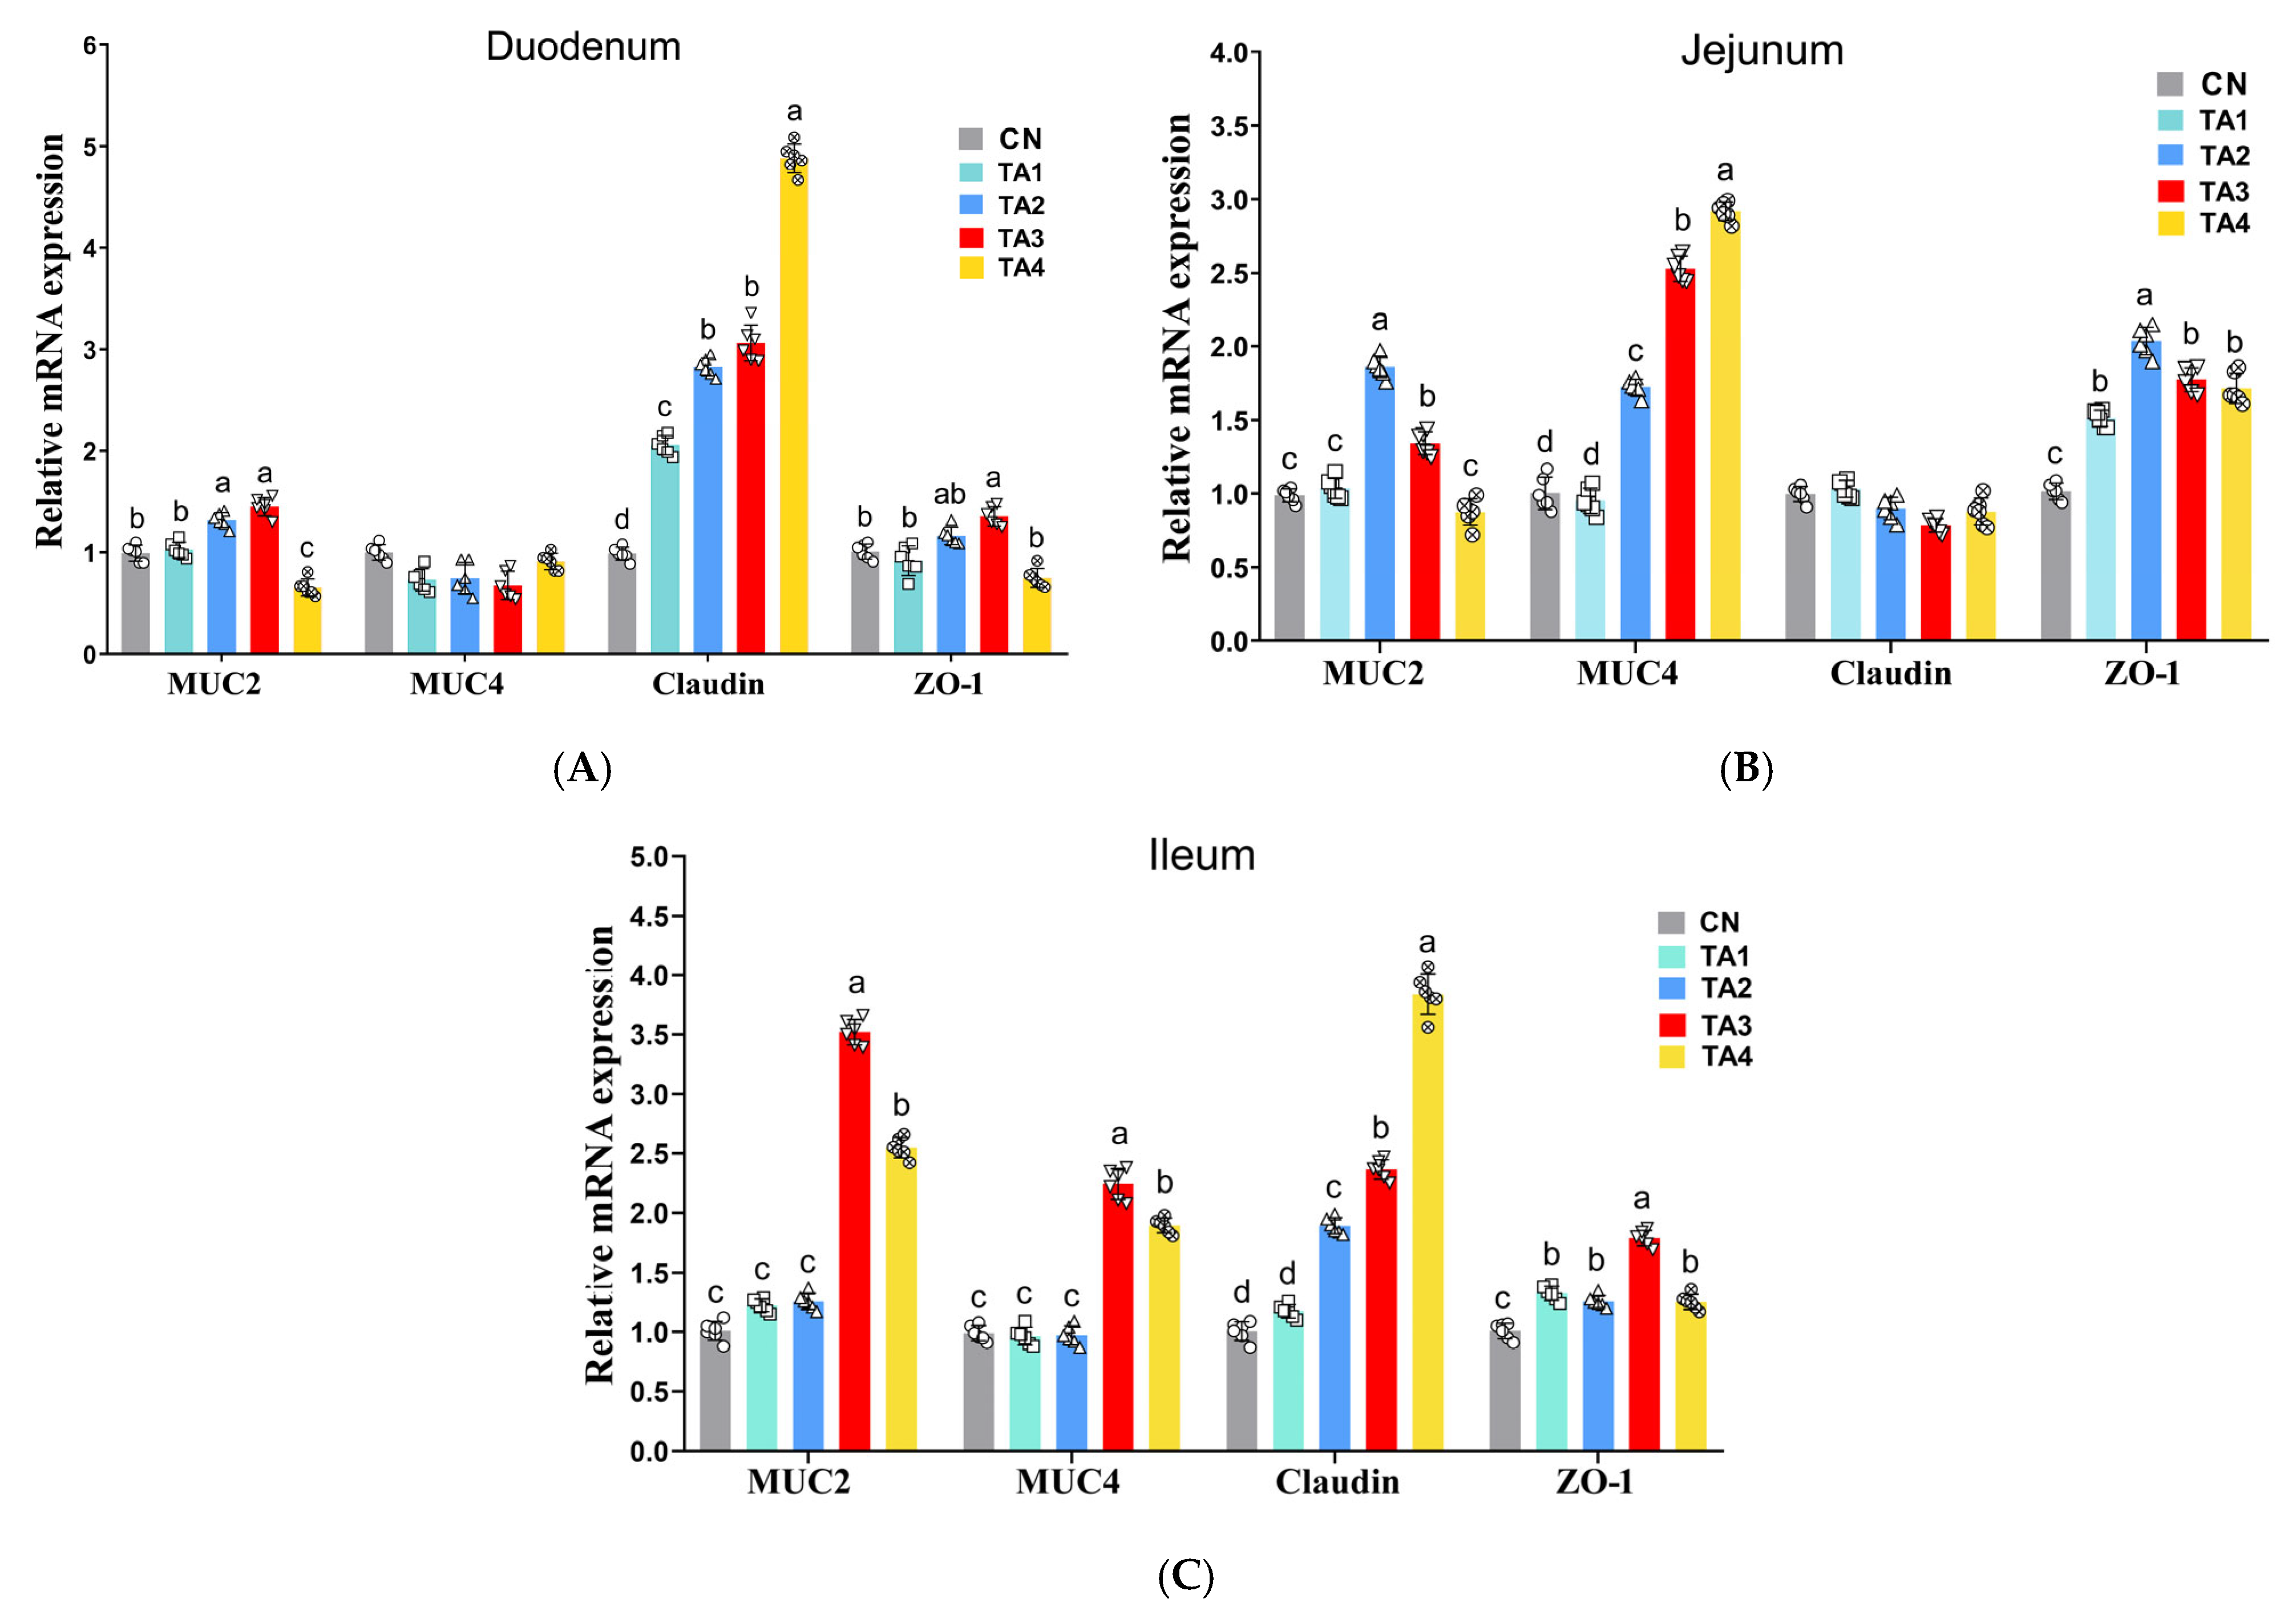
Tight junction proteins and mucins are essential components of the intestinal barrier, and a decrease in their expression can lead to increased intestinal permeability and inflammation [23]. Research has shown that early weaning in piglets is often accompanied by a reduction in tight junction protein levels, an increase in intestinal permeability and the occurrence of diarrhea [1]. Our findings suggested that TA supplementation in piglet diets upregulated the expression of ZO-1, claudin, MUC2 and MUC4 in the intestine of weaned piglets, implying that TA can alleviate weaning stress-induced damage in the gut barrier.
Weaning readily leads to excessive free radical production and oxidative stress in piglets [24]. The activities of T-SOD and GSH-Px, along with T-AOC and MDA levels, serve as important indicators for assessing antioxidant capacity [25]. Our findings showed that adding TA to the diet of weaned piglets improved GSH-Px activity and T-AOC in the duodenum and jejunum, increased T-SOD activity in the intestine and tended to lower MDA generation. Again, 0.18% was found to be the optimal TA supplementation level. These findings suggest that TA improves intestinal morphology and barrier integrity, at least in part by enhancing intestinal antioxidant capacity and reducing intestinal damage.
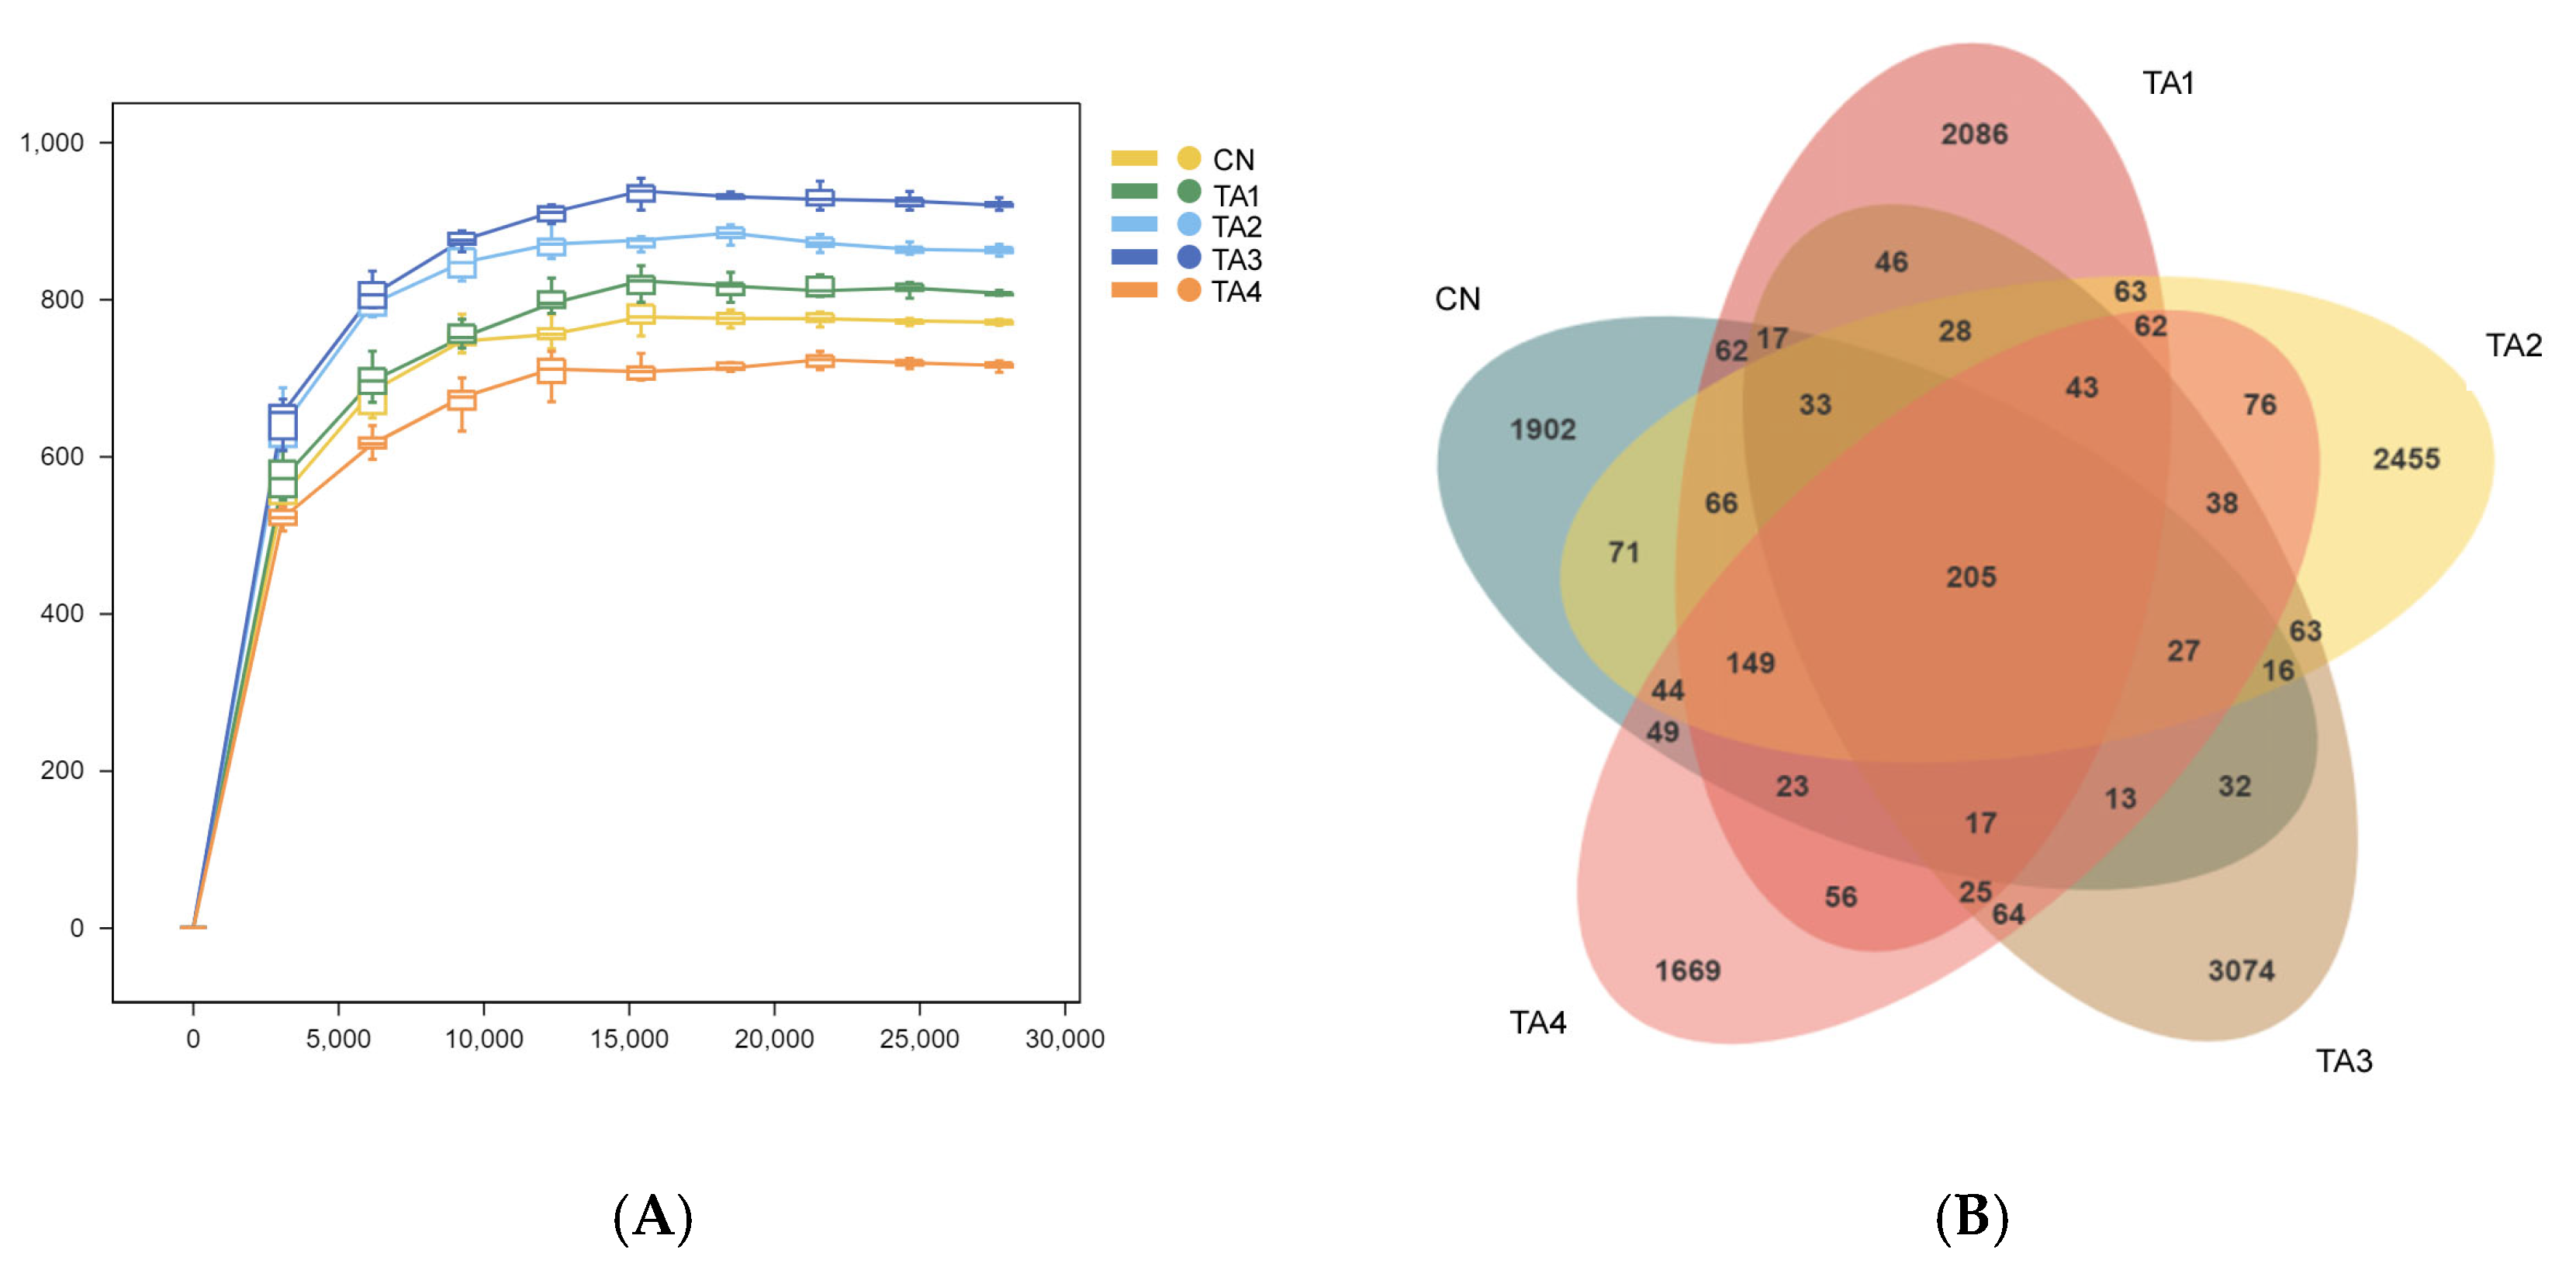
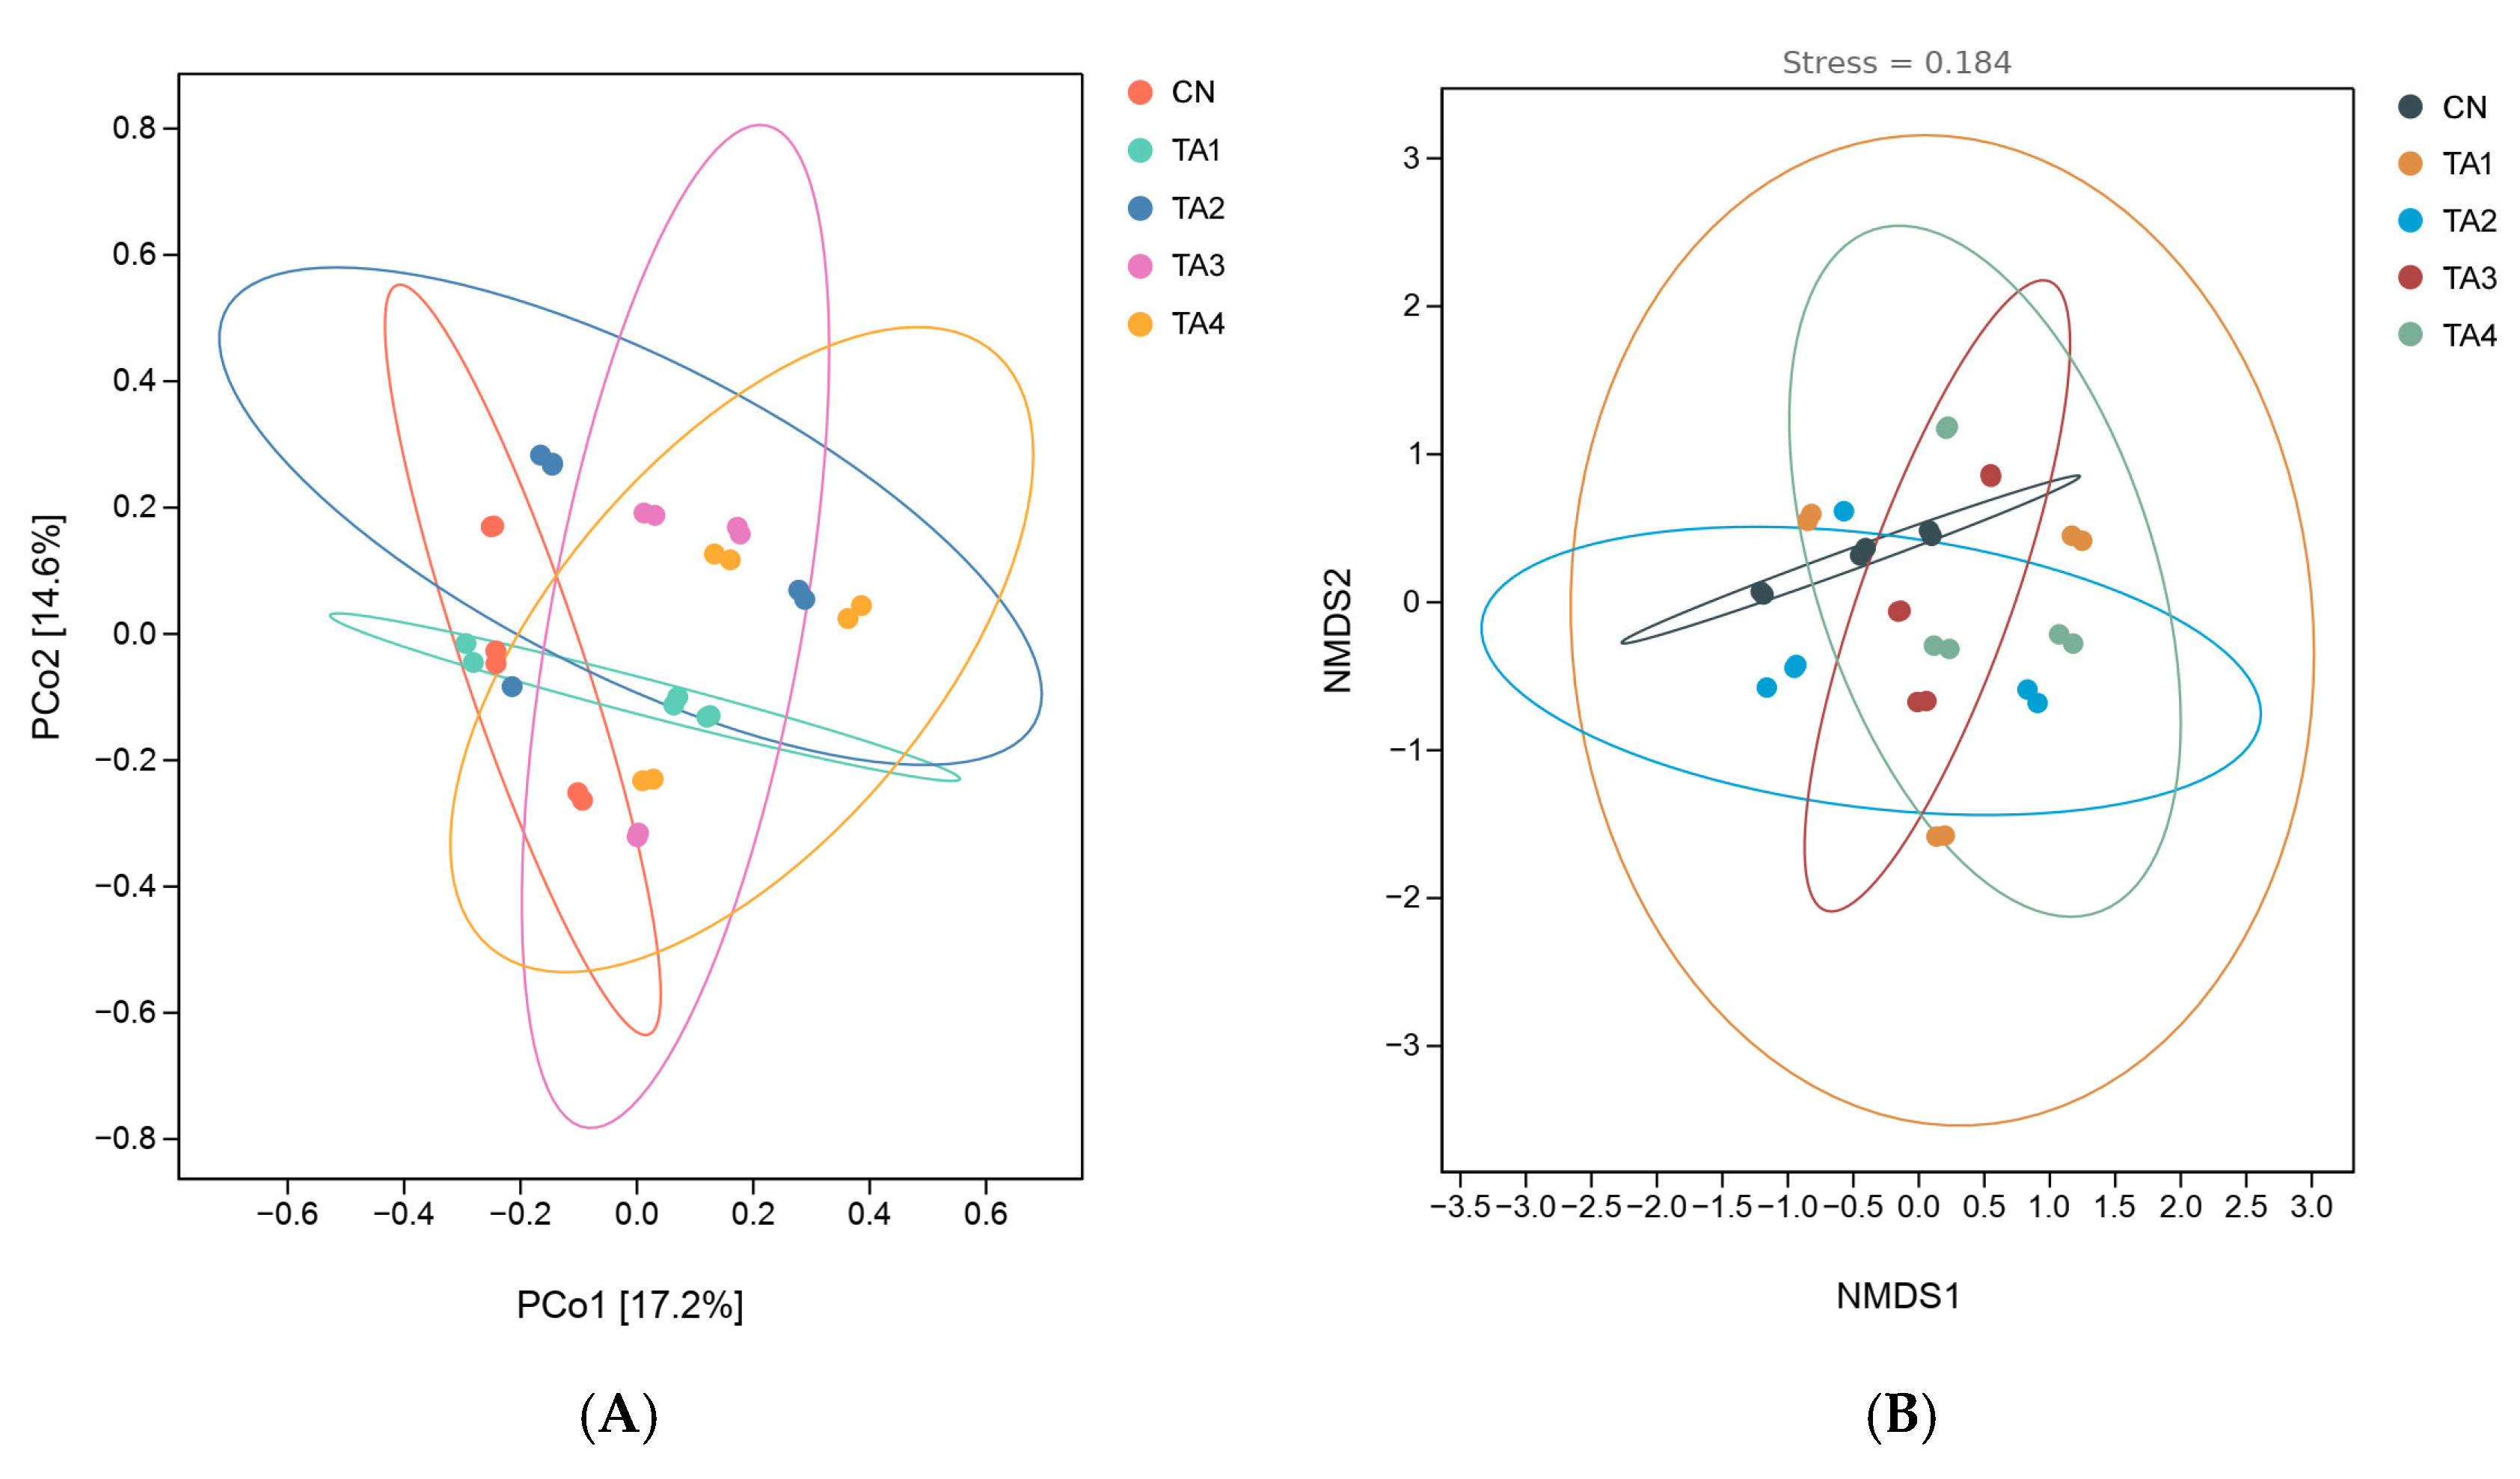
The gut microbiota and their metabolites are closely related to the physiological activities of animals, such as nutrition, metabolism and stress responses [26]. Accordingly, gut dysbiosis is considered to be a key factor responsible for post-weaning diarrhea and intestinal infections. In this study, alpha diversity analysis showed that dietary TA increased the Chao1 and Faith’s PD indexes, which implied that TA increased the diversity of the gut flora in the weaned piglets. In this study, Good’s coverage in each group exceeded 99%, thereby accurately reflecting the community composition of the fecal flora of piglets.
In this work, at the phylum level, we observed that the dominant cecal microbial communities in the piglets were Bacteroidetes and Firmicutes. Firmicutes can break down cellulose and degrade complex macromolecules, thereby improving the body’s immunity, digestion rate and resistance to pathogens. These effects are primarily mediated through the production of SCFAs, which modulate inflammation and serve as an energy source for gut epithelial cells. Bacteroidetes have high polysaccharide-degrading capacity, which contributes to enhanced host immunity and improved intestinal mucosal barrier function [27]. Here, we found that TA supplementation elevated the relative abundance of Firmicutes and the Firmicutes/Bacteroidetes ratio while concurrently reducing the relative abundance of Bacteroidetes. At the family level, the most abundant cecal microorganisms in the weaned piglets were Lactobacillaceae, followed by Prevotellaceae and Ruminococcaceae. Notably, TA addition increased the abundances of Lactobacillaceae and Rumatobacteriaceae and decreased that of Prevotellaceae in the piglet cecum. Lactobacillaceae are the prominent probiotic in the gut and can ameliorate intestinal permeability and barrier function by increasing occludin expression and suppressing the proliferation of harmful bacteria [28]. Prevotellaceae are involved in the regulation of glucose metabolism and were reported to be positively associated with gestational diabetes [29]. Rumatococcaceae are the main microorganisms responsible for transforming primary bile acids into secondary ones, thereby stabilizing the intestinal barrier and reducing gut inflammation [30]. At the genus level, we found that TA elevated the relative abundances of Lactobacillus and SMB53 and reduced that of Prevotella in the cecal flora of the piglets. In pigs, Lactobacillus plays an important part in regulating immunity, sustaining homeostasis and health, aiding digestion and improving growth [25]. SMB53, a member of the Clostridiaceae family, can consume intestinal mucus and plant-derived sugars, suggesting that it is involved in sugar metabolism [31]. Prevotella is an opportunistic pathogen that not only ferments non-starch polysaccharides, yielding SCFAs, but also increases intestinal permeability, which leads to inflammation [32]. LefSe analyses showed that the cecal flora of the weaned piglets in the Control group was rich in Slackia and Collinsella, potentially explaining the occurrence of diarrhea in the piglets. Slackia abundance is notably elevated in chickens with low body weight, and these bacteria promote the deposition of body fat in animals [33]. The influence of Collinsella in glucose-lipid metabolism may be related to its involvement in the inflammatory response and the disruption of the gut mucosal barrier [34]. Piglets in the TA2 group had the highest abundances of Lactobacillaceae, Lactobacillus, Lactobacillales and Bacilli, while the greatest relative abundances of Clostridiaceae, SMB53, Clostridium, Desulfovibrio, Deliaproterobacteria, Desulfovibrionales, Desulfovibrionaceae and Peptostreptococaceae were recorded in the TA3 group. These results suggest that dietary TA supplementation improves gut health and growth in weaned piglets by increasing the abundance of probiotics and lowering that of pathogenic bacteria in the intestinal microbiota.
Short-chain fatty acids, the main metabolites generated by intestinal flora through the fermentation of dietary fiber and starch, are saturated fatty acids with a carbon chain of six or fewer carbon atoms. These include formic, acetic, propionic, butyric, valeric and hexanoic acids, along with their isomers. A previous has demonstrated that SCFAs can promote the growth and maturation of intestinal tissue, maintain the integrity of the gut barrier and mitigate gut inflammation [35]. In this work, we found that dietary TA supplementation led to an increase in the contents of acetic, propionic, isobutyric, hexanoic, valeric and isovaleric acids, as well as in the total SCFA content in the cecum of piglets, indicating that adding TA to the diet exerts a positive effect on the gut flora of weaned piglets. The best effect was seen with the 0.18% TA inclusion level. However, there was no significant change in the content of butyric acid, which was inconsistent with the previous report [8], probably due to the difference in the type and added amount of TA, and the specific reason needs to be further investigated. We speculate that dietary TA improves the intestinal environment in weaned piglets by elevating the production of SCFAs, thereby contributing to improved growth performance.

5. Conclusions

These findings suggest that the inclusion of TA in the diet of weaned piglets improves the intestinal environment by upregulating the antioxidant enzymes, improving intestinal morphology, increasing the abundance of probiotics and the production of SCFAs and reducing the abundance of pathogenic bacteria in the gut microbiota. Collectively, these effects strengthen the intestinal barrier and improve the growth performance of weaned piglets. The 0.18% TA in piglet diets is optimal for enhancing gut health and growth. This study provides novel insights into the application of TA as a feed additive in pig production.

Supplementary Materials

The following supporting information can be downloaded at: https://www.mdpi.com/article/10.3390/metabo15070477/s1. Table S1. The composition and nutritional level of the feed provided to the weaned piglets; Table S2. Fecal scoring criteria in weaned piglets; Table S3. The sequences of the primers used for qPCR; Figure S1. Their validation results of qPCR.

Author Contributions

Conceptualization, J.Z. and Z.M.; methodology, Y.Z. and Y.L.; validation, D.L. and H.X.; formal analysis, Y.W. (Yuya Wang) and M.C.; investigation, H.X. and L.G.; data curation, Y.Z. and Y.W. (Yuya Wang); software, Y.L.; writing—original draft preparation, J.Z. and Y.Z.; writing—review and editing, J.Z., M.C., Y.W. (Yongqiang Wang) and D.L.; visualization, L.G. and Y.W. (Yongqiang Wang); supervision, Z.M.; project administration, Z.M. All authors have read and agreed to the published version of the manuscript.

Funding

This research was funded by the Pig Industry Technology System Innovation Team Project of Henan Province (HARS-22-12-G1), Key Science and Technology Project of Henan Province (232102111039, 252102111001) and Key Scientific Research Projects of Colleges and Universities of Henan Province (23A230005).

Institutional Review Board Statement

The animals and procedures were approved by the Animal Protection and Utilization Committee of the Henan Institute of Science and Technology, Xinxiang, China (Approval number: LLSC2024063; Approval Date 5 March 2024).

Informed Consent Statement

Not applicable.

Data Availability Statement

Dataset available on request from the authors.

Conflicts of Interest

The authors declare no conflicts of interest.

References

  1. Campbell, J.M.; Crenshaw, J.D.; Polo, J. The biological stress of early weaned piglets. J. Anim. Sci. Biotechnol. 2013, 4, 19. [Google Scholar] [CrossRef] [PubMed]
  2. Tang, X.; Xiong, K.; Fang, R.; Li, M. Weaning stress and intestinal health of piglets: A review. Front. Immunol. 2022, 13, 1042778. [Google Scholar] [CrossRef]
  3. Chung, K.T.; Wong, T.Y.; Wei, C.I.; Huang, Y.W.; Lin, Y. Tannins and human health: A review. Crit. Rev. Food. Sci. Nutr. 1998, 38, 421–464. [Google Scholar] [CrossRef]
  4. Kaczmarek, B. Tannic acid with antiviral and antibacterial activity as a promising component of biomaterials-a minireview. Materials 2020, 13, 3224. [Google Scholar] [CrossRef] [PubMed]
  5. Pizzi, A. Tannins: Prospectives and actual industrial applications. Biomolecules 2019, 9, 344. [Google Scholar] [CrossRef]
  6. Jing, W.; Xiaolan, C.; Yu, C.; Feng, Q.; Haifeng, Y. Pharmacological effects and mechanisms of tannic acid. Biomed. Pharmacother. 2022, 154, 113561. [Google Scholar] [CrossRef] [PubMed]
  7. Molino, S.; Lerma-Aguilera, A.; Piskorz, M.M.; López Mingorance, F.; Montero, J.M.; Uehara, T.; Hashimoto, H.; González Ballerga, E.; Olmos, J.A. Tannin-based supplementation influences gut microbiota composition and activity in IBS-D patients with a potential impact on symptoms: A pilot study. Food Funct. 2024, 15, 8893–8903. [Google Scholar] [CrossRef]
  8. Liu, H.; Hu, J.; Mahfuz, S.; Piao, X. Effects of hydrolysable tannins as zinc oxide substitutes on antioxidant status, immune function, intestinal morphology, and digestive enzyme activities in weaned piglets. Animals 2020, 10, 757. [Google Scholar] [CrossRef]
  9. Liu, H.W.; Li, K.; Zhao, J.S.; Deng, W. Effects of chestnut tannins on intestinal morphology, barrier function, pro-inflammatory cytokine expression, microflora and antioxidant capacity in heat-stressed broilers. J. Anim. Physiol. Anim. Nutr. 2018, 102, 717–726. [Google Scholar] [CrossRef]
  10. Nuamah, E.; Poaty Ditengou, J.I.C.; Hirwa, F.; Cheon, I.; Chae, B.; Choi, N.J. Dietary supplementation of tannins: Effect on growth performance, serum antioxidant capacity, and immunoglobins of weaned piglets-a systematic review with meta-analysis. Antioxidants 2024, 13, 236. [Google Scholar] [CrossRef]
  11. Biagia, G.; Cipollini, I.; Paulicks, B.R.; Roth, F.X. Effect of tannins on growth performance and intestinal ecosystem in weaned piglets. Arch. Anim. Nutr. 2010, 64, 121–135. [Google Scholar] [CrossRef] [PubMed]
  12. Yu, J.; Song, Y.; Yu, B.; He, J.; Zheng, P.; Mao, X.; Huang, Z.; Luo, Y.; Luo, J.; Yan, H.; et al. Tannic acid prevents post-weaning diarrhea by improving intestinal barrier integrity and function in weaned piglets. J. Anim. Sci. Biotechnol. 2020, 11, 87. [Google Scholar] [CrossRef] [PubMed]
  13. National Research Council. Nutrient Requirements of Swine, 11th ed.; National Academies Press: Washington, DC, USA, 2012. [Google Scholar]
  14. Wang, Q.; Cole, J.R. Updated RDP taxonomy and RDP Classifier for more accurate taxonomic classification. Microbiol. Resour. Announc. 2024, 13, e0106323. [Google Scholar] [CrossRef]
  15. Hall, M.; Beiko, R.G. 16S rRNA gene analysis with QIIME2. Methods Mol. Biol. 2018, 1849, 113–129. [Google Scholar] [PubMed]
  16. Wen, T.; Niu, G.; Chen, T.; Shen, Q.; Yuan, J.; Liu, Y.X. The best practice for microbiome analysis using R. Protein Cell 2023, 14, 713–725. [Google Scholar] [CrossRef]
  17. Liang, J.; Kou, S.; Chen, C.; Raza, S.H.A.; Wang, S.; Ma, X.; Zhang, W.J.; Nie, C. Effects of Clostridium butyricum on growth performance, metabonomics and intestinal microbial differences of weaned piglets. BMC Microbiol. 2021, 1, 5. [Google Scholar] [CrossRef]
  18. Smulikowska, S.; Pastuszewska, B.; Święch, E.; Ochtabińska, A.; Mieczkowska, A.; Nguyen, V.C.; Buraczewska, L. Tannin content affects negatively nutritive value of pea for monogastrics. J. Anim. Feed. Sci. 2001, 10, 511–523. [Google Scholar] [CrossRef]
  19. Schiavone, A.; Guo, K.; Tassone, S.; Gasco, L.; Hernandez, E.; Denti, R.; Zoccarato, I. Effects of a natural extract of chestnut wood on digestibility, performance traits, and nitrogen balance of broiler chicks. Poult. Sci. 2008, 87, 521–527. [Google Scholar] [CrossRef]
  20. Antongiovanni, M.; Minieri, S.; Petacchi, F. Effect of tannin supplementation on nitrogen digestibility and retention in growing pigs. Ital. J. Anim. Sci. 2016, 6, 245–247. [Google Scholar] [CrossRef]
  21. Tang, X.; Xiong, K. Intrauterine growth retardation affects intestinal health of suckling piglets via altering intestinal antioxidant capacity, glucose uptake, tight junction, and immune responses. Oxidative Med. Cell. Longev. 2022, 2022, 2644205. [Google Scholar] [CrossRef]
  22. Zhao, M.D.; Di, L.F.; Tang, Z.Y.; Jiang, W.; Li, C.Y. Effect of tannins and cellulase on growth performance, nutrients digestibility, blood profiles, intestinal morphology and carcass characteristics in Hu sheep. Asian-Australas J. Anim. Sci. 2019, 32, 1540–1547. [Google Scholar] [CrossRef] [PubMed]
  23. Horowitz, A.; Chanez-Paredes, S.D.; Haest, X.; Turner, J.R. Paracellular permeability and tight junction regulation in gut health and disease. Nat. Rev. Gastroenterol. Hepatol. 2023, 20, 417–432. [Google Scholar] [CrossRef] [PubMed]
  24. Upadhaya, S.D.; Kim, I.H. The impact of weaning stress on gut health and the mechanistic aspects of several feed additives contributing to improved gut health function in weanling piglets-a review. Animals 2021, 11, 2418. [Google Scholar] [CrossRef]
  25. Han, H.; Liu, Z.; Yin, J.; Gao, J.; He, L.; Wang, C.; Hou, R.; He, X.; Wang, G.; Li, T.; et al. D-galactose induces chronic oxidative stress and alters gut microbiota in weaned piglets. Front. Physiol. 2021, 12, 634283. [Google Scholar] [CrossRef] [PubMed]
  26. Kåhrström, C.T.; Pariente, N.; Weiss, U. Intestinal microbiota in health and disease. Nature 2016, 535, 47. [Google Scholar] [CrossRef]
  27. Lapébie, P.; Lombard, V.; Drula, E.; Terrapon, N.; Henrissat, B. Bacteroidetes use thousands of enzyme combinations to break down glycans. Nat. Commun. 2019, 10, 2043. [Google Scholar] [CrossRef]
  28. Azad, M.A.K.; Sarker, M.; Li, T.; Yin, J. Probiotic species in the modulation of gut microbiota: An overview. Biomed. Res. Int. 2018, 2018, 9478630. [Google Scholar] [CrossRef]
  29. Kunasegaran, T.; Balasubramaniam, V.R.M.T.; Arasoo, V.J.T.; Palanisamy, U.D.; Ramadas, A. The modulation of gut microbiota composition in the pathophysiology of gestational diabetes mellitus: A systematic review. Biology 2021, 10, 1027. [Google Scholar] [CrossRef]
  30. Nowland, T.L.; Plush, K.J.; Barton, M.; Kirkwood, R.N. Development and function of the intestinal microbiome and potential implications for pig production. Animals 2019, 9, 76. [Google Scholar] [CrossRef]
  31. Horie, M.; Miura, T.; Hirakata, S.; Hosoyama, A.; Sugino, S.; Umeno, A.; Murotomi, K.; Yoshida, Y.; Koike, T. Comparative analysis of the intestinal flora in type 2 diabetes and nondiabetic mice. Exp. Anim. 2017, 66, 405–416. [Google Scholar] [CrossRef]
  32. Tett, A.; Pasolli, E.; Masetti, G.; Ercolini, D.; Segata, N. Prevotella diversity, niches and interactions with the human host. Nat. Rev. Microbiol. 2021, 19, 585–599. [Google Scholar] [CrossRef] [PubMed]
  33. Zhang, X.; Hu, Y.; Ansari, A.R.; Akhtar, M.; Chen, Y.; Cheng, R.; Cui, L.; Nafady, A.A.; Elokil, A.A.; Abdel-Kafy, E.M.; et al. Caecal microbiota could effectively increase chicken growth performance by regulating fat metabolism. Microb. Biotechnol. 2022, 15, 844–861. [Google Scholar] [CrossRef] [PubMed]
  34. Gou, W.; Ling, C.W.; He, Y.; Jiang, Z.; Fu, Y.; Xu, F.; Miao, Z.; Sun, T.Y.; Lin, J.S.; Zhu, H.L.; et al. Interpretable machine learning framework reveals robust gut microbiome features associated with type 2 diabetes. Diabetes Care 2021, 44, 358–366. [Google Scholar] [CrossRef] [PubMed]
  35. González-Bosch, C.; Boorman, E.; Zunszain, P.A.; Mann, G.E. Short-chain fatty acids as modulators of redox signaling in health and disease. Redox Biol. 2021, 47, 102165. [Google Scholar] [CrossRef]
Figure 1. The expression level of genes related to the intestinal barrier in weaned piglets. (A) Duodenum; (B) jejunum; (C) ileum. MUC2, mucin 2; MUC4, mucin 4; ZO-1, zonula occludens-1; CN, Control; TA1–4, the groups fed the same diet supplemented with 0.06%, 0.12%, 0.18% or 0.24% tannic acid. For each gene, columns labeled with different lowercase letters differ significantly from each other (p < 0.05).
Metabolites 15 00477 g001
Figure 2. Analysis of cecal flora abundance in weaned piglets. (A) Species accumulation curves; (B) Venn diagram of the OTU analysis. CN, Control; TA1–4, the groups fed the same diet supplemented with 0.06%, 0.12%, 0.18% or 0.24% tannic acid.
Metabolites 15 00477 g002
Figure 3. Beta diversity analysis of the cecal flora in weaned piglets. (A) Principal coordinates analysis; (B) non-metric multi-dimensional scaling analysis. PCo1, principal component 1; PCo2, principal component 2; NMDS1, non-metric multi-dimensional scaling analysis 1; NMDS2, non-metric multi-dimensional scaling analysis 2; CN, Control; TA1–4, the groups fed the same diet supplemented with 0.06%, 0.12%, 0.18% or 0.24% tannic acid.
Metabolites 15 00477 g003
Figure 4. The LefSe species variance analysis in the cecal flora of weaned piglets. LefSe, linear discriminant analysis effects size; CN, Control; TA1–4, the groups fed the same diet supplemented with 0.06%, 0.12%, 0.18% or 0.24% tannic acid.
Metabolites 15 00477 g004
Table 1. The effect of tannic acid on the growth performance of weaned piglets.
Groups
ItemCNTA1TA2TA3TA4SEMp-Value
Initial BW, kg7.387.357.407.377.410.130.560
Final BW, kg29.88 d30.58 c31.17 b32.83 a30.53 c0.350.031
ADFI, g977.61 c988.09 bc1012.91 b1044.08 a1001.26 b21.780.023
ADG, g535.71 c553.10 b565.95 b586.19 a550.48 b17.230.005
F/G1.821.791.791.781.820.020.270
Diarrhea index2.35 a2.23 ab2.10 b1.98 c2.19 ab0.040.002
ADFI, average daily feed intake; ADG, average daily gain; BW, body weight; F/G, feed-to-gain ratio; CN, Control; TA1–4, the groups fed the same diet supplemented with 0.06%, 0.12%, 0.18% or 0.24% tannic acid. In the same row, values labeled with different superscript lowercase letters differ significantly from each other (p < 0.05).
Table 2. The effect of tannic acid on jejunal and ileal morphology in weaned piglets.
Groups
ItemCNTA1TA2TA3TA4SEMp-Value
Jejunum       
VH, μm444.60 c441.76 c508.89 b581.19 a507.25 b15.73<0.001
CD, μm252.15249.66230.16234.53238.985.210.333
V/C1.76 c1.77 c2.21 b2.48 a2.12 b0.090.002
Ileum       
VH, μm452.10 c517.01 b531.79 b561.02 a512.92 b16.51<0.001
CD, μm320.31335.20344.34329.43328.047.910.311
V/C1.41 c1.54 b1.54 b1.70 a1.56 b0.06<0.001
CD, crypt depth; VH, villus height; V/C, villus height-to-crypt depth; CN, Control; TA1–4, the groups fed the same diet supplemented with 0.06%, 0.12%, 0.18% or 0.24% tannic acid. In the same row, values labeled with different superscript lowercase letters differ significantly from each other (p < 0.05).
Table 3. The effect of tannic acid on the antioxidant capacity of weaned piglets.
Groups
ItemCNTA1TA2TA3TA4SEMp-Value
Duodenum       
MDA, nmol/mL1.76 a1.13 b0.40 c0.30 c0.84 b0.15<0.001
T-SOD, U/mL89.41 b83.36 b91.49 b109.94 a90.32 b3.500.041
GSH-Px, U/mL20.59 b22.23 b20.92 b28.16 a22.81 b0.810.001
T-AOC, nmol/mL0.19 b0.18 b0.26 a0.28 a0.22 ab0.010.015
Jejunum       
MDA, nmol/mL1.2 a0.77 b0.75 b0.50 c0.31 c0.08<0.001
T-SOD, U/mL72.36 c97.97 b87.64 bc129.09 a130.42 a6.47<0.001
GSH-Px, U/mL17.72 c18.17 c17.47 c39.92 a21.74 b2.31<0.001
T-AOC, nmol/mL0.13 c0.21 b0.26 ab0.32 a0.21 b0.020.024
Ileum       
MDA, nmol/mL1.31 a1.23 a1.08 b0.55 c0.54 c0.130.042
T-SOD, U/mL69.54 b67.62 b75.71 ab86.44 a69.33 b3.070.033
GSH-Px, U/mL32.6032.1134.3540.9432.971.270.137
T-AOC, nmol/mL0.200.180.200.250.200.010.163
GSH-Px, glutathione peroxidase; MDA, malondialdehyde; T-AOC, total antioxidant capacity; T-SOD, total superoxide dismutase; CN, Control; TA1–4, the groups fed the same diet supplemented with 0.06%, 0.12%, 0.18% or 0.24% tannic acid. In the same row, values labeled with different superscript lowercase letters differ significantly from each other (p < 0.05).
Table 4. Analysis of alpha diversity.
Groups
ItemCNTA1TA2TA3TA4SEMp-Value
Chao1770.76 d808.11 c862.15 b920.76 a716.13 e35.580.029
Pielou0.670.660.650.710.650.010.206
Observed species729.18 b747.03 b831.17 a859.65 a675.22 c33.990.430
Faith’s PD48.79 b49.22 b54.91 ab60.83 a48.90 b1.550.031
Shannon 6.386.246.346.956.110.230.280
Simpson0.950.930.900.970.940.040.058
Goods coverage1.001.001.000.991.00<0.01 0.069
CN, Control; TA1–4, the groups fed the same diet supplemented with 0.06%, 0.12%, 0.18% or 0.24% tannic acid. In the same line, values labelled with different superscript lowercase letters differ significantly from each other (p < 0.05).
Table 5. The abundances of cecal microbiota at the phylum level (n = 6, %).
Groups
ItemCNTA1TA2TA3TA4SEMp-Value
Firmicutes63.17 d68.46 c73.41 bc88.36 a79.66 b2.640.002
Bacteroidetes32.07 a27.30 ab19.10 bc9.11 c16.33 bc2.620.014
Actinobacteria0.040.030.050.020.010.010.447
Proteobacteria3.82 a2.51 ab0.76 c0.52 c1.51 bc0.380.007
Tenericutes0.540.190.220.210.660.110.082
CN, Control; TA1–4, the groups fed the same diet supplemented with 0.06%, 0.12%, 0.18% or 0.24% tannic acid. In the same line, values labelled with different superscript lowercase letters differ significantly from each other (p < 0.05).
Table 6. The abundances of cecal microbiota at the family level (n = 6, %).
Groups
ItemCNTA1TA2TA3TA4SEMp-Value
Lactobacillaceae33.85 c29.06 c55.25 a41.36 b23.35 d3.260.001
Ruminococcaceae6.37 c16.88 a7.33 c12.09 b14.40 ab1.340.023
Lachnospiraceae9.2511.509.987.8914.520.970.248
Prevotellaceae23.76 a18.09 a3.89 c5.20 c11.04 b2.230.001
Clostridiaceae0.44 d1.35 c2.80 c11.91 a7.32 b0.460.034
Streptococcaceae4.020.572.383.182.410.540.379
CN, Control; TA1–4, the groups fed the same diet supplemented with 0.06%, 0.12%, 0.18% or 0.24% tannic acid. In the same line, values labelled with different superscript lowercase letters differ significantly from each other (p < 0.05).
Table 7. The abundances of cecal microbiota at the genus level (n = 6, %).
Groups
ItemCNTA1TA2TA3TA4SEMp-Value
Lactobacillus32.88 c29.93 c55.24 a41.35 b23.31 d3.20<0.001
Prevotella19.63 a21.34 a3.88 c5.19 c11.00 b2.480.041
Gemmiger6.168.443.217.875.371.040.584
Streptococcus4.430.482.363.162.380.610.381
Blautia3.765.963.854.046.150.920.895
SMB530.03 c0.33 c0.90 c2.79 b3.70 a0.21 0.040
Roseburia0.232.591.360.141.090.370.203
Faecalibacterium0.83 b1.90 a0.65 b1.71 a0.96 b0.150.005
CN, Control; TA1–4, the groups fed the same diet supplemented with 0.06%, 0.12%, 0.18% or 0.24% tannic acid. In the same line, values labelled with different superscript lowercase letters differ significantly from each other (p < 0.05).
Table 8. Analysis of short-chain fatty acid contents in the cecal contents (n = 6, %).
Groups
ItemCNTA1TA2TA3TA4SEMp-Value
Acetic acid1966.1 b1972.9 b2251.2 a2267.0 a1892.5 b116.24<0.001
Propionic acid1340.0 c1539.0 b1532.4 b1651.4 a1367.8 c83.790.016
Isobutyric acid41.1 b43.8 b74.9 a81.5 a49.5 b5.110.024
Butyric acid1058.2967.91014.5938.7927.571.020.325
Isovaleric acid45.2 c50.4 c72.9 b91.4 a69.9 b7.640005
Valeric acid202.1 b228.6 ab261.8 a241.2 a225.2 ab14.480.041
Hexanoic acid8.0 b9.7 ab12.5 a11.4 a11.7 a1.130.003
Total_SCFA4700.7 b4812.3 b5220.3 a5282.6 a4544.1 b235.65<0.001
CN, Control; TA1–4, the groups fed the same diet supplemented with 0.06%, 0.12%, 0.18% or 0.24% tannic acid. In the same line, values labelled with different superscript lowercase letters differ significantly from each other (p > 0.05).
Disclaimer/Publisher’s Note: The statements, opinions and data contained in all publications are solely those of the individual author(s) and contributor(s) and not of MDPI and/or the editor(s). MDPI and/or the editor(s) disclaim responsibility for any injury to people or property resulting from any ideas, methods, instructions or products referred to in the content.

