Article

Identification of Novel Biomarkers in Late Preterm Neonates with Respiratory Distress Syndrome (RDS) Using Urinary Metabolomic Analysis

by
Irene Christopoulou
1,†,
Eirini Kostopoulou
1,*,†,
Konstantina Matzarapi
2,
Styliani A. Chasapi
2,†,
Georgios A. Spyroulias
2 and
Anastasia Varvarigou
1
1
Department of Paediatrics, University of Patras Medical School, General University Hospital, 26500 Patras, Greece
2
Department of Pharmacy, University of Patras, 26504 Patras, Greece
*
Author to whom correspondence should be addressed.
These authors contributed equally to this work.
Metabolites 2023, 13(5), 644; https://doi.org/10.3390/metabo13050644
Submission received: 11 April 2023 / Revised: 30 April 2023 / Accepted: 3 May 2023 / Published: 9 May 2023

Abstract

:
Urine metabolomics is gaining traction as a means of identifying metabolic signatures associated with health and disease states. Thirty-one (31) late preterm (LP) neonates admitted to the neonatal intensive care unit (NICU) and 23 age-matched healthy LPs admitted to the maternity ward of a tertiary hospital were included in the study. Proton nuclear magnetic resonance (1H NMR) spectroscopy was employed for urine metabolomic analysis on the 1st and 3rd days of life of the neonates. The data were analyzed using univariate and multivariate statistical analysis. A unique metabolic pattern of enhanced metabolites was identified in the NICU-admitted LPs from the 1st day of life. Metabolic profiles were distinct in LPs presenting with respiratory distress syndrome (RDS). The discrepancies likely reflect differences in the gut microbiota, either due to variations in nutrient intake or as a result of medical interventions, such as the administration of antibiotics and other medications. Altered metabolites could potentially serve as biomarkers for identifying critically ill LP neonates or those at high risk for adverse outcomes later in life, including metabolic risks. The discovery of novel biomarkers may uncover potential targets for drug discovery and optimal periods for effective intervention, offering a personalized approach.

1. Introduction

Late preterm (LP) neonates are defined as newborns born between 340/7 and 366/7 weeks of gestational age [1]. In the United States, they represent 9.1% of all neonates and nearly three-quarters of preterm neonates [2]. Late preterms are characterized by an increased morbidity and mortality risk compared to term neonates. Associated morbidities include neurodevelopmental impairment, feeding difficulties, hypoglycemia, impaired immunological response, sepsis, intraventricular hemorrhage, periventricular leukomalacia, and respiratory disorders such as respiratory distress syndrome (RDS), transient tachypnea of the newborn, pneumonia, apnea, and pulmonary hypertension [1].
The term “metabolomics” refers to the systematic study of a broad range of small endogenous molecule metabolites (<1500 Da) in a biological sample and is a rapidly expanding field of system biology [3]. Τhe quantification of small molecules, such as peptides, lipids, organic acids, vitamins, amino acids, drugs, and other chemicals, enables the identification of metabolic signatures and alterations associated with health and disease states [4]. Given that changes in the individual metabolic profile occur much earlier than any clinically detectable sign or symptom, metabolomics is crucial in the context of the precision medicine approach [5]. Since the metabolome represents the outcome of biochemical processes regulated by proteins derived from gene expression, it provides the closest relationship with the clinical phenotype. Consequently, the utilization of metabolomics as a tool for the validation of new biomarkers for the early diagnosis or prognosis of pathophysiological conditions is constantly growing.
Comprehensive metabolomic analyses of blood have been performed; however, other approaches, using non-invasive matrices to profile metabolites, are gaining popularity [6,7]. Such approaches include the use of a fecal metabolomic profile to predict disease outcomes since fecal metabolites reflect gut microbial composition. It is well known that early colonization of the infant gut has long-term health implications that involve immune system development, growth, cognitive development, and the onset of childhood diseases such as asthma, allergies, and obesity [8,9,10,11,12,13]. The impact of mode of delivery, antibiotic usage, and early life feeding practices on the infant fecal metabolome has also been described by several studies. Distinct fecal metabolomes have also been detected between formula-fed and breastfed infants [14,15,16,17,18].
In addition, urine metabolomics is attracting particular attention, as urine is easily accessible, readily available, and non-invasively collected [19]. In addition, its ease of collection allows for serial sampling. This is particularly important in the case of neonates, particularly those born preterm, who also have small circulating blood volumes. Another important advantage of urine metabolites is that they are a rich source of cellular metabolites originating from blood filtration in the kidney, which represent the final state of metabolism, while the metabolites in the blood may continue to participate in metabolism [7].
More than 600 medical conditions have been associated with the urine metabolites identified thus far [20,21], including obesity, cancer, infectious diseases, and neurological diseases [22,23,24,25]. Furthermore, physiological conditions such as ovulation, pregnancy, diet, and exercise induce metabolomic changes in the urine [26].
Nuclear magnetic resonance (NMR) spectroscopy and mass spectrometry (MS) are the two dominant analytical techniques used for the metabolomic analysis of biofluids. NMR-based analysis, followed by multivariate analysis of the obtained NMR spectra, offers numerous advantages, including that the data are more easily quantitated and highly reproducible [27].
Little is known about metabolic maturation in neonates and its relationship with neonatal morbidity and short- and long-term health outcomes. Even less is known about the metabolic signatures of preterm neonates and the impact of nutritional or pharmaceutical interventions, hospitalization in the NICU, and medical conditions, such as RDS, on the neonatal metabolic profile. There is also a paucity of data regarding the normal urine concentration values for a large number of metabolites in neonates.
The aim of the present study was to identify possible urine metabolites with differing levels between LP neonates hospitalized in the NICU and healthy LP neonates using NMR metabolomics. Additionally, the study aimed to compare the urine metabolic profiles of LP neonates hospitalized in the NICU with RDS and those of neonates hospitalized in the NICU without RDS to define the metabolic patterns associated with this pathology.

2. Materials and Methods

Study Population

The current study was conducted in the neonatal ward and the neonatal intensive care unit (NICU) of the University General Hospital of Patras and the Department of Pharmacy of the University of Patras. Fifty-one (51) neonates that were admitted to the NICU and, additionally, 23 age-matched healthy LPs admitted to the maternity ward from April 2017 to December 2018 were initially included in the study.
The biological sample obtained from each neonate was urine, which was collected with the aim of monitoring the metabolic adaptations taking place during the first days after birth, specifically on the first and third days of life, and comparing them with the metabolism of normal LP infants. Proton nuclear magnetic resonance (1H NMR) spectroscopy was used for urine metabolomic analysis. The data were analyzed by univariate and multivariate statistical analysis. Clinical and NMR data from 18 age-matched healthy LP neonates are part of a previous study conducted by our research group [28].
Due to technical issues, including sample inappropriateness, urine samples were obtained on both the 1st and 3rd days of life from only 31 of the neonates admitted to the NICU and 12 healthy neonates from the maternity ward. The neonates admitted to the NICU were further divided into two groups: (a) neonates who developed respiratory distress syndrome (RDS) (n = 17), and (b) neonates who did not develop RDS (n = 14). Clinical metadata, including neonatal sex, mode of conception, delivery mode, parity, maternal smoking, maternal diseases, maternal medications, maternal infection, birth weight, length, head circumference, requirements of mechanical ventilation, CPAP or O2, neonatal diseases, neonatal sepsis, neonatal medications, feeding information, presence of jaundice, RDS, and premature rupture of membranes, were recorded for each neonate participating in the study.
Comparisons of NMR urine metabolic profiles were conducted between 4 different pairs of neonates for the 1st and 3rd days of life, as follows:
  • A1. 1st day NICU LPs (n = 51) and healthy age-matched LPs (controls) (n = 23).
  • A2. 3rd day NICU LPs (n = 31) and healthy age-matched LPs (n = 12; controls).
  • B1. 1st day NICU LPs with RDS (n = 17) and 1st day NICU LPs without RDS (n = 14).
  • B2. 3rd day NICU LPs with RDS (n = 9) and 3rd day NICU LPs without RDS (n = 9).
  • C1. 1st day NICU LPs with RDS (n = 17) and healthy age-matched LPs (n = 21).
  • C2. 3rd day NICU LPs with RDS (n = 9) and healthy age-matched LPs (n = 12).
  • D1. 1st day NICU LPs without RDS (n = 14) and healthy age-matched LPs (n = 21).
  • D2. 3rd day NICU LPs without RDS (n = 12) and healthy age-matched LPs (n = 9).
The study was approved by the Research Ethics Committee of the University General Hospital of Patras (IRB number: 154/16.03.2017) and was in accordance with the Declaration of Helsinki of 1975, as revised in 2013. Written informed consent was obtained from the parents of each participating neonate.

3. Sample Preparation and NMR Analysis Methodology

Urine samples were collected from the neonates during the 1st and 3rd days of extrauterine life using adhesive pediatric urine collection bags. Immediately after collection, the samples were transferred to sterile vials, centrifuged at 1500× g for 10 min, and the supernatant stored at −80 °C until the analysis.
Urine sample preparation as well as NMR spectra acquisition and processing were conducted following the standard metabolomic procedures and methodology as reported by Georgakopoulou et al., 2020, and Georgiopoulou et al., 2022 [28,29].

4. Statistical Analysis

The statistical analysis of all the NMR metabolomic data conducted in this study follows the methodology that was previously described by Georgakopoulou et al., 2020; Chasapi et al., 2022; and Matzarapi et al., 2022 [28,30,31]. Multivariate and univariate analysis of urine NMR data was performed using SIMCA 16.0.1 (Umetrics, Umeå Sweden), MetaboAnalyst 5.0, and RStudio 3.5.2 [32]. The multivariate methods principal component analysis (PCA) and partial least squares—discriminant analysis (PLS-DA) were applied to urine NMR data, which were autoscaled before analysis. The quality of the PLS-DA and OPLS-DA models is described by the R2 and Q2 parameters. The cumulative values of R2 and Q2 were calculated via 7-fold cross-validation, and a permutation test with 200 random arrangements of y-variables evaluated the statistical significance of the PLS-DA model. Autoscaling was selected as the most suitable scaling method for the current dataset. A univariate analysis of the successfully assigned metabolites was conducted. Urinary metabolites with no overlapping proton signals were separately integrated, and their levels were analyzed. The analysis was completed via the non-parametric Kruskal test, and for RDS day-group comparison (level of significance, a = 0.01), a paired t-test was used. Statistical significance, reported as p-values, was estimated after applying the false discovery rate (FDR) correction [33].

5. Results

For the neonates hospitalized in the NICU, the gestational age was 34.93 ± 0.929 weeks (mean ± SD) (min: 33, max: 36), and the maternal age was 32.17 ± 6.28 years old (min: 22, max: 49). The Apgar scores at 5 min and 10 min were 7.93 ± 1.15 and 9.17 ± 0.84, respectively. Neonatal birth weight was 2286.85 ± 515.51 g (min: 1400, max: 4060), body length was 46.02 ± 2.59 cm (min: 40, max: 53), and head circumference was 31.89 ± 1.87 cm (min: 28, max: 36.5). The majority of the neonates (86.40%) were born by cesarean section.
Intrauterine growth retardation was documented in 22.60% of the neonates. Respiratory distress was recorded in 54.80% of the NICU neonates who required mechanical ventilation, CPAP, or oxygen. Mechanical ventilation was required for 1.92 ± 1.13 days (min: 1, max: 4), CPAP was required for 1.48 ± 0.75 days (min: 1, max: 4) and oxygen was required for 1.41 ± 0.64 days (min: 1, max: 3). Sixteen neonates presented with early-onset sepsis, eight had late-onset sepsis, and 5.55% had pneumothorax. Jaundice was observed in 38.90% of the neonates, and five neonates developed hypocalcemia, whereas 96.20% of them exhibited no metabolic diseases. No neonatal deaths occurred. On the 5th day of life, 94.45% of the neonates were on antibiotic treatment. Additionally, on the 5th day of life, the majority of the neonates were exclusively formula-fed (55.60%), 31.50% were both formula-fed and breastfed, 11% were on fortifiers, and only 1.90% were exclusively breastfed. On the day of discharge from the NICU, 51% of the neonates were exclusively formula-fed, 43% were both formula-fed and breastfed, 2% were on fortifiers, and 2% were exclusively breastfed.
Among the healthy neonates, 45.80% were breastfed, 21.70% required antibiotics, and 58.30% were born by cesarean section.
The majority of the mothers were not smokers; 9.30% developed preeclampsia, 13% developed gestational diabetes, and 11.10% had hypothyroidism. Nearly half of the mothers (51.85%) were administered corticosteroids (betamethasone) during the pregnancy period; 9.26% received thyroxin; 7.41% received antibiotics; and 5.5% received atosiban. Clinical and epidemiological data on the participating neonates and their mothers are presented in Table 1.

5.1. NICU LPs vs. Healthy (Age-Matched) LPs (1st and 3rd Days of Life)

The following metabolomic data comprise the first attempt to characterize the differences in the urine metabolic profile between LP neonates admitted into the NICU and healthy, age-matched LPs (controls) during the 1st and 3rd days of life. Specifically, comparisons were made between the 1H NMR urine metabolic profiles of 51 NICU and 23 healthy neonates collected on the 1st day of life and of 31 NICU and 12 healthy neonates collected on the 3rd day of life.
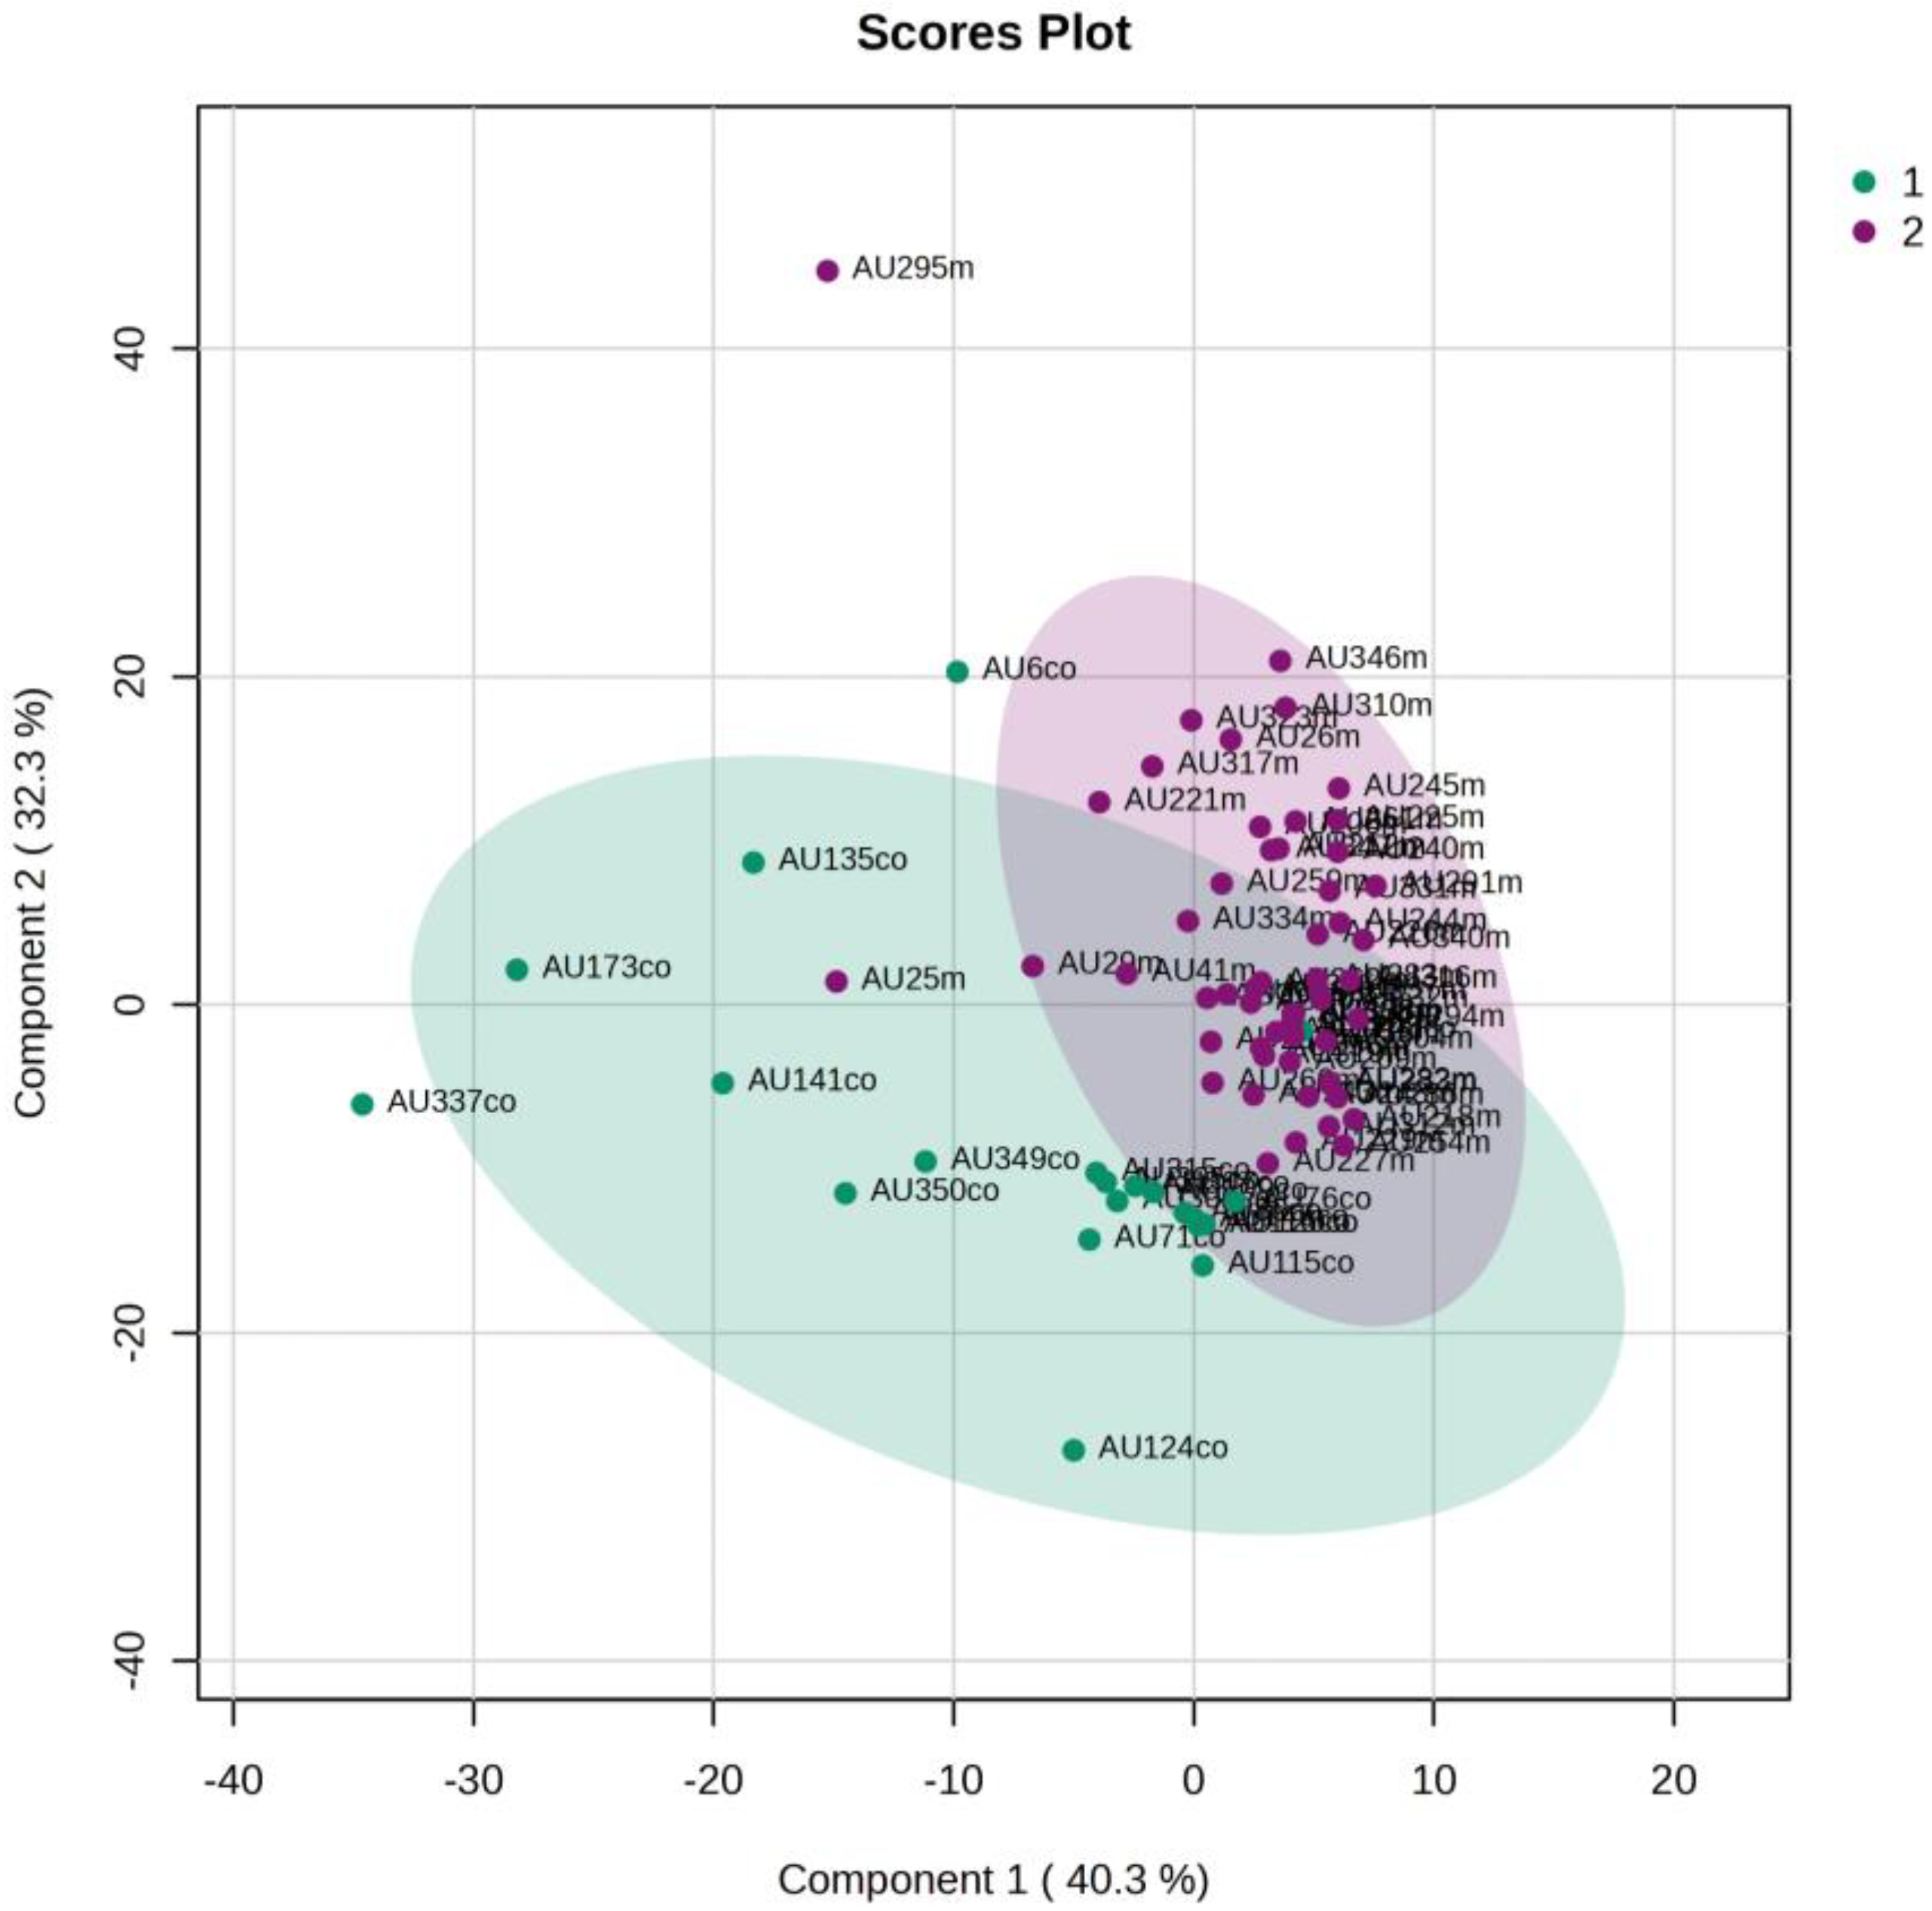
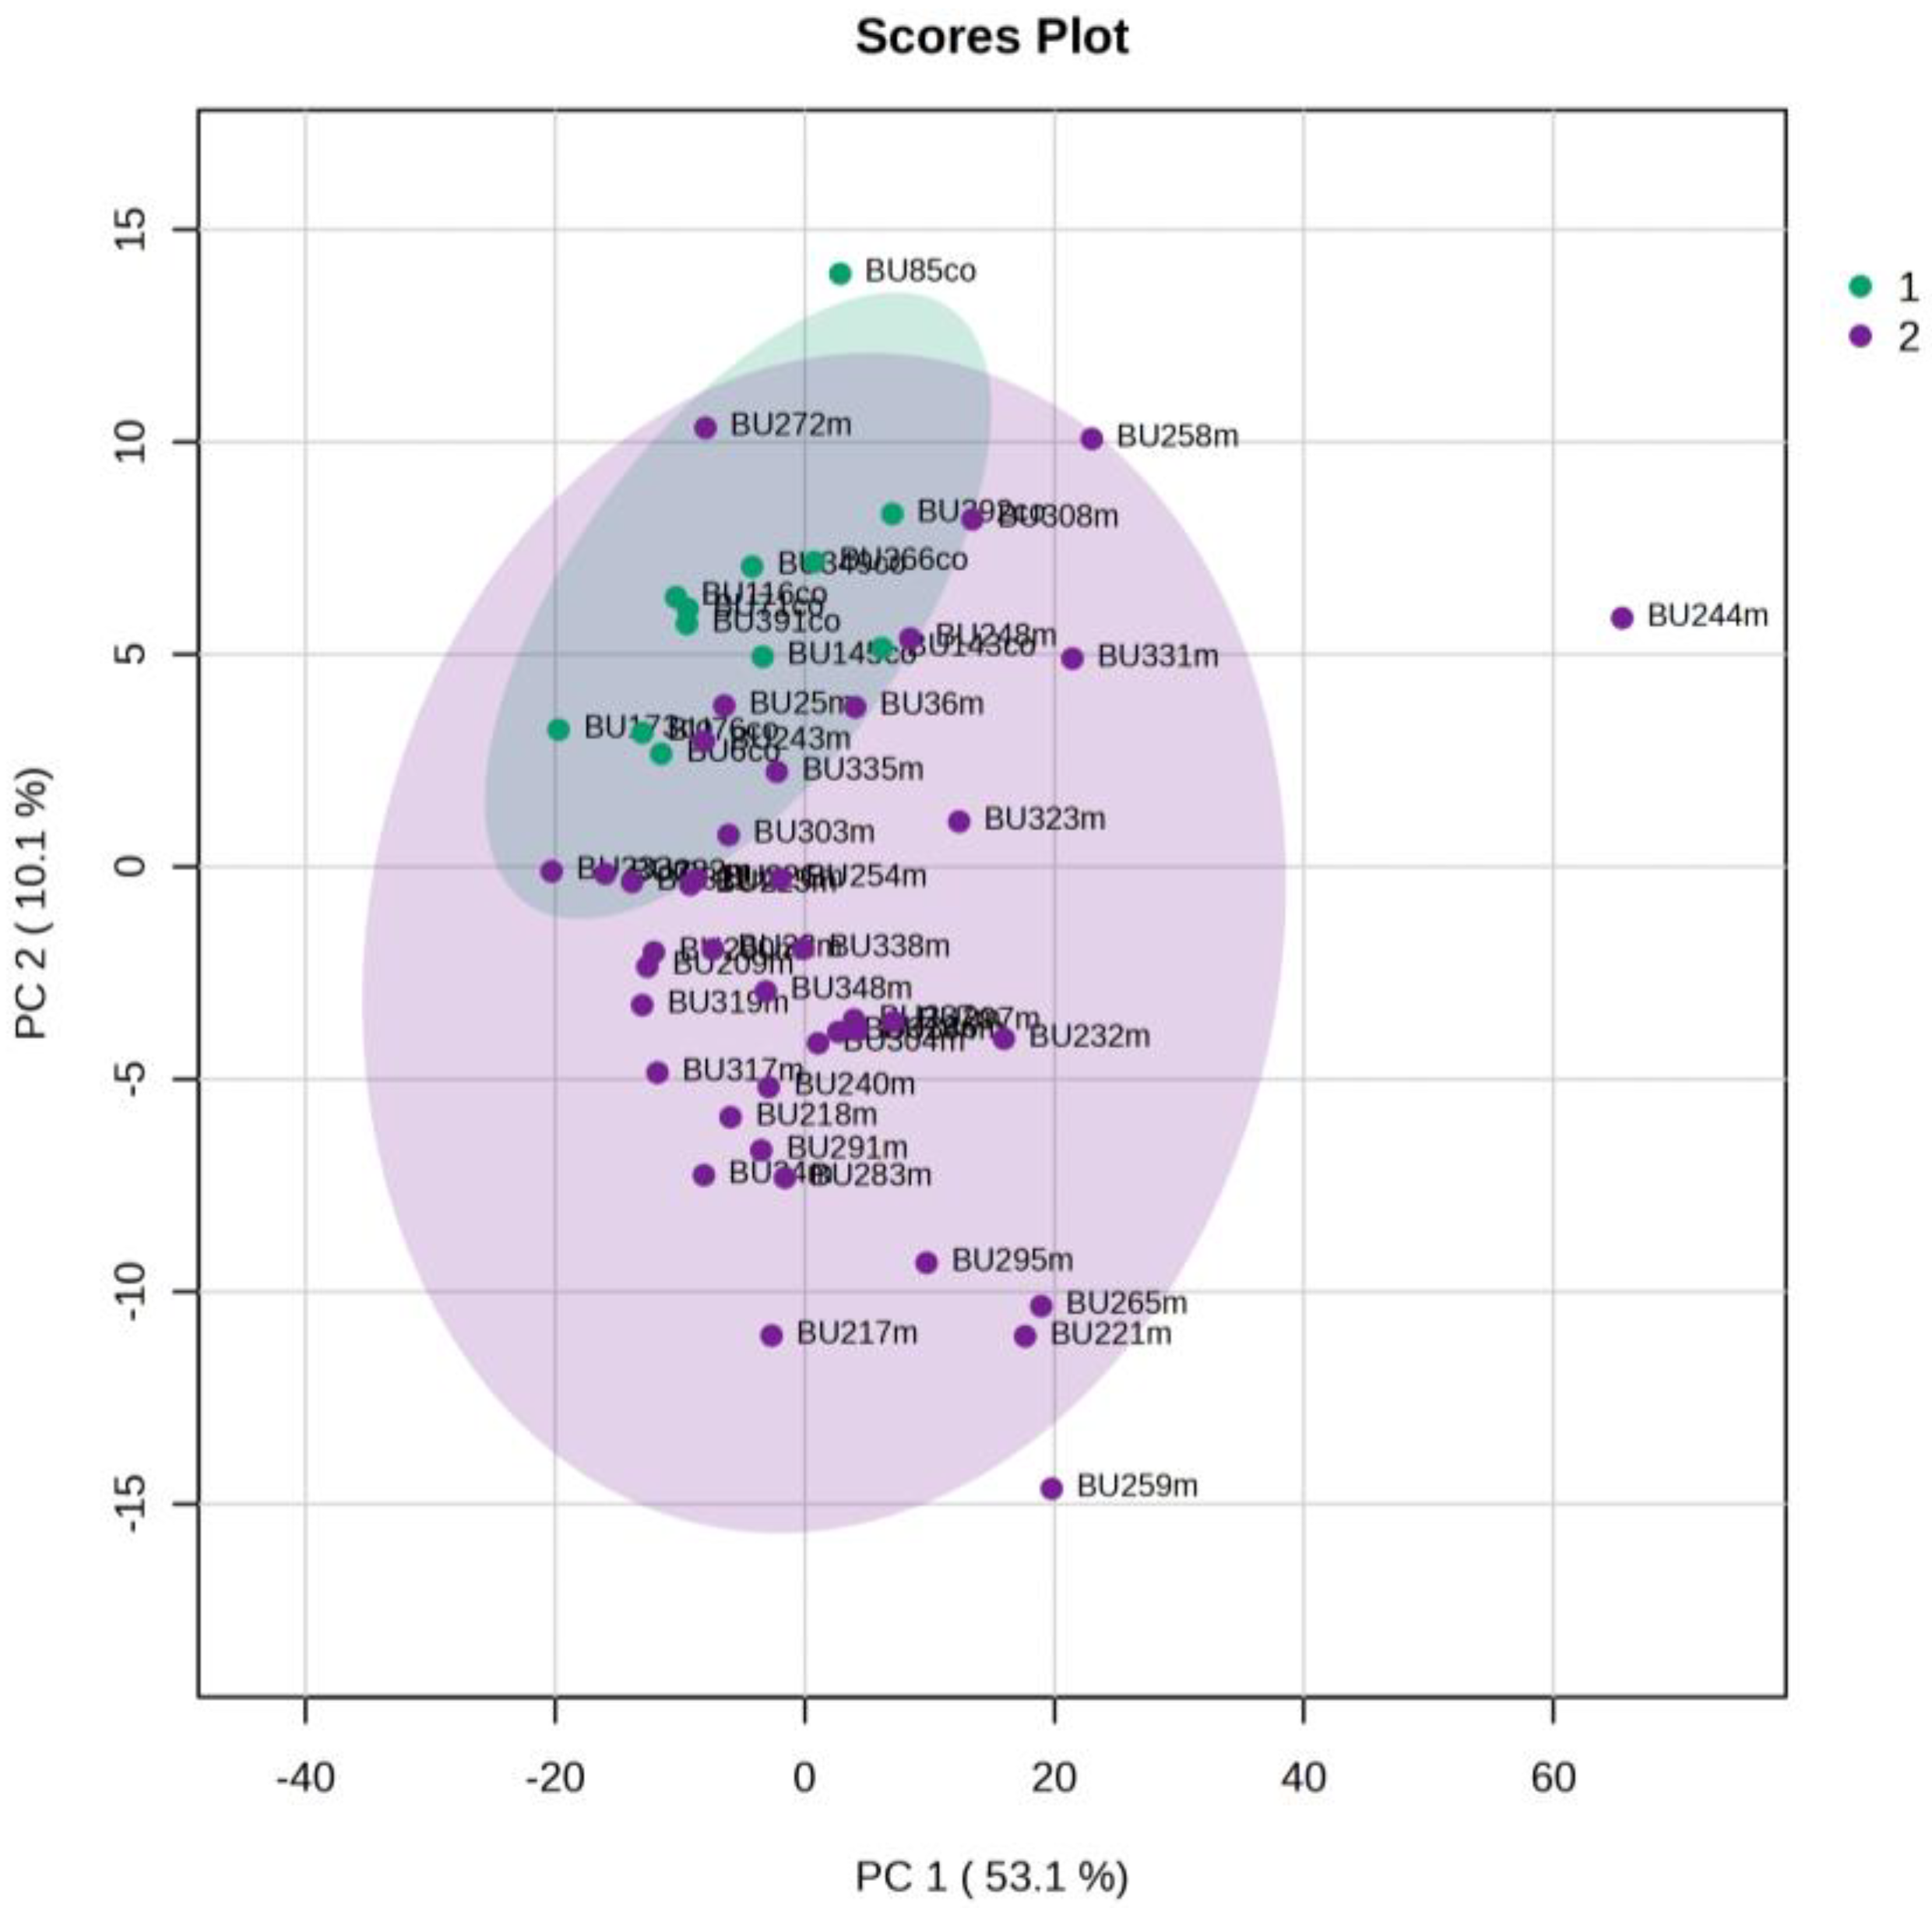
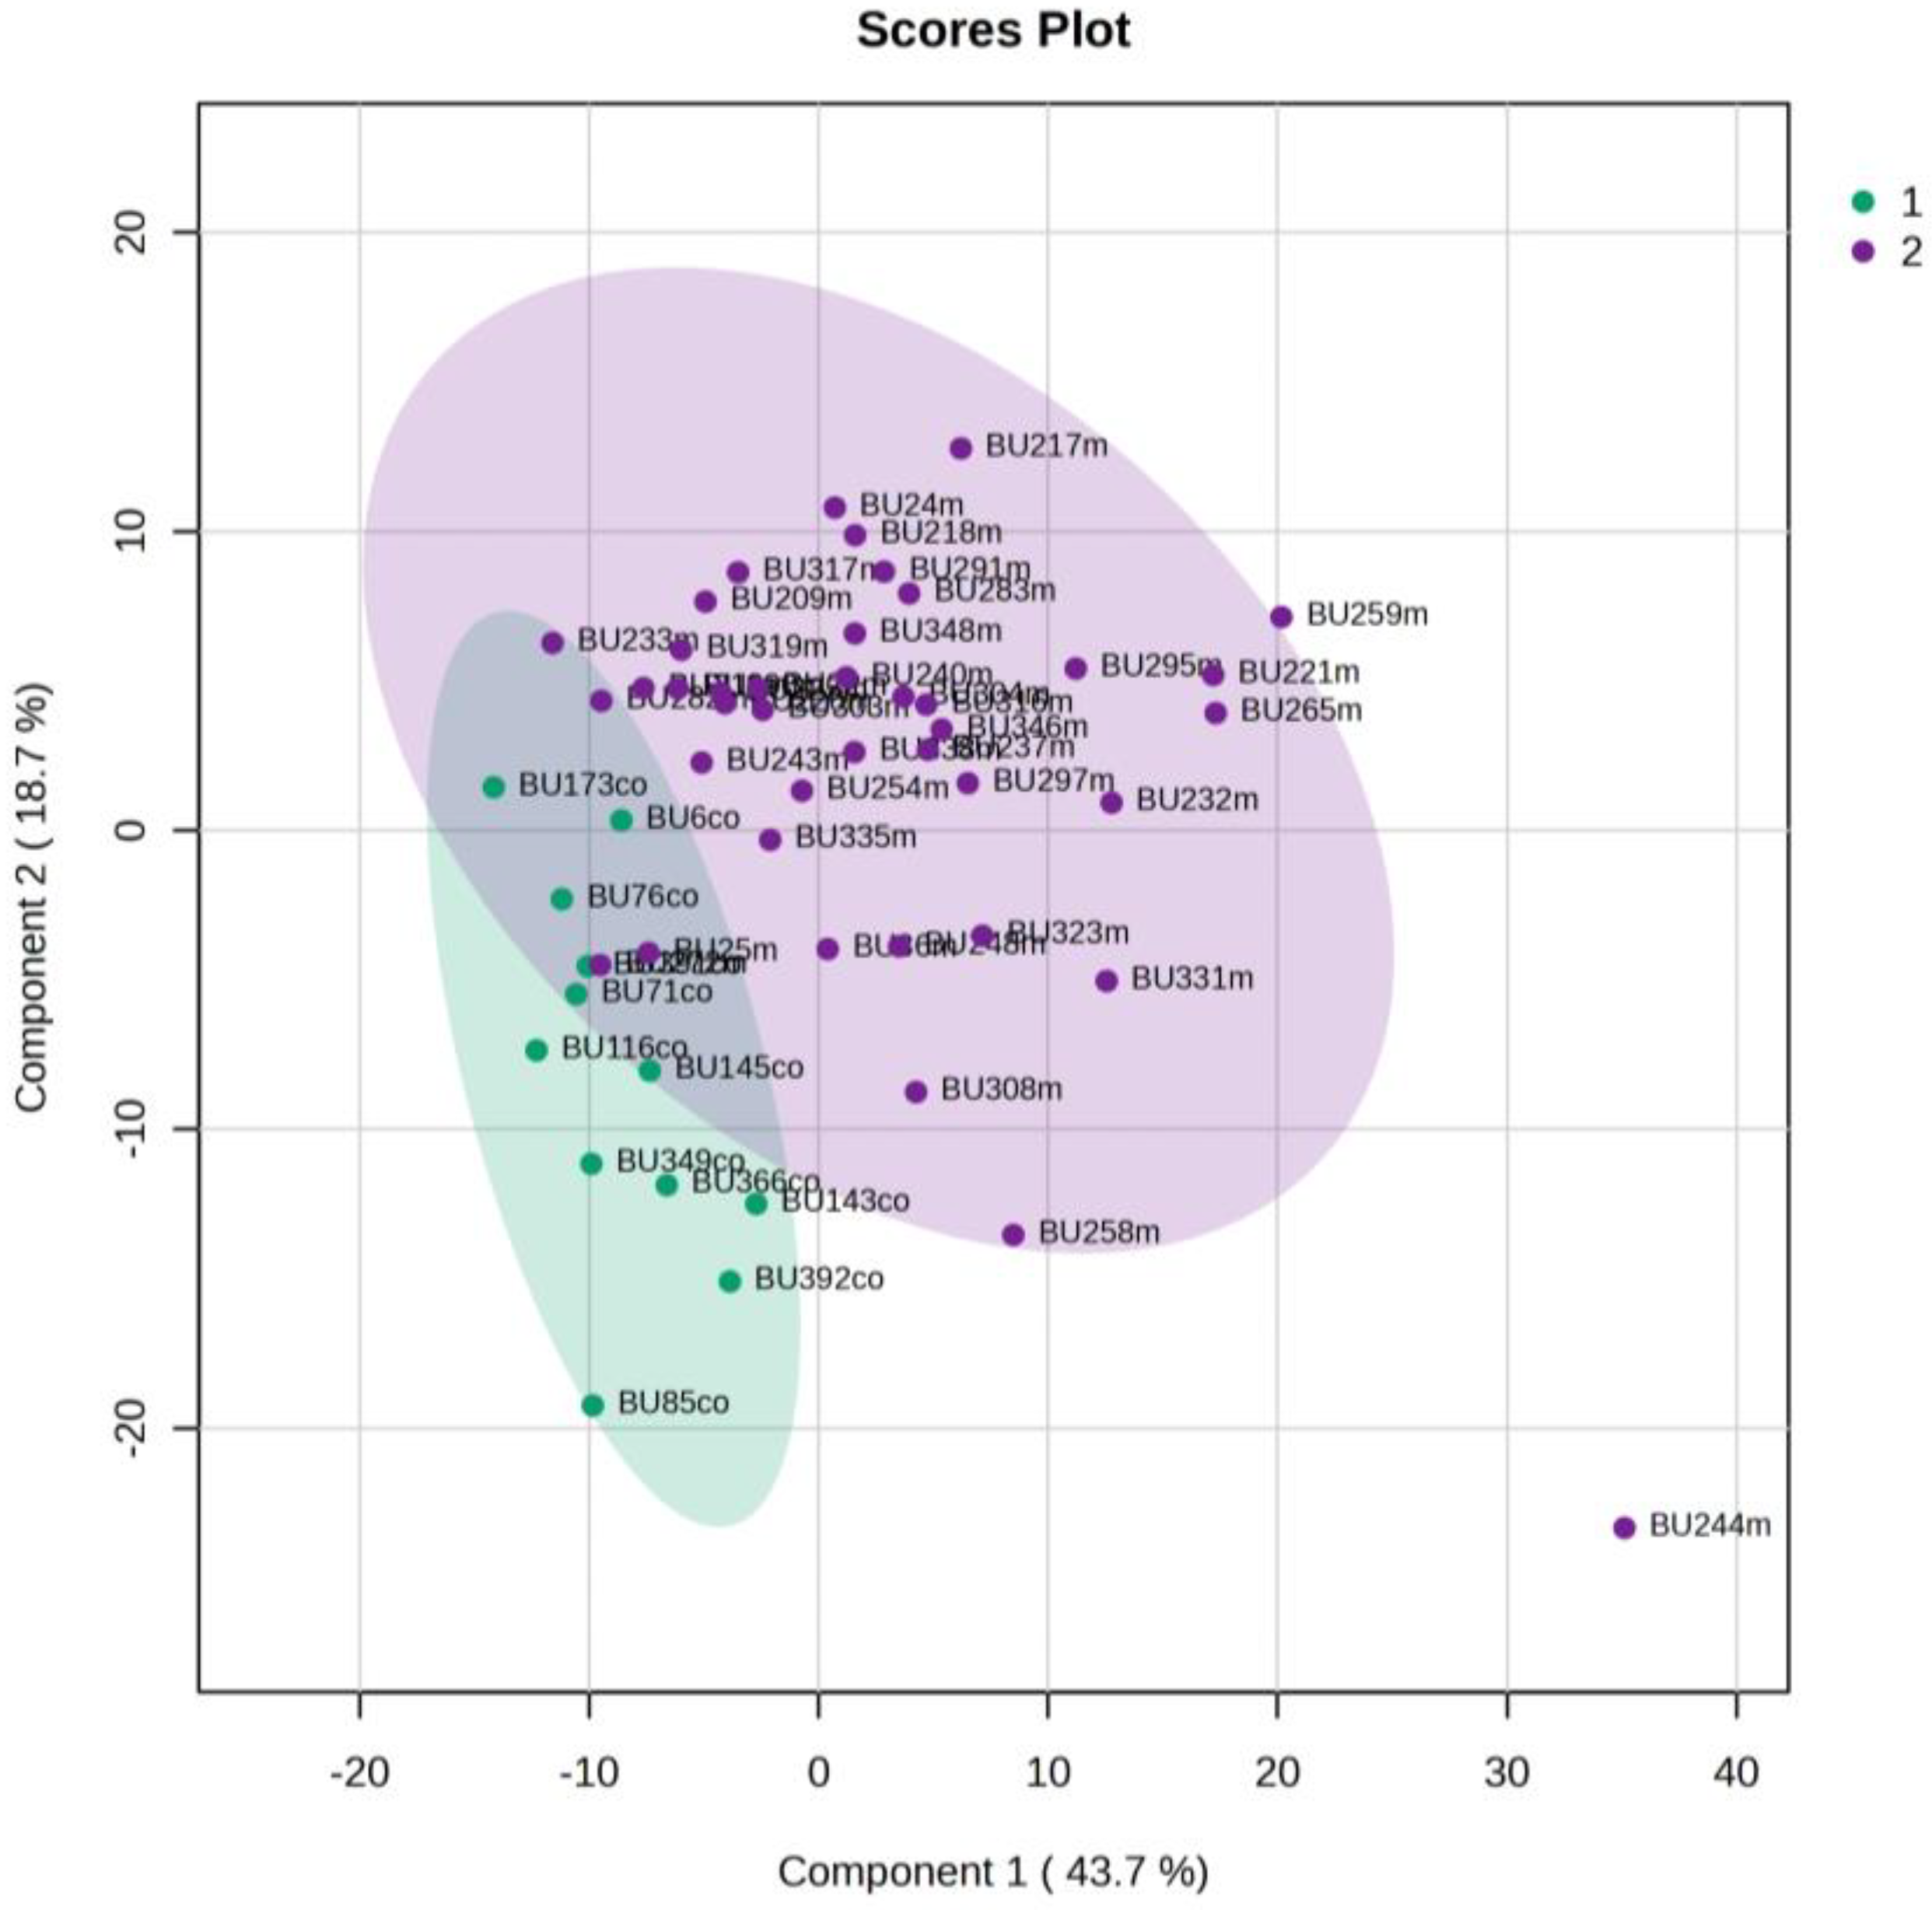
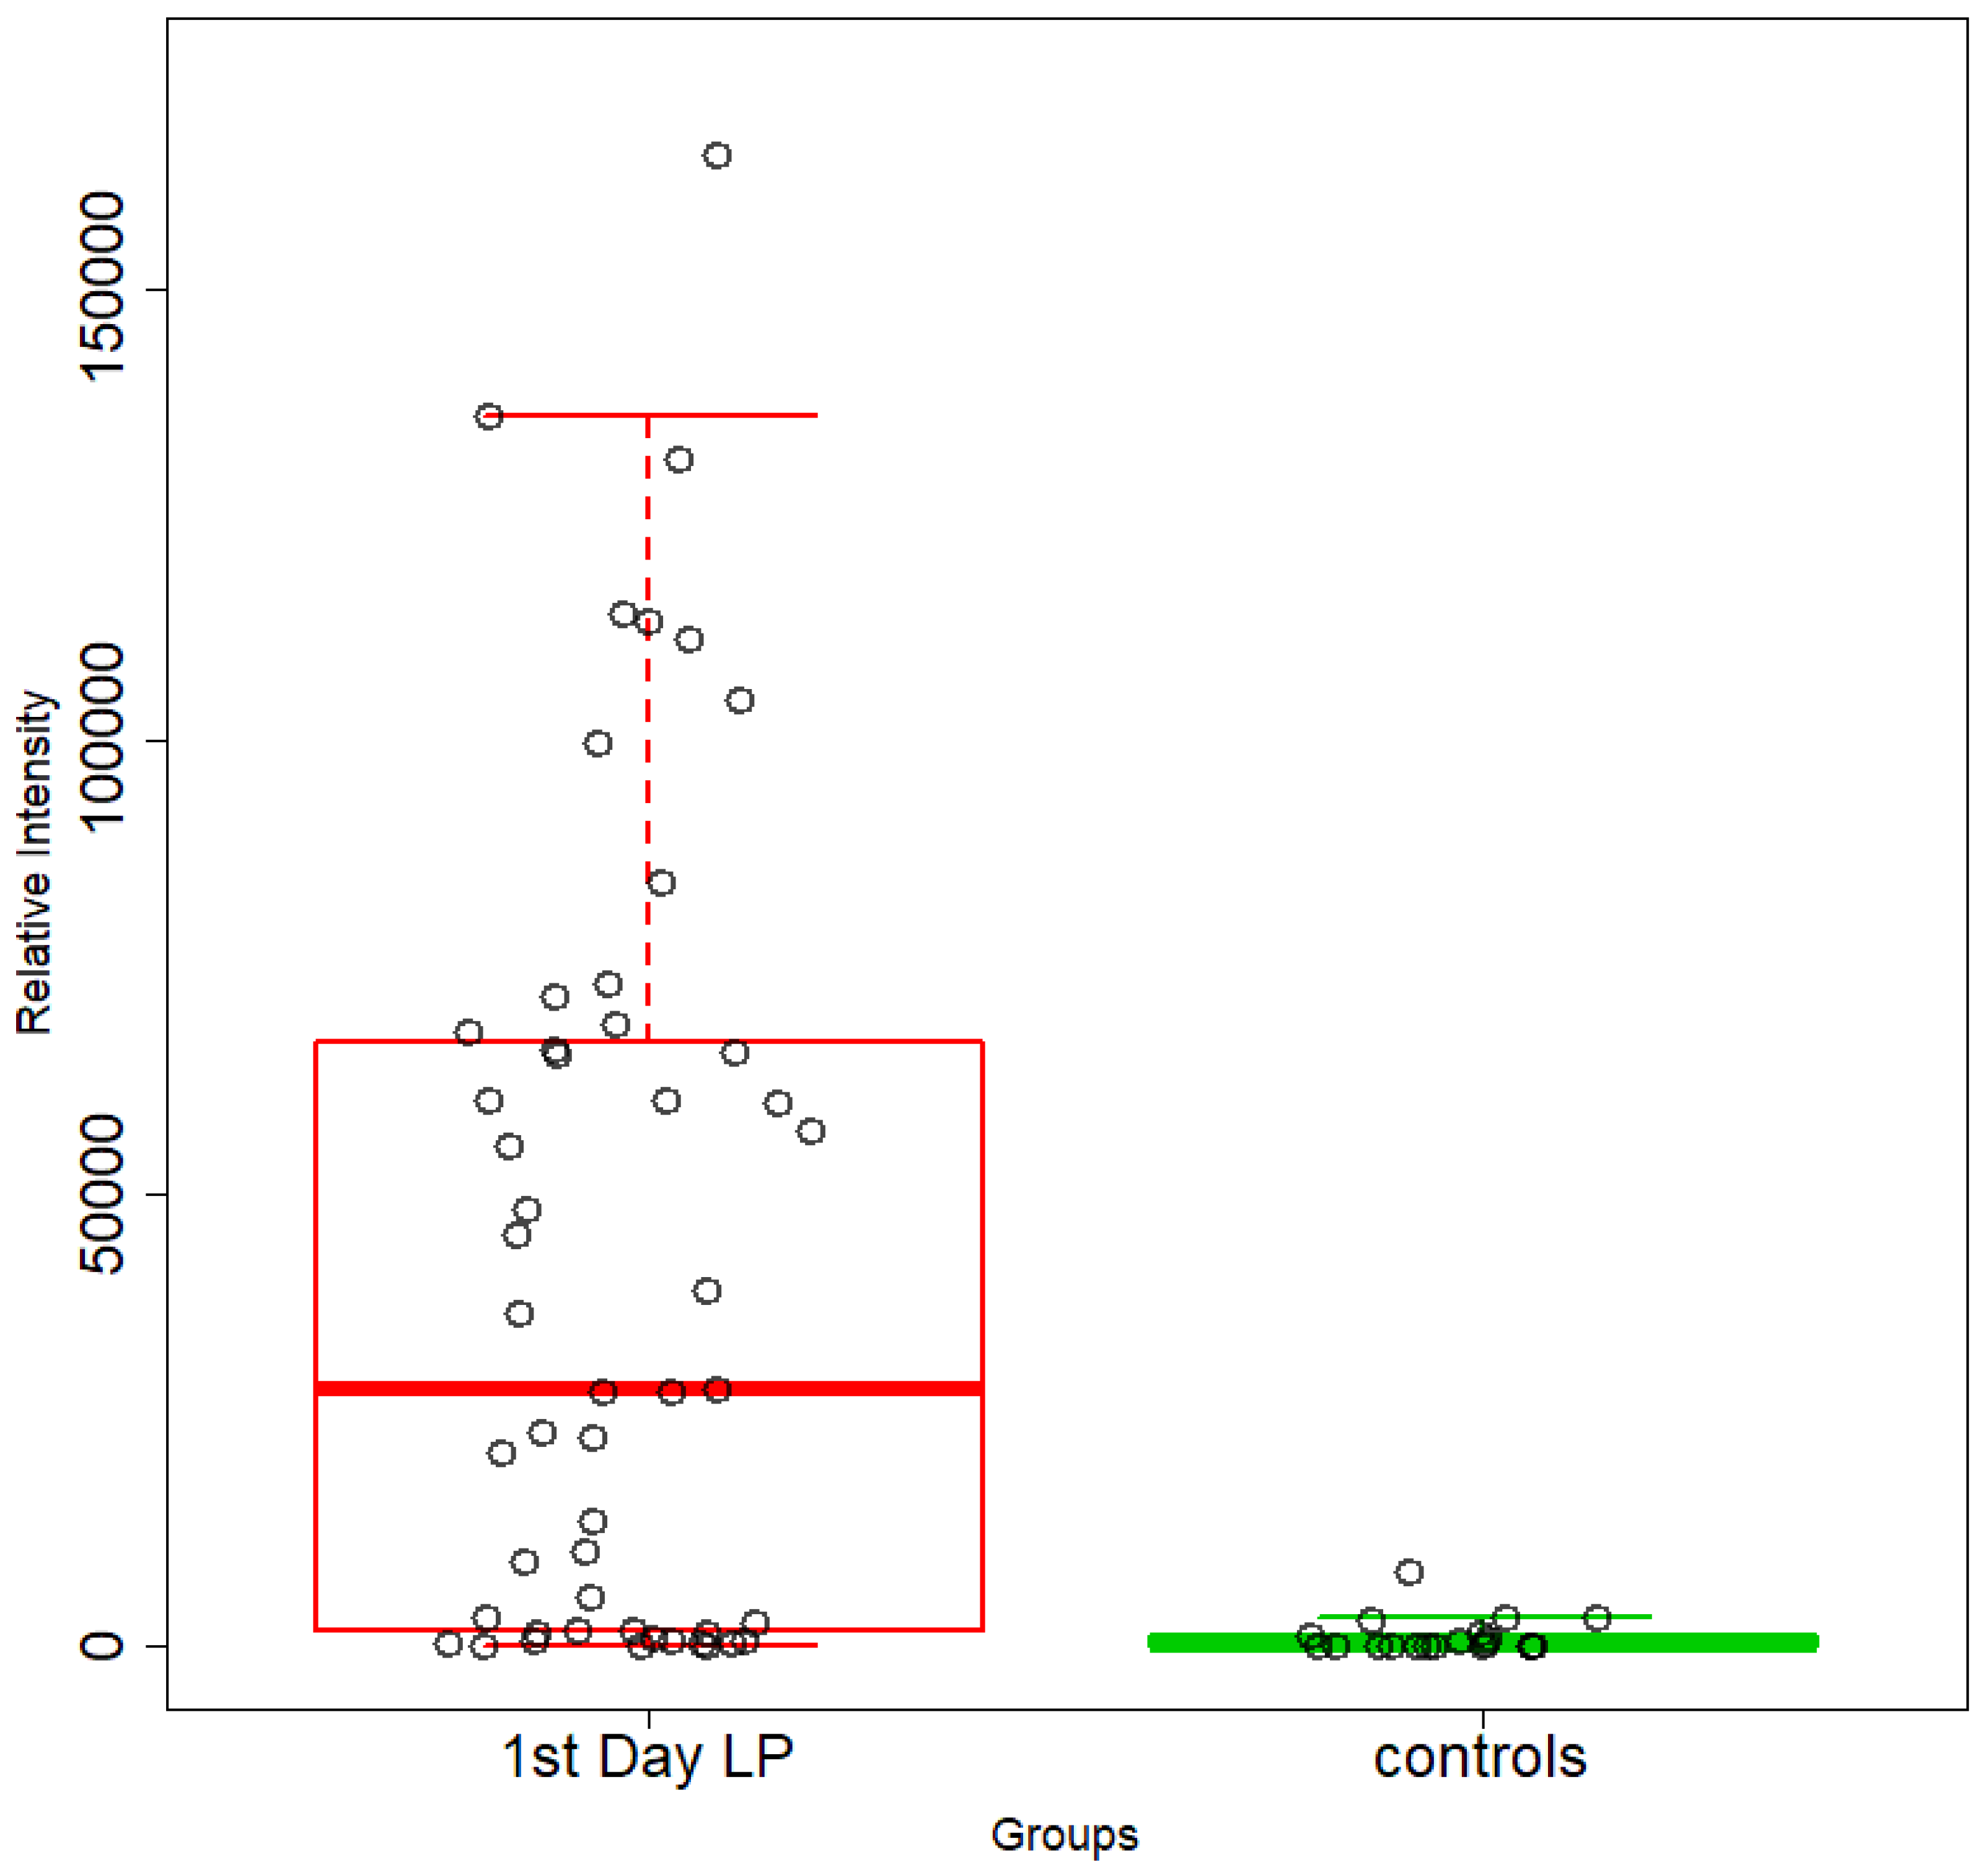
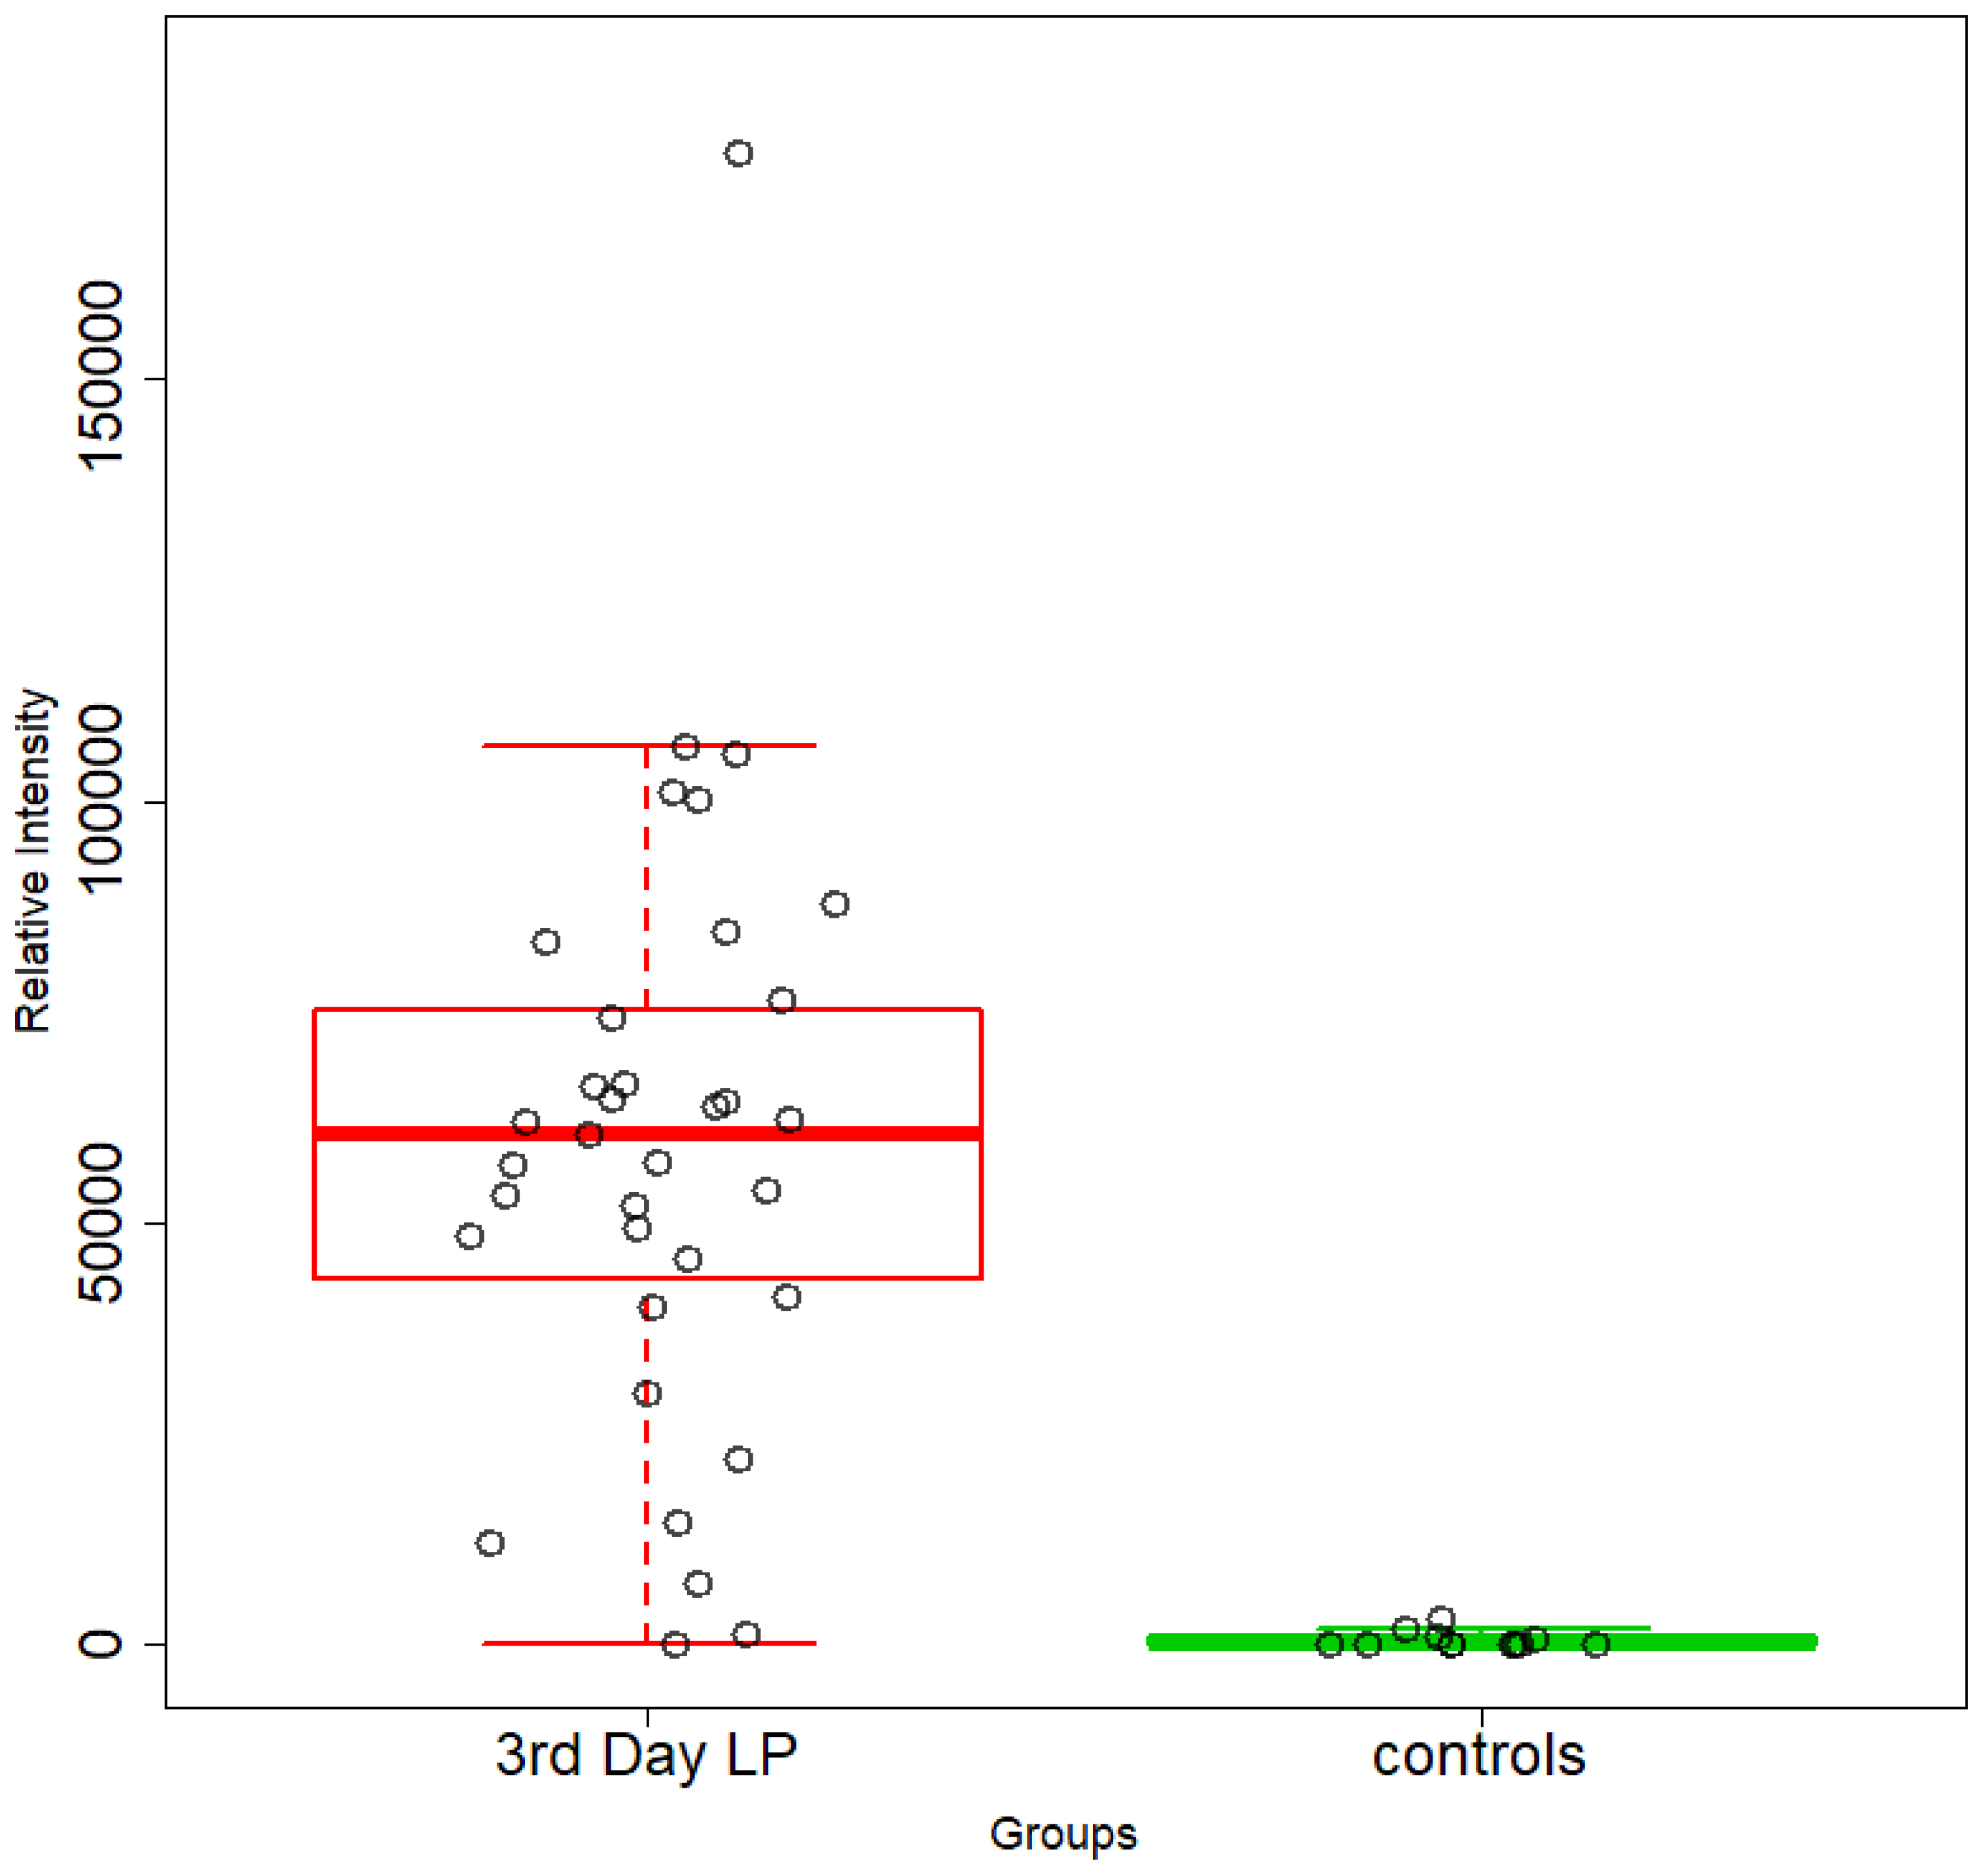
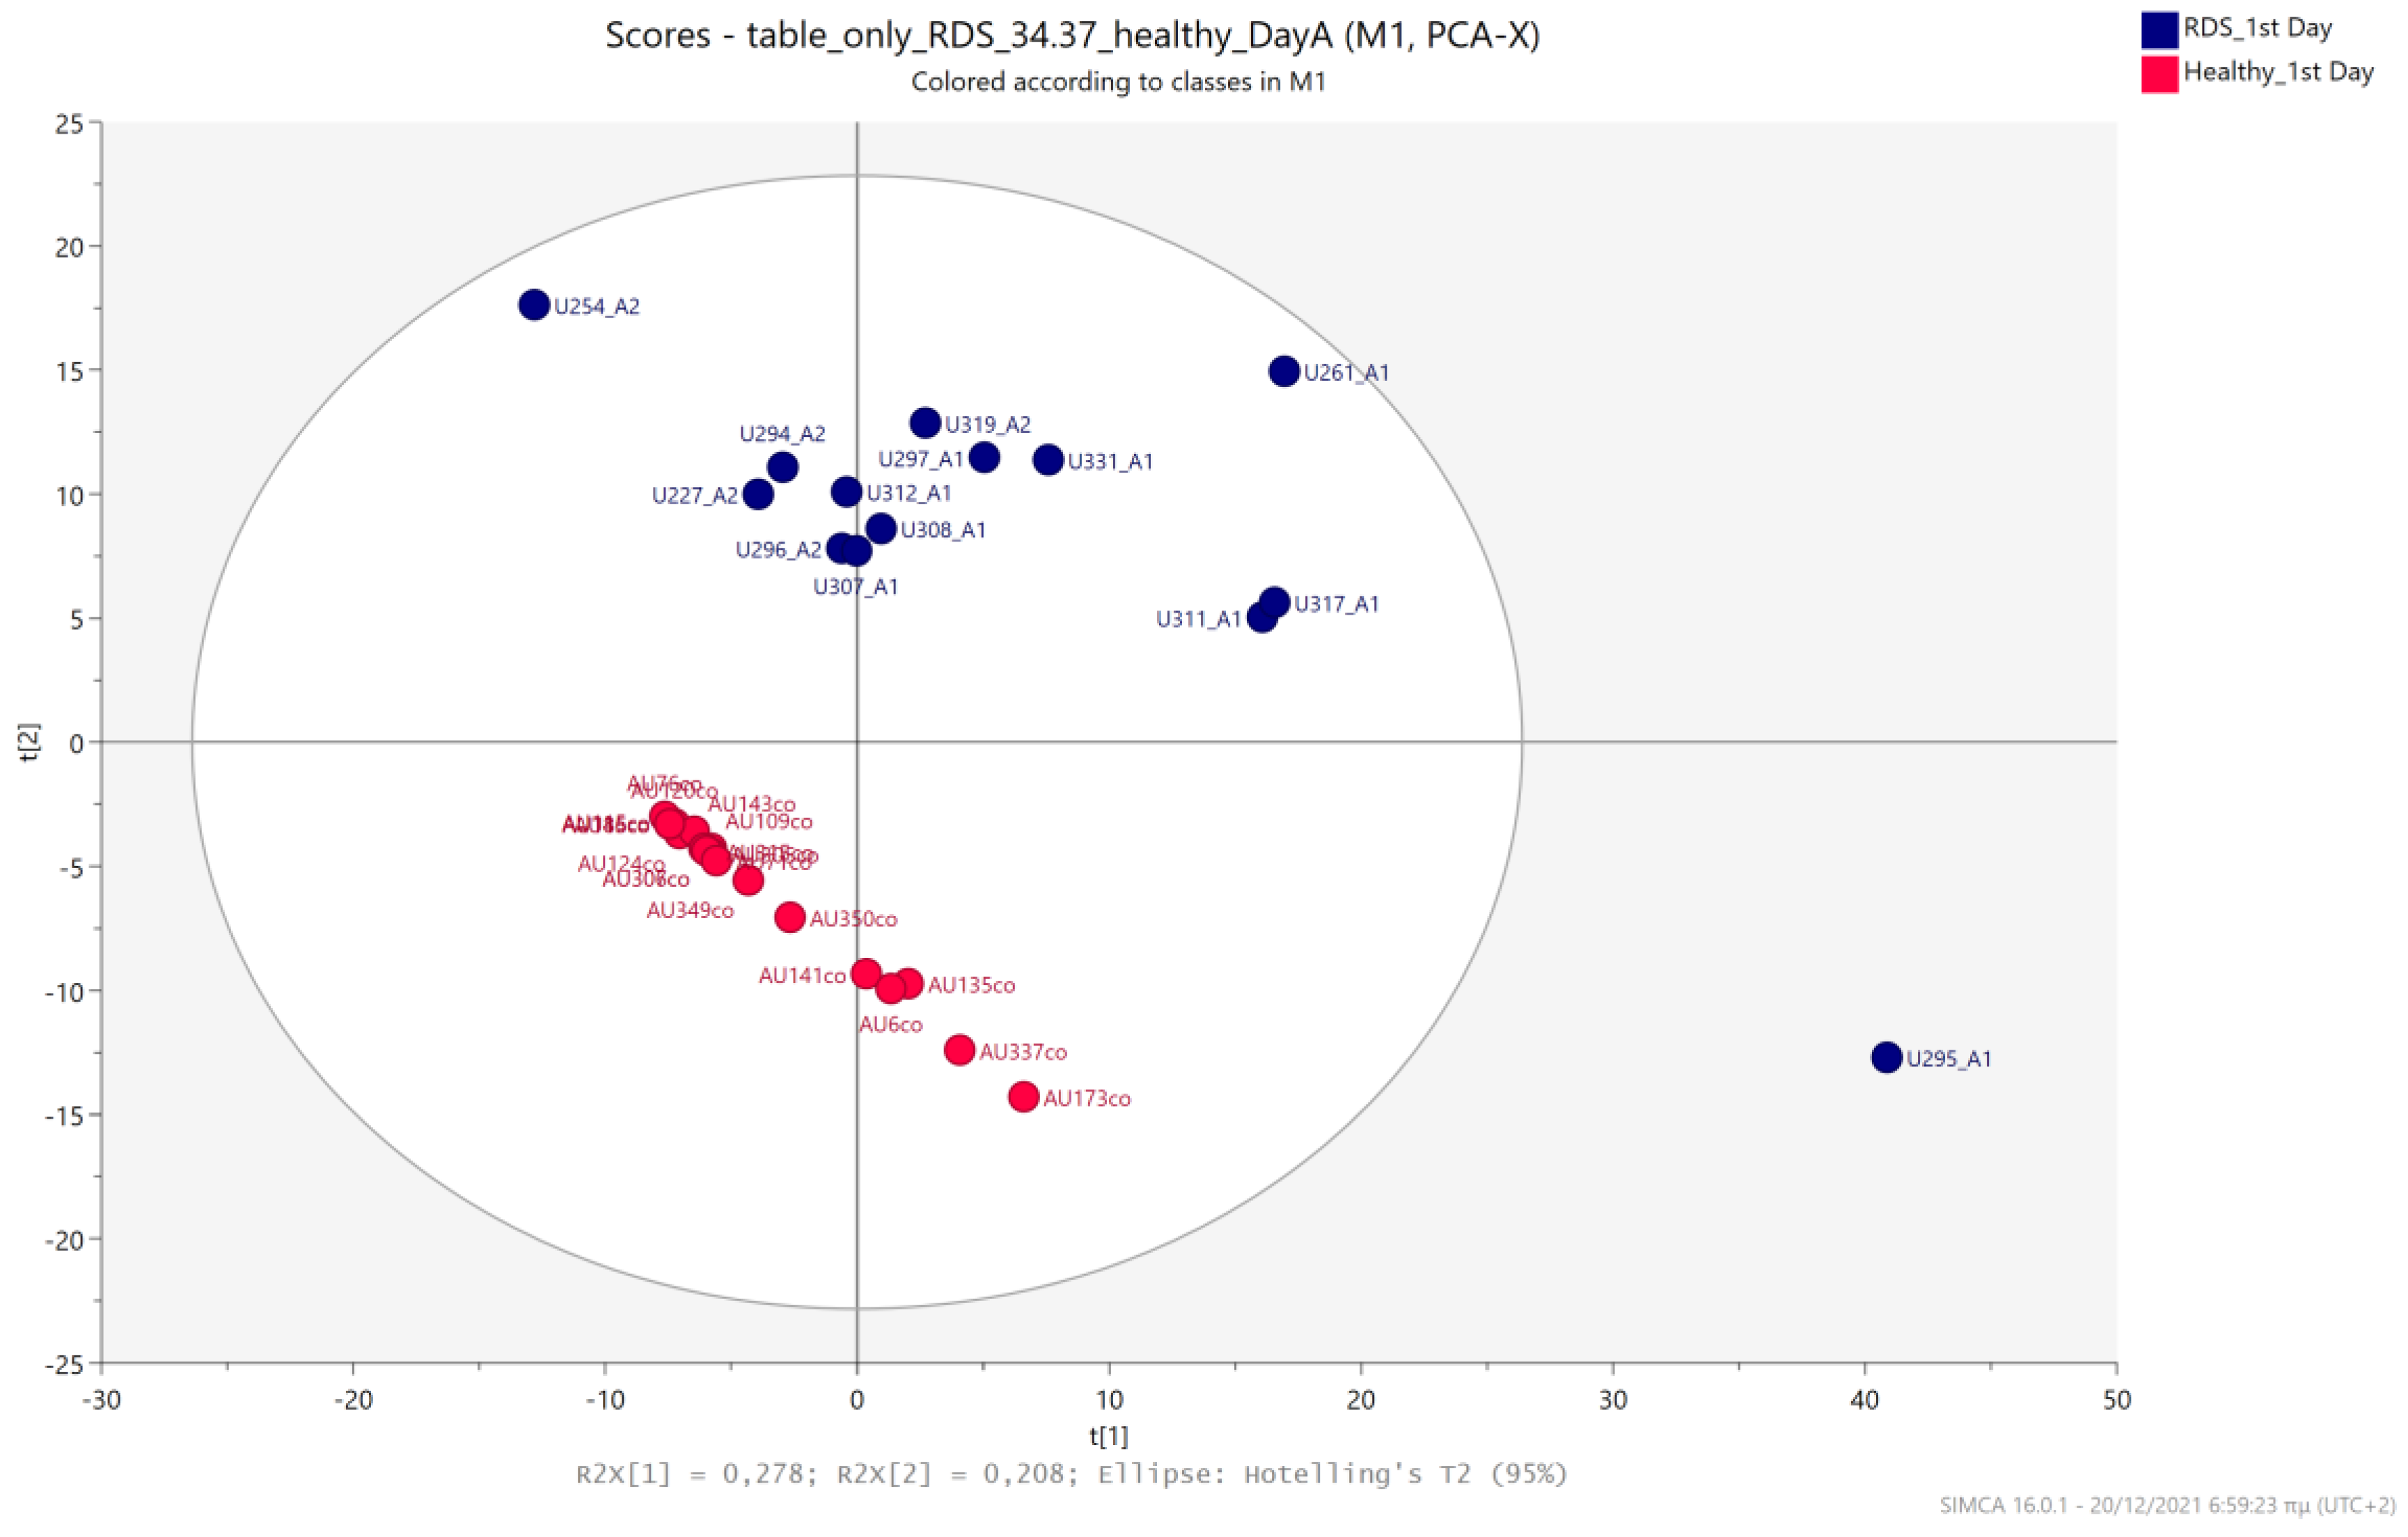
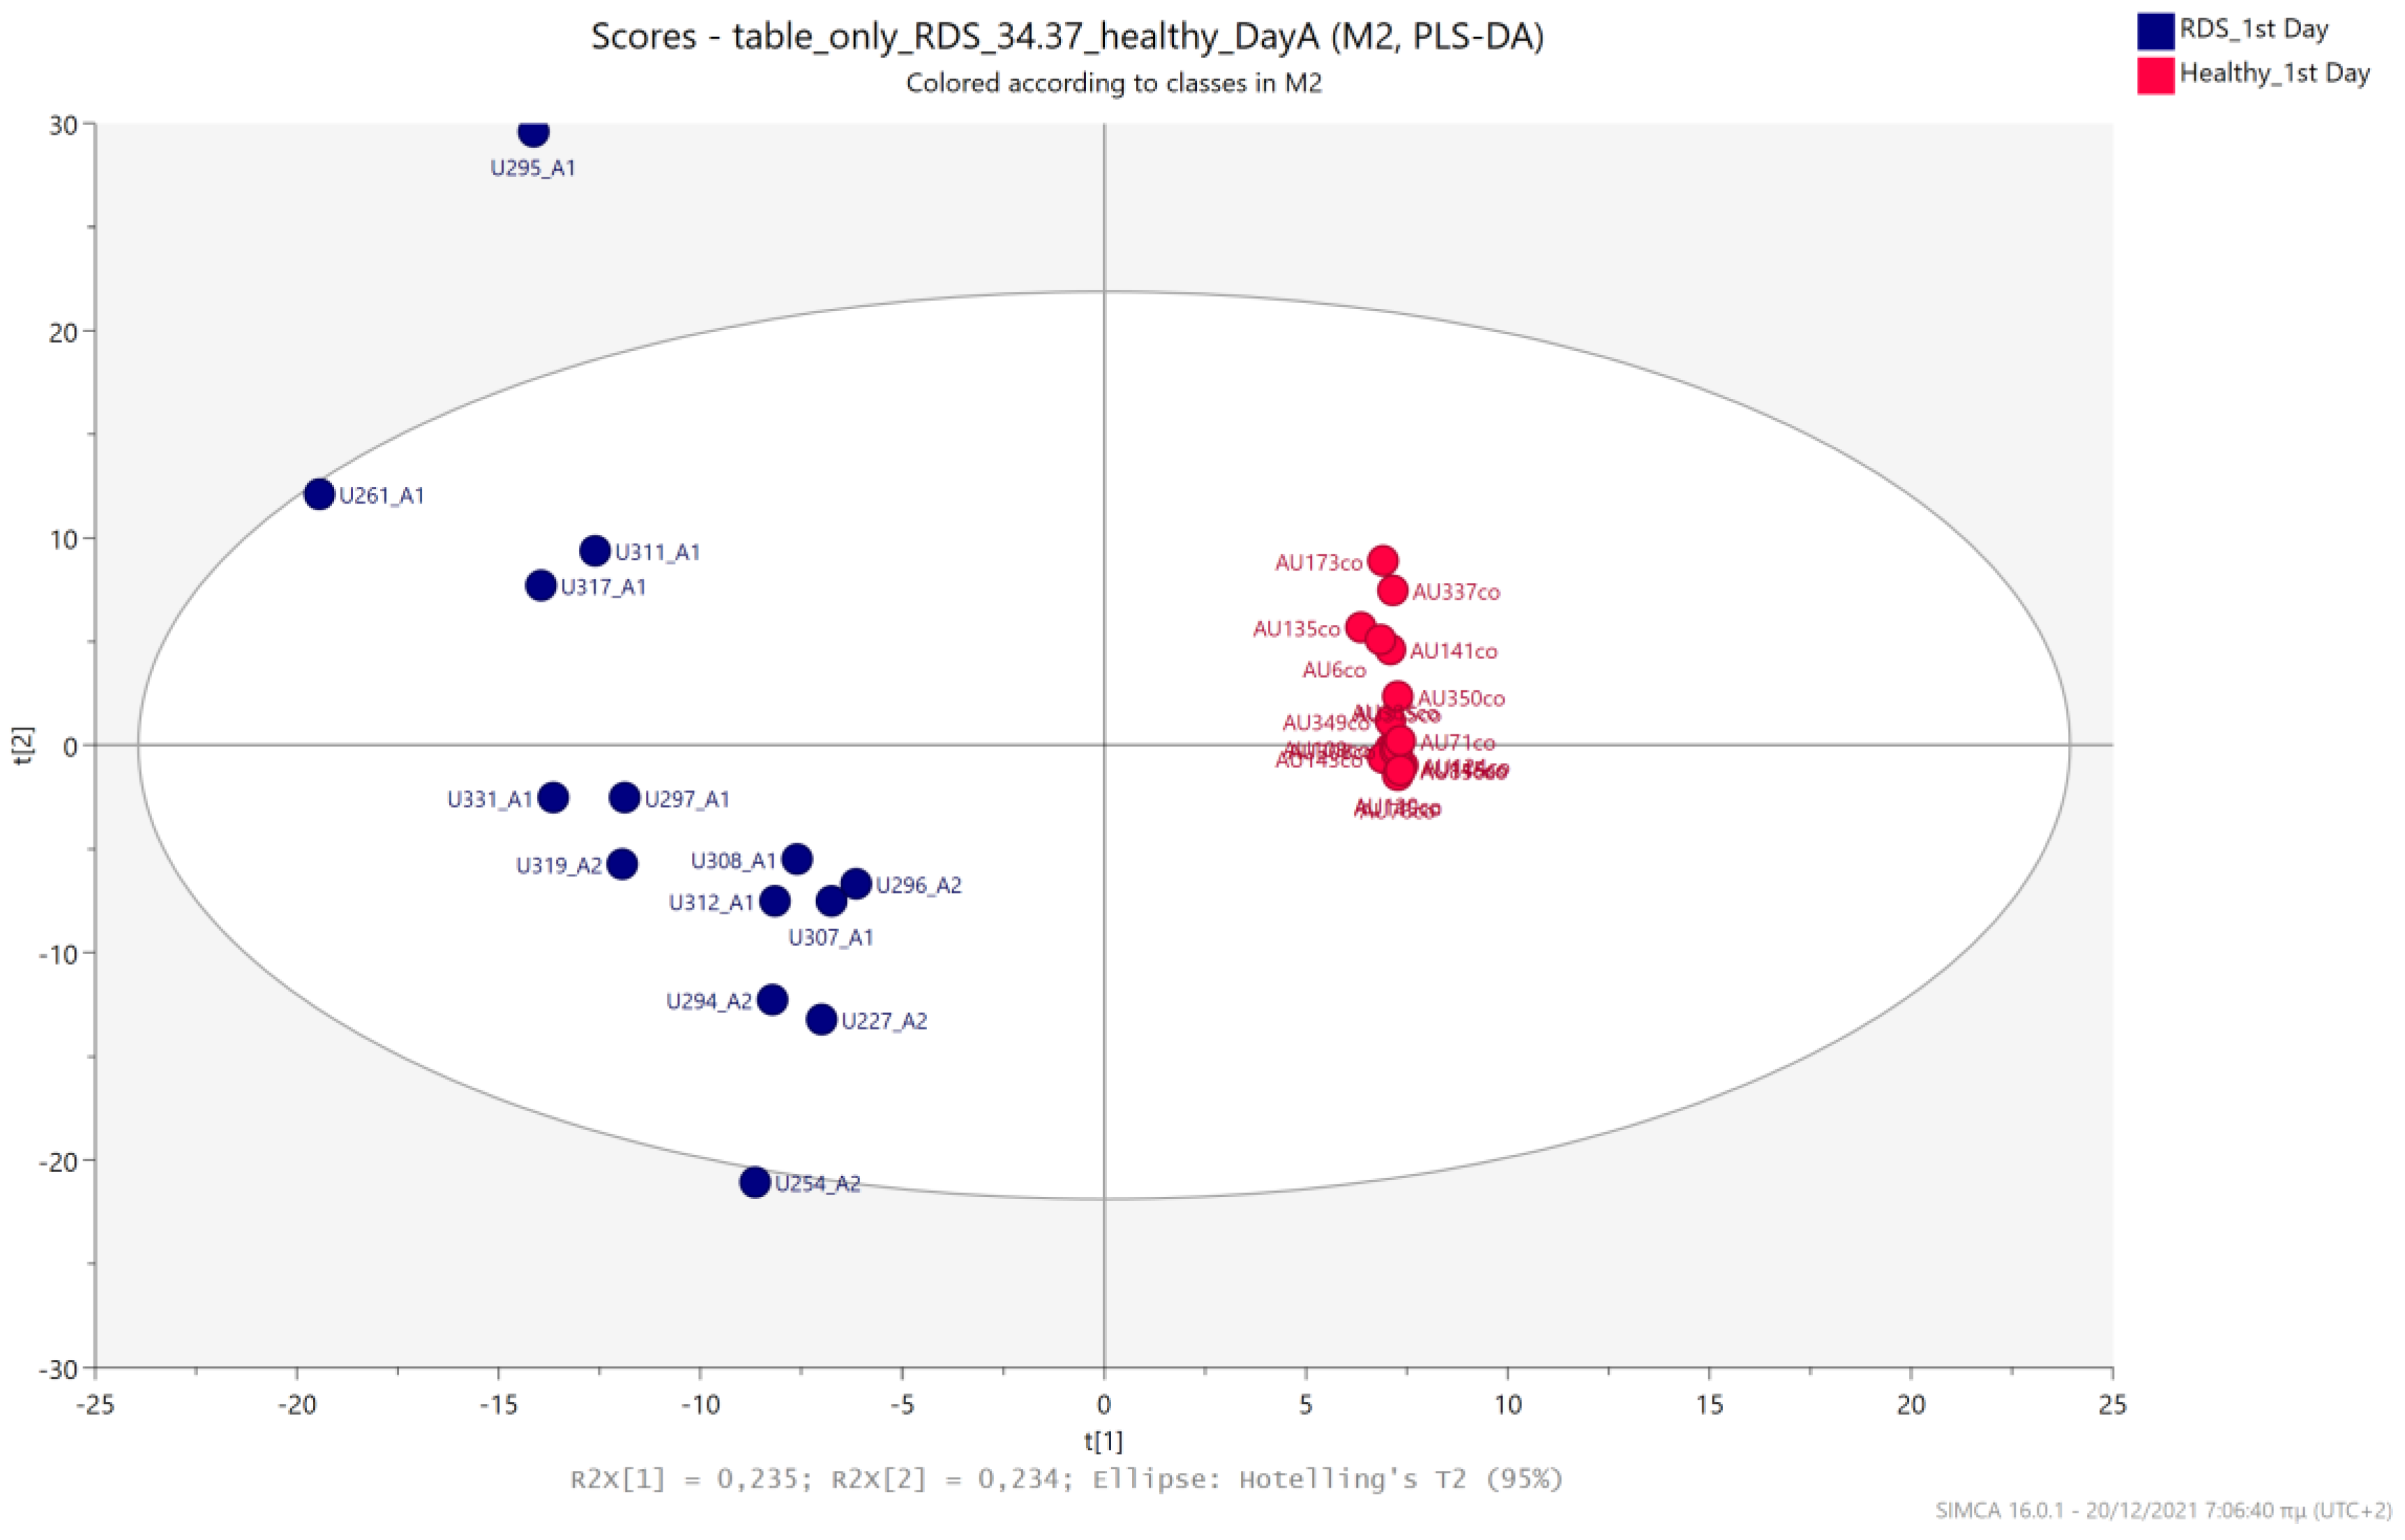
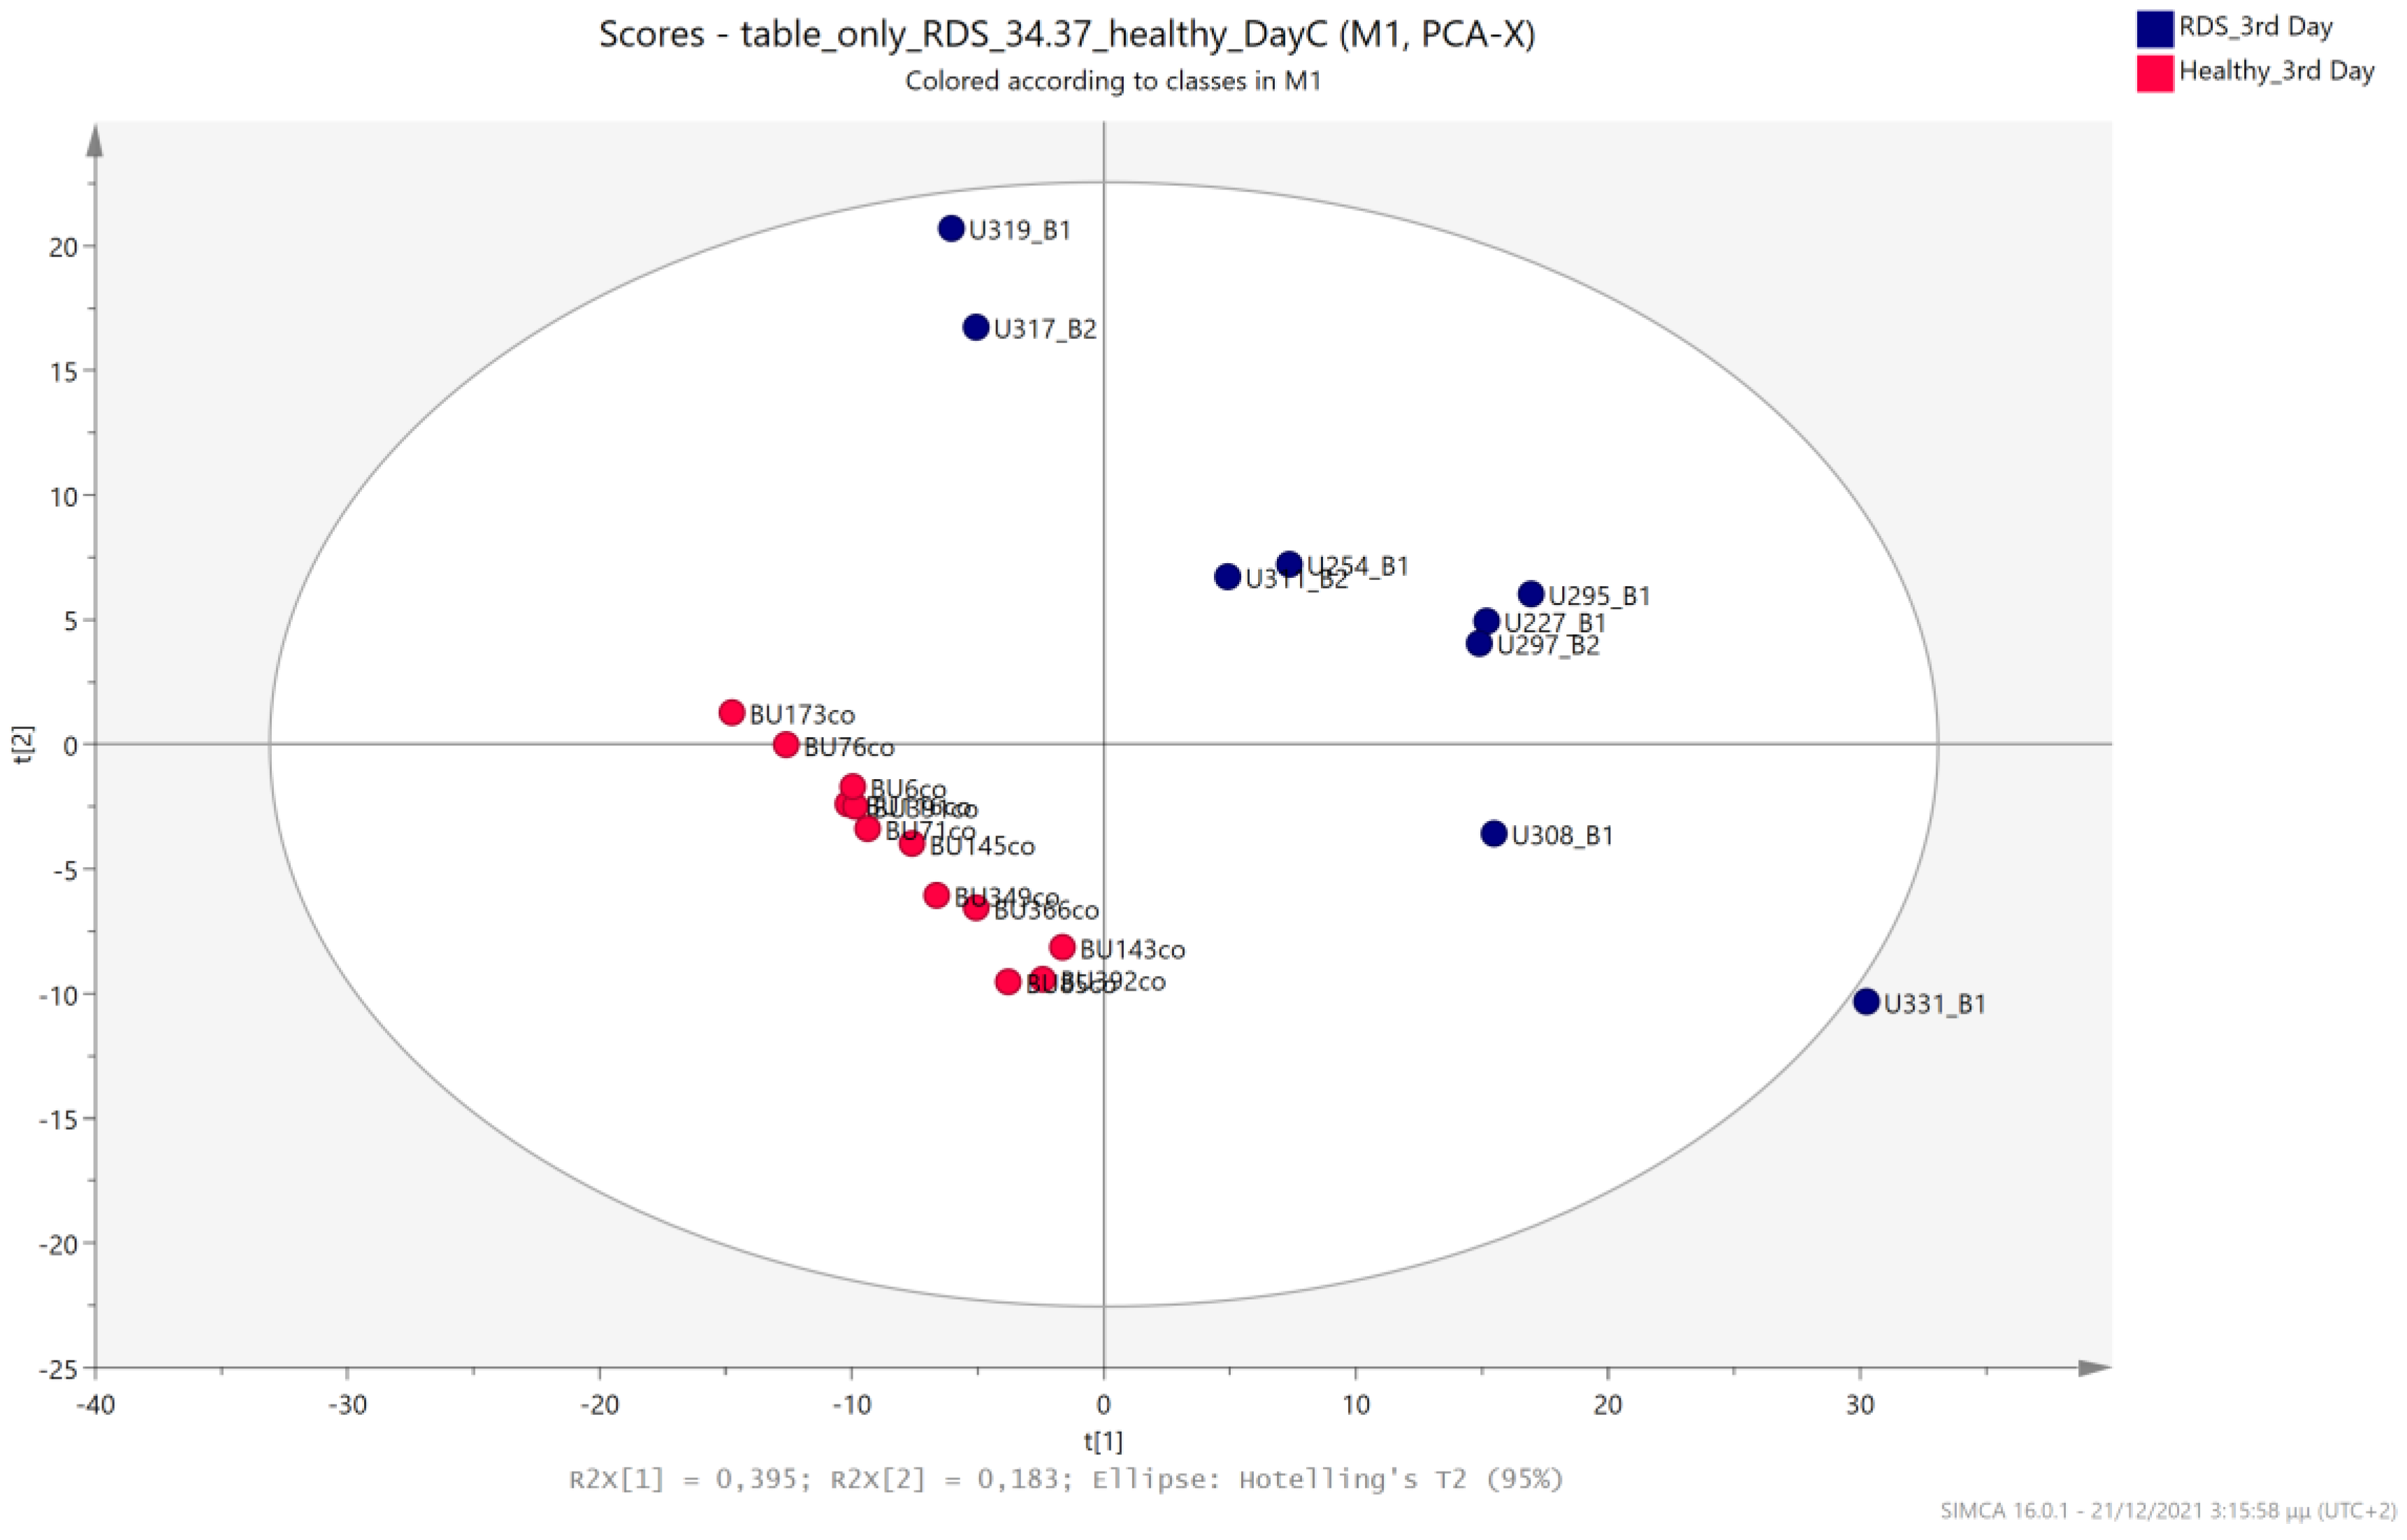
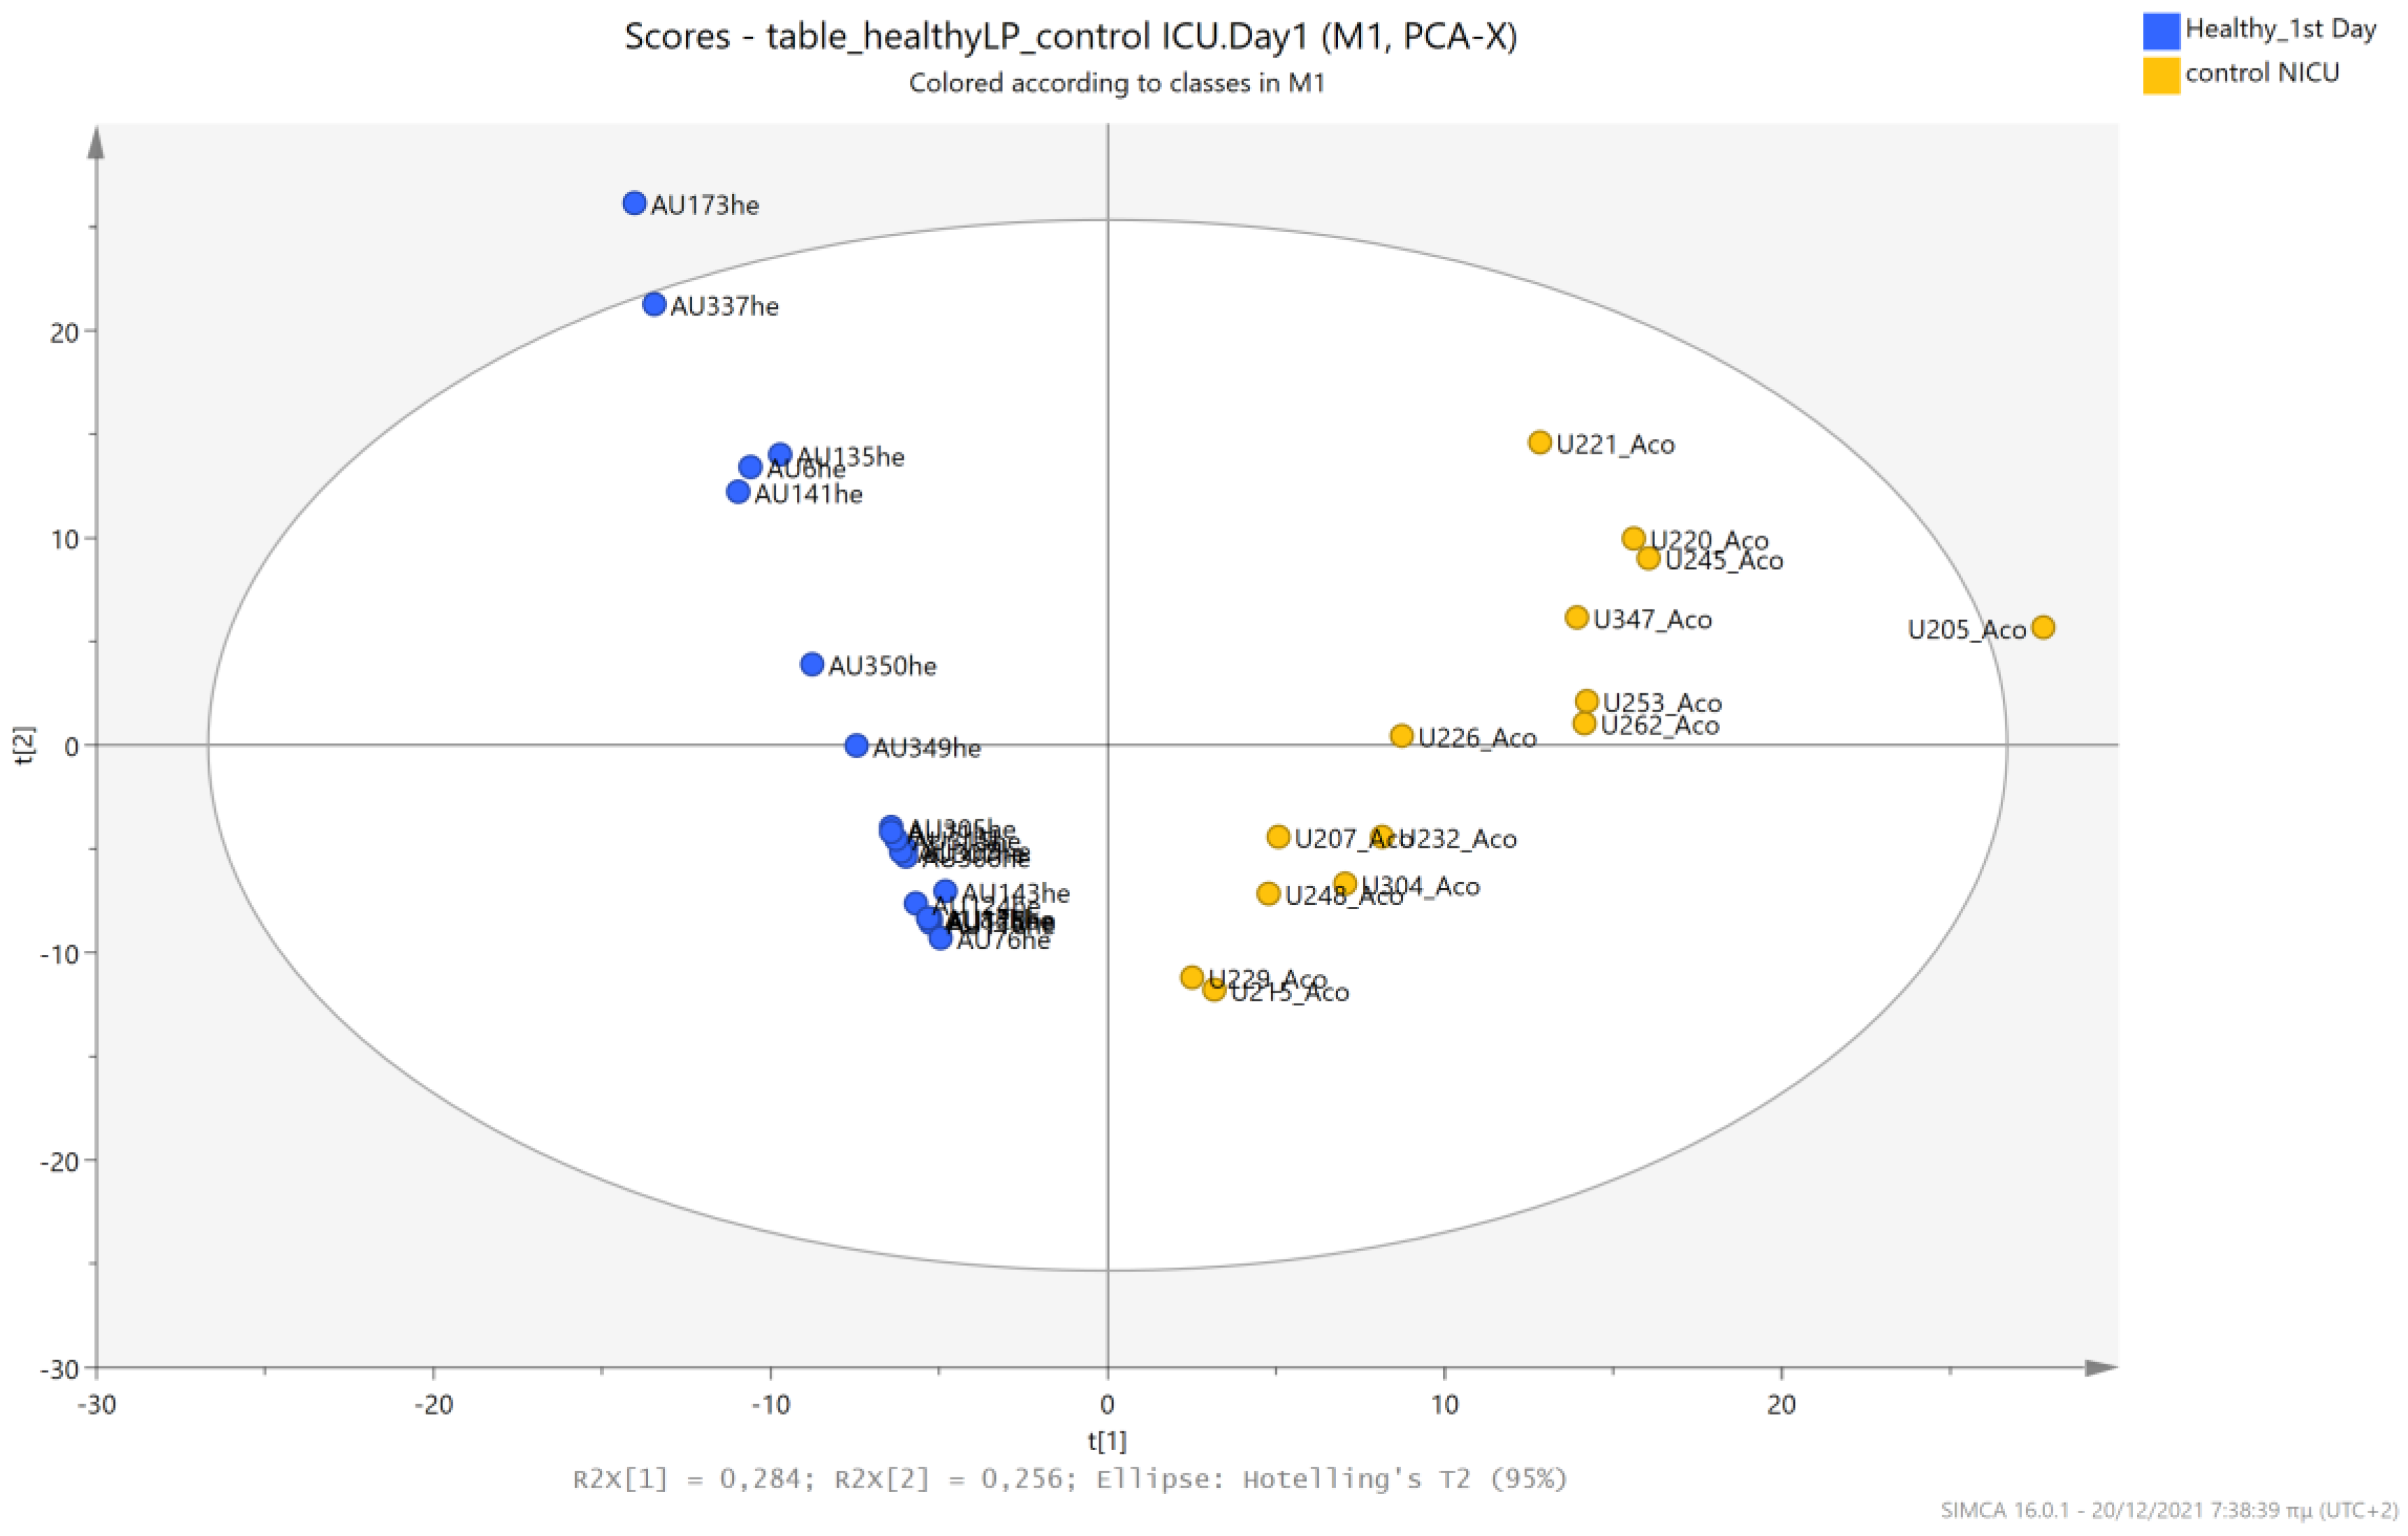
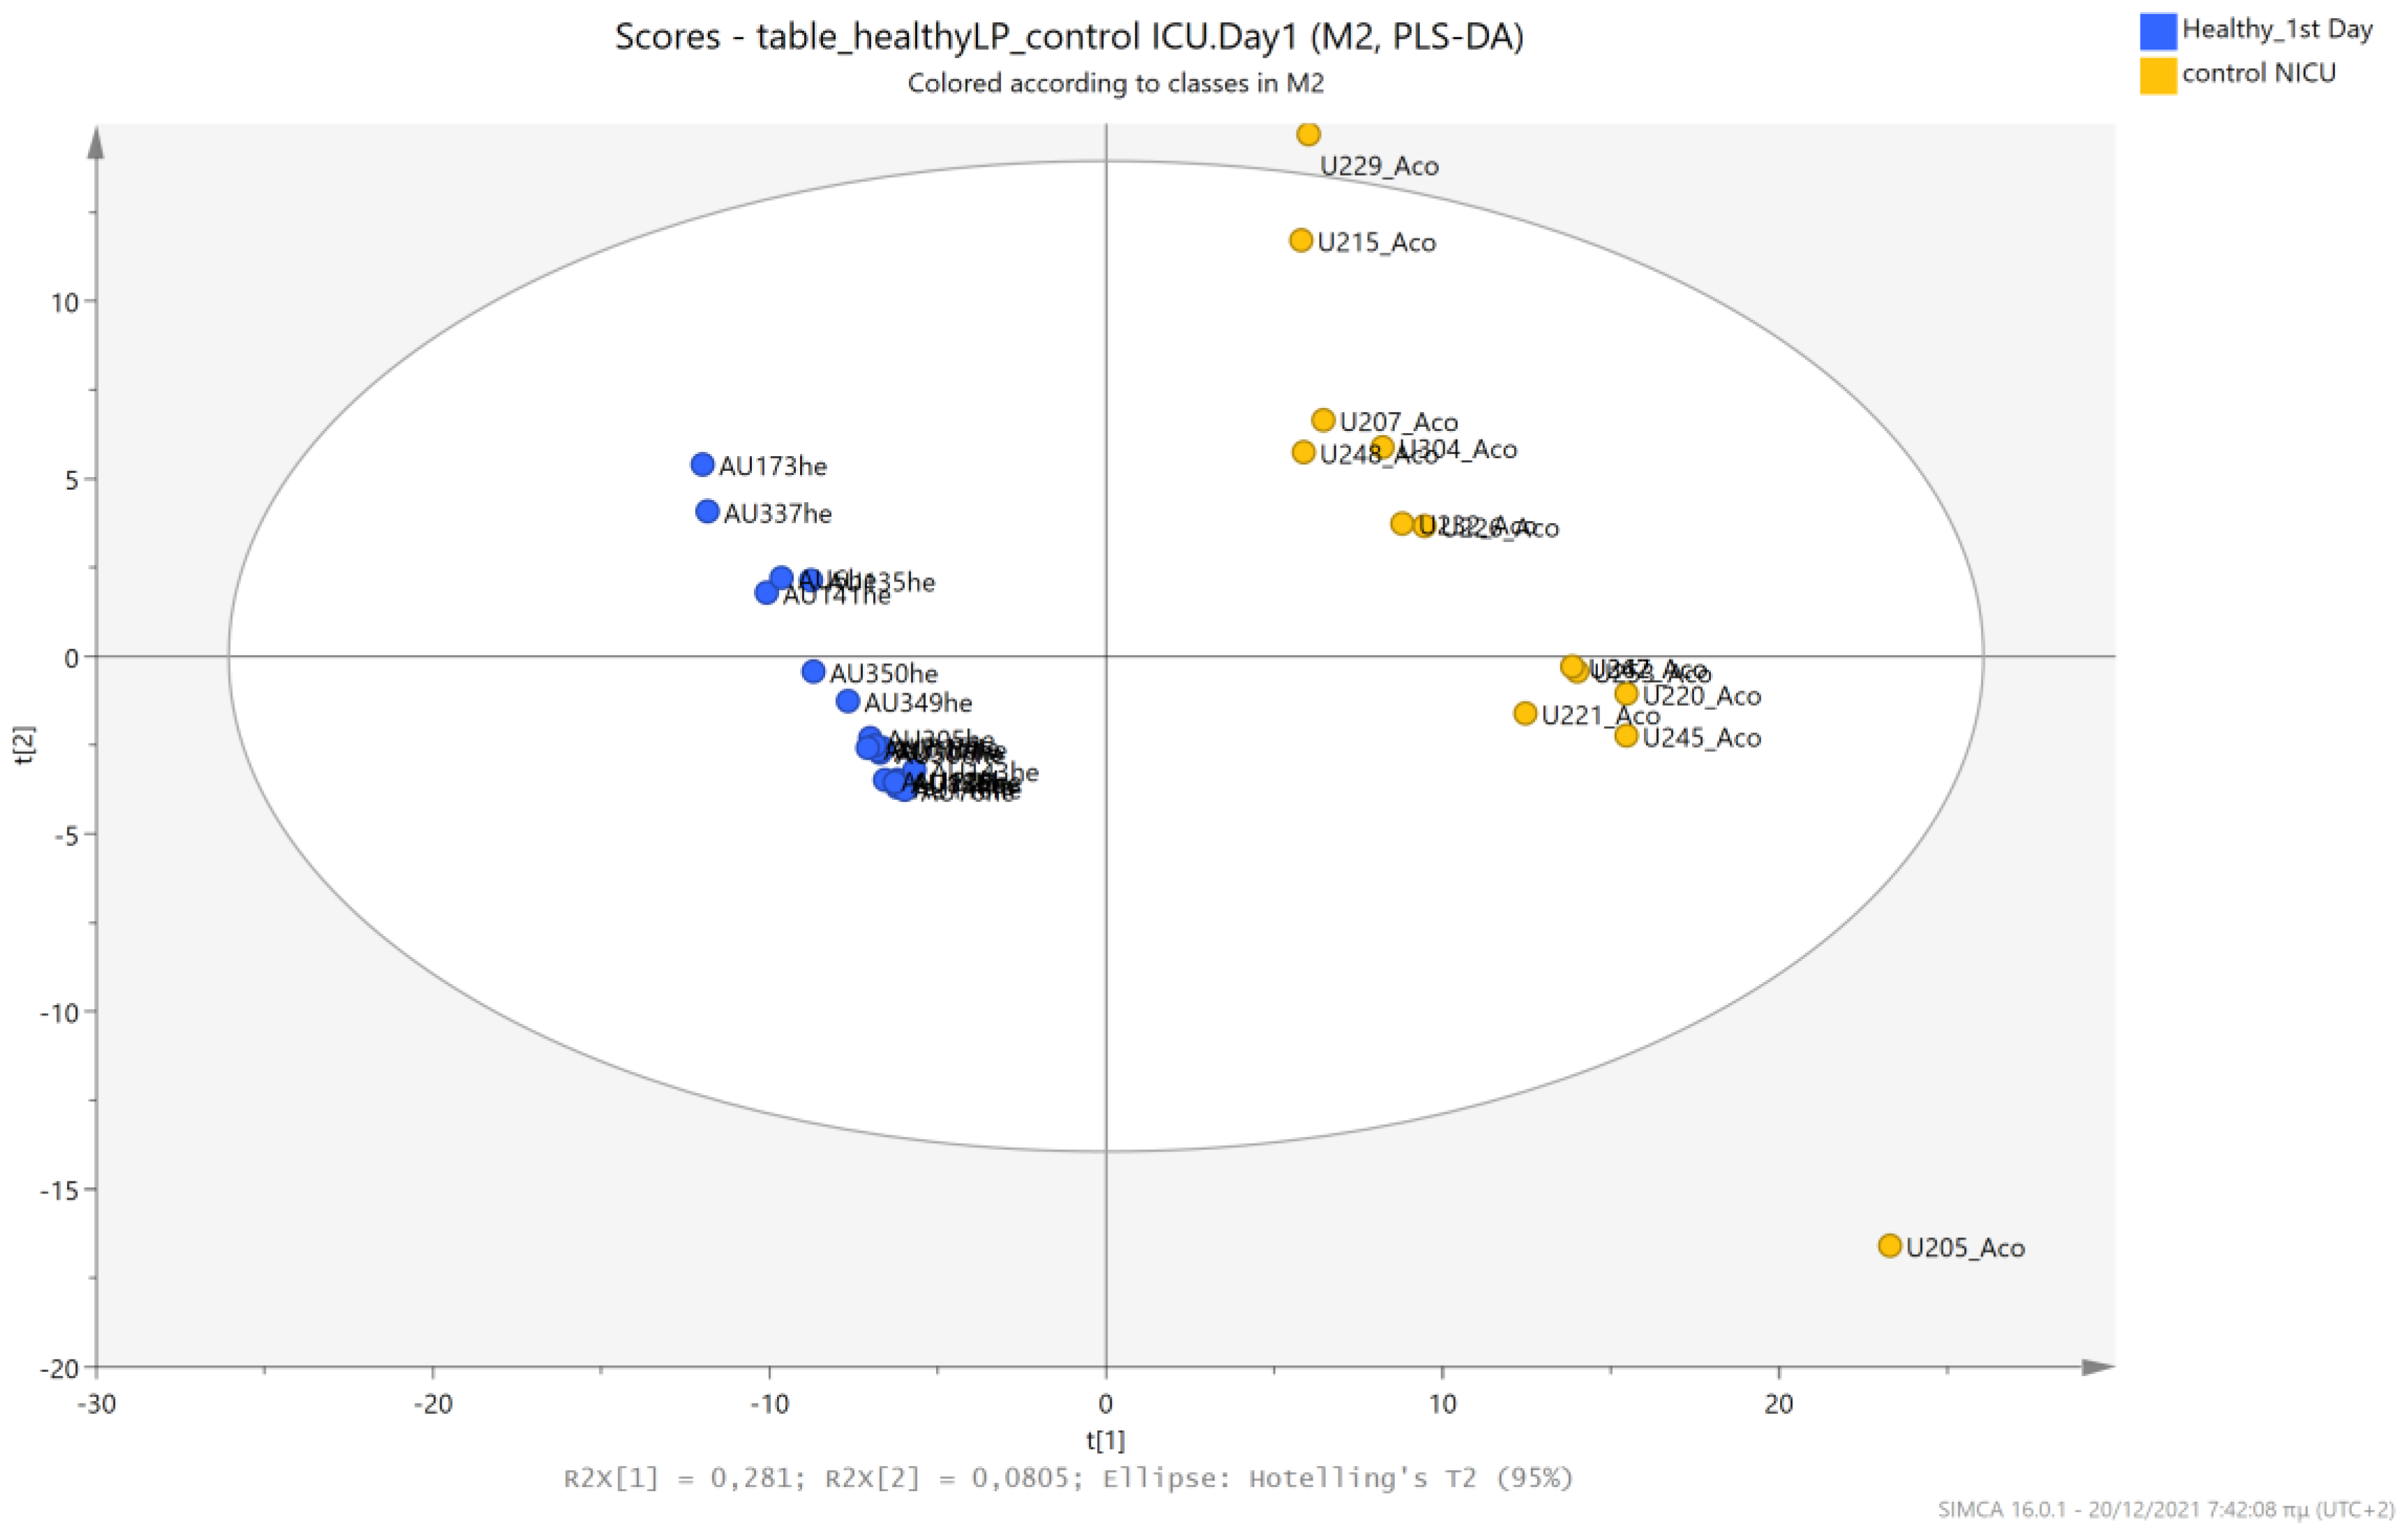
An unsupervised PCA model was first applied to obtain an overview of urine metabolic profiles for the 1st and 3rd days of life. The sample distribution indicates a clustering of the NICU neonates’ urine metabolomes already from the 1st day of their lives. The supervised PLS-DA successfully discriminates neonatal urine metabolomes into two classes (Figure 1, Figure 2, Figure 3 and Figure 4). The presence of gluconate (gluconic acid) in NICU neonates’ urine is the most characteristic difference between the examined groups, and its statistical significance is further confirmed by univariate analysis (Table 2, Figure 5 and Figure 6). A unique metabolic pattern of enhanced metabolites was identified in the NICU admitted LPs. Additionally, gluconate and glycolate were increased in the NICU LPs compared to the controls, while acetoacetate (acetoacetic acid), hippuric acid (hippurate), and lactose were significantly decreased in the NICU LPs (Table 2).

5.2. NICU LPs with RDS vs. NICU LPs without RDS (Control NICU)

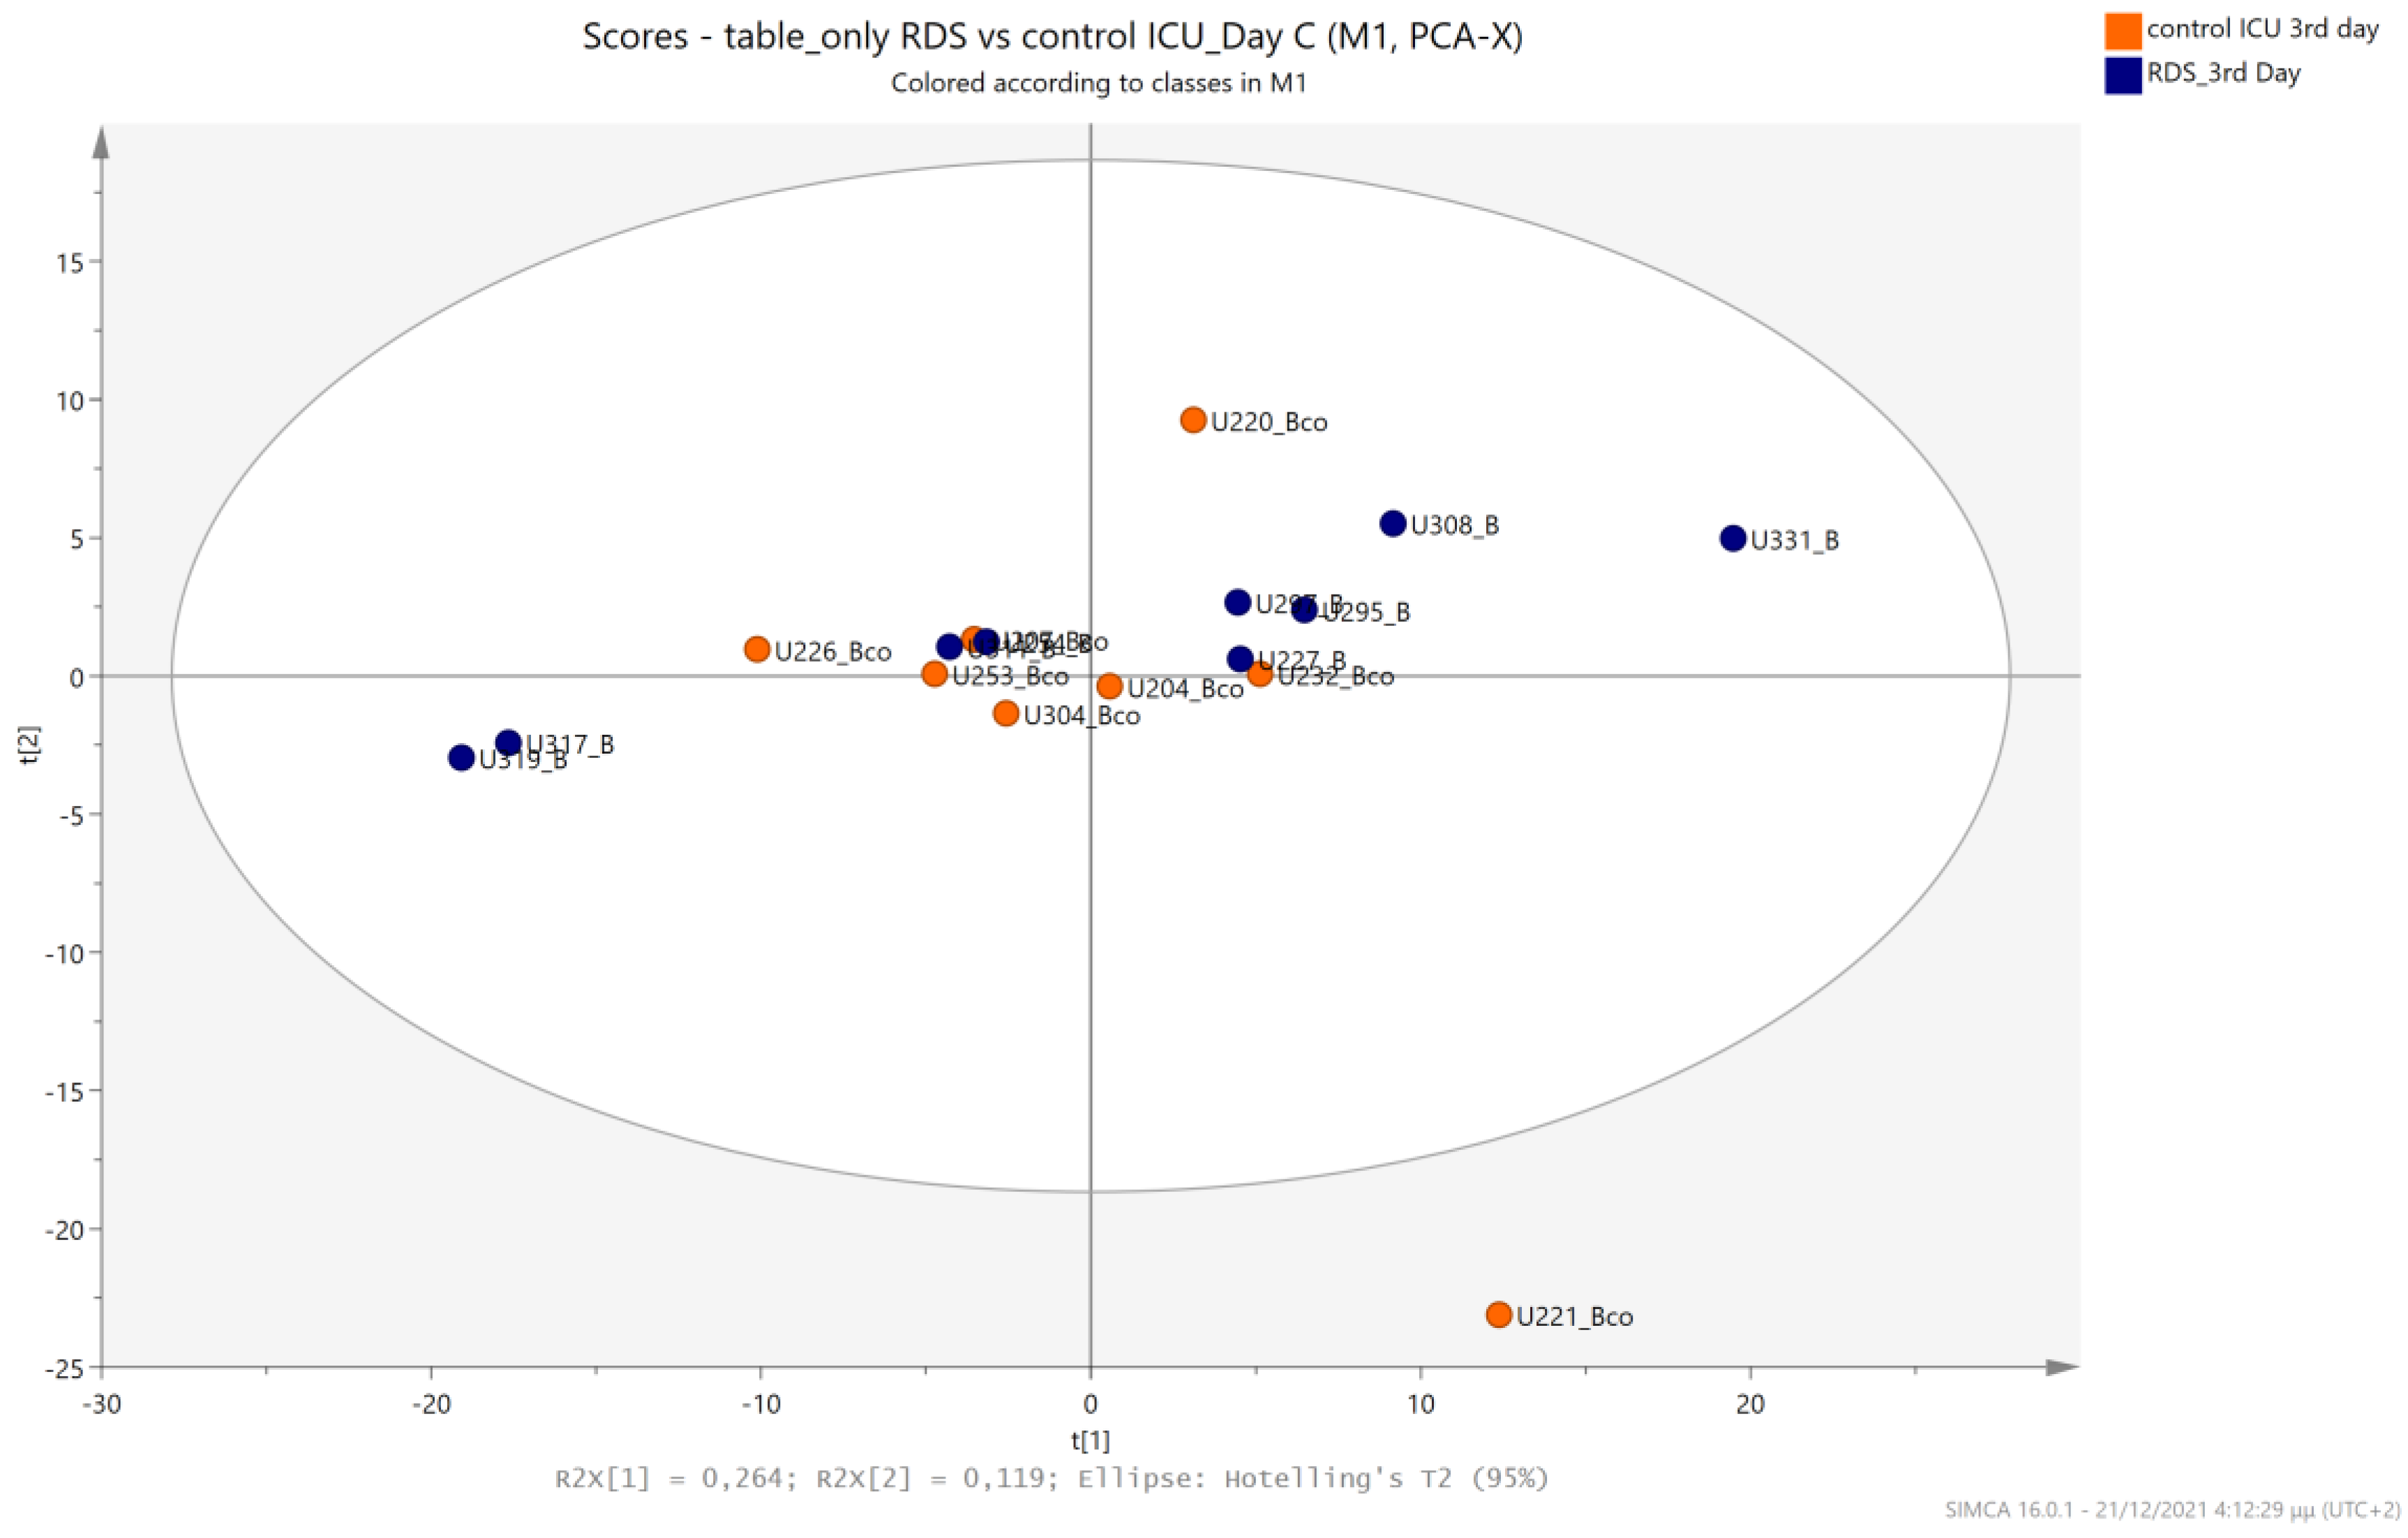
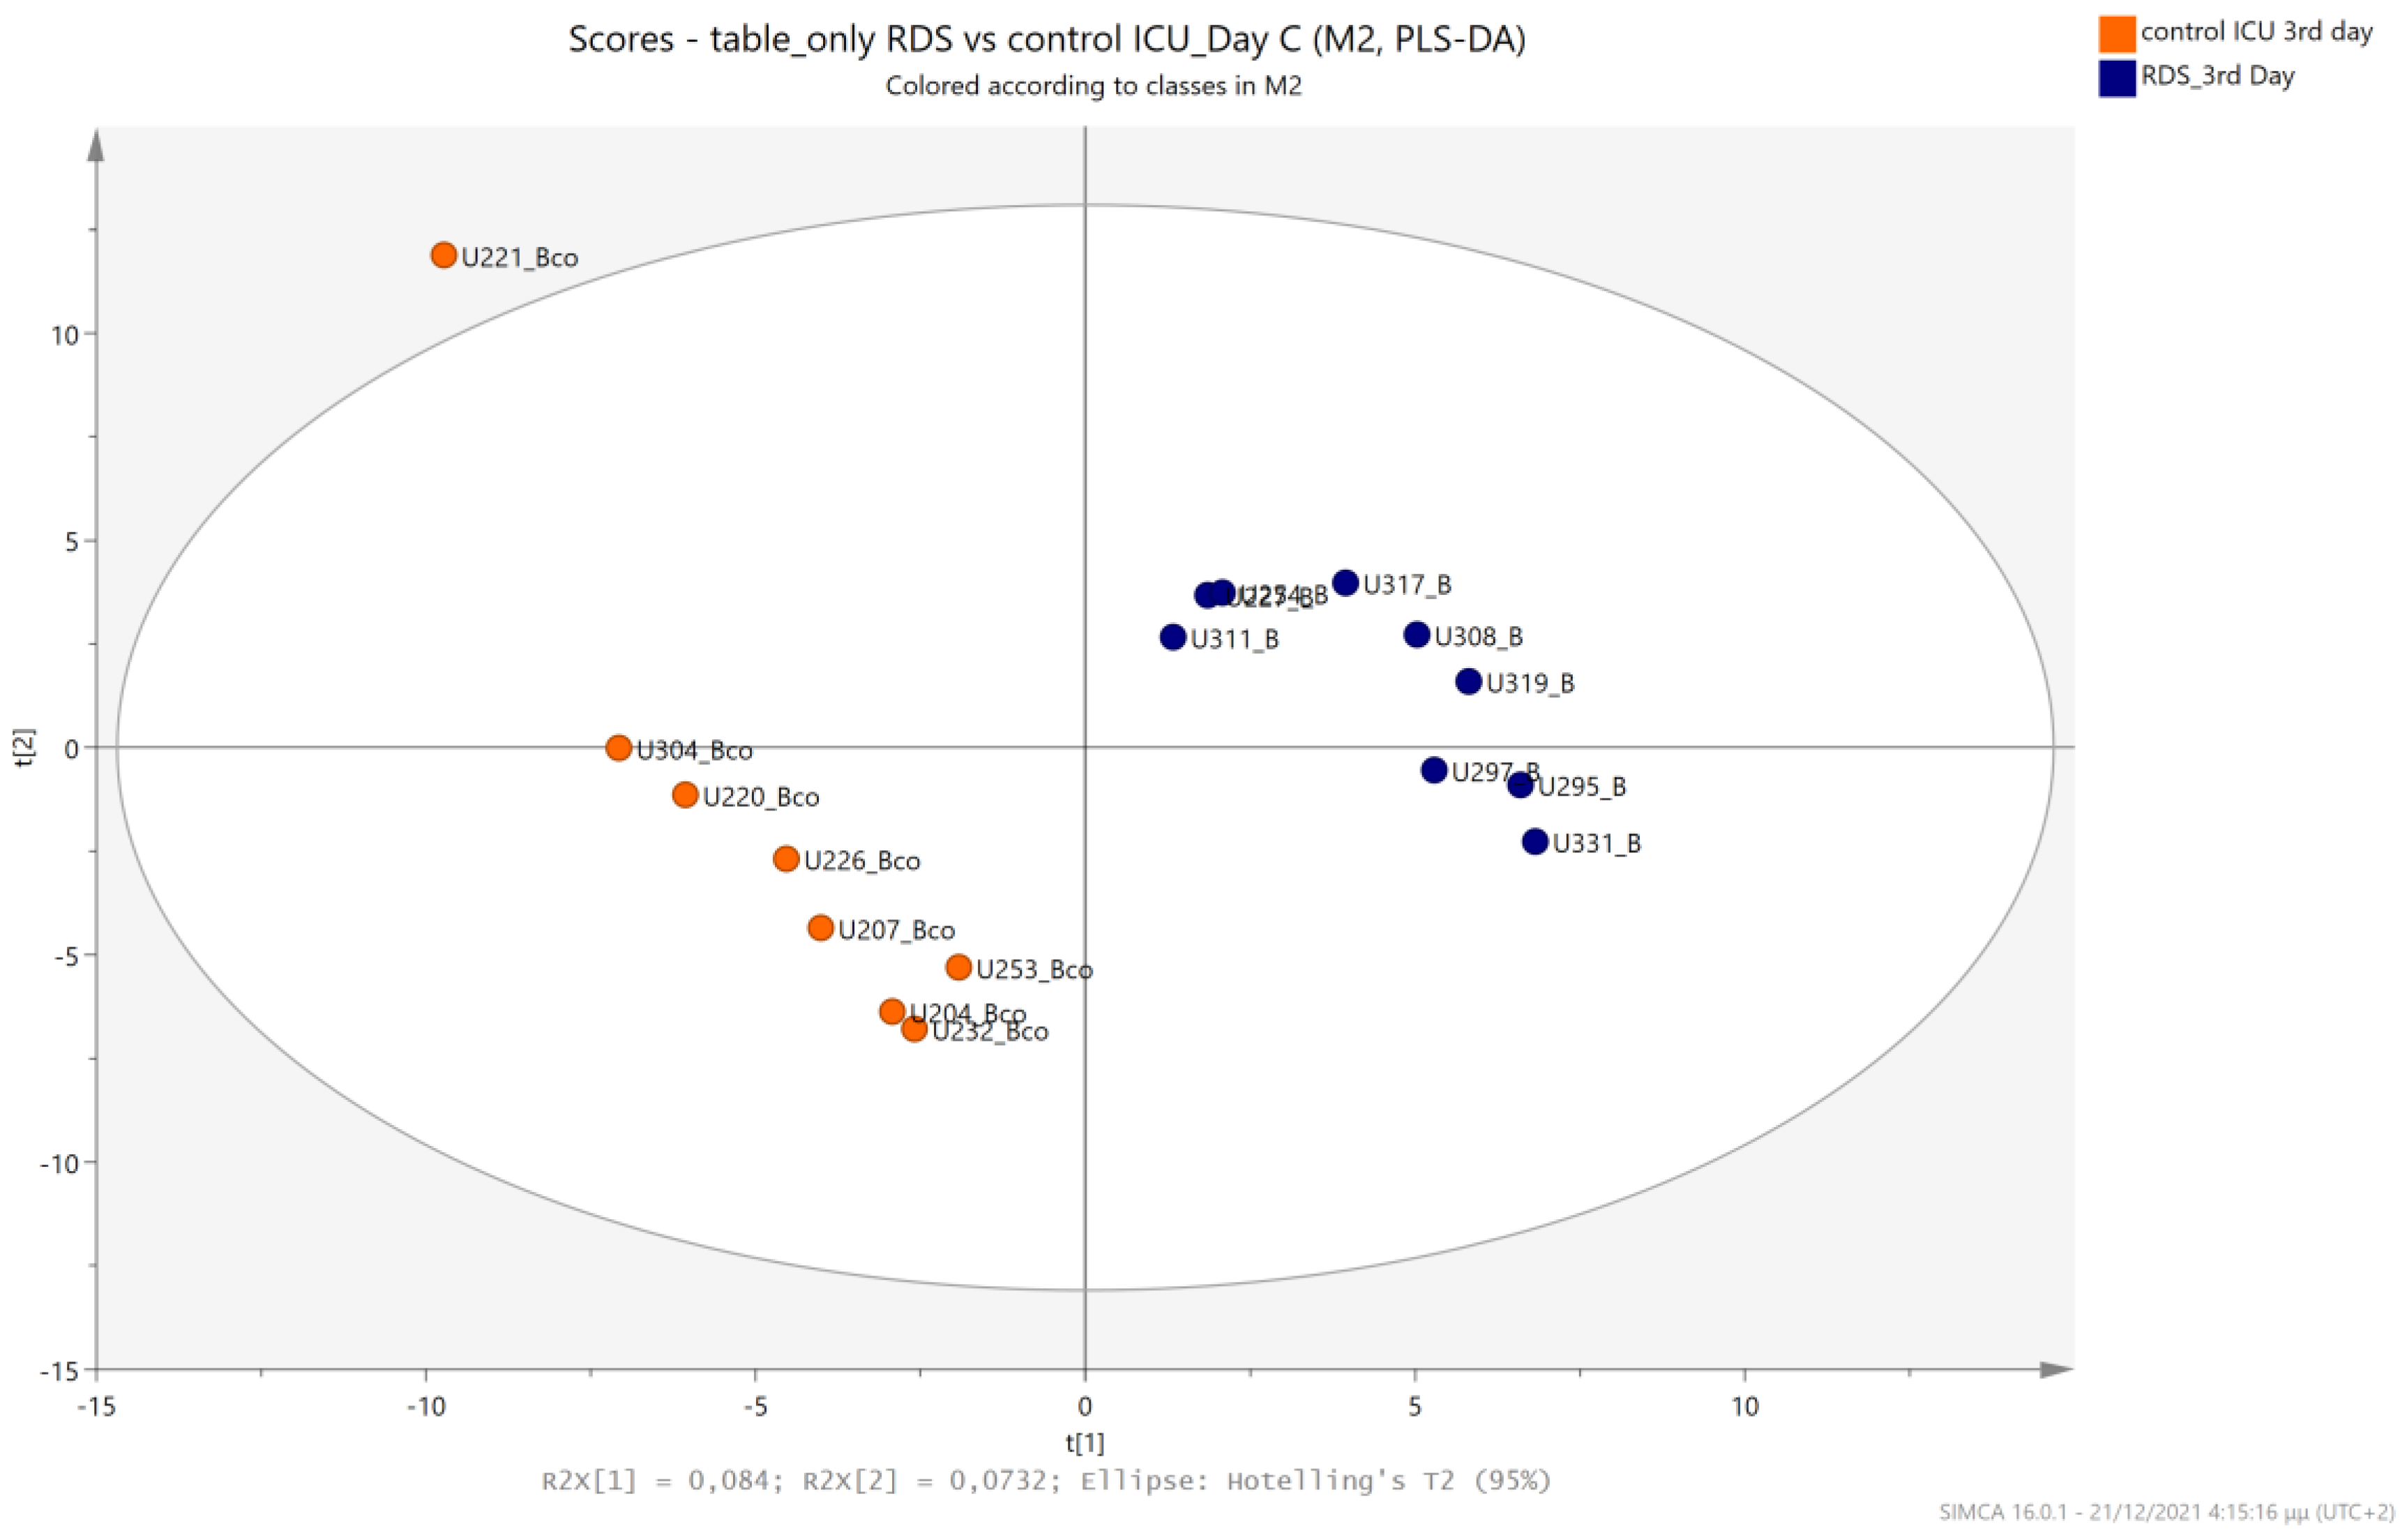
The urine metabolic profiles of LPs hospitalized in the NICU and diagnosed with RDS were analyzed and compared to the urine metabolic profiles of age-matched LPs hospitalized in the NICU but without RDS. PCA analysis of the 1st day urine metabolome (Figure 7) and PLS-DA (Figure 8) were able to discriminate adequately between the two groups with R2Y (cum) = 93.4% and Q2 (cum) = 36.7%, despite the limited population. PCA and PLS-DA multivariate analyses based on the metabolic profiles from urine collected on the 3rd day of newborns’ lives exhibit the same high classification rates (Figure 9 and Figure 10), with R2Y (cum) = 99.5% and Q2 (cum) = 8.37%.
A heatmap visualization of the targeted urine metabolites on the first and third days of life is shown in Figure S1.
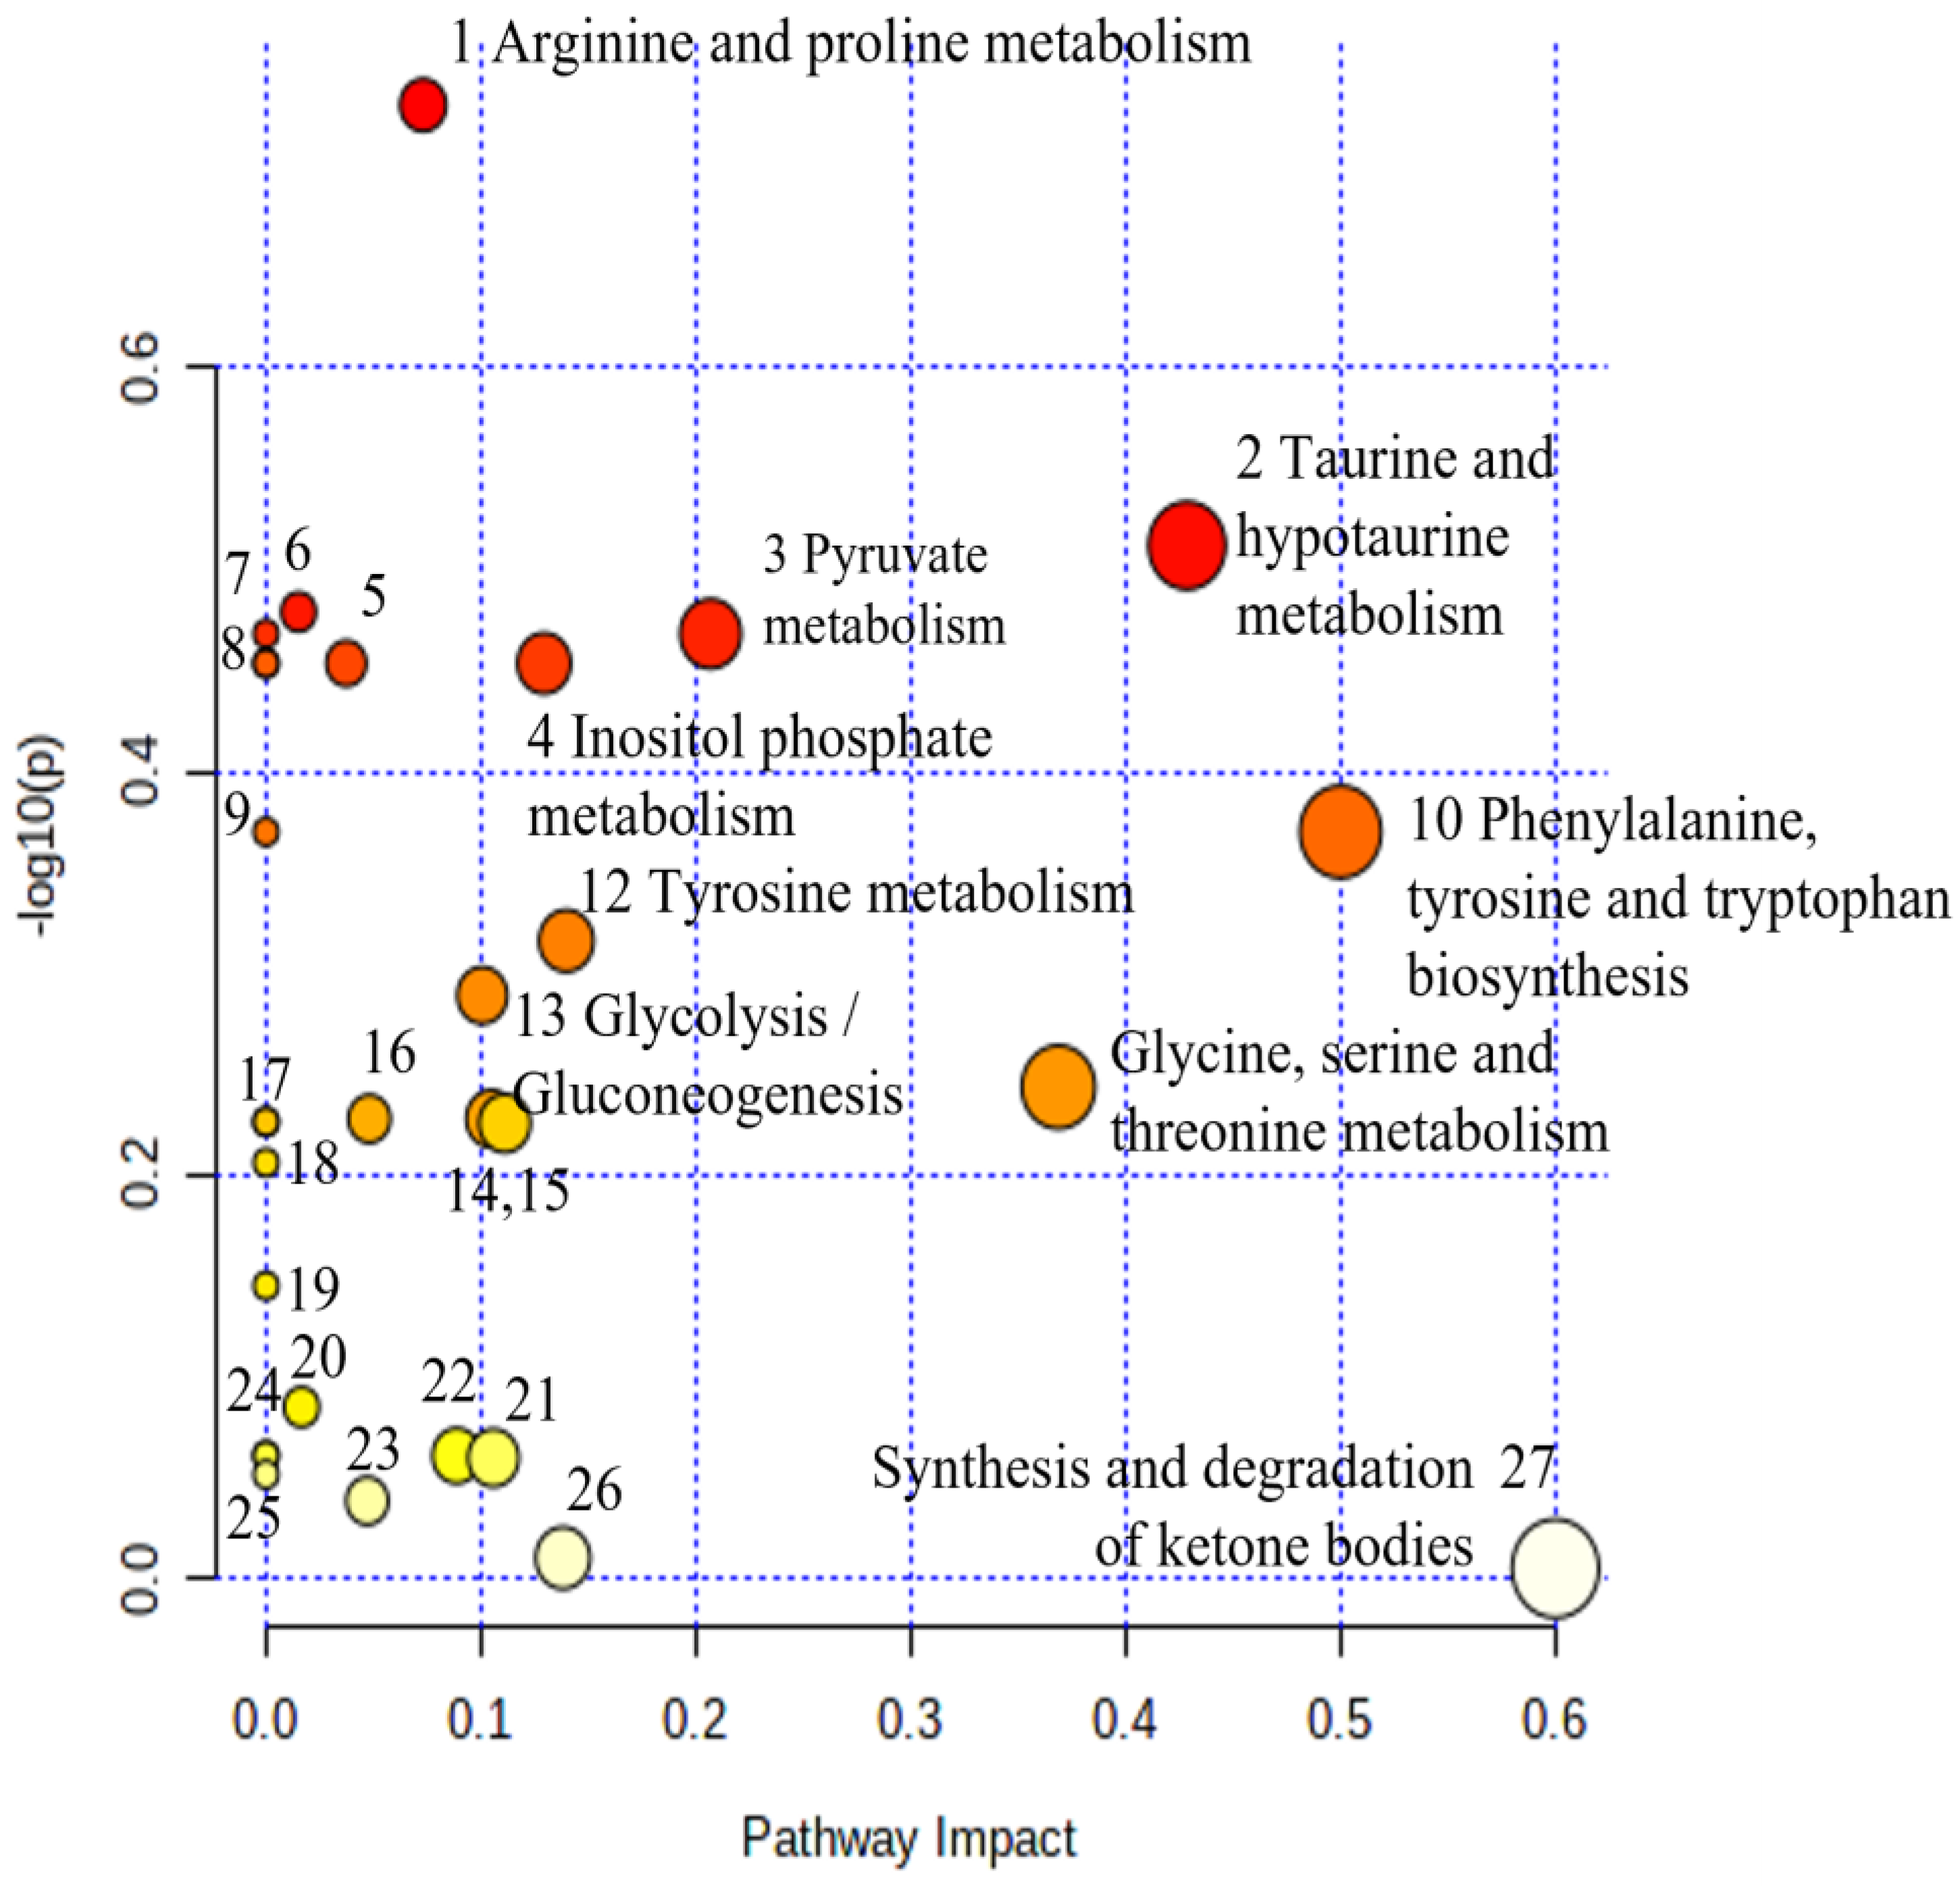
Table 3 shows the urine metabolites exhibiting statistically significant differences between the two groups. The involved metabolic pathways based on the discriminant urine metabolite levels are shown in Table 4 and Figure 11.

5.3. NICU LPs with RDS vs. Healthy LP Neonates

Urine metabolic profiles of LPs hospitalized in the NICU diagnosed with RDS were analyzed and compared to the urinary metabolic profiles of healthy, age-matched LPs. PCA and PLS-DA models (Figure 12, Figure 13, Figure 14 and Figure 15) lead to a distinct categorization with R2Y (cum) = 99.5% and Q2 (cum) = 91.3% for the 1st day of life and R2Y (cum) = 99.9% and Q2 (cum) = 98.8% for the 3rd day of life.
A heatmap visualization of the targeted urine metabolites on the first and third days of life is shown in Figure S2, respectively.
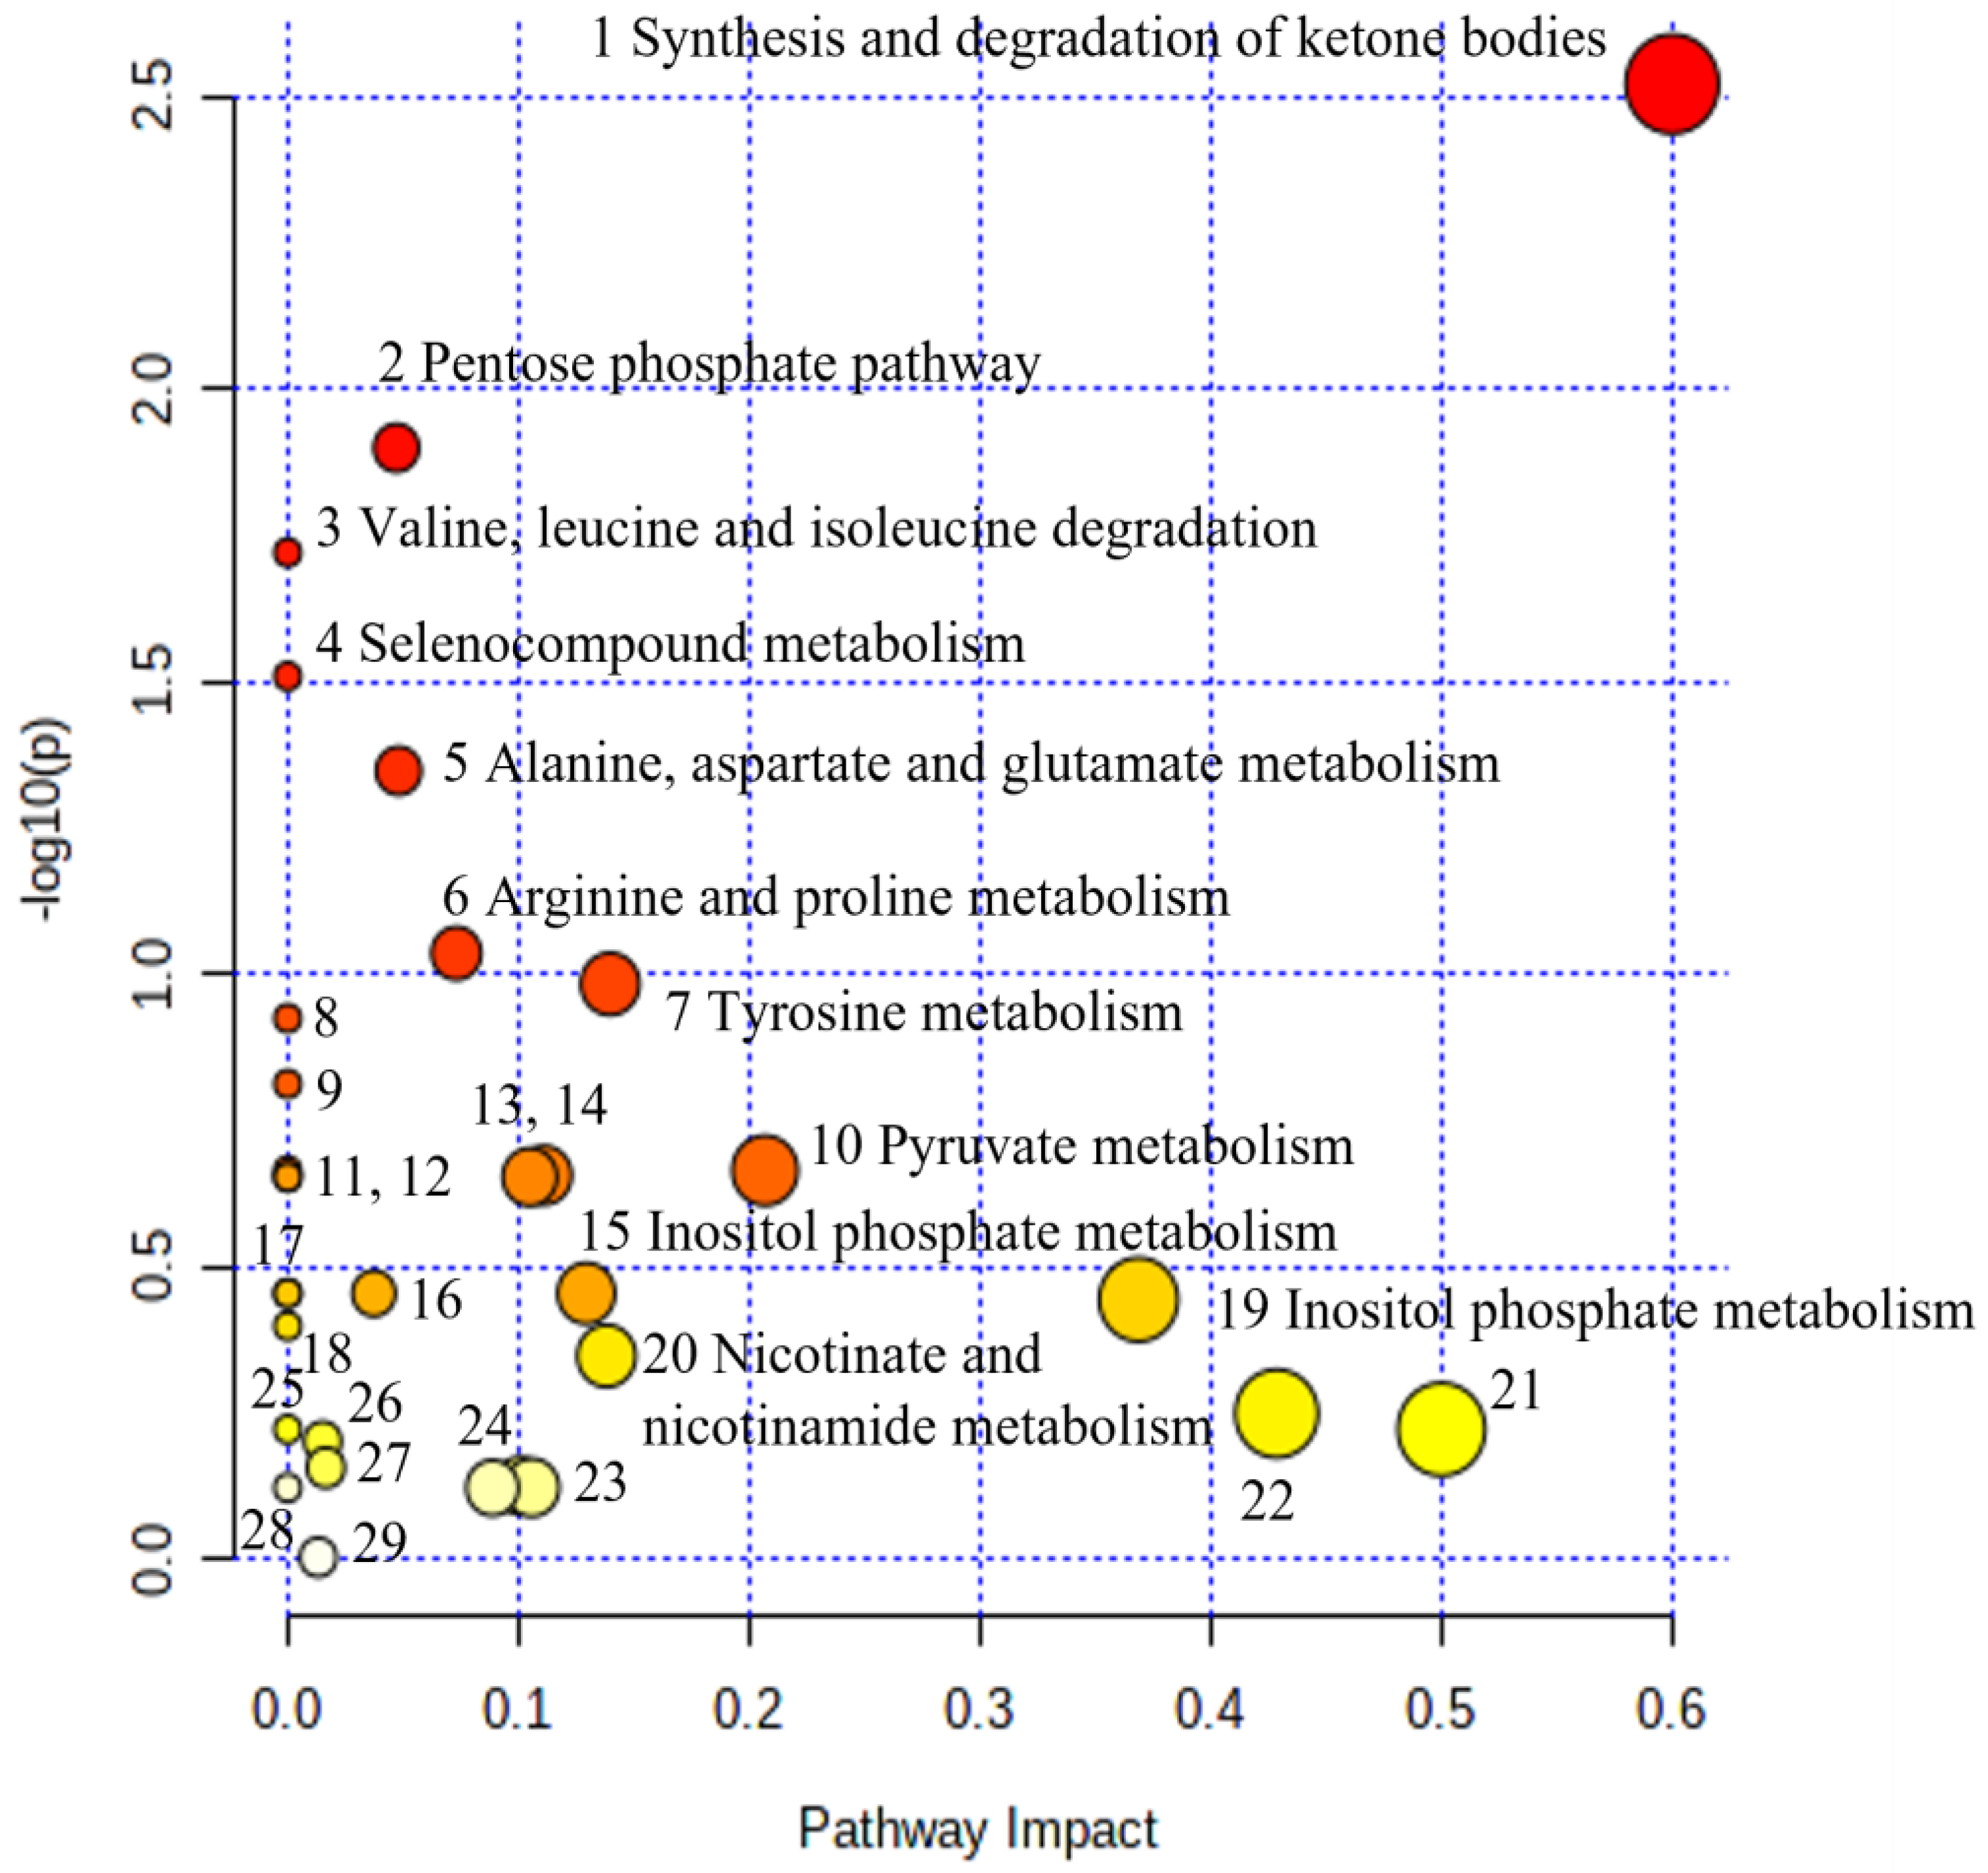
Table 5 shows the urine metabolites exhibiting statistically significant differences between the two groups. The metabolic pathways based on the discriminant urine metabolite levels involved are shown in Figure 16.

5.4. NICU LPs without RDS (Control NICU) vs. Healthy (Age-Matched) LPs

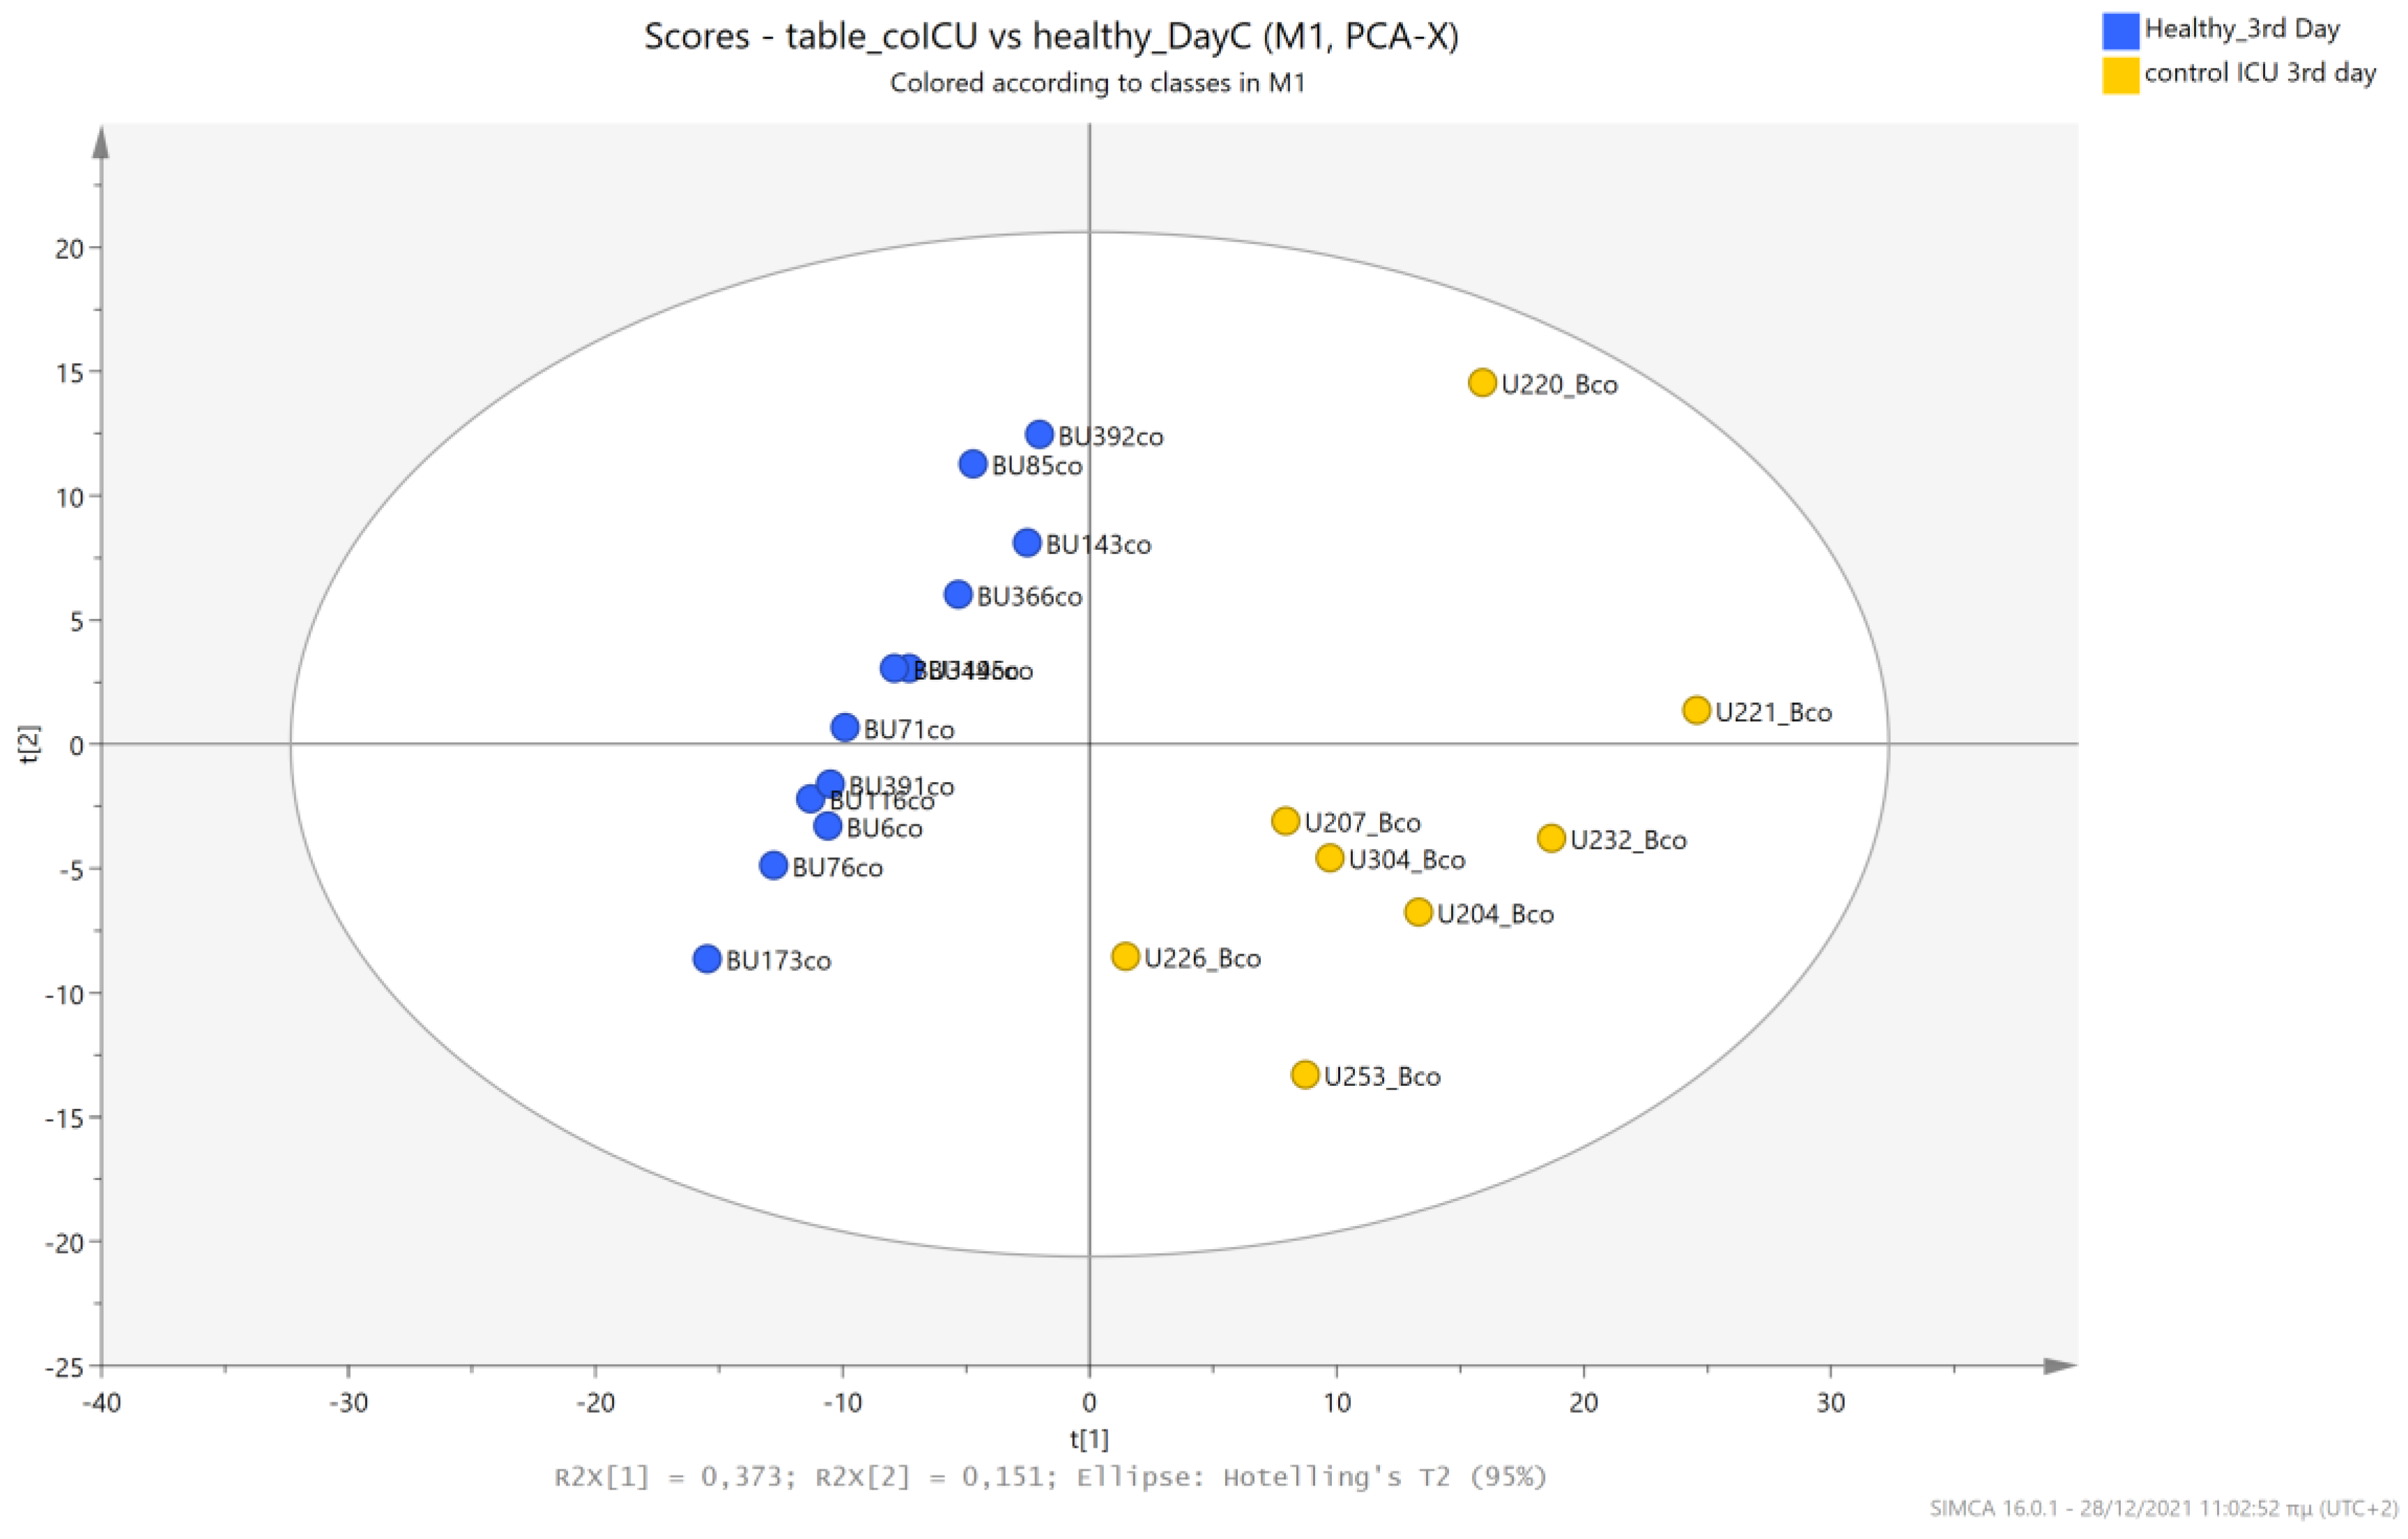
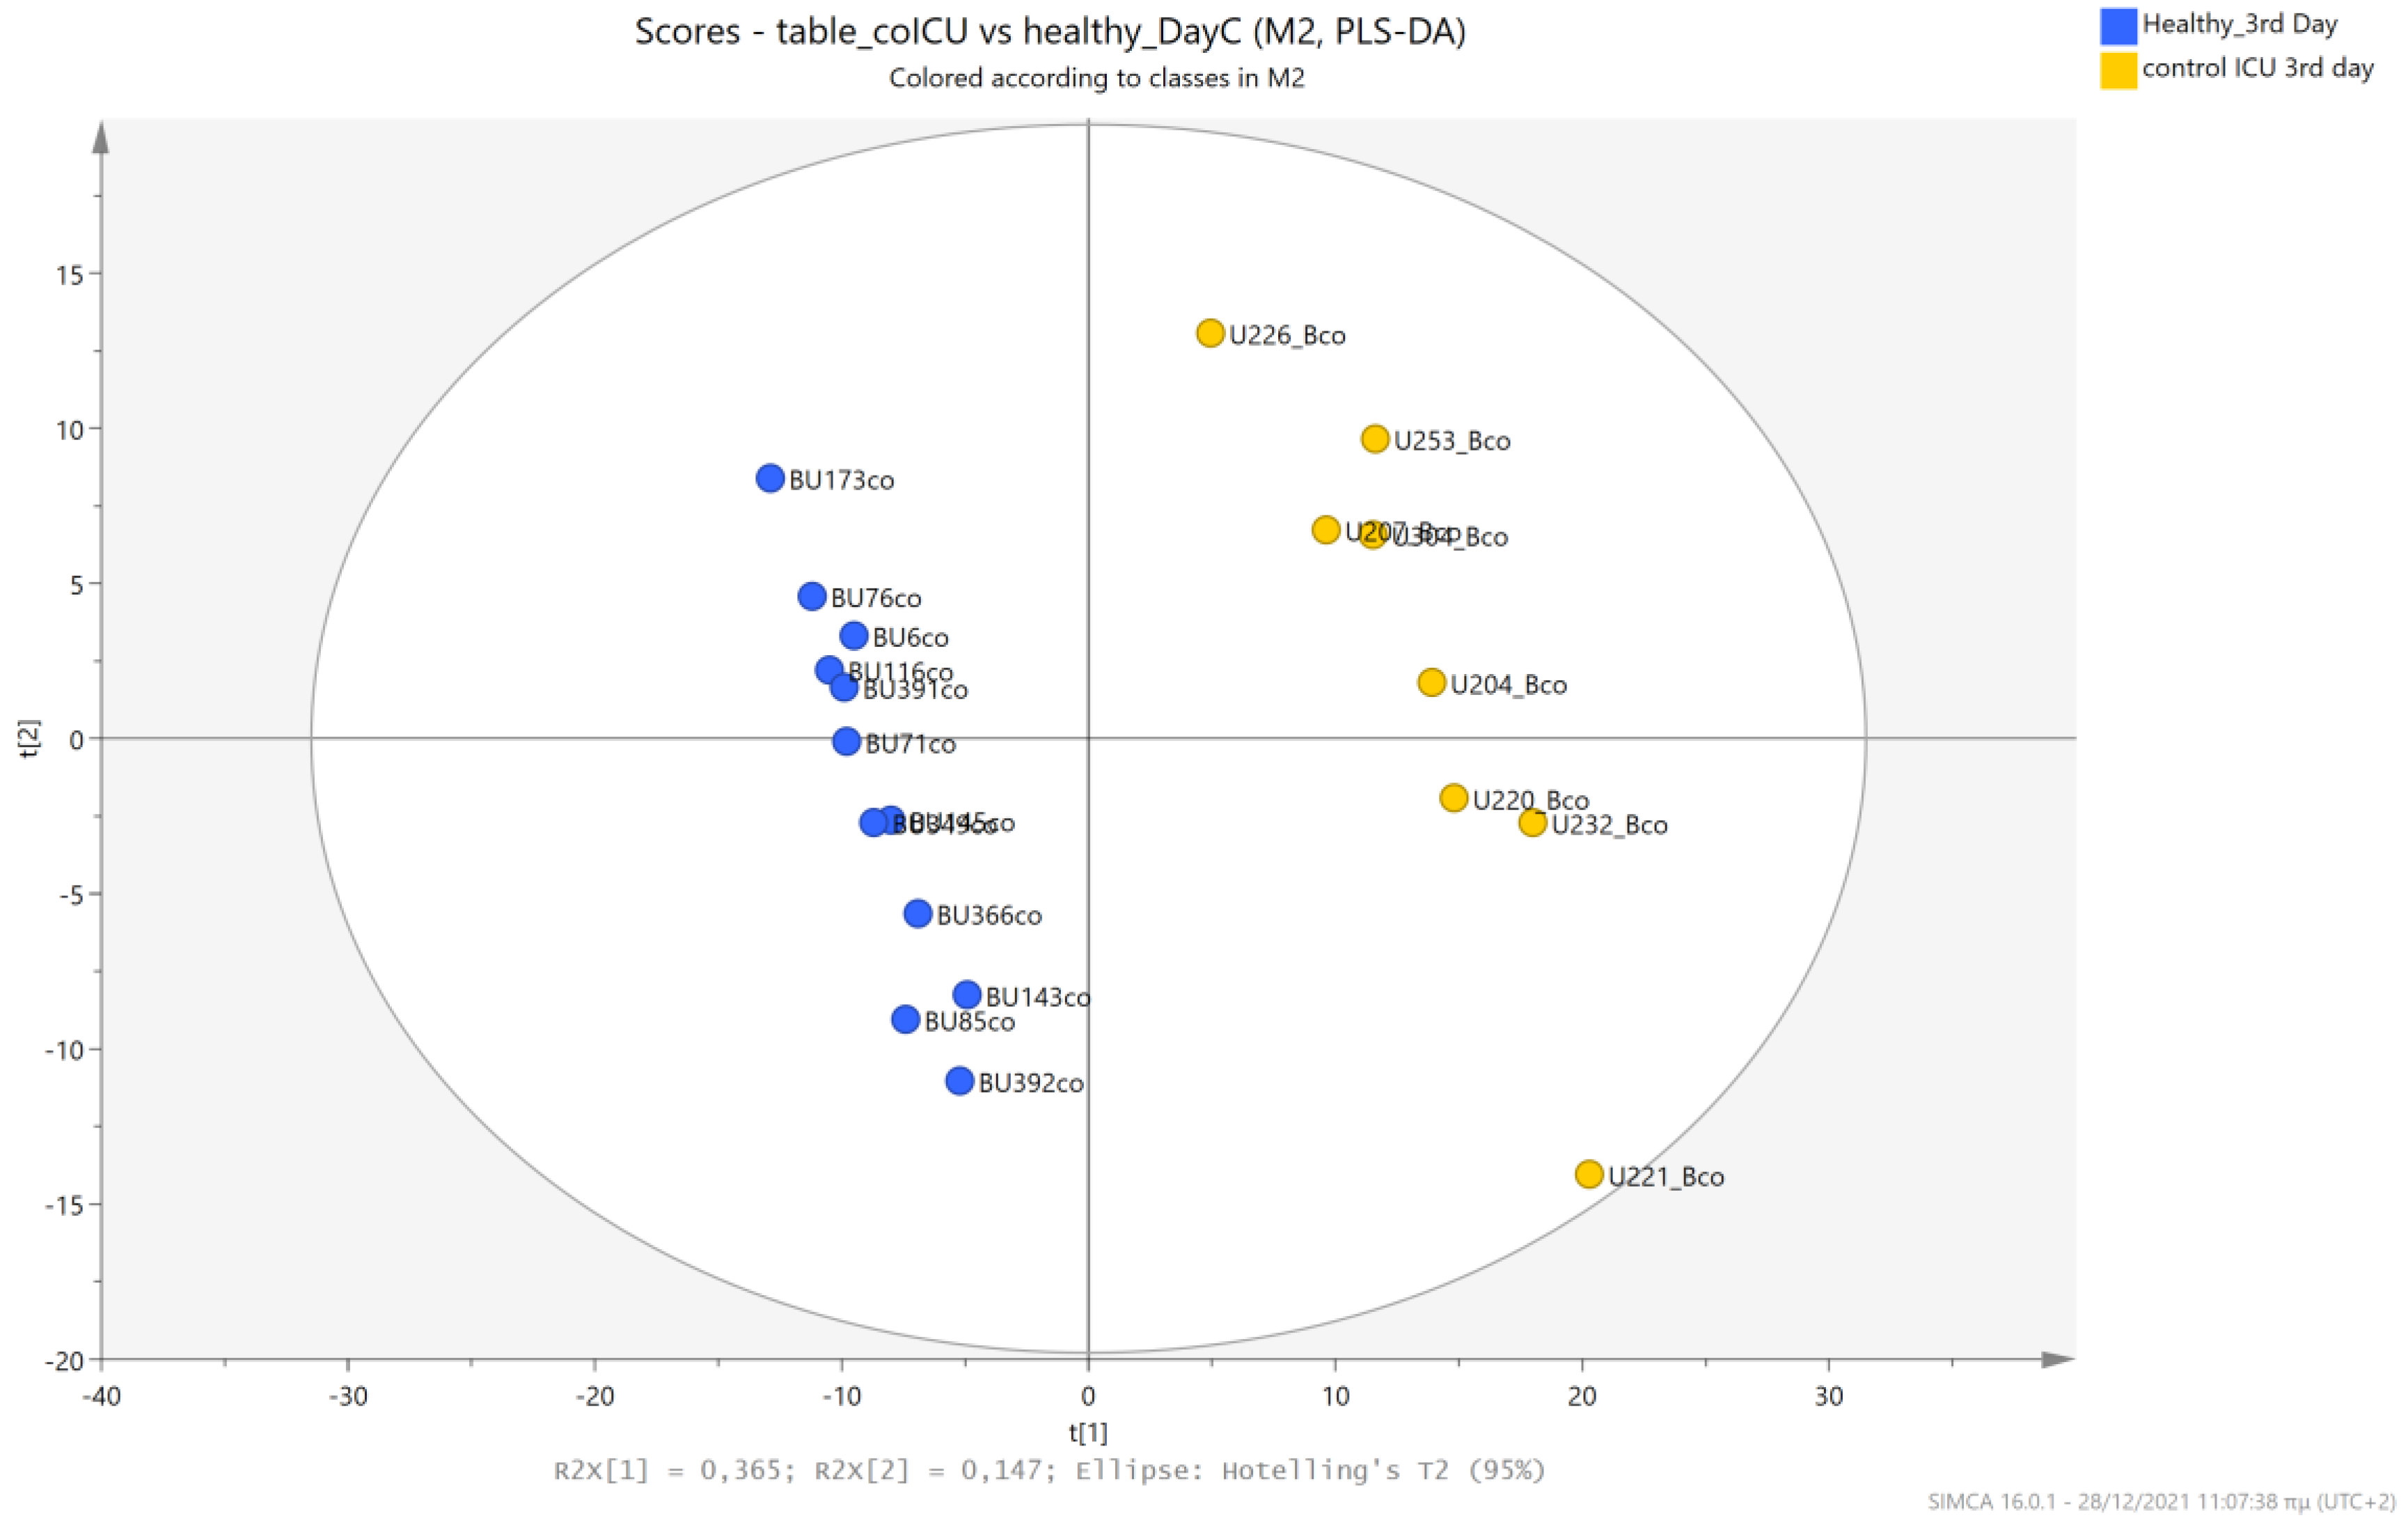
Urine metabolic profiles of LPs hospitalized in the NICU without RDS were analyzed and compared to the urinary metabolic profiles of healthy, age-matched LPs on the 1st and 3rd days after birth. PCA and PLS-DA models (Figure 17, Figure 18, Figure 19 and Figure 20) lead to a distinct categorization based on gluconate, glucose, and lactose.
The metabolic pathways that were predominantly upregulated in the NICU RDS neonates compared to the NICU non-RDS neonates are: taurine-hypotaurine pathway; pyruvate metabolic pathway; inositol phosphate pathway; arginine-proline pathway; phenylalanine, tyrosine, and tryptophan biosynthesis; and glycine, serine, and threonine metabolic pathway.
The metabolic pathways that were triggered in the NICU LP RDS neonates compared to healthy LP neonates are summarized in Table 6 and Figure 16: the metabolic pathway of synthesis and degradation of ketone bodies; the pentose phosphate pathway; the pyruvate metabolic pathway; the pathway of tyrosine metabolism; alanine, aspartate, and glutamate metabolism; arginine and proline metabolism; inositol phosphate metabolism; phenylalanine, tyrosine and tryptophan biosynthesis; and taurine and hypotaurine metabolism.

6. Discussion

The current study aspired to determine whether LP neonates hospitalized in the NICU, particularly those with RDS, present a different urine metabolic fingerprint compared to healthy LP neonates or LP neonates hospitalized in the NICU without RDS. The metabolomic analysis, based on information extracted from the urine NMR spectrum at two time points, supports the presence of distinct metabolic profiles between the studied categories from the first day of life. According to our findings, multiple metabolite levels were disturbed in several metabolic pathways and identified as potential biomarkers for NICU hospitalization or neonatal RDS. Considering that metabolic immaturity early in life is associated with poorer growth outcomes and metabolic disease in the future [4], the metabolic discrepancies presented in this study may hold clinical significance.
It has been reported that the size and chemical diversity of the measurable metabolome in healthy neonates are smaller and simpler compared to those of children and adults due to differences in diet, metabolism, and gut microbiota composition [4]. Higher concentrations of essential amino acids, collagen-associated amino acids, and acylcarnitines in neonatal urine may reflect increased neonatal needs due to rapid cell growth and cell division. It is also well known that metabolic fingerprints and biochemical pathways change in a time-dependent manner in newborns [4,28,29]. Diet has been recognized as a key environmental factor that modulates the metabolic function of the gut microbiota. The composition of milk, which is the first food introduced into the gastrointestinal tract, has a direct impact on gut microbiota and infant neurodevelopment [34,35]. This is due to the provision of essential nutrients for bacterial proliferation (i.e., carbohydrates, proteins, iron, human milk oligosaccharides (HMOs), etc.), immunomodulatory molecules, probiotics, and microbes [36,37]. Human bacterial colonization begins during fetal life, and maternally derived microbial metabolites transmitted to infants via human milk influence the neonatal microbiome and may potentially impact infant health [38,39,40]. There seems to be a window of opportunity during early infancy that is fundamentally influenced by the type of feeding and associated with a healthy microbiota profile [41].
It has also been described that different feeding practices, such as breastfeeding, formula-feeding, or mixed feeding, alter infants’ metabolic signatures [36,42]. There is evidence to suggest that the microbiome plays a more significant role in metabolic activity during early life than in later life [43]. The regulation of infant metabolism and gut immune system function by nutritional strategies during the early stages of infant development is associated with the development of metabolic syndromes later in life, including obesity, insulin resistance, type 2 diabetes mellitus, hypertension, cardiovascular diseases, and gastrointestinal diseases [44,45,46,47]. These dysbiotic changes result in reduced microbial diversity [48].
Furthermore, prematurity has been associated with impaired amino acid, carbohydrate, and fatty acid metabolism, followed by an increase in tricarboxylic acid (TCA) cycle metabolites and urinary choline metabolites. Oxidative stress markers are also higher in preterm infants and are further impaired by parenteral nutrition and formula feeding [49]. Exposure to medical treatment may also drive urine metabolomics patterns in hospitalized neonates.
The present study demonstrated that urine metabolite concentrations, such as gluconate and glycolate, were higher in LP neonates admitted to the NICU compared to healthy LPs, whereas others, i.e., acetoacetate, hippurate, and lactose, were lower. Gluconate can be obtained through the direct oxidation of glucose and is degraded by gluconokinase to generate 6-phosphogluconate, which has a crucial physiological role [45,46]. Since gluconate and glycolate are markers of carbohydrate oxidation, increased concentrations in neonates admitted to the NICU may suggest increased oxidative stress in this population. Increased gluconate concentrations may also be attributed to total parenteral nutrition (TPN), as intravenous calcium administration is a source of exogenous gluconate [50, 51].
Hippurate reflects microbial activity in the gut [52] and has been recognized as a metabolomic marker of gut microbiome diversity [53]. Reduced gut microbiome diversity has been associated with disorders such as the metabolic syndrome [47]. Hence, lower levels of hippurate in the neonates admitted to the NICU may suggest altered gut microbiota in these neonates and an increased risk for metabolic syndrome in the future.
Acetoacetate is a weak organic acid produced in the liver under poor metabolism conditions, which result in excessive fatty acid breakdown. Through its partial conversion into acetone, an indispensable source of energy in extrahepatic tissues, the substrates for cholesterol, fatty acid, and complex lipid synthesis—i.e., acetoacetyl-CoA and acetyl-CoA—are provided. During the early postnatal period, acetoacetate and beta-hydroxybutyrate are preferred over glucose as substrates for the synthesis of phospholipids and sphingolipids, which are required for brain growth and myelination. In the lung, acetoacetate serves better than glucose as a precursor for the synthesis of lung phospholipids. The synthesized lipids, particularly dipalmitoyl phosphatidylcholine, are incorporated into surfactant and thus have a potential role in supplying adequate surfactant lipids to maintain lung function during the early days of life. Therefore, the lower levels of acetoacetate during the first day of life in the LP neonates admitted to the NICU compared to the healthy LP neonates may indicate impaired brain growth and myelination, as well as reduced capacity for surfactant production, thus increasing susceptibility to respiratory compromise.
Our results also demonstrated upregulation and downregulation of several metabolic pathways in the neonates who developed RDS, as compared to the neonates who were hospitalized in the NICU but did not develop RDS. The upregulated pathways involved arginine and proline metabolism, taurine and hypotaurine metabolism, phenylalanine, tyrosine, and tryptophan biosynthesis, glycine, serine, and threonine metabolism, suggesting impaired glycogenesis and impaired amino acid and protein metabolism in these neonates. It is well known that the concentrations of most of the above amino acids are much higher in newborns compared to adults, and these age-dependent changes have been attributed to changes in cell growth, tissue growth, and muscle metabolism [54]. High levels of urine glycine, serine, and proline in neonates are possibly correlated with increased levels throughout the whole body in order to support collagen synthesis, rapid cell division, and cell growth [55]. Furthermore, hypotaurine is a sulfinic acid with anti-oxidative and cytoprotective actions. It is converted to taurine, one of the most abundant amino acids in humans, with physical roles that include osmotic pressure control, neuromodulation, immunomodulation, and antioxidants. Taurine is also associated with brain development abnormalities. It is involved in the synthesis of bile acids and is received through human milk or infant formula [56]. It has also been suggested that the hypotaurine-taurine system serves as an energy-saving antioxidative mechanism [57].
The downregulation of metabolic pathways in neonates with RDS is suggestive of impaired protein/amino acid, nucleotide, and carbohydrate metabolism. The pathways involved include D-glutamine and D-glutamate metabolism, phenylalanine metabolism, valine, leucine, and isoleucine biosynthesis, purine metabolism, glyoxylate and dicarboxylate metabolism, glutathione metabolism, pentose phosphate pathway, porphyrin and chlorophyll metabolism, valine, leucine, and isoleucine degradation, and nicotinate and nicotinamide metabolism. Glycine and glutamate are important glycogenic amino acids, whereas glycine and glutamine are used for skeletal muscle growth [58]. Glutamate has also been positively correlated with increased BMI and fasting triglycerides, both of which are associated with insulin resistance [59]. Phenylalanine is an essential amino acid utilized for protein synthesis and conversion to tyrosine, a precursor for catecholamine synthesis and a substrate for thyroid hormone and melanin synthesis [60].
Moreover, valine, leucine, and isoleucine are essential, branched-chain amino acids, that are positively correlated with protein consumption [61]. These amino acids are considered to be prognostic for the onset of insulin resistance and type 2 diabetes mellitus [62,63,64,65]. Their metabolism has been implicated in the pathophysiology of not only the metabolic syndrome but also cancer and hepatic disease [66].
Glutathione plays a crucial role in antioxidant defense, nutrient metabolism, and various cellular processes such as gene expression, DNA and protein synthesis, cell proliferation, apoptosis, and the immune response. Glutathione deficiency contributes to oxidative stress, which is involved in chronic disorders including neurological, hematological, respiratory, cardiovascular, and metabolic diseases [67].
Myo-inositol levels were higher on the first day and lower on the third day in neonates with RDS compared to those hospitalized in the NICU without RDS. Myo-inositol is involved in intracellular insulin signaling and has a prominent role in glucose metabolism and transport. It is also a component of structural lipids, such as phosphatidylinositol [68], and cell membranes, thus playing a vital role in cell morphogenesis, lipid synthesis, and cell growth [69]. Metabolic pathways involving myo-inositol are affected by prematurity [70,71,72], which may increase the risk for future cardiometabolic disease [73,74].
In contrast to other metabolites, betaine levels were lower on the first day of life and higher on the third day in neonates with RDS compared to the control NICU neonates. Betaine is an important precursor for acetylcholine, a neurotransmitter, and phospholipid, which is a structural and signaling component of the cell membrane. Low levels of betaine and choline have been associated with neurodevelopmental delays in animals [75]. The increase in urine betaine levels observed on the third day of life in neonates with RDS may suggest an adaptive and protective mechanism against neurodevelopmental disorders.
Neonates hospitalized in the NICU with RDS also exhibited reduced urinary trimethylamine-N-oxide (TMAO) compared to those hospitalized in the NICU without RDS. This may be attributed to varying feeding practices between the two groups, as increased TMAO concentrations have been linked to milk consumption and/or gut microbiota changes due to breastfeeding [58].
Additionally, urine 3-hydroxyisovalerate (3-HVA), a byproduct of the leucine degradation pathway, was lower in neonates with RDS compared to those without RDS on both the first and third days of life. Increased urine 3-HVA has been reported in preterm infants and is associated with gut microbiome alterations and muscle protein turnover [75].
As to the urine metabolome of late preterm neonates with RDS and that of healthy late preterms, the predominant discrepancy involved the synthesis and degradation of ketone bodies. Ketone bodies are an alternative and glucose-sparing fuel source in the absence of a carbohydrate source. This is particularly important during the first hours of life, when glycogen stores are depleted, and protein catabolism contributes little to energy requirements [76]. Neonates with RDS had reduced acetoacetate levels despite their increased energy requirements, which may indicate reduced or slow fatty acid β-oxidation. Acetoacetate is a product of ketone bodies and fatty acid metabolism in liver mitochondria [77], so decreased levels of acetoacetate suggest reduced activity of the ketogenesis pathway or mitochondrial dysfunction.
In addition, neonates with RDS also indicated upregulated pathways involved in amino acid metabolism as well as pyruvate metabolism, which is an intermediate compound in the metabolism of fats, proteins, and carbohydrates. Differences in the levels of TCA-cycle intermediates (oxoglutarate, citrate, and fumarate) were also observed. Furthermore, reduced allantoin levels in neonates with RDS may suggest impaired glomerular filtration rate, as urinary allantoin concentration is thought to accurately reflect glomerular filtration rate since allantoin is not reabsorbed in the proximal tubule [78].
The higher concentrations of pyruvate in the neonates with RDS on the first day of life may also reflect a higher reliance on anaerobic energy production, which is reversed on the third day of life [79,80].
Hypoxanthine is a purine derivative that represents the final product of adenosine triphosphate (ATP) breakdown in muscle. On the first day of life, neonates with RDS had lower levels of hypoxanthine compared to neonates hospitalized in the NICU without RDS, but higher levels in their urine on the third day of life. High levels of hypoxanthine indicate a high rate of ATP turnover [80,81], while decreased levels may suggest an increased ability of the body to conserve or restore the purine nucleotide pool [82]. The progressive weakening of this ability in neonates with RDS may suggest a reduced capacity for energy production and utilization.
In this study, we attempted to identify the characteristic metabolic alterations and pathways associated with late preterm neonates. Our NMR-based metabolomic analysis using urine as a biological matrix is the first, to our knowledge, to provide data on metabolic changes in the urine samples of late preterm neonates admitted to the NICU, with a focus on LP neonates with RDS. The current study demonstrates that the urine metabolic profiles were different between LP neonates hospitalized in the NICU and LP neonates not hospitalized in the NICU, as well as between neonates with RDS and those without RDS, either hospitalized in the NICU or not. The identification of distinct metabolic patterns from the first day of life in neonates with RDS suggests that metabolic alterations occur early in these neonates. The changes observed in metabolic pathways between the first and third days of life may reflect the metabolic adaptation to energy requirements and systemic stress secondary to RDS or other medical conditions requiring hospitalization. The observed metabolic differences may also arise from differences in the gut microbiota due to the differential nutrition between the different groups of neonates or to medical interventions, such as the administration of antibiotics and other medications.
The neonates admitted to the NICU were predominantly formula-fed when not on parenteral nutrition, whereas the healthy LP neonates were breastfed in a higher proportion than the NICU neonates. The differences found in the urine metabolic profile between the two neonatal groups are in line with data from the literature favoring the importance of the early introduction of human milk in late preterm neonates. It is well known that breastfeeding has been the mainstay for early nutrition in premature infants since, in addition to its nutritional quality, it also improves neonatal neurological development and immunity [83,84]. However, breast milk cannot always meet the nutritional needs of premature infants as a single source of nutrition, as they are born in a state of nutritional deficit and need to catch up to ensure their optimal growth and development. Furthermore, premature infants fail to reach the recommended intake of a range of nutrients due to a limited capacity for fluid consumption [85,86]. Adding breast milk fortifier, a multi-nutrient additive, has been shown to effectively supplement the needs of preterm infants for various nutrients [87,88].
Furthermore, donated breast milk, which is pasteurized and stored in milk banks, has gained popularity as a substitute for breastfeeding [89]. Although its bioactive factors are reduced over time, it is considered superior to formula in many aspects [90]. It retains much of the nutrients of fresh milk, such as protein and lipid content that promote physical development [91], oligosaccharide content that regulates immune response, and bioactive substances that reduce necrotizing enterocolitis (NEC), oxidative stress, and sepsis [92]. Donated breast milk is, however, inferior to formula in terms of weight gain and body length growth in premature infants, which can be overcome by adding a fortifier to donated milk [89].
Therefore, we highlight the importance of the early introduction of human milk in neonatal nutrition in reducing metabolic disturbances in late preterm neonates. Health care policies should aim at promoting the adoption of lactation support practices, such as lactation in the NICU, the provision of motivation and encouragement to the mothers of preterm neonates, integrating human milk banking, or appropriately fortifying human milk with nutritional supplements when needed. In addition, awareness should be raised about the importance of reducing medical interventions, such as the use of antibiotics or other medications, to those that are absolutely necessary according to evidence-based protocols. The implementation of antibiotic stewardship strategies in the neonatal population may allow the reduction in unnecessary antibiotic use and the length of exposure to antibiotics through antibiotic justification and the use of standardized durations of therapy.
Overall, these findings may have important implications for the diagnosis, management, and prediction of outcomes in late preterm neonates with RDS. The identification of altered metabolites and pathways in late preterm neonates with RDS can provide valuable insights into the underlying mechanisms of the disease and can also be used as biomarkers for risk assessment and early diagnosis [93,94]. In addition to facilitating diagnosis, the discovery of novel biomarkers may offer windows of opportunity for intervention and reveal potential targets for drug discovery, opening new avenues for personalized medicine in the neonatal population.
In conclusion, our findings, in conjunction with those of other studies, support the applicability of NMR-based urine metabolomics for further understanding the association between mild prematurity, neonatal diseases, integrated metabolism, nutrition, and medical interventions. Information about the metabolic status of LP neonates may enhance the understanding of neonatal metabolic maturation and the identification of early biomarkers useful for diagnosis, tailored management of neonatal diseases, and early prediction of outcomes.

Supplementary Materials

The following supporting information can be downloaded at: https://www.mdpi.com/article/10.3390/metabo13050644/s1, Figure S1: Heatmap visualization of the targeted metabolites from the urine metabolome of the first day of life analysis between RDS late preterms and control NICU, Figure S2: Correlation table of the metabolites based on targeted analysis results, Figure S3: Heatmap visualization of the targeted metabolites from the urine metabolome of the third day of life analysis between RDS late preterms and control NICU, Figure S4: Correlation table of the metabolites based on targeted analysis results, Figure S5: Heatmap visualization of the targeted metabolites from the urine metabolome of their first day of life results between RDS late preterms and healthy late preterms, Figure S6: Correlation table of the metabolites based on targeted analysis results, Figure S7: Heatmap visualization of the targeted metabolites from the urine metabolome of their third day of life analysis between RDS late preterms and healthy late preterms, Figure S8: Correlation table of the metabolites based on targeted analysis results.

Author Contributions

Conceptualization, G.A.S. and A.V.; Methodology: I.C., S.A.C., G.A.S. and K.M.; Validation: A.V. and G.A.S.; Formal analysis: S.A.C. and K.M.; Investigation: I.C., E.K. and S.A.C.; Resources: A.V. and G.A.S.; Data curation: I.C., A.V., G.A.S., S.A.C. and K.M.; Writing-original draft preparation: E.K., I.C. and S.A.C.; Writing-review and editing: A.V. and G.A.S.; Visualisation: S.A.C. and E.K.; Supervision: A.V. and G.A.S. All the authors have approved the submitted version and agree to be personally accountable for their own contributions and for ensuring that questions related to the accuracy or integrity of any part of the work, even ones in which the author was not personally involved, are appropriately investigated, resolved, and documented in the literature. E.K. and S.A.C. contributed equally to this work. All authors have read and agreed to the published version of the manuscript.

Funding

The work was supported by the INSPIRED (MIS 5002550) and OMIC-ENGINE (MIS 5002636), which are implemented under the Action ‘Reinforcement of the Research and Innovation Infrastructure,’ funded by the Operational Program ‘Competitiveness, Entrepreneurship, and Innovation’ (NSRF 2014–2020) and co-financed by Greece and the European Union (European Regional Development Fund). Additionally, the EU FP7 REGPOT CT-2011-285950—“SEE-DRUG” project is acknowledged for the purchase of UPAT’s 700 MHz NMR equipment as well as EU HORIZON-WIDERA-2022-TALENTS-01 ERA Chairs “ESPERANCE” program (Grant agreement ID: 101087215; DOI 10.3030/101087215). The publication fees of this manuscript have been financed by the Research Council of the University of Patras.

Institutional Review Board Statement

The study was conducted according to the guidelines of the Declaration of Helsinki and approved by the Research Ethics Committee of the University Hospital of Patras (protocol code: 154 and date of approval: 16/03/2017). Informed consent was obtained from the parents of all neonates involved in the study.

Informed Consent Statement

Informed consent was obtained from all subjects involved in the study. Written informed consent has been obtained from the patients to publish this paper.

Data Availability Statement

The data presented in this study is contained within the article and Supplementary Material.

Conflicts of Interest

The authors declare no conflict of interest.

References

  1. Karnati, S.; Kollikonda, S.; Abu-Shaweesh, J. Late preterm infants—Changing trends and continuing challenges. Int. J. Pediatr. Adolesc. Med. 2020, 7, 36–44. [Google Scholar] [CrossRef] [PubMed]
  2. Consortium on Safe Labor; Hibbard, J.U.; Wilkins, I.; Sun, L.; Gregory, K.; Haberman, S.; Hoffman, M.; Kominiarek, M.A.; Reddy, U.; Bailit, J.; et al. Respiratory morbidity in late preterm. JAMA 2010, 304, 419–425. [Google Scholar]
  3. Gibney, M.J.; Walsh, M.; Brennan, L.; Roche, H.M.; German, B.; van Ommen, B. Metabolomics in human nutrition: Opportunities and challenges. Am. J. Clin. Nutr. 2005, 82, 497–503. [Google Scholar] [CrossRef] [PubMed]
  4. Giallourou, N.; Fardus-Reid, F.; Panic, G.; Veselkov, K.; McCormick, B.J.J.; Olortegui, M.P.; Ahmed, T.; Mduma, E.; Yori, P.P.; Mahfuz, M.; et al. Metabolic maturation in the first 2 years of life in resource-constrained settings and its association with postnatal growth. Sci. Adv. 2020, 6, 5969. [Google Scholar] [CrossRef]
  5. Karczewski, K.J.; Snyder, M.P. Integrative Omics for Health and Disease. Nat. Rev. Genet. 2018, 19, 299–310. [Google Scholar] [CrossRef]
  6. Wild, J.; Shanmuganathan, M.; Hayashi, M.; Potter, M.; Britz-Mckibbin, P. Metabolomics for Improved Treatment Monitoring of Phenylketonuria: Urinary Biomarkers for Non-invasive Assessment of Dietary Adherence and Nutritional Deficiencies. Analyst 2019, 144, 6595–6608. [Google Scholar] [CrossRef]
  7. National Institute of Diabetes and Digestive and Kidney Diseases (NIDDK). Your Kidneys and How They Work. Available online: https://www.niddk.nih.gov/health-information/kidney-disease/kidneys-how-they-work (accessed on 17 May 2019).
  8. Maurino Alcazar, C.G.; Mazarello Paes, V.; Shao, Y.; Oesser, C.; Miltz, A.; Lawley, T.D.; Brocklehurst, P.; Rodger, A.; Field, N. The association between early-life gut microbiota and childhood respiratory diseases: A systematic review. Lancet Microbe 2022, 3, 867–880. [Google Scholar] [CrossRef]
  9. Arrieta, M.C.; Stiemsma, L.T.; Dimitriu, P.A.; Thorson, L.; Russell, S.; Yurist-Doutsch, S.; Kuzeljevic, B.; Gold, M.J.; Britton, H.M.; Lefebvre, D.L.; et al. Early infancy microbial and metabolic alterations affect risk of childhood asthma. Sci. Trans. Med. 2015, 7, 307ra152. [Google Scholar] [CrossRef]
  10. Stiemsma, L.T.; Arrieta, M.C.; Dimitriu, P.A.; Cheng, J.; Thorson, L.; Lefebvre, D.L.; Azad, M.B.; Subbarao, P.; Mandhane, P.; Becker, A.; et al. Shifts in Lachnospira and Clostridium sp. in the 3-month stool microbiome are associated with preschool age asthma. Clin. Sci. 2016, 130, 2199–2207. [Google Scholar] [CrossRef]
  11. Vael, C.; Verhulst, S.L.; Nelen, V.; Goossens, H.; Desager, K.N. Intestinal microflora and body mass index during the first 3 years of life: An observational study. Gut Pathog. 2011, 3, 8. [Google Scholar] [CrossRef]
  12. Alderete, T.L.; Jones, R.B.; Shaffer, J.P.; Holzhausen, E.A.; Patterson, W.B.; Kazemian, E.; Chatzi, L.; Knight, R.; Plows, J.F.; Berger, P.K.; et al. Early life gut microbiota is associated with rapid infant growth in Hispanics from Southern California. Gut Microbes 2021, 13, 1961203. [Google Scholar] [CrossRef] [PubMed]
  13. Carlson, A.L.; Xia, K.; Azcarate-Peril, M.A.; Goldman, B.D.; Ahn, M.; Styner, M.A.; Thompson, A.L.; Geng, X.; Gilmore, J.H.; Knickmeyer, R.C. Infant gut microbiome associated with cognitive development. Biol. Psychiatry 2018, 83, 148–159. [Google Scholar] [CrossRef] [PubMed]
  14. Hoen, A.G.; Coker, M.O.; Madan, J.C.; Pathmasiri, W.; McRitchie, S.; Dade, E.F.; Doherty, B.T.; Sumner, S.; Karagas, M.R. Association of cesarean delivery and formula supplementation with the stool metabolome of 6-week-old infants. Metabolites 2021, 11, 702. [Google Scholar] [CrossRef] [PubMed]
  15. Li, N.; Liang, S.; Chen, Q.; Zhao, L.; Li, B.; Huo, G. Distinct gut microbiota and metabolite profiles induced by delivery mode in healthy Chinese infants. J. Proteom. 2021, 10, 104071. [Google Scholar] [CrossRef] [PubMed]
  16. Lu, S.; Huang, Q.; Wei, B.; Chen, Y. Effects of β-lactam antibiotics on gut microbiota colonization and metabolites in late preterm infants. Curr. Microbiol. 2020, 77, 3888–3896. [Google Scholar] [CrossRef]
  17. Patton, L.; Li, N.; Garrett, T.J.; Ruoss, J.L.; Russell, J.T.; de la Cruz, D.; Bazacliu, C.; Polin, R.A.; Triplett, E.W.; Neu, J. Antibiotics effects on the fecal metabolome in preterm infants. Metabolites 2020, 10, 331. [Google Scholar] [CrossRef]
  18. Brink, L.R.; Mercer, K.E.; Piccolo, B.D.; Chintapalli, S.V.; Elolimy, A.; Bowlin, A.K.; Matazel, K.S.; Pack, L.; Adams, S.H.; Shankar, K.; et al. Neonatal diet alters fecal microbiota and metabolome profiles at different ages in infants fed breast milk or formula. Am. J. Clin. Nutr. 2020, 111, 1190–1202. [Google Scholar] [CrossRef]
  19. Wald, C. Diagnostics: A flow of information. Nature 2017, 551, 48–50. [Google Scholar] [CrossRef]
  20. Khamis, M.M.; Adamko, D.J.; El-Aneed, A. Mass spectrometric based approaches in urine metabolomics and biomarker discovery. Mass Spectrom. Rev. 2017, 36, 115–134. [Google Scholar] [CrossRef]
  21. Bouatra, S.; Aziat, F.; Mandal, R.; Guo, A.C.; Wilson, M.R.; Knox, C.; Bjorndahl, T.C.; Krishnamurthy, R.; Saleem, F.; Liu, P. The human urine metabolome. PLoS ONE 2013, 8, 73076. [Google Scholar] [CrossRef]
  22. Lv, H.; Hung, C.S.; Chaturvedi, K.S.; Hooton, T.M.; Henderson, J.P. Development of an integrated metabolomic profiling approach for infectious diseases research. Analyst 2011, 136, 4752–4763. [Google Scholar] [CrossRef] [PubMed]
  23. Salek, R.M.; Maguire, M.L.; Bentley, E.; Rubtsov, D.V.; Hough, T.; Cheeseman, M.; Nunez, D.; Sweatman, B.C.; Haselden, J.N.; Cox, R.D. A metabolomic comparison of urinary changes in type 2 diabetes in mouse, rat, and human. Physiol. Genom. 2007, 29, 99–108. [Google Scholar] [CrossRef] [PubMed]
  24. Yu, L.; Jiang, C.; Huang, S.; Gong, X.; Wang, S.; Shen, P. Analysis of urinary metabolites for breast cancer patients receiving chemotherapy by CE-MS coupled with on-line concentration. Clin. Biochem. 2013, 46, 1065–1073. [Google Scholar] [CrossRef] [PubMed]
  25. Luan, H.; Liu, L.F.; Tang, Z.; Zhang, M.; Chua, K.K.; Song, J.X.; Mok, V.C.; Li, M.; Cai, Z. Comprehensive urinary metabolomic profiling and identification of potential noninvasive marker for idiopathic Parkinson’s disease. Sci. Rep. 2015, 5, 13888. [Google Scholar] [CrossRef] [PubMed]
  26. Wu, J.; Gao, Y. Physiological conditions can be reflected in human urine proteome and metabolome. Expert Rev. Proteom. 2015, 12, 623–636. [Google Scholar] [CrossRef]
  27. Zhang, S.; Nagana Gowda, G.A.; Ye, T.; Raftery, D. Advances in NMR-based biofluid analysis and metabolite profiling. Analyst 2010, 135, 1490–1498. [Google Scholar] [CrossRef]
  28. Georgakopoulou, I.; Chasapi, S.A.; Bariamis, S.E.; Varvarigou, A.; Spraul, M.; Spyroulias, G.A. Metabolic changes in early neonatal life: NMR analysis of the neonatal metabolic profile to monitor postnatal metabolic adaptations. Metabolomics 2020, 16, 58. [Google Scholar] [CrossRef]
  29. Georgiopoulou, P.D.; Chasapi, S.A.; Christopoulou, I.; Varvarigou, A.; Spyroulias, G.A. Untargeted 1H-NMR urine metabolomic analysis of preterm infants with neonatal sepsis. Appl. Sci. 2022, 12, 1932. [Google Scholar] [CrossRef]
  30. Chasapi, S.A.; Karagkouni, E.; Kalavrizioti, D.; Vamvakas, S.; Zompra, A.; Takis, P.G.; Goumenos, D.S.; Spyroulias, G.A. NMR-Based Metabolomics in Differential Diagnosis of Chronic Kidney Disease (CKD) Subtypes. Metabolites 2022, 12, 490. [Google Scholar] [CrossRef]
  31. Matzarapi, K.; Giannakopoulos, A.; Chasapi, S.A.; Kritikou, D.; Efthymiadou, A.; Chrysis, D.; Spyroulias, G.A. NMR-based metabolic profiling of children with premature adrenarche. Metabolomics 2022, 18, 78. [Google Scholar] [CrossRef]
  32. Chong, J.; Soufan, O.; Li, C.; Caraus, I.; Li, S.; Bourque, G.; Wishart, D.S.; Xia, J. MetaboAnalyst 4.0: Towards more transparent and integrative metabolomics analysis. Nucleic Acids Res. 2018, 46, 486–494. [Google Scholar] [CrossRef] [PubMed]
  33. Saccenti, E.; Hoefsloot, H.C.J.; Smilde, A.K.; Westerhuis, J.A.; Hendriks, M.M.W.B. Reflections on univariate and multivariate analysis of metabolomics data. Metabolomics 2014, 10, 361–374. [Google Scholar] [CrossRef]
  34. Guaraldi, F.; Salvatori, G. Effect of Breast and Formula Feeding on Gut Microbiota Shaping in Newborns. Front. Cell. Infect. Microbiol. 2012, 2, 94. [Google Scholar] [CrossRef] [PubMed]
  35. Groer, M.W.; Luciano, A.A.; Dishaw, L.J.; Ashmeade, T.L.; Miller, E.; Gilbert, J.A. Development of the preterm infant gut microbiome: A research priority. Microbiome 2014, 2, 38. [Google Scholar] [CrossRef] [PubMed]
  36. Li, N.; Yan, F.; Wang, N.; Song, Y.; Yue, Y.; Guan, J.; Li, B.; Huo, G. Distinct Gut Microbiota and Metabolite Profiles Induced by Different Feeding Methods in Healthy Chinese Infants. Front. Microbiol. 2020, 11, 714. [Google Scholar] [CrossRef] [PubMed]
  37. Williams, J.E.; Carrothers, J.M.; Lackey, K.A.; Beatty, N.F.; York, M.A.; Brooker, S.L.; Shafii, B.; Price, W.J.; Settles, M.L.; McGuire, M.A.; et al. Human Milk Microbial Community Structure Is Relatively Stable and Related to Variations in Macronutrient and Micronutrient Intakes in Healthy Lactating Women. J. Nutr. 2017, 147, 1739–1748. [Google Scholar] [CrossRef]
  38. Coscia, A.; Bardanzellu, F.; Caboni, E.; Fanos, V.; Peroni, D.G. When a Neonate Is Born, So Is a Microbiota. Life 2021, 11, 148. [Google Scholar] [CrossRef]
  39. Pannaraj, P.S.; Li, F.; Cerini, C.; Bender, J.M.; Yang, S.; Rollie, A.; Adisetiyo, H.; Zabih, S.; Lincez, P.J.; Bittinger, K.; et al. Association Between Breast Milk Bacterial Communities and Establishment and Development of the Infant Gut Microbiome. JAMA Pediatr. 2017, 171, 647–654. [Google Scholar] [CrossRef]
  40. Perez, P.F.; Doré, J.; Leclerc, M.; Levenez, F.; Benyacoub, J.; Serrant, P.; Segura-Roggero, I.; Schiffrin, E.J.; Donnet-Hughes, A. Bacterial Imprinting of the Neonatal Immune System: Lessons from Maternal Cells? Pediatrics 2007, 119, 724–732. [Google Scholar] [CrossRef]
  41. Bosch, A.A.T.M.; Levin, E.; van Houten, M.A.; Hasrat, R.; Kalkman, G.; Biesbroek, G.; de Steenhuijsen Piters, W.A.A.; de Groot, P.K.C.M.; Pernet, P.; Keijser, B.J.F.; et al. Development of Upper Respiratory Tract Microbiota in Infancy Is Affected by Mode of Delivery. EBioMedicine 2016, 9, 336–345. [Google Scholar] [CrossRef]
  42. Brink, L.R.; Lönnerdal, B. Milk fat globule membrane: The role of its various components in infant health and development. J. Nutr. Biochem. 2020, 85, 108465. [Google Scholar] [CrossRef] [PubMed]
  43. Phan, M.; Momin, S.R.; Senn, M.K.; Wood, A.C. Metabolomic Insights into the Effects of Breast Milk Versus Formula Milk Feeding in Infants. Curr. Nutr. Rep. 2019, 8, 295–306. [Google Scholar] [CrossRef] [PubMed]
  44. Shoji, H.; Shimizu, T. Effect of Human Breast Milk on Biological Metabolism in Infants. Pediatr. Int. 2019, 61, 6–15. [Google Scholar] [CrossRef]
  45. Roggero, P.; Liotto, N.; Pozzi, C.; Braga, D.; Troisi, J.; Menis, C.; Gianni, M.L.; Canani, R.B.; Paparo, L.; Nocerino, R.; et al. Analysis of immune, microbiota and metabolome maturation in infants in a clinical trial of Lactobacillus paracasei CBA L74-fermented formula. Nat. Commun. 2020, 11, 2703. [Google Scholar] [CrossRef] [PubMed]
  46. Karlsson, F.H.; Fåk, F.; Nookaew, I.; Tremaroli, V.; Fagerberg, B.; Petranovic, D.; Bäckhed, F.; Nielsen, J. Symptomatic atherosclerosis is associated with an altered gut metagenome. Nat. Commun. 2012, 3, 1245. [Google Scholar] [CrossRef]
  47. Le Chatelier, E.; Nielsen, T.; Qin, J.; Prifti, E.; Hildebrand, F.; Falony, G.; Almeida, M.; Arumugam, M.; Batto, J.M.; Kennedy, S.; et al. Richness of human gut microbiome correlates with metabolic markers. Nature 2013, 500, 541–546. [Google Scholar] [CrossRef]
  48. Litvak, Y.; Byndloss, M.X.; Bäumler, A.J. Colonocyte metabolism shapes the gut microbiota. Science 2018, 362, 9076. [Google Scholar] [CrossRef]
  49. Marino, L.V.; Paulson, S.; Ashton, J.J.; Weeks, C.; Young, A.; Pappachan, J.V.; Swann, J.; Johnson, M.J.; Beattie, R.M. A scoping review: Urinary markers of metabolic maturation in preterm infants and future interventions to improve growth. Nutrients 2022, 14, 3957. [Google Scholar] [CrossRef]
  50. Ramachandran, S.; Fontanille, P.; Pandey, A.; Larroche, C. Gluconic Acid: Properties, Applications and Microbial Production. Food Technol. Biotechnol. 2006, 44, 185–195. [Google Scholar]
  51. Riganti, C.; Gazzano, E.; Polimeni, M.; Aldieri, E.; Ghigo, D. The Pentose Phosphate Pathway: An Antioxidant Defense and a Crossroad in Tumor Cell Fate. Free Radic. Biol. Med. 2012, 53, 421–436. [Google Scholar] [CrossRef]
  52. Psihogios, N.G.; Gazi, I.F.; Elisaf, M.S.; Seferiadis, K.I.; Bairaktari, E.T. Gender-related and age-related urinalysis of healthy subjects by NMR-based metabonomics. NMR Biomed. 2008, 21, 195–207. [Google Scholar] [CrossRef] [PubMed]
  53. Pallister, T.; Jackson, M.A.; Martin, T.C.; Zierer, J.; Jennings, A.; Mohney, R.P.; MacGregor, A.; Steves, C.J.; Cassidy, A.; Spector, T.D.; et al. Hippurate as a metabolomics marker of gut microbiome diversity: Modulation by diet and relationship to metabolic syndrome. Sci. Rep. 2017, 7, 13670. [Google Scholar] [CrossRef] [PubMed]
  54. Timmerman, K.L.; Volpi, E. Amino acid metabolism and regulatory effects in aging. Curr. Opin. Clin. Nutr. Metab. Care 2008, 11, 45–49. [Google Scholar] [CrossRef]
  55. Wu, G. Functional Amino Acids in Growth, Reproduction, and Health. Adv. Nutr. 2010, 1, 31–37. [Google Scholar] [CrossRef]
  56. Haschke-Becher, E.; Kainz, A.; Bachmann, C. Reference Values of Amino Acids and of Common Clinical Chemistry in Plasma of Healthy Infants Aged 1 and 4 Months. J. Inherit. Metab. Dis. 2016, 39, 25–37. [Google Scholar] [CrossRef] [PubMed]
  57. Sakuragawa, T.; Hishiki, T.; Ueno, Y.; Ikeda, S.; Soga, T.; Yachie-Kinoshita, A.; Kajimura, M.; Suematsu, M. Hypotaurine is an Energy-Saving Hepatoprotective Compound against Ischemia-Reperfusion Injury of the Rat Liver. J. Clin. Biochem. Nutr. 2010, 46, 126–134. [Google Scholar] [CrossRef]
  58. Chiu, C.Y.; Yeh, K.W.; Lin, G.; Chiang, M.H.; Yang, S.C.; Chao, W.J.; Yao, T.C.; Tsai, M.H.; Hua, M.C.; Liao, S.L.; et al. Metabolomics Reveals Dynamic Metabolic Changes Associated with Age in Early Childhood. PLoS ONE 2016, 11, 0149823. [Google Scholar] [CrossRef]
  59. Palomo-Buitrago, M.E.; Sabater-Masdeu, M.; Moreno-Navarrete, J.M.; Caballano-Infantes, E.; Arnoriaga-Rodríguez, M.; Coll, C.; Ramió, L.; Palomino-Schätzlein, M.; Gutiérrez-Carcedo, P.; Pérez-Brocal, V.; et al. Glutamate interactions with obesity, insulin resistance, cognition and gut microbiota composition. Acta Diabetol. 2019, 56, 569–579. [Google Scholar] [CrossRef]
  60. Go, Y.M.; Walker, D.I.; Soltow, Q.A.; Uppal, K.; Wachtman, L.M.; Strobel, F.H.; Pennell, K.; Promislow, D.E.; Jones, D.P. Metabolome-wide association study of phenylalanine in plasma of common marmosets. Amino Acids 2015, 47, 589–601. [Google Scholar] [CrossRef]
  61. Layman, D.K. The role of leucine in weight loss diets and glucose homeostasis. J. Nutr. 2003, 133, 261–267. [Google Scholar] [CrossRef]
  62. Wang, T.J.; Larson, M.G.; Vasan, R.S.; Cheng, S.; Rhee, E.P.; McCabe, E.; Lewis, G.D.; Fox, C.S.; Jacques, P.F.; Fernandez, C. Metabolite profiles and the risk of developing diabetes. Nat. Med. 2011, 17, 448–453. [Google Scholar] [CrossRef] [PubMed]
  63. Melnik, B.C. Leucine signaling in the pathogenesis of type 2 diabetes and obesity. World J. Diabetes 2012, 3, 38–53. [Google Scholar] [CrossRef] [PubMed]
  64. Lee, C.C.; Watkins, S.M.; Lorenzo, C.; Wagenknecht, L.E.; Il’yasova, D.; Chen, Y.D.; Haffner, S.M.; Hanley, A.J. Branched-chain amino acids and insulin metabolism: The Insulin Resistance Atherosclerosis Study (IRAS). Diabetes Care 2016, 39, 582–588. [Google Scholar] [CrossRef] [PubMed]
  65. Tillin, T.; Hughes, A.D.; Wang, Q.; Würtz, P.; Ala-Korpela, M.; Sattar, N.; Forouhi, N.G.; Godsland, I.F.; Eastwood, S.V.; McKeigue, P.M.; et al. Diabetes risk and amino acid profiles: Cross-sectional and prospective analyses of ethnicity, amino acids and diabetes in a South Asian and European cohort from the SABRE (Southall And Brent REvisited) Study. Diabetologia 2015, 58, 968–997. [Google Scholar] [CrossRef]
  66. Burrage, L.C.; Nagamani, S.C.S.; Campeau, P.M.; Lee, B.H. Branched-chain amino acid metabolism: From rare Mendelian diseases to more common disorders. Hum. Mol. Genet. 2014, 23, 1–8. [Google Scholar] [CrossRef]
  67. Wu, G.; Fang, Y.Z.; Yang, S.; Lupton, J.R.; Turner, N.D. Glutathione metabolism and its implications for health. J. Nutr. 2004, 134, 489–492. [Google Scholar] [CrossRef]
  68. Stevens, A.; Bonshek, C.; Whatmore, A.; Butcher, I.; Hanson, D.; De Leonibus, C.; Shaikh, G.; Brown, M.; O’Shea, E.; Victor, S.; et al. Insights into the pathophysiology of catch-up compared with non-catch-up growth in children born small for gestational age: An integrated analysis of metabolic and transcriptomic data. Pharm. J. 2014, 14, 376–384. [Google Scholar] [CrossRef]
  69. Carlomagno, G.; De Grazia, S.; Unfer, V.; Manna, F. Myo-inositol in a new pharmaceutical form: A step forward to a broader clinical use. Expert Opin. Drug Deliv. 2012, 9, 267–271. [Google Scholar] [CrossRef]
  70. Dessì, A.; Marincola, F.C.; Pattumelli, M.G.; Ciccarelli, S.; Corbu, S.; Ossicini, C.; Fanos, V. Investigation of the 1H-NMR based urine metabolomic profiles of IUGR, LGA and AGA newborns on the first day of life. J. Matern. Fetal Neonatal Med. 2014, 27, 13–19. [Google Scholar] [CrossRef]
  71. Marincola, F.C.; Dessì, A.; Pattumelli, M.G.; Corbu, S.; Ossicini, C.; Ciccarelli, S.; Agostino, R.; Mussap, M.; Fanos, V. (1)H NMR-based urine metabolic profile of IUGR, LGA, and AGA newborns in the first week of life. Clin. Chim. Acta 2015, 451, 28–34. [Google Scholar] [CrossRef]
  72. Liu, J.; Chen, X.X.; Li, X.W.; Fu, W.; Zhang, W.Q. Metabolomic Research on Newborn Infants With Intrauterine Growth Restriction. Medicine 2016, 95, 3564. [Google Scholar] [CrossRef] [PubMed]
  73. Diaz, S.O.; Pinto, J.; Barros, A.S.; Morais, E.; Duarte, D.; Negrão, F.; Pita, C.; Almeida, M.D.C.; Carreira, I.M.; Spraul, M.; et al. Newborn Urinary Metabolic Signatures of Prematurity and Other Disorders: A Case Control Study. J. Proteome Res. 2015, 15, 311–325. [Google Scholar] [CrossRef] [PubMed]
  74. Dessì, A.; Atzori, L.; Noto, A.; Visser, G.H.A.; Gazzolo, D.; Zanardo, V.; Barberini, L.; Puddu, M.; Ottonello, G.; Atzei, A.; et al. Metabolomics in newborns with intrauterine growth retardation (IUGR): Urine reveals markers of metabolic syndrome. J. Matern. Neonatal Med. 2011, 24, 35–39. [Google Scholar] [CrossRef]
  75. Ueland, P.M. Choline and betaine in health and disease. J. Inherit. Metab. Dis. 2010, 34, 3–15. [Google Scholar] [CrossRef] [PubMed]
  76. Shelley, H.J. Carbohydrate Reserves in the Newborn Infant. BMJ 1964, 1, 273–275. [Google Scholar] [CrossRef] [PubMed]
  77. Wu, H.; Zhang, X.; Liao, P.; Li, Z.; Li, W.; Li, X.; Wu, Y.; Pei, F. NMR spectroscopic-based metabonomic investigation on the acute biochemical effects induced by Ce(NO3)3 in rats. J. Inorg. Biochem. 2005, 99, 2151–2160. [Google Scholar] [CrossRef]
  78. Briggs, J.P.; Levitt, M.F.; Abramson, R.G. Renal excretion of allantoin in rats: A micropuncture and clearance study. Am. J. Physiol. 1977, 233, 373–381. [Google Scholar] [CrossRef]
  79. Saoi, M.; Percival, M.; Nemr, C.; Li, A.; Gibala, M.; Britz-McKibbin, P. Characterization of the Human Skeletal Muscle Metabolome for Elucidating the Mechanisms of Bicarbonate Ingestion on Strenuous Interval Exercise. Anal. Chem. 2019, 91, 4709–4718. [Google Scholar] [CrossRef]
  80. Siopi, A.; Deda, O.; Manou, V.; Kellis, S.; Kosmidis, I.; Komninou, D.; Raikos, N.; Christoulas, K.; Theodoridis, G.A.; Mougios, V. Effects of Different Exercise Modes on the Urinary Metabolic Fingerprint of Men with and without Metabolic Syndrome. Metabolites 2017, 7, 5. [Google Scholar] [CrossRef]
  81. Pechlivanis, A.; Kostidis, S.; Saraslanidis, P.; Petridou, A.; Tsalis, G.; Mougios, V.; Gika, H.G.; Mikros, E.; Theodoridis, G.A. 1H NMR-Based Metabonomic Investigation of the Effect of Two Different Exercise Sessions on the Metabolic Fingerprint of Human Urine. J. Proteome Res. 2010, 9, 6405–6416. [Google Scholar] [CrossRef]
  82. Stathis, C.G.; Carey, M.F.; Snow, R.J. The influence of allopurinol on urinary purine loss after repeated sprint exercise in man. Metabolism 2005, 54, 1269–1275. [Google Scholar] [CrossRef] [PubMed]
  83. Cerasani, J.; Ceroni, F.; De Cosmi, V.; Mazzocchi, A.; Morniroli, D.; Roggero, P.; Mosca, F.; Agostoni, C.; Giannì, M. Human Milk Feeding and Preterm Infants’ Growth and Body Composition: A Literature Review. Nutrients 2020, 12, 1155. [Google Scholar] [CrossRef] [PubMed]
  84. Liu, T.T.; Dang, D.; Lv, X.M.; Wang, T.F.; Du, J.F.; Wu, H. Human milk fortifier with high versus standard protein content for promoting growth of preterm infants: A meta-analysis. J. Int. Med. Res. 2015, 43, 279–289. [Google Scholar] [CrossRef]
  85. Mangili, G.; Garzoli, E. Feeding of preterm infants and fortification of breast milk. Pediatr. Med. Chir. 2017, 39, 158. [Google Scholar] [CrossRef]
  86. Lin, J.; Tang, Q. Analysis of causes of extrauterine growth restriction in premature infants and the status of nutritional intake. J. Clin. Pediatr. 2016, 34, 712–715. [Google Scholar]
  87. Fenf, H.; Liu, X. Application of breastfeeding combined with addition of human milk fortifier in the feeding of premature infants with very low birth weight. J. Clin. Med. Pract. 2019, 23, 113–115. [Google Scholar]
  88. Rigo, J.; Hascoët, J.M.; Billeaud, C.; Picaud, J.C.; Mosca, F.; Rubio, A.; Saliba, E.; Radkë, M.; Simeoni, U.; Guillois, B.; et al. Growth and Nutritional Biomarkers of Preterm Infants Fed a New Powdered Human Milk Fortifier: A Randomized Trial. J. Pediatr. Gastroenterol. Nutr. 2017, 65, 83–93. [Google Scholar] [CrossRef]
  89. Li, Y.; Chi, C.; Li, C.; Song, J.; Song, Z.; Wang, W.; Sun, J. Efficacy of Donated Milk in Early Nutrition of Preterm Infants: A Meta-Analysis. Nutrients 2022, 14, 1724. [Google Scholar] [CrossRef]
  90. Napierala, M.; Merritt, T.A.; Miechowicz, I.; Mielnik, K.; Mazela, J.; Florek, E. The effect of maternal tobacco smoking and second-hand tobacco smoke exposure on human milk oxidant-antioxidant status. Environ. Res. 2019, 170, 110–121. [Google Scholar] [CrossRef]
  91. Quigley, M.; Embleton, N.D.; McGuire, W. Formula versus donor breast milk for feeding preterm or low birth weight infants. Cochrane Database Syst. Rev. 2018, 6, Cd002971. [Google Scholar] [CrossRef]
  92. Hanson, L.A.; Korotkova, M.; Telemo, E. Breast-feeding, infant formulas, and the immune system. Ann. Allergy Asthma Immunol. 2003, 90, 59–63. [Google Scholar] [CrossRef] [PubMed]
  93. Bardanzellu, F.; Piras, C.; Atzei, A.; Neroni, P.; Fanos, V. Early Urinary Metabolomics in Patent Ductus Arteriosus Anticipates the Fate: Preliminary Data. Front. Pediatr. 2020, 8, 613749. [Google Scholar] [CrossRef] [PubMed]
  94. Locci, E.; Bazzano, G.; Demontis, R.; Chighine, A.; Fanos, V.; d’Aloja, E. Exploring Perinatal Asphyxia by Metabolomics. Metabolites 2020, 10, 141. [Google Scholar] [CrossRef] [PubMed]
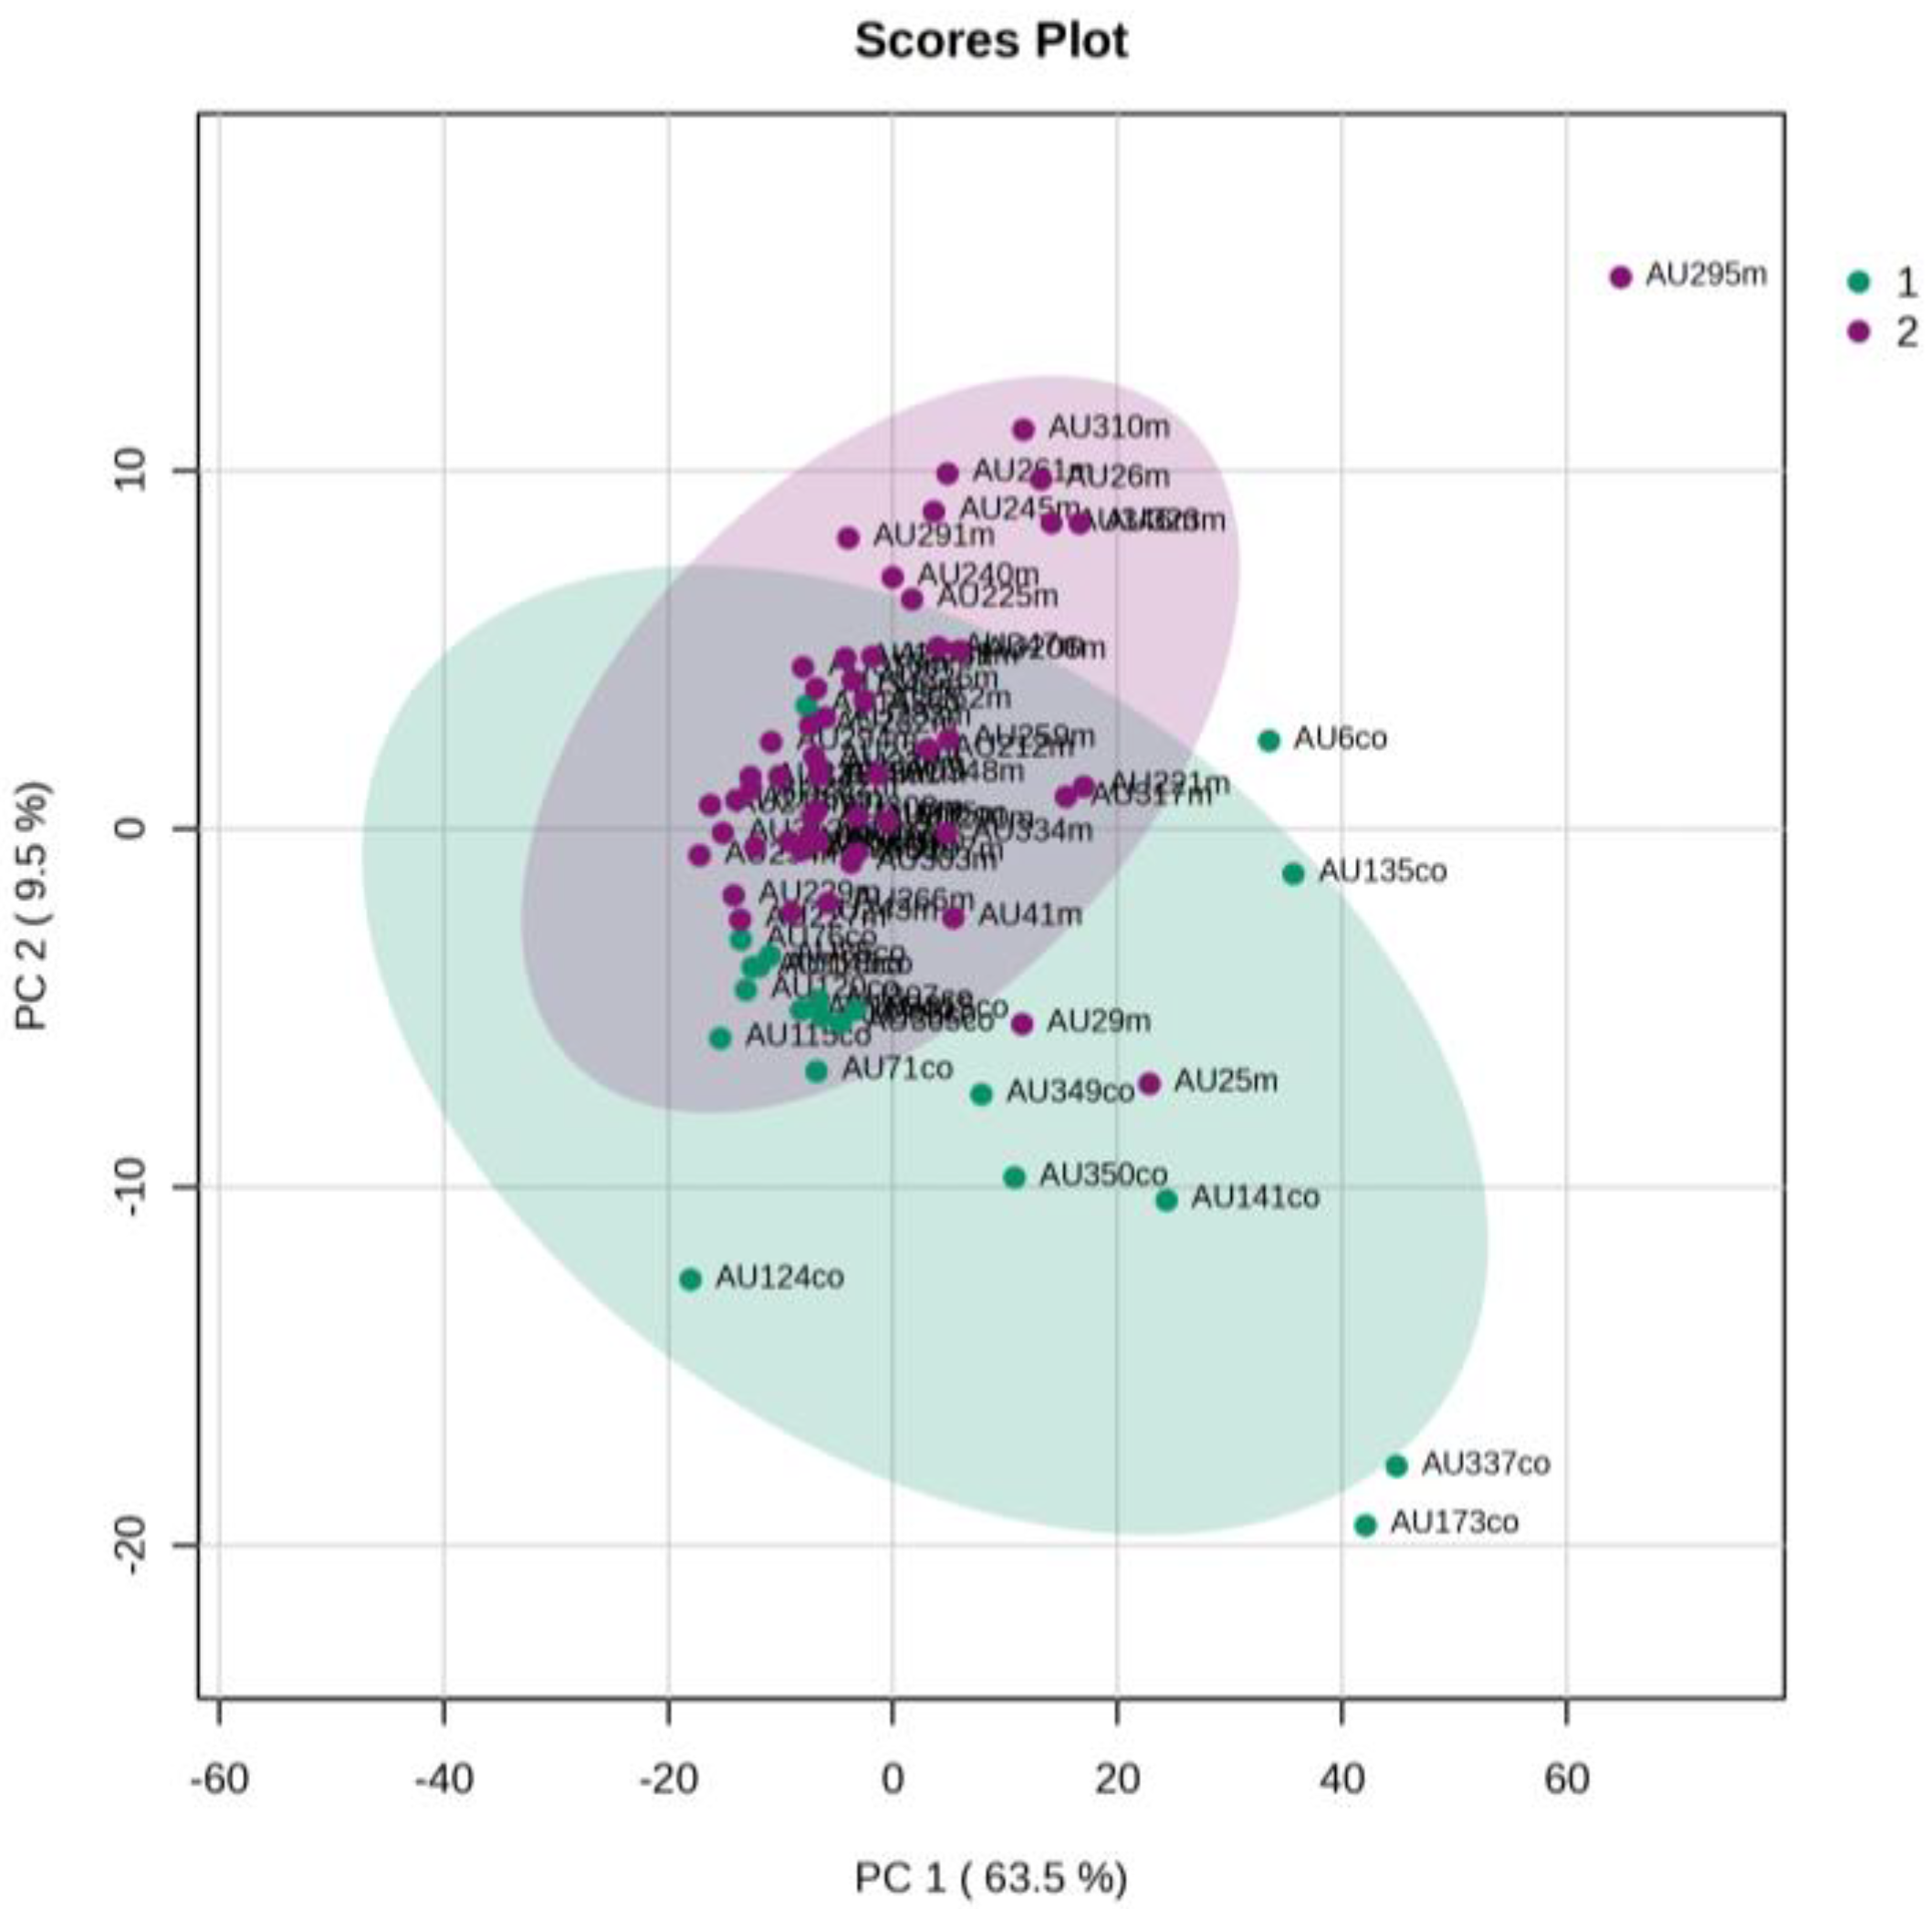
Figure 1. PCA 2D scores plot of 1st day’s urine 1H NMR metabolic profiles of NICU late preterms (purple) and healthy late preterms (cyan).
Metabolites 13 00644 g001
Figure 2. PLS-DA 2D scores plot of 1st day’s urine 1H NMR metabolic profiles of NICU late preterms (purple) and healthy late preterms (cyan). R2Y (cum) = 83.5%, and Q2 (cum) = 66.1%.
Metabolites 13 00644 g002
Figure 3. PCA 2D score plot of 3rd day’s urine 1H NMR metabolic profiles of NICU late preterms (purple) and healthy late preterms (cyan).
Metabolites 13 00644 g003
Figure 4. PLS-DA 2D score plot of 3rd day’s urine 1H NMR metabolic profiles of NICU late preterms (purple) and healthy late preterms (cyan). R2Y (cum) = 92.8% and Q2 (cum) = 74.8%.
Metabolites 13 00644 g004
Figure 5. Box plots depicting changes in the relative intensities of gluconate in NICU neonates (red) and healthy LPs (green). FDR p-value = 2.463 × 10⁻⁶ and 1.207 × 10⁻⁵ on the first day of life.
Metabolites 13 00644 g005
Figure 6. Box plots depicting changes in the relative intensities of gluconate in NICU neonates (red) and healthy LPs (green). FDR p value = 2.463 × 10⁻⁶ and 1.207 × 10⁻⁵ in the 3rd day of life.
Metabolites 13 00644 g006
Figure 7. PCA 2D scores plot of 1st day’s urine 1H NMR metabolic profiles of NICU LPs with RDS (blue) and control NICU LPs (orange).
Metabolites 13 00644 g007
Figure 8. PLS-DA 2D score plot of 1st day’s urine 1H NMR metabolic profiles of NICU LPs with RDS (blue) and control NICU LPs (orange). R2Y (cum) = 93.4% and Q2 (cum) = 36.7%.
Metabolites 13 00644 g008
Figure 9. PCA 2D scores plot of 3rd day’s urine 1H NMR metabolic profiles of NICU LPs with RDS (blue) and control NICU LPs (orange).
Metabolites 13 00644 g009
Figure 10. PLS-DA 2D scores plot of 3rd day’s urine 1H NMR metabolic profiles of NICU LPs with RDS (blue) and control NICU LPs (orange). R2Y (cum) = 99.5% and Q2 (cum) = 8.37% (on the 4th component).
Metabolites 13 00644 g010
Figure 11. Pathway analysis of the urine of ΝICU late preterms’ urine with RDS versus control NICU late preterms metabolic data displaying metabolic pathways arranged by scores from pathway enrichment analysis (y axis) and from topology analysis (x axis). Each point represents a metabolic pathway. The color and size of each circle are based on p-values and pathway impact values, respectively. 5: Phosphatidylinositol signaling system; 6: Primary bile acid biosynthesis; 7: Cysteine and methionine metabolism; 8: Ascorbate and aldarate metabolism; 9: Ubiquinone and other terpenoid-quinone biosynthesis; 14: Butanoate metabolism; 15: Citrate cycle (TCA cycle); 16: Alanine, aspartate, and glutamate metabolism; 17: D-Glutamine and D-glutamate metabolism; 18: Phenylalanine metabolism; 19: Valine, leucine, and isoleucine biosynthesis; 20: Purine metabolism; 21: Glyoxylate and dicarboxylate metabolism; 22: Glutathione metabolism; 23: Pentose phosphate pathway; 24: Porphyrin and chlorophyll metabolism; 25: Valine, leucine, and isoleucine degradation; 26: Nicotinate and nicotinamide metabolism.
Metabolites 13 00644 g011
Figure 12. PCA 2D scores plot of 1st day’s urine 1H NMR metabolic profiles of NICU LPs with RDS (blue) and healthy LPs (red).
Metabolites 13 00644 g012
Figure 13. PLS-DA 2D scores plot of 1st day’s urine 1H NMR metabolic profiles of NICU LPs with RDS (blue) and healthy LPs (red). R2Y (cum) = 99.5% and Q2 (cum) = 91.3%.
Metabolites 13 00644 g013
Figure 14. PCA 2D scores plot of 3rd day’s urine 1H NMR metabolic profiles of NICU LPs with RDS (blue) and healthy LPs (red).
Metabolites 13 00644 g014
Figure 15. PLS-DA 2D scores plot of 3rd day’s urine 1H NMR metabolic profiles of NICU LPs with RDS (blue) and healthy LPs (red). R2Y (cum) = 99.9% and Q2 (cum) = 98.8%.
Metabolites 13 00644 g015
Figure 16. Pathway analysis of the altered metabolites from the late preterms’ urine with RDS versus healthy late preterms’ urine. Metabolic data displaying metabolic pathways arranged by scores from pathway enrichment analysis (y axis) and from topology analysis (x axis). Each point represents a metabolic pathway. The color and size of each circle are based on p-values and pathway impact values, respectively. 8: Aminoacyl-tRNA biosynthesis; 9: Phenylalanine metabolism; 11: Cysteine and methionine metabolism; 12: D-Glutamine and D-glutamate metabolism; 13: Citrate cycle; 14: Butanoate metabolism; 16: Phosphatidylinositol signaling system; 17: Ascorbate and aldarate metabolism; 18: Valine, leucine, and isoleucine biosynthesis; 21: Phenylalanine, tyrosine, and tryptophan biosynthesis; 22: Taurine and hypotaurine metabolism; 23: Glyoxylate and dicarboxylate metabolism; 24: Glutathione metabolism; 25: Ubiquinone and other terpenoid-quinone biosynthesis; 26: Primary bile acid biosynthesis; 27: Purine metabolism; 28: Porphyrin metabolism; 29: Glycerophospholipid metabolism.
Metabolites 13 00644 g016
Figure 17. PCA 2D scores plot of 1st day’s urine 1H NMR metabolic profiles of control NICU LPs without RDS (yellow) and healthy LPs (cyan).
Metabolites 13 00644 g017
Figure 18. PLS-DA 2D scores plot of 1st day’s urine 1H NMR metabolic profiles of control NICU LPs without RDS (yellow) and healthy LPs (cyan). R2Y (cum) =99.9% and Q2 (cum) = 96.3%.
Metabolites 13 00644 g018
Figure 19. PCA 2D scores plot of 3rd day’s urine 1H NMR metabolic profiles of control NICU LPs without RDS (yellow) and healthy LPs (cyan).
Metabolites 13 00644 g019
Figure 20. PLS-DA 2D score plot of 3rd day’s urine 1H NMR metabolic profiles of control NICU LPs without RDS (yellow) and healthy LPs (cyan). R2Y (cum) =99.9% and Q2 (cum) = 98.8%.
Metabolites 13 00644 g020
Table 1. Clinical and epidemiological data of the participating neonates and their mothers.
N%
Sex
Male2851.9
Female2648.1
IVF
Yes713.0
No4787.0
Delivery mode
Normal713.0
Cesarean4787.0
Parity
1st2953.7
2nd1833.3
3rd611.1
4th11.9
Maternal smoking
Yes23.7
No5296.3
Preeclampsia
Yes59.3
No4990.7
Maternal medications
None1629.63
Betamethasone2851.85
Thyroxin59.26
Antibiotics47.41
Atosiban35.55
Thyroxine23.70
Ampicilline-Sulbactam11.85
Amitriptilline11.85
Dexamethasone11.85
Ceftriaxone11.85
Nifedipine11.85
Tinzaparin11.85
Nifedipine11.85
Betamethasone11.85
Maternal diseases
None3564.81
Hypothyroidism611.11
Hashimoto23.70
Group B streptococcus colonisation23.70
B-thalasaemia11.85
Migraine11.85
Mild renal failure11.85
Pericarditis11.85
Myopia11.85
Placenta abruption11.85
Uterine fibroids11.85
Oligamnio11.85
Aortic coarctation11.85
Gestational diabetes
No4787.0
Diet only611.1
Insulin11.9
IUGR
Yes1222.6
No4177.4
Multiple gestation
No3870.4
Twins1527.8
Triplets11.9
Twin-twin transfusion
Yes00.0
No54100.0
Chorioamnionitis
Yes11.9
No5398.1
Maternal antibiotics
No23.7
Yes < 4 h3972.2
Yes1324.1
RDS
Yes1731.5
No3768.5
PDA
Yes00.0
No54100.0
IVH
No5296.3
Grade123.7
Grade200.0
Grade300.0
Grade400.0
Congenital infection
Yes23.7
No5296.3
Early-onset sepsis
Νο3870.4
Yes (- cult)1018.5
Yes (+cult,+gram)47.4
Yes (+cult,-gram)00.0
Yes (+cult, fungus)23.7
Late-onset sepsis
Νο4685.2
Yes (-culture)23.7
Yes (+culture, +gram)611.1
Yes (+culture, -gram)00.0
Yes (+culture, fungus)00.0
NEC
Yes11.9
No5398.1
Jaundice
No3361.1
Phototherapy2138.9
Exchange transfusion00.0
Hypocalcemia
Yes59.3
No4990.7
Metabolic diseases
No5096.2
Yes23.8
Other diseases
None3870.37
ASD35.55
Pneumothorax35.55
Choroid cysts23.70
Meconium aspiration11.85
Conexingene11.85
Hypospadias11.85
Polycystic kidneys11.85
Hydronephrosis11.85
Laryngomalacia11.85
Congenital heart disease11.85
Death
Yes00.0
No54100.0
Medications DOL 5
None35.55
Ampicillin/gentamicin3157.41
Ampicillin/cefotaxine611.11
Ampicillin/gentamicin/teicoplanin47.41
Meropenem/vancomycin35.55
Ampicillin/gentamicin/micafungin11.85
Ampicillin/gentamicin/amphotericin11.85
Ampicillin/gentamicin/fluconazole11.85
Vitamin D11.85
Meropenem/vancomycin/rifampicin11.85
Ampicillin/cefotaxime/teicoplanin11.85
Ampicillin/meropenem/vancomycin11.85
IVF: In vitro fertilization; IUGR: Intrauterine growth retardation; RDS: Respiratory distress syndrome; PDA: Patent ductus arteriosus; IVH: Intraventricular haemorrhage; NEC; Necrotic enterocolitis; ASD: Atrial septal defect. DOL: Day of life.
Table 2. The statistically significant metabolites for the discrimination of the NICU late preterms and healthy age-matched late preterms (FDR p-value < 0.01) according to the univariate analysis. (s: singlet, d: doublet, m: multiplet).
DayMetabolitesδH (ppm)/MultiplicityFDR p-Values/Effect in NICU LPsLevels of NICU LPs
1stAcetoacetate2.25 (s)0.001
Gluconate3.83–3.81 (m)2.63 × 10⁻⁶
Glycolate3.99 (s)7.92 × 10⁻⁵
Hippurate7.83–7.81 (d)4.53 × 10⁻⁶
Lactose4.46–4.43 (d)4.83 × 10⁻⁵
3rdGluconate3.83–3.81 (m)1.38 × 10⁻⁵
Glycolate3.99 (s)0.0003
Lactose4.46–4.43 (d)0.007
Table 3. The statistically significant metabolites for the discrimination of the two groups, late preterm neonates with RDS and control NICU late preterms, according to the univariate analysis.
DayMetabolitesp-ValuesGroup Levels
1st1-Methylnicotinamide0.0013control NICU > RDS
Glycine4.29 × 10−7control NICU > RDS
Formate9.66 × 10−9RDS > control NICU
Alanine2.80 × 10−5control NICU > RDS
Hippurate0.008control NICU > RDS
Glucose1.74 × 10−5control NICU > RDS
Lactose0.00017RDS > control NICU
4-Hydroxyproline0.0066RDS > control NICU
Gluconate0.0004RDS > control NICU
Dimethylglycine1.98 × 10−6RDS > control NICU
Myoinositol0.0063RDS > control NICU
Acetoacetate2.42 × 10−6RDS > control NICU
Leucine3.54 × 10−7control ICU > RDS
Allantoin0.00107RDS > control NICU
Betaine2.42 × 10−6control ICU > RDS
Creatine0.0006RDS > control NICU
Tyrosine0.007control ICU > RDS
4-Hydroxybenzoate0.0004control ICU > RDS
Pyruvate0.00017RDS > control NICU
Dimethylamine3.54 × 10−7control ICU > RDS
Trimethylamine0.006control ICU > RDS
Dimethylglycine2.85 × 10−5RDS > control NICU
Oxoglutarate0.00017control NICU > RDS
Ethanolamine0.0006RDS > control ICU
TMAO0.0024control NICU > RDS
1-Methylnicotinamide, N1-Methyl-2-pyridone-5-carboxamide3.60 × 10−5control NICU > RDS
Hypoxanthine0.0008control NICU > RDS
Trigonelline0.0015control NICU > RDS
4-Hydroxyphenyl acetate3.64 × 10−6control NICU > RDS
3-Hydroxyisovaleric acid0.005control NICU > RDS
Indoxyl sulfate0.0037RDS > control NICU
3rd1-Methylnicotinamide4.96 × 10−5RDS > control NICU
Glycine1.04 × 10−7RDS > control NICU
Formate0.0011RDS > control NICU
Alanine3.84 × 10−7RDS > control NICU
Hippurate2.55 × 10−5control NICU > RDS
Lactose0.0058control NICU > RDS
4-Hydroxyproline4.30 × 10−6control NICU > RDS
Gluconate6.28 × 10−5RDS > control ICU
Dimethylglycine0.0015control NICU > RDS
Myoinositol1.24 × 10−5control NICU > RDS
Acetoacetate0.00044RDS > control NICU
Leucine0.0092RDS > control NICU
Betaine1.05 × 10−6RDS > control NICU
Tyrosine4.32 × 10−5control NICU > RDS
4-Hydroxybenzoate0.00015control NICU > RDS
Pyruvate0.0033control NICU > RDS
Dimethylamine1.05 × 10−6control NICU > RDS
Trimethylamine3.84 × 10−7RDS > control ICU
Dimethylglycine5.04 × 10−5control NICU > RDS
Oxoglutarate7.32 × 10−5control NICU > RDS
Ethanolamine5.04 × 10−5control NICU > RDS
Taurine0.0011RDS > control NICU
1-Methylnicotinamide, N1-Methyl-2-pyridone-5-carboxamide5.38 × 10−5RDS > control NICU
Hypoxanthine1.20 × 10−5RDS > control NICU
Trigonelline0.0062RDS > control NICU
4-Hydroxyphenyl acetate2.31 × 10−5control NICU > RDS
Lys/Arg3.26 × 10−6control NICU > RDS
3-Hydroxyisovaleric acid6.82 × 10−5control NICU > RDS
Indoxyl sulfate0.0021RDS > control NICU
Table 4. Pathway analysis results of the urine metabolite comparison between late preterms with RDS and control NICU late preterms.
No.Biochemical PathwayMetabolites MeasuredRow p ValueImpact
1Arginine and proline metabolismCreatine, Hydroxyproline, Pyruvate1.86 × 10−10.07
2Taurine and hypotaurine metabolismTaurine3.08 × 10−10.43
3Pyruvate metabolismPyruvate3.40 × 10−10.21
4Inositol phosphate metabolismmyo-Inositol3.52 × 10−10.13
5Phosphatidylinositol signaling systemmyo-Inositol3.52 × 10−10.04
6Primary bile acid biosynthesisGlycine, Taurine3.32 × 10−10.02
7Cysteine and methionine metabolismPyruvate;3.40 × 10−10.00
8Ascorbate and aldarate metabolismmyo-Inositol3.52 × 10−10.00
9Ubiquinone and other terpenoid-quinone
biosynthesis
Tyrosine4.26 × 10−10.00
10Phenylalanine, tyrosine, and tryptophan
biosynthesis
Tyrosine4.26 × 10−10.50
11Glycine, serine, and threonine metabolismBetaine, N, N-Dimethylglycine, Glycine, Creatine, Pyruvate5.71 × 10−10.37
12Tyrosine metabolismTyrosine, Pyruvate, Acetoacetate, 4-Hydroxyphenylacetate4.83 × 10−10.14
13Glycolysis/GluconeogenesisPyruvate, beta-Glucose5.14 × 10−10.10
14Butanoate metabolismAcetoacetate, 2-Oxoglutarate5.95 × 10−10.11
15Citrate cycle (TCA cycle)2-Oxoglutarate, pyruvate5.92 × 10−10.10
16Alanine, aspartate, and glutamate
metabolism
2-Oxoglutarate, pyruvate5.92 × 10−10.05
17D-Glutamine and D-glutamate
metabolism
2-Oxoglutarate5.94 × 10−10.00
18Phenylalanine metabolismHippurate; Tyrosine6.22 × 10−10.00
19Valine, leucine, and isoleucine biosynthesisTyrosine7.16 × 10−10.00
20Purine metabolismHypoxanthine8.22 × 10−10.02
21Glyoxylate and dicarboxylate
metabolism
Glycine, Pyruvate, Formate8.71 × 10−10.11
22Glutathione metabolismGlycine8.69 × 10−10.09
23Pentose phosphate pathwayGluconate9.15 × 10−10.05
24Porphyrin metabolismGlycine8.69 × 10−10.00
25Valine, leucine, and isoleucine degradationAcetoacetate, Leucine8.88 × 10−10.00
26Nicotinate and nicotinamide metabolism1-Methylnicotinamide9.77 × 10−10.14
27Synthesis and degradation of ketone bodiesAcetoacetate9.88 × 10−10.60
Table 5. The statistically significant metabolites for the discrimination between late preterm neonates with RDS and healthy late preterms according to the univariate analysis.
DayMetabolitesp-ValuesGroup Levels
1stAlanine0.047RDS > healthy
Lactose0.016Healthy > RDS
Acetoacetate0.01Healthy > RDS
Leucine0.01RDS > healthy
Allantoin0.015Healthy > RDS
4-Hydroxybenzoate0.019Healthy > RDS
Pyruvate0.05Healthy > RDS
Trimethylamine0.05Healthy > RDS
Oxoglutarate0.033Healthy > RDS
Taurine0.05Healthy > RDS
TMAO0.01RDS > healthy
Gluconate0.01RDS > healthy
Trigonelline0.002Healthy > RDS
3-OH-hydroxyisovalerate2.86 × 10−6RDS > healthy
Indoxyl sulfate0.01RDS > healthy
3rdAlanine0.004RDS > healthy
Gluconate0.002RDS > healthy
Leucine0.0039RDS > healthy
Hypoxanthine0.0064RDS > healthy
Lys/Arg0.0023RDS > healthy
3-OH-hydroxyisovalerate0.0049RDS > healthy
Indoxyl sulfate0.0023RDS > healthy
Table 6. Pathway analysis results of the metabolite comparison between late preterms with RDS and healthy late preterms.
NoBiochemical PathwayMetabolites MeasuredRow p ValueImpact
1.Synthesis and degradation of ketone bodiesAcetoacetate3.00 × 10−30.60
2.Pentose phosphate pathwayGluconate1.26 × 10−20.05
3.Valine, leucine, and isoleucine degradationAcetoacetate, Leucine1.90 × 10−20.00
4.Selenocompound metabolismAlanine3.09 × 10−20.00
5.Alanine, aspartate, and glutamate metabolismAlanine, Pyruvate; 2-Oxoglutarate;4.48 × 10−20.05
6.Arginine and proline metabolismCreatine, Hydroxyproline, Pyruvate9.19 × 10−20.07
7.Tyrosine metabolismTyrosine, Pyruvate; Acetoacetate; 4-Hydroxyphenylacetate;1.04 × 10−10.14
8.Aminoacyl-tRNA biosynthesisGlycine, Alanine, Leucine, Tyrosine1.19 × 10−10.00
9.Phenylalanine metabolismHippurate; Tyrosine1.54 × 10−10.00
10.Pyruvate metabolismPyruvate2.16 × 10−10.21
11.Cysteine and methionine metabolismPyruvate2.16 × 10−10.00
12.D-Glutamine and D-glutamate
metabolism
2-Oxoglutarate2.22 × 10−10.00
13.Citrate cycle (TCA cycle)2-Oxoglutarate; Pyruvate2.22 × 10−10.10
14.Butanoate metabolismAcetoacetate, 2-Oxoglutarate2.20 × 10−10.11
15.Inositol phosphate metabolismmyo-Inositol3.51 × 10−10.13
16.Phosphatidylinositol signaling systemmyo-Inositol3.51 × 10−10.04
17.Ascorbate and aldarate metabolismmyo-Inositol3.51e−010.00
18.Valine, leucine, and isoleucine biosynthesisLeucine3.99 × 10−10.00
19.Glycine, serine, and threonine metabolismBetaine, N, N-Dimethylglycine, Glycine, Creatine, Pyruvate3.59 × 10−10.37
20.Nicotinate and nicotinamide metabolism1-Methylnicotinamide, N1-Methyl-2-pyridone-5-carboxamide4.45 × 10−10.14
21.Phenylalanine, tyrosine, and tryptophan biosynthesisTyrosine5.99 × 10−10.50
22.Taurine and hypotaurine metabolismTaurine5.63 × 10−10.43
23.Glyoxylate and dicarboxylate metabolismGlycine, Pyruvate, Formate7.53 × 10−10.11
24.Glutathione metabolismGlycine7.54 × 10−10.09
25.Ubiquinone and other terpenoid-quinone biosynthesisTyrosine;5.99 × 10−10.00
26.Primary bile acid biosynthesisGlycine, Taurine6.28 × 10−10.02
27.Purine metabolismHypoxanthine6.96 × 10−10.02
28.Porphyrin metabolismGlycine7.54 × 10−10.00
29Glycerophospholipid metabolismEthanolamine9.90 × 10−10.01
Disclaimer/Publisher’s Note: The statements, opinions and data contained in all publications are solely those of the individual author(s) and contributor(s) and not of MDPI and/or the editor(s). MDPI and/or the editor(s) disclaim responsibility for any injury to people or property resulting from any ideas, methods, instructions or products referred to in the content.