
The Effect of 3-Week Betaine Supplementation on Blood Biomarkers of Cardiometabolic Health in Young Physically Active Males

 ,
,  ,
,
Abstract
:1. Introduction
2. Materials and Methods
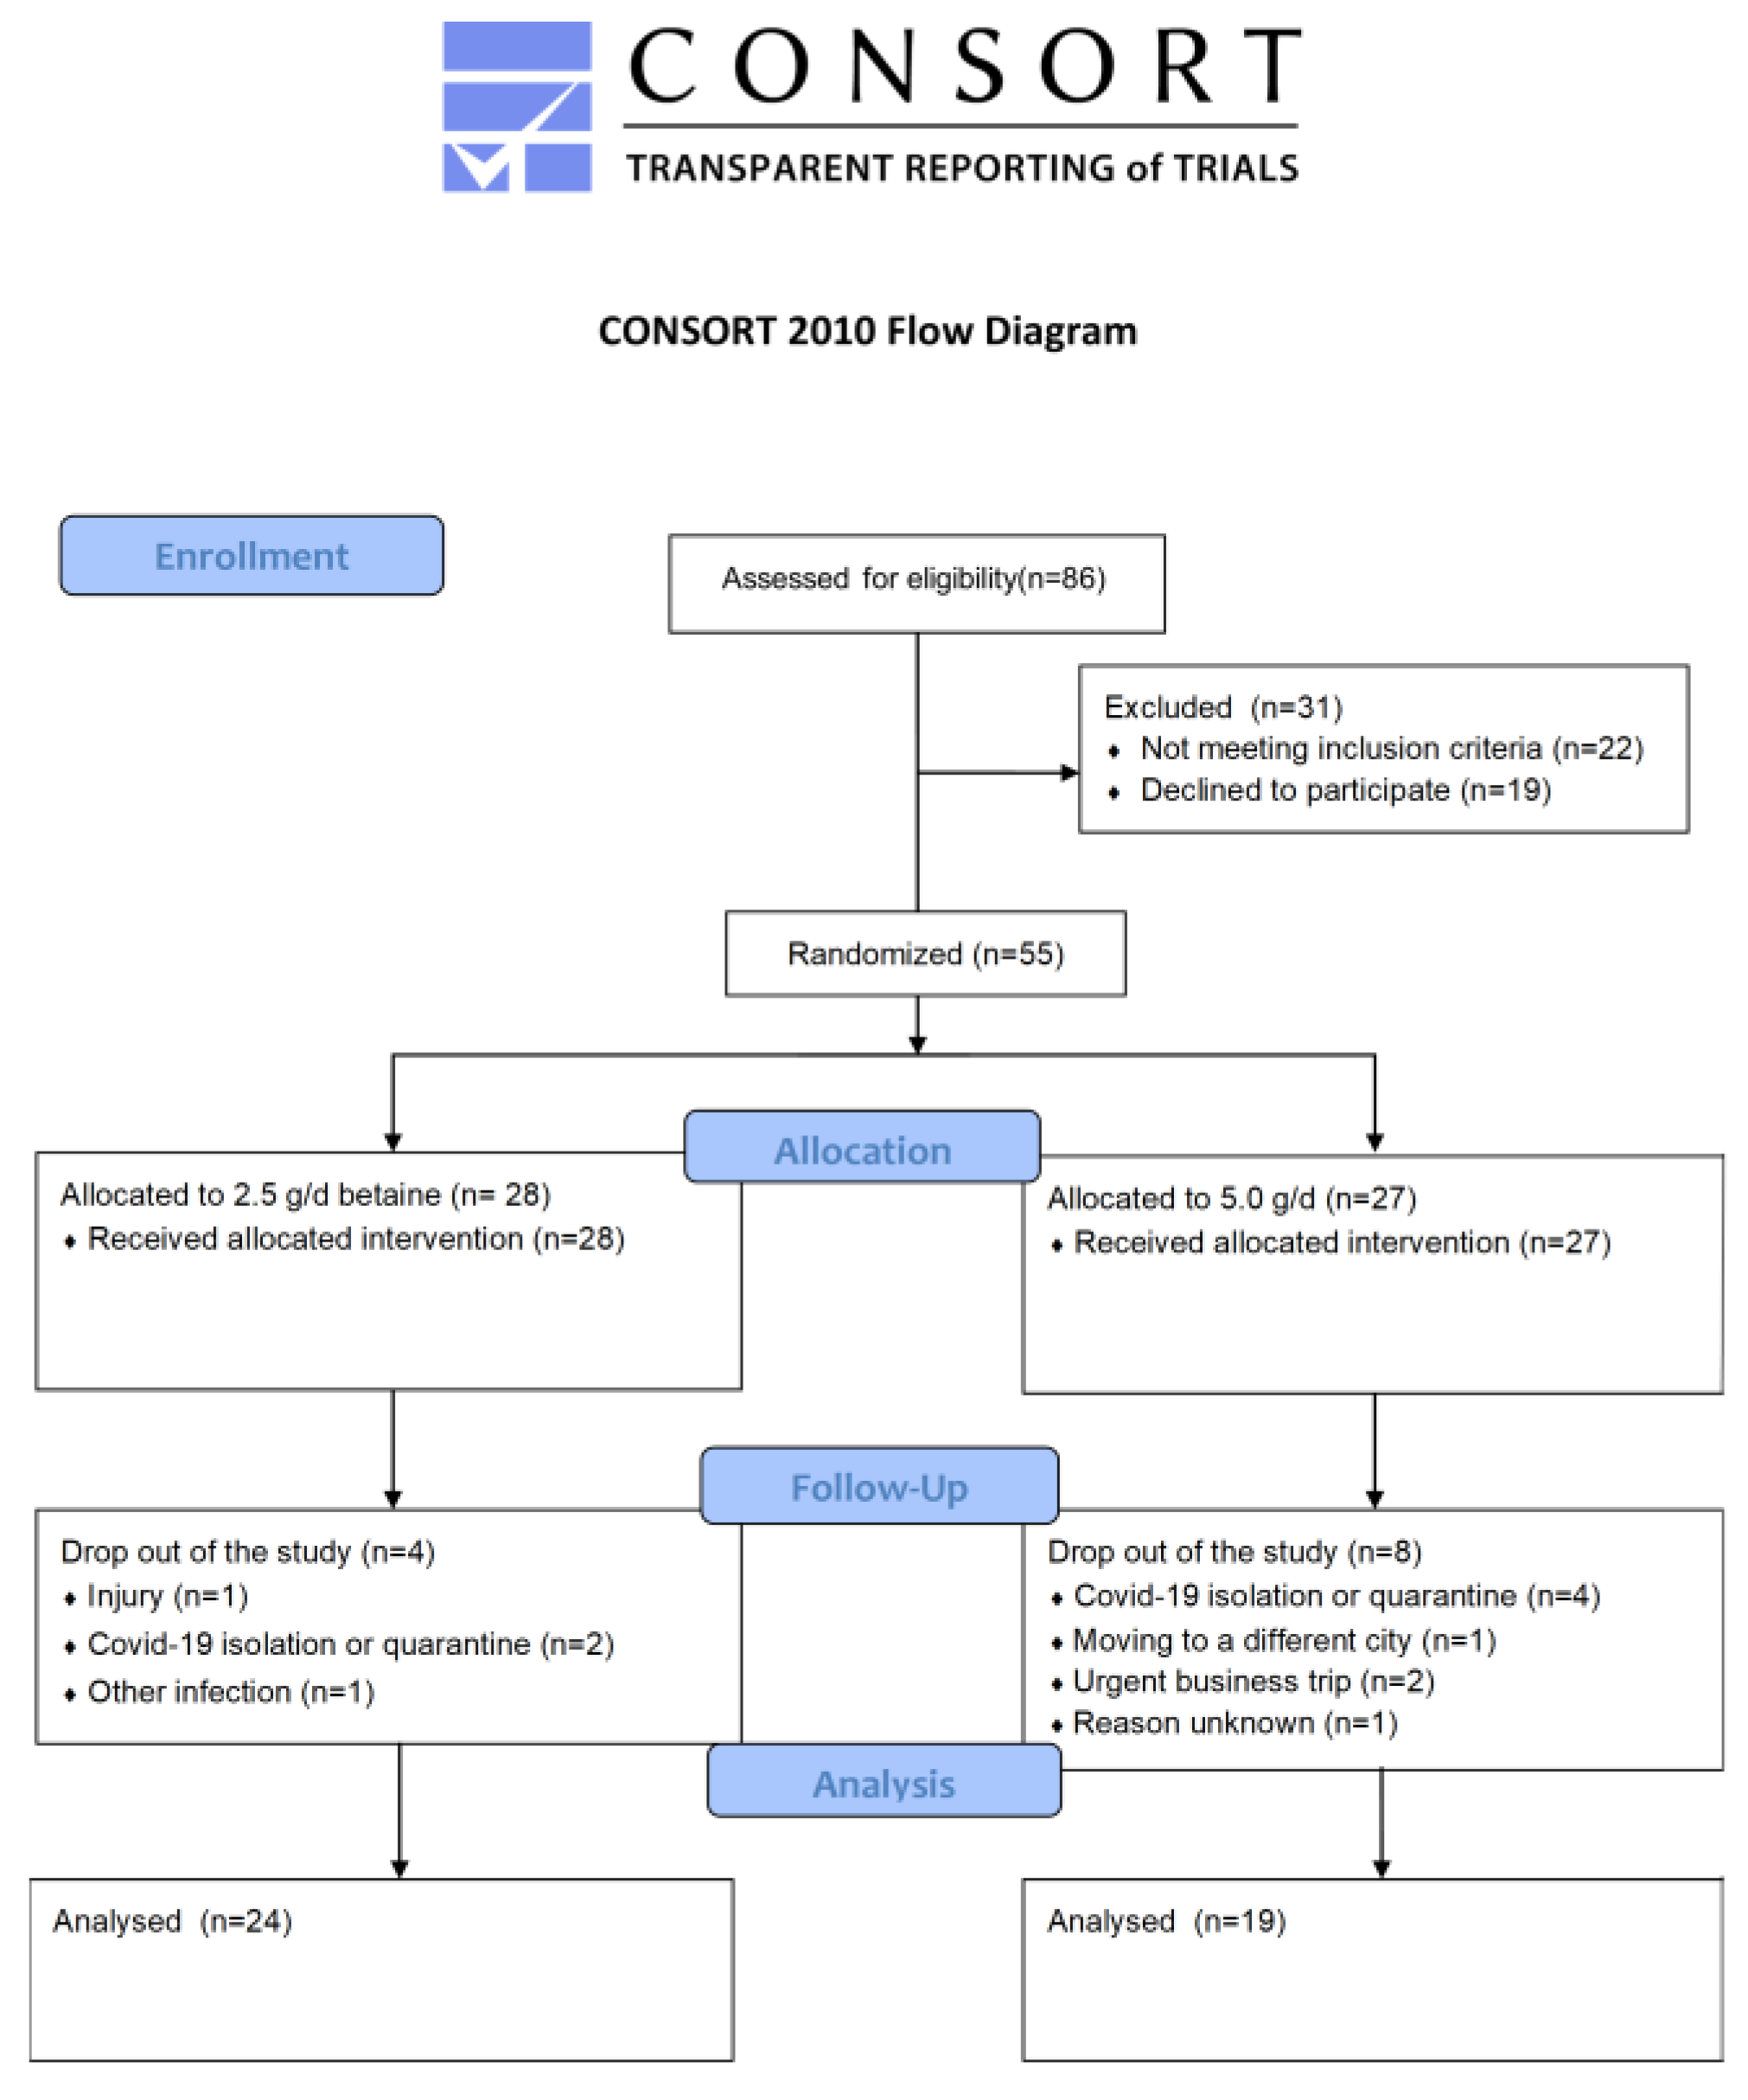
2.1. Study Design
2.2. Participants
2.3. Supplementation
2.4. Body Composition
2.5. Biochemical Analysis
2.6. Concentrations of Cytokines and Homocysteine
2.7. MTHFR Genotyping
2.8. Statistical Analysis
3. Results
3.1. Baseline Differences
3.2. Correlations between Outcomes
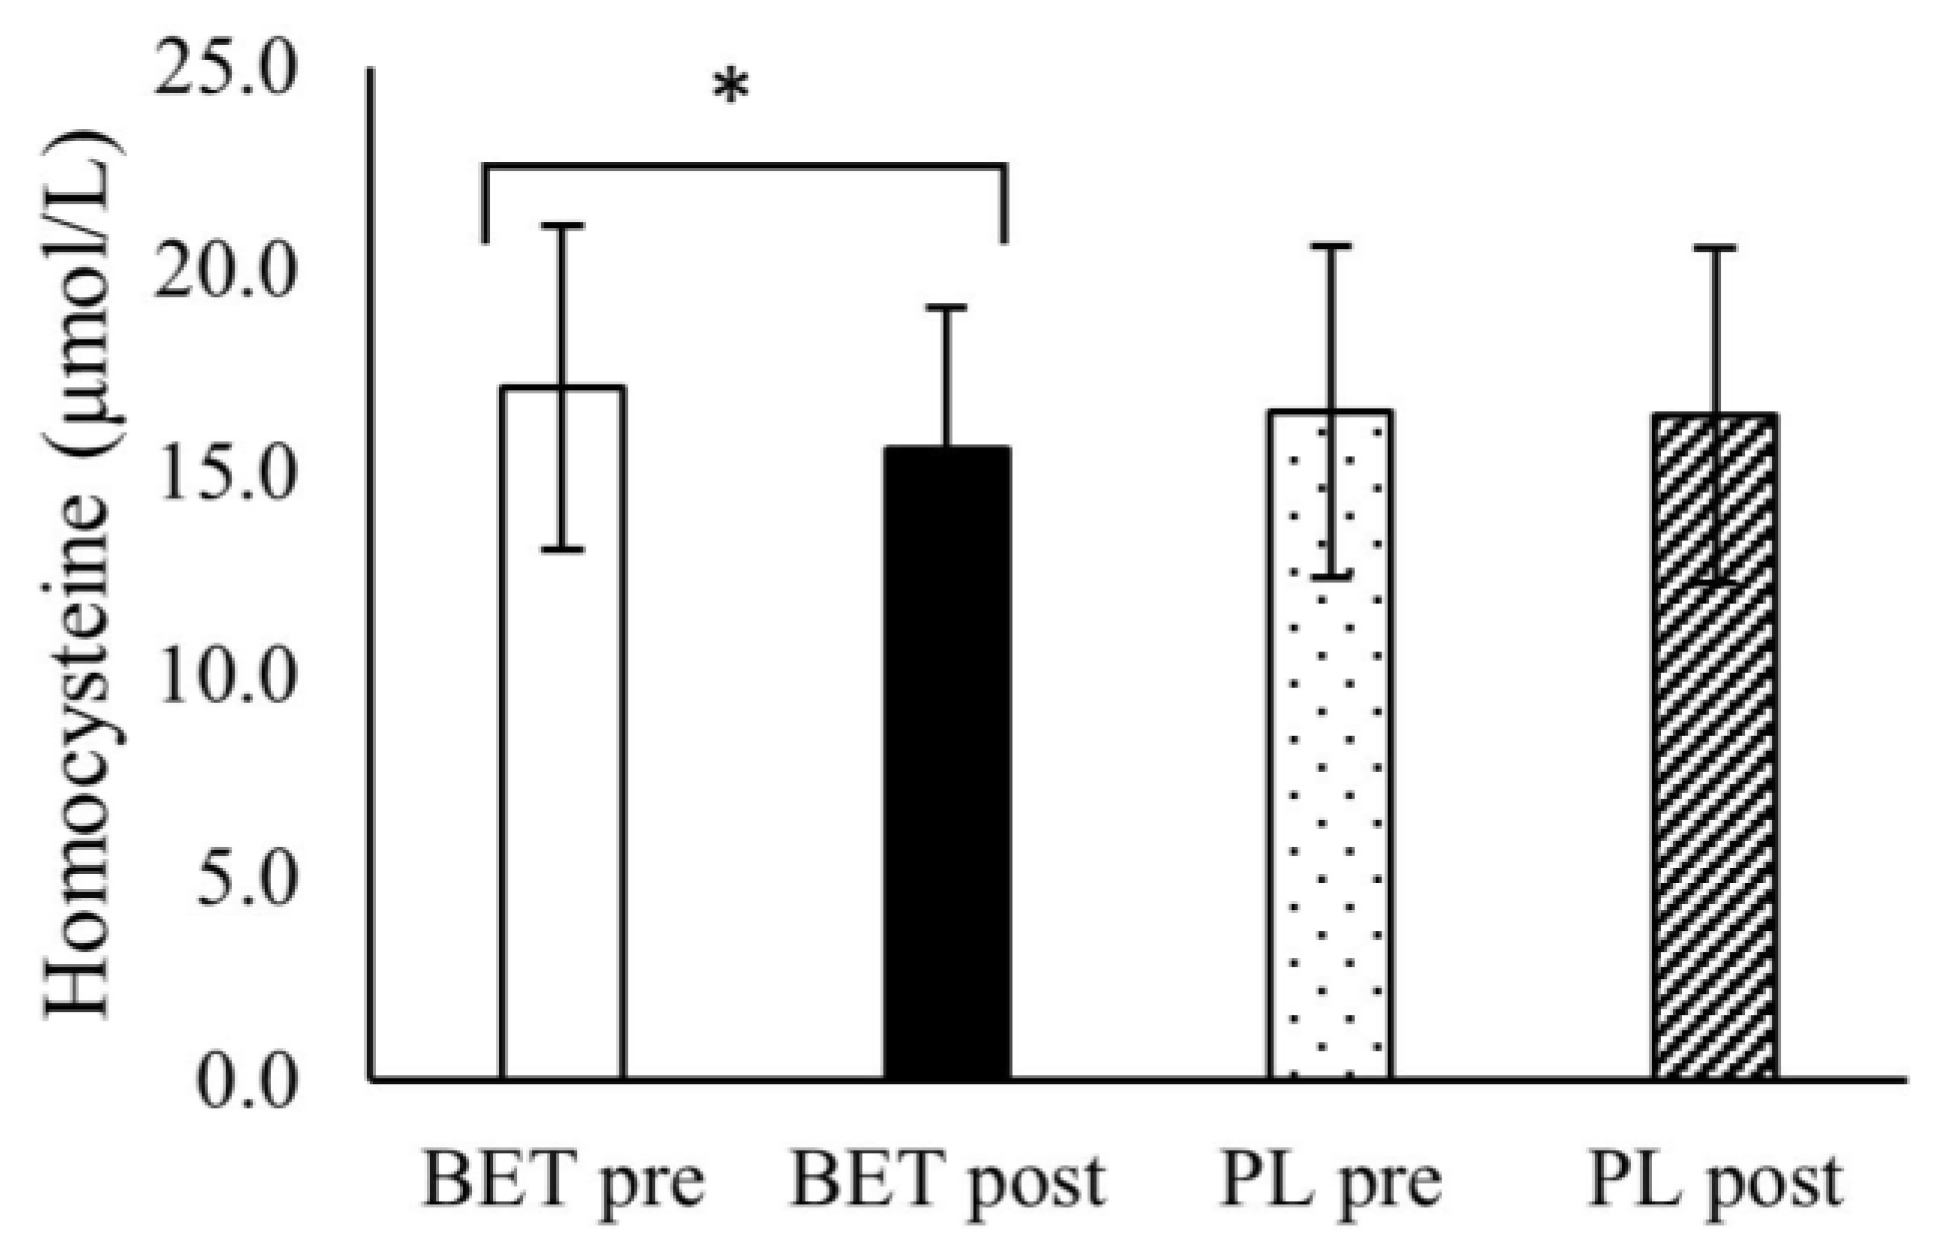
3.3. The Effect of BET Supplementation on the Concentrations Blood Lipids, Glucose, and Homocysteine
4. Discussion
5. Conclusions
Author Contributions
Funding
Institutional Review Board Statement
Informed Consent Statement
Data Availability Statement
Acknowledgments
Conflicts of Interest
References
- Olthof, M.R.; van Vliet, T.; Boelsma, E.; Verhoef, P. Low dose betaine supplementation leads to immediate and long term lowering of plasma homocysteine in healthy men and women. J. Nutr. 2003, 133, 4135–4138. [Google Scholar] [CrossRef] [PubMed] [Green Version]
- Schaffer, A.; Verdoia, M.; Cassetti, E.; Marino, P.; Suryapranata, H.; De Luca, G.; Novara Atherosclerosis Study Group (NAS). Relationship between homocysteine and coronary artery disease. Results from a large prospective cohort study. Thromb. Res. 2014, 134, 288–293. [Google Scholar] [CrossRef] [PubMed]
- Lehotský, J.; Tothová, B.; Kovalská, M.; Dobrota, D.; Beňová, A.; Kalenská, D.; Kaplán, P. Role of homocysteine in the ischemic stroke and development of ischemic tolerance. Front. Neurosci. 2016, 10, 538. [Google Scholar] [CrossRef] [Green Version]
- Setién-Suero, E.; Suárez-Pinilla, M.; Suárez-Pinilla, P.; Crespo-Facorro, B.; Ayesa-Arriola, R. Homocysteine and cognition: A systematic review of 111 studies. Neurosci. Biobehav. Rev. 2016, 69, 280–298. [Google Scholar] [CrossRef] [PubMed] [Green Version]
- Sharma, M.; Tiwari, M.; Tiwari, R.K. Hyperhomocysteinemia: Impact on neurodegenerative diseases. Basic Clin. Pharmacol. Toxicol. 2015, 117, 287–296. [Google Scholar] [CrossRef] [PubMed]
- Behera, J.; Bala, J.; Nuru, M.; Tyagi, S.C.; Tyagi, N. Homocysteine as a Pathological Biomarker for Bone Disease. J. Cell. Physiol. 2017, 232, 2704–2709. [Google Scholar] [CrossRef] [Green Version]
- Nasri, K.; Ben Fradj, M.K.; Touati, A.; Aloui, M.; Ben Jemaa, N.; Masmoudi, A.; Elmay, M.V.; Omar, S.; Feki, M.; Kaabechi, N.; et al. Association of maternal homocysteine and vitamins status with the risk of neural tube defects in Tunisia: A case-control study. Birth Defects Res. Part A Clin. Mol. Teratol. 2015, 103, 1011–1020. [Google Scholar] [CrossRef]
- Wang, C.; Ma, C.; Gong, L.; Dai, S.; Li, Y. Preventive and therapeutic role of betaine in liver disease: A review on molecular mechanisms. Eur. J. Pharm. 2021, 912, 174604. [Google Scholar] [CrossRef]
- Olthof, M.R.; van Vliet, T.; Verhoef, P.; Zock, P.L.; Katan, M.B. Effect of homocysteine-lowering nutrients on blood lipids: Results from four randomised, placebo-controlled studies in healthy humans. PLoS Med. 2005, 2, e135. [Google Scholar] [CrossRef] [Green Version]
- Zawieja, E.E.; Zawieja, B.; Chmurzynska, A. Betaine Supplementation Moderately Increases Total Cholesterol Levels: A Systematic Review and Meta-Analysis. J. Diet. Suppl. 2021, 18, 105–117. [Google Scholar] [CrossRef]
- Zeisel, S.H. Betaine supplementation and blood lipids: Fact or artifact? Nutr. Rev. 2006, 64, 77–79. [Google Scholar] [CrossRef] [PubMed]
- Ashtary-Larky, D.; Bagheri, R.; Ghanavati, M.; Asbaghi, O.; Tinsley, G.M.; Mombaini, D.; Kooti, W.; Kashkooli, S.; Wong, A. Effects of BET supplementation on cardiovascular markers: A systematic review and Meta-analysis. Crit. Rev. Food Sci. Nutr. 2021, 25, 6516–6533. [Google Scholar]
- Soysal, P.; Arik, F.; Smith, L.; Jackson, S.E.; Isik, A.T. Inflammation, Frailty and Cardiovascular Disease. Adv. Exp. Med. Biol. 2020, 1216, 55–64. [Google Scholar] [PubMed] [Green Version]
- Xia, Y.; Chen, S.; Zhu, G.; Huang, R.; Yin, Y.; Ren, W. BET Inhibits Interleukin-1β Production and Release: Potential Mechanisms. Front. Immunol. 2018, 9, 2670. [Google Scholar] [CrossRef]
- Kim, D.H.; Kim, S.M.; Lee, B.; Lee, E.K.; Chung, K.W.; Moon, K.M.; An, H.J.; Kim, K.M.; Yu, B.P.; Chung, H.Y. Effect of betaine on hepatic insulin resistance through FOXO1-induced NLRP3 inflammasome. J. Nutr. Biochem. 2017, 45, 104–114. [Google Scholar] [CrossRef]
- Zhao, G.; He, F.; Wu, C.; Li, P.; Li, N.; Deng, J.; Zhu, G.; Ren, W.; Peng, Y. Betaine in Inflammation: Mechanistic Aspects and Applications. Front. Immunol. 2018, 9, 1070. [Google Scholar] [CrossRef] [Green Version]
- Yan, J.; Wang, W.; Gregory, J.F., III; Malysheva, O.; Brenna, J.T.; Stabler, S.P.; Allen, R.H.; Caudill, M.A. MTHFR C677T genotype influences the isotopic enrichment of one-carbon metabolites in folate-compromised men consuming d9-choline. Am. J. Clin. Nutr. 2011, 93, 348–355. [Google Scholar] [CrossRef] [Green Version]
- Durkalec-Michalski, K.; Zawieja, E.E.; Zawieja, B.E.; Podgórski, T. Evaluation of the repeatability and reliability of the cross-training specific Fight Gone Bad workout and its relation to aerobic fitness. Sci. Rep. 2021, 11, 7263. [Google Scholar] [CrossRef]
- McRae, M.P. Betaine supplementation decreases plasma homocysteine in healthy adult participants: A meta-analysis. J. Chiropr. Med. 2013, 12, 20–25. [Google Scholar] [CrossRef] [Green Version]
- Li, M.N.; Wang, H.J.; Zhang, N.R.; Xuan, L.; Shi, X.J.; Zhou, T.; Chen, B.; Zhang, J.; Li, H. MTHFR C677T gene polymorphism and the severity of coronary lesions in acute coronary syndrome. Medicine 2017, 96, e9044. [Google Scholar] [CrossRef]
- Moretti, R.; Giuffré, M.; Caruso, P.; Gazzin, S.; Tiribelli, C. Homocysteine in Neurology: A Possible Contributing Factor to Small Vessel Disease. Int. J. Mol. Sci. 2021, 22, 2051. [Google Scholar] [CrossRef] [PubMed]
- McGregor, D.O.; Dellow, W.J.; Robson, R.A.; Lever, M.; George, P.M.; Chambers, S.T. Betaine supplementation decreases post-methionine hyperhomocysteinemia in chronic renal failure. Kidney Int. 2002, 61, 1040–1046. [Google Scholar] [CrossRef] [PubMed] [Green Version]
- Schwab, U.; Törrönen, A.; Toppinen, L.; Alfthan, G.; Saarinen, M.; Aro, A.; Uusitupa, M. Betaine supplementation decreases plasma homocysteine concentrations but does not affect body weight, body composition, or resting energy expenditure in human subjects. Am. J. Clin. Nutr. 2002, 76, 961–967. [Google Scholar] [CrossRef] [Green Version]
- Tiihonen, K.; Saarinen, M.T.; Alhoniemi, E.; Mitsuya, N.; Yamaki, G. Effect of dietary betaine on metabolic syndrome risk factors in Asian males with mild fatty liver. J. Diabetes Metab. 2016, 7, 692. [Google Scholar] [CrossRef]
- Grizales, A.M.; Patti, M.E.; Lin, A.P.; Beckman, J.A.; Sahni, V.A.; Cloutier, E.; Fowler, K.M.; Dreyfuss, J.M.; Pan, H.; Kozuka, C.; et al. Metabolic Effects of Betaine: A Randomized Clinical Trial of Betaine Supplementation in Prediabetes. J. Clin. Endocrinol. Metab. 2018, 103, 3038–3049. [Google Scholar] [CrossRef] [PubMed]
- Rehman, A.; Mehta, K.J. Betaine in ameliorating alcohol-induced hepatic steatosis. Eur. J. Nutr. 2022, 61, 1167–1176. [Google Scholar] [CrossRef]
- Luo, Z.; Lu, Z.; Muhammad, I.; Chen, Y.; Chen, Q.; Zhang, J.; Song, Y. Associations of the MTHFR rs1801133 polymorphism with coronary artery disease and lipid levels: A systematic review and updated meta-analysis. Lipids Health Dis. 2018, 17, 191. [Google Scholar] [CrossRef] [Green Version]
- Ito, H.; Nakasuga, K.; Ohshima, A.; Sakai, Y.; Maruyama, T.; Kaji, Y.; Harada, M.; Jingu, S.; Sakamoto, M. Excess accumulation of body fat is related to dyslipidemia in normal-weight subjects. Int. J. Obes. 2004, 28, 242–247. [Google Scholar] [CrossRef] [Green Version]
- Slow, S.; Lever, M.; Chambers, S.T.; George, P.M. Plasma dependent and independent accumulation of betaine in male and female rat tissues. Physiol. Res. 2009, 58, 403–410. [Google Scholar] [CrossRef]
- Abdelmalek, M.F.; Sanderson, S.O.; Angulo, P.; Soldevila-Pico, C.; Liu, C.; Peter, J.; Keach, J.; Cave, M.; Chen, T.; McClain, C.J.; et al. Betaine for nonalcoholic fatty liver disease: Results of a randomized placebo-controlled trial. Hepatology 2009, 50, 1818–1826. [Google Scholar] [CrossRef]
- Lala, V.; Goyal, A.; Minter, D.A. Liver Function Tests; Stat Pearls Publisher: Treasure Island, FL, USA, 2021. [Google Scholar]
- Nobari, H.; Cholewa, J.M.; Pérez-Gómez, J.; Castillo-Rodríguez, A. Effects of 14-weeks betaine supplementation on pro-inflammatory cytokines and hematology status in professional youth soccer players during a competition season: A double blind, randomized, placebo-controlled trial. J. Int. Soc. Sports Nutr. 2021, 18, 42. [Google Scholar] [CrossRef] [PubMed]


| BET Dose | t-Test | ||
|---|---|---|---|
| 2.5 g/d (n = 24) Mean ± SD | 5.0 g/d (n = 19) Mean ± SD | p-Value | |
| Age (years) | 34.1 ± 6.0 | 34.2 ± 6.4 | 0.964 |
| Height (cm) | 179 ± 7.0 | 178 ± 4.7 | 0.587 |
| Body mass (kg) | 81.9 ± 10.0 | 82.7 ± 9.0 | 0.765 |
| TAG (mg/dL) | 109.5 ± 52.3 | 112.5 ± 49.5 | 0.851 |
| TC (mg/dL) | 197.3 ± 30.7 | 191.6 ± 29.0 | 0.546 |
| LDL-C (mg/dL) | 117.8 ± 21.9 | 111.2 ± 25.2 | 0.369 |
| HDL-C (mg/dL) | 54.9 ± 11.8 | 55.7 ± 14.3 | 0.845 |
| Glucose (mg/dL) | 87.9 ± 8.0 | 89.2 ± 8.8 | 0.603 |
| ALAT (U/L) | 37.1 ± 37.7 | 32.4 ± 17.2 | 0.614 |
| ASPAT (U/L) | 33.0 ± 20.2 | 34.2 ± 16.3 | 0.844 |
| IL-6 (pg/mL) | 2.16 ± 0.28 | 2.31 ± 0.40 | 0.159 |
| IL-1β (pg/mL) | 2.58 ± 0.34 | 2.48 ± 0.23 | 0.289 |
| TNF-α (pg/mL) | 3.35 ± 0.82 | 3.19 ± 0.84 | 0.531 |
| Homocysteine (μmol/L) | 16.5 ± 4.2 | 16.2 ± 3.8 | 0.762 |
| MTHFR | t-Test | %FM | t-Test | |||
|---|---|---|---|---|---|---|
| CC Homozygotes (n = 23) Mean ± SD | T-Allele Carriers (n = 20) Mean ± SD | p-Value | <16.2 (n = 21) Mean ± SD | >16.2 (n = 22) Mean ± SD | p-Value | |
| TAG (mg/dL) | 102.8 ± 45.8 | 120.3 ± 55.5 | 0.135 | 96.9 ± 36.0 | 138.4 ± 64.3 | 0.005 |
| TC (mg/dL) | 192.0 ± 30.6 | 184.8 ± 53.2 | 0.294 | 189.4 ± 31.5 | 205.8 ± 23.0 | 0.046 |
| LDL-C (mg/dL) | 113.6 ± 21.7 | 116.7 ± 25.6 | 0.338 | 110.2 ± 23.8 | 124.7 ± 19.7 | 0.028 |
| HDL-C (mg/dL) | 54.5 ± 11.5 | 56.2 ± 14.5 | 0.332 | 57.4 ± 13.2 | 51.0 ± 11.1 | 0.064 |
| Glucose (mg/dL) | 88.8 ± 8.5 | 83.8 ± 14.4 | 0.084 | 87.5 ± 9.2 | 90.3 ± 5.8 | 0.157 |
| ALAT (U/L) | 37.4 ± 39.9 | 32.2 ± 12.4 | 0.289 | 37.0 ± 35.9 | 30.9 ± 11.5 | 0.270 |
| ASPAT (U/L) | 33.7 ± 23.7 | 33.4 ± 10.0 | 0.475 | 34.8 ± 21.7 | 30.9 ± 8.3 | 0.259 |
| IL-6 (pg/mL) | 2.21 ± 0.43 | 2.25 ± 0.21 | 0.329 | 2.20 ± 0.28 | 2.28 ± 0.45 | 0.238 |
| IL-1β (pg/mL) | 2.55 ± 0.38 | 2.51 ± 0.17 | 0.329 | 2.53 ± 0.34 | 2.55 ± 0.18 | 0.401 |
| TNF-α (pg/mL) | 3.30 ± 0.82 | 3.26 ± 0.84 | 0.446 | 3.20 ± 0.83 | 3.46 ± 0.80 | 0.165 |
| Homocysteine (μmol/L) | 15.6 ± 4.7 | 17.2 ± 2.8 | 0.094 | 15.5 ± 3.2 | 17.3 ± 4.7 | 0.064 |
| Pearson R2 | p-Value | |
|---|---|---|
| Correlations of TAG with | ||
| BM | +0.36 | 0.019 |
| FM (%) | +0.38 | 0.014 |
| FFM (%) | −0.38 | 0.014 |
| FM (kg) | +0.42 | 0.006 |
| TC | +0.32 | 0.038 |
| LDL-C | +0.31 | 0.043 |
| Correlations of TC with | ||
| FM (%) | +0.37 | 0.015 |
| FFM (%) | −0.37 | 0.015 |
| FFM (kg) | −0.45 | 0.003 |
| Glucose | +0.57 | <0.001 |
| LDL-C | +0.68 | <0.001 |
| TNF-α | +0.37 | 0.016 |
| Correlations of LDL-C with | ||
| FM (%) | +0.34 | 0.048 |
| FFM (%) | −0.34 | 0.048 |
| FM (kg) | +0.42 | 0.006 |
| Correlations of HDL-C with | ||
| BM | −0.32 | 0.047 |
| TAG | −0.35 | 0.021 |
| IL-1β | −0.32 | 0.045 |
| Correlations of homocysteine with | ||
| FM (%) | +0.328 | 0.032 |
| FFM (%) | −0.328 | 0.032 |
| MTHFR | Dose | ||||
|---|---|---|---|---|---|
| CC Homozygotes (n = 23) Mean ± SD | T-Allele Carriers (n = 20) Mean ± SD | 2.5 g/d (n = 24) Mean ± SD | 5.0 g/d (n = 19) Mean ± SD | ||
| TAG (mg/dL) | BETpre | 93.6 ± 36.5 | 105.5 ± 36.8 | 99.4 ± 44.1 | 98.5 ± 38.6 |
| BETpost | 92.9 ± 39.9 | 121.8 ± 57.2 | 104.5 ± 57.8 | 107.9 ± 38.9 | |
| PLpre | 104.9 ± 53.0 | 119.7 ± 54.1 | 114.1 ± 58.2 | 108.3 ± 47.7 | |
| PLpost | 100.7 ± 48.6 | 108.1 ± 58.1 | 106.8 ± 54.0 | 100.3 ± 51.9 | |
| Time x treatment | p = 0.069 η2 = 0.084 | Time x treatment x MTHFR: | p = 0.153 η2 = 0.053 | Time x treatment x dose: | p = 0.729 η2 = 0.003 |
| TC (mg/dL) | BETpre | 191.7 ± 31.9 | 192.5 ± 32.2 | 194.3 ± 33.1 | 189.1 ± 30.3 |
| BETpost | 193.4 ± 47.1 | 192.7 ± 30.2 | 194.9 ± 43.8 | 190.7 ± 35.2 | |
| PLpre | 189.8 ± 28.0 | 195.4 ± 27.9 | 197.5 ± 31.5 | 185.5 ± 20.7 | |
| PLpost | 184.6 ± 25.8 | 191.3 ± 27.1 | 191.7 ± 29.5 | 182.2 ± 21.0 | |
| Time x treatment | p = 0.247 η2 = 0.035 | Time x treatment x MTHFR: | p = 0.764 η2 = 0.002 | Time x treatment x dose: | p = 0.859 η2 = 0.001 |
| LDL-C (mg/dL) | BETpre | 113.3 ± 23.6 | 113.3 ± 27.6 | 116.4 ± 24.4 | 109.2 ± 26.4 |
| BETpost | 115.4 ± 33.3 | 112.7 ± 26.3 | 117.5 ± 30.1 | 109.7 ± 30.2 | |
| PLpre | 111.6 ± 18.3 | 115.5 ± 24.3 | 118.2 ± 22.4 | 106.9 ± 17.7 | |
| PLpost | 109.2 ± 19.5 | 111.0 ± 22.5 | 113.7 ± 20.9 | 105.1 ± 19.9 | |
| Time x treatment | p = 0.295 η2 = 0.029 | Time x treatment x MTHFR: | p = 0.915 η2 = 0.000 | Time x treatment x dose: | p = 0.642 η2 = 0.006 |
| HDL-C (mg/dL) | BETpre | 58.1 ± 14.2 | 56.1 ± 13.1 | 56.1 ± 13.3 | 58.7 ± 14.1 |
| BETpost | 57.6 ± 15.9 | 55.3 ± 11.0 | 55.5 ± 15.5 | 58.0 ± 11.5 | |
| PLpre | 55.8 ± 12.1 | 54.4 ± 12.4 | 55.6 ± 12.6 | 54.6 ± 11.7 | |
| PLpost | 56.7 ± 13.7 | 58.0 ± 13.9 | 57.0 ± 13.0 | 57.7 ± 14.6 | |
| Time x treatment | p = 0.077 η2 = 0.080 | Time x treatment x MTHFR: | p = 0.325 η2 = 0.025 | Time x treatment x dose: | p = 0.552 η2 = 0.009 |
| Glucose (mg/dL) | BETpre | 87.2 ± 9.5 | 89.2 ± 6.7 | 87.5 ± 6.6 | 88.8 ± 10.3 |
| BETpost | 89.3 ± 8.2 | 89.2 ± 9.0 | 89.3 ± 9.3 | 89.2 ± 7.4 | |
| PLpre | 89.1 ± 8.5 | 87.7 ± 8.1 | 88.0 ± 8.8 | 89.1 ± 7.7 | |
| PLpost | 88.8 ± 9.7 | 90.0 ± 6.0 | 89.0 ± 6.9 | 89.4 ± 9.8 | |
| Time x treatment | p = 0.928 η2 = 0.000 | Time x treatment x MTHFR: | p = 0.276 η2 = 0.031 | Time x treatment x dose: | p = 0.816 η2 = 0.001 |
| Homocysteine (μmol/L) | BETpre | 16.6 ± 3.5 | 17.6 ± 4.6 | 17.3 ± 4.2 | 16.8 ± 3.9 |
| BETpost | 15.0 ± 3.1 | 16.2 ± 3.9 | 15.6 ± 3.8 | 15.6 ± 3.3 | |
| PLpre | 15.5 ± 2.4 | 17.8 ± 5.1 | 16.6 ± 4.4 | 16.7 ± 3.7 | |
| PLpost | 15.5 ± 3.1 | 17.4 ± 4.9 | 17.2 ± 4.1 | 17.7 ± 6.0 | |
| Time x treatment | p = 0.009 η2 = 0.164 | Time x treatment x MTHFR: | p = 0.446 η2 = 0.015 | Time x treatment x dose: | p = 0.888 η2 = 0.001 |
| MTHFR | Dose | ||||
|---|---|---|---|---|---|
| CC Homozygotes (n = 23) Mean ± SD | T Allele-Carriers (n = 20) Mean ± SD | 2.5 g/d (n = 24) Mean ± SD | 5.0 g/d (n = 19) Mean ± SD | ||
| IL-6 (pg/mL) | BETpre | 2.22 ± 0.88 | 2.29 ± 0.23 | 2.31 ± 0.85 | 2.17 ± 0.25 |
| BETpost | 2.10 ± 0.35 | 2.17 ± 0.29 | 2.11 ± 0.31 | 2.17 ± 0.35 | |
| PLpre | 2.20 ± 0.45 | 2.23 ± 0.21 | 2.13 ± 0.29 | 2.31 ± 0.41 | |
| PLpost | 2.09 ± 0.26 | 2.36 ± 0.49 | 2.20 ± 0.31 | 2.24 ± 0.50 | |
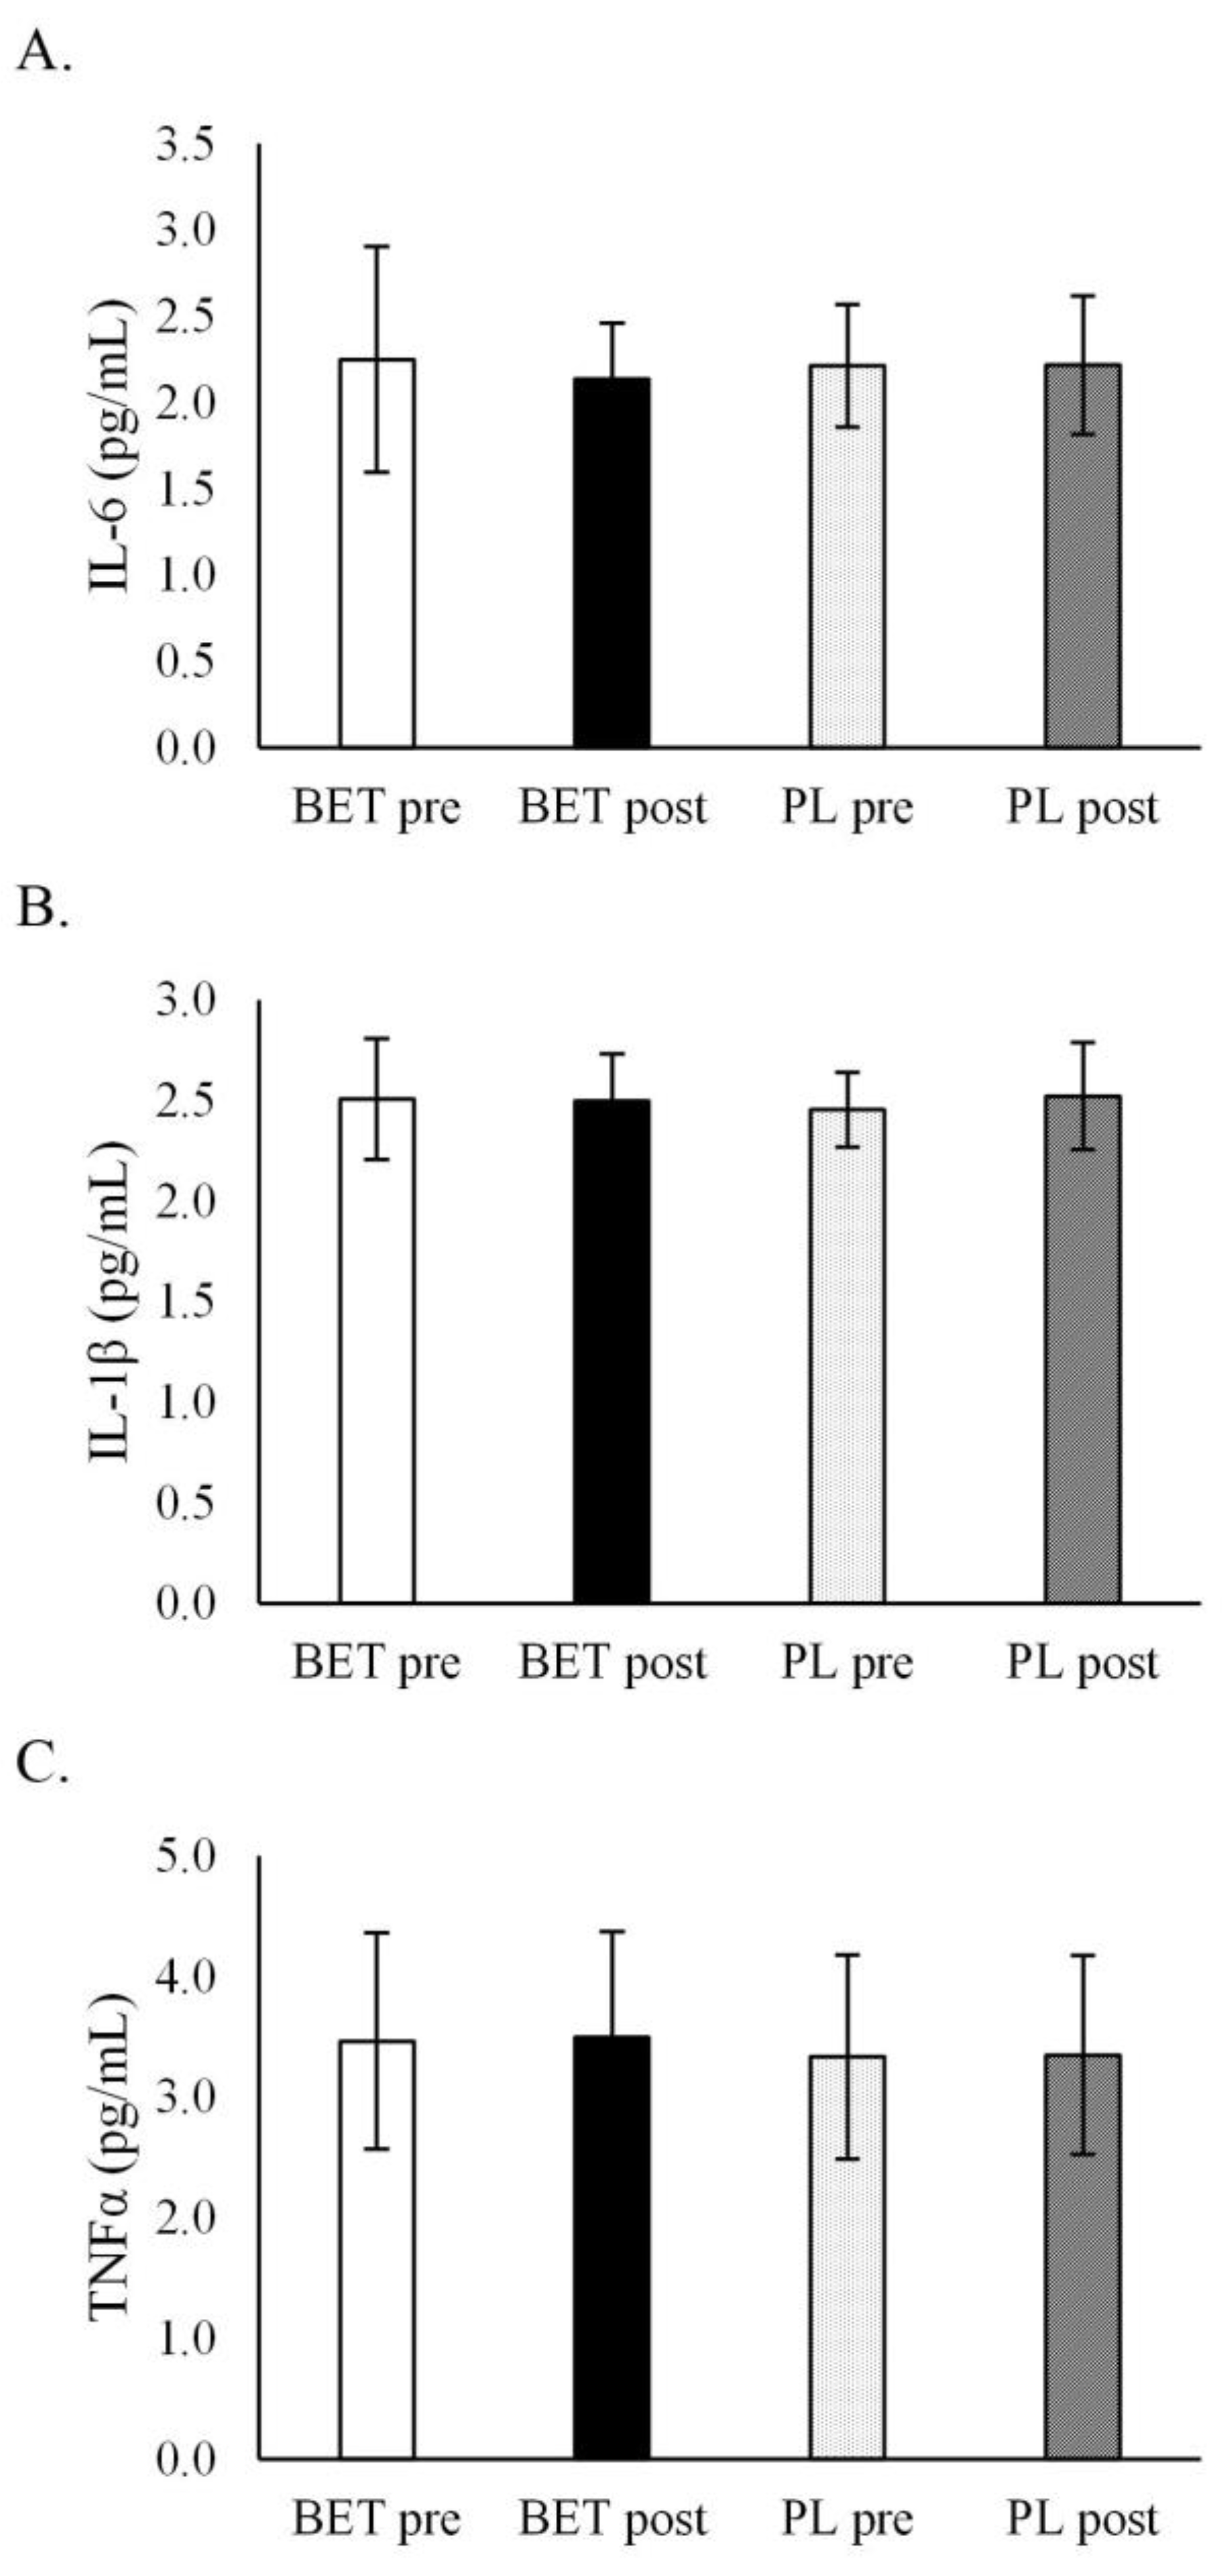
| Time x treatment | p = 0.400 η2 = 0.018 | Time x treatment x MTHFR: | p = 0.290 η2 = 0.029 | Time x treatment x dose: | p = 0.184 η2 = 0.045 |
| IL-1β (pg/mL) | BETpre | 2.51 ± 0.39 | 2.50 ± 0.16 | 2.53 ± 0.35 | 2.47 ± 0.23 |
| BETpost | 2.44 ± 0.25 | 2.56 ± 0.21 | 2.53 ± 0.21 | 2.45 ± 0.25 | |
| PLpre | 2.46 ± 0.22 | 2.45 ± 0.15 | 2.47 ± 0.15 | 2.43 ± 0.23 | |
| PLpost | 2.53 ± 0.30 | 2.51 ± 0.22 | 2.53 ± 0.29 | 2.51 ± 0.22 | |
| Time x treatment | p = 0.221 η2 = 0.038 | Time x treatment x MTHFR: | p = 0.262 η2 = 0.032 | Time x treatment x dose: | p = 0.768 η2 = 0.002 |
| TNF-α (pg/mL) | BETpre | 3.64 ± 0.93 | 3.33 ± 0.87 | 3.44 ± 0.87 | 3.56 ± 0.96 |
| BETpost | 3.73 ± 0.82 | 3.36 ± 0.87 | 3.48 ± 0.85 | 3.65 ± 0.87 | |
| PLpre | 3.42 ± 0.82 | 3.31 ± 0.89 | 3.43 ± 0.85 | 3.28 ± 0.85 | |
| PLpost | 3.42 ± 0.78 | 3.29 ± 0.92 | 3.45 ± 0.89 | 3.25 ± 0.79 | |
| Time x treatment | p = 0.407 η2 = 0.019 | Time x treatment x MTHFR: | p = 0.907 η2 = 0.000 | Time x treatment x dose: | p = 0.530 η2 = 0.011 |
| MTHFR | Dose | ||||
|---|---|---|---|---|---|
| CC Homozygotes (n = 23) Mean ± SD | T-Allele Carriers (n = 20) Mean ± SD | 2.5 g/d (n = 24) Mean ± SD | 5.0 g/d (n = 19) Mean ± SD | ||
| ALAT (U/L) | BETpre | 36.2 ± 36.4 | 30.5 ± 11.1 | 34.5 ± 34.4 | 32.3 ± 16.2 |
| BETpost | 30.2 ± 12.6 | 31.5 ± 12.8 | 29.6 ± 10.8 | 32.3 ± 14.7 | |
| PLpre | 34.7 ± 23.1 | 32.0 ± 13.7 | 35.2 ± 20.6 | 31.4 ± 17.5 | |
| PLpost | 33.2 ± 20.8 | 33.8 ± 15.2 | 33.4 ± 17.1 | 33.6 ± 20.0 | |
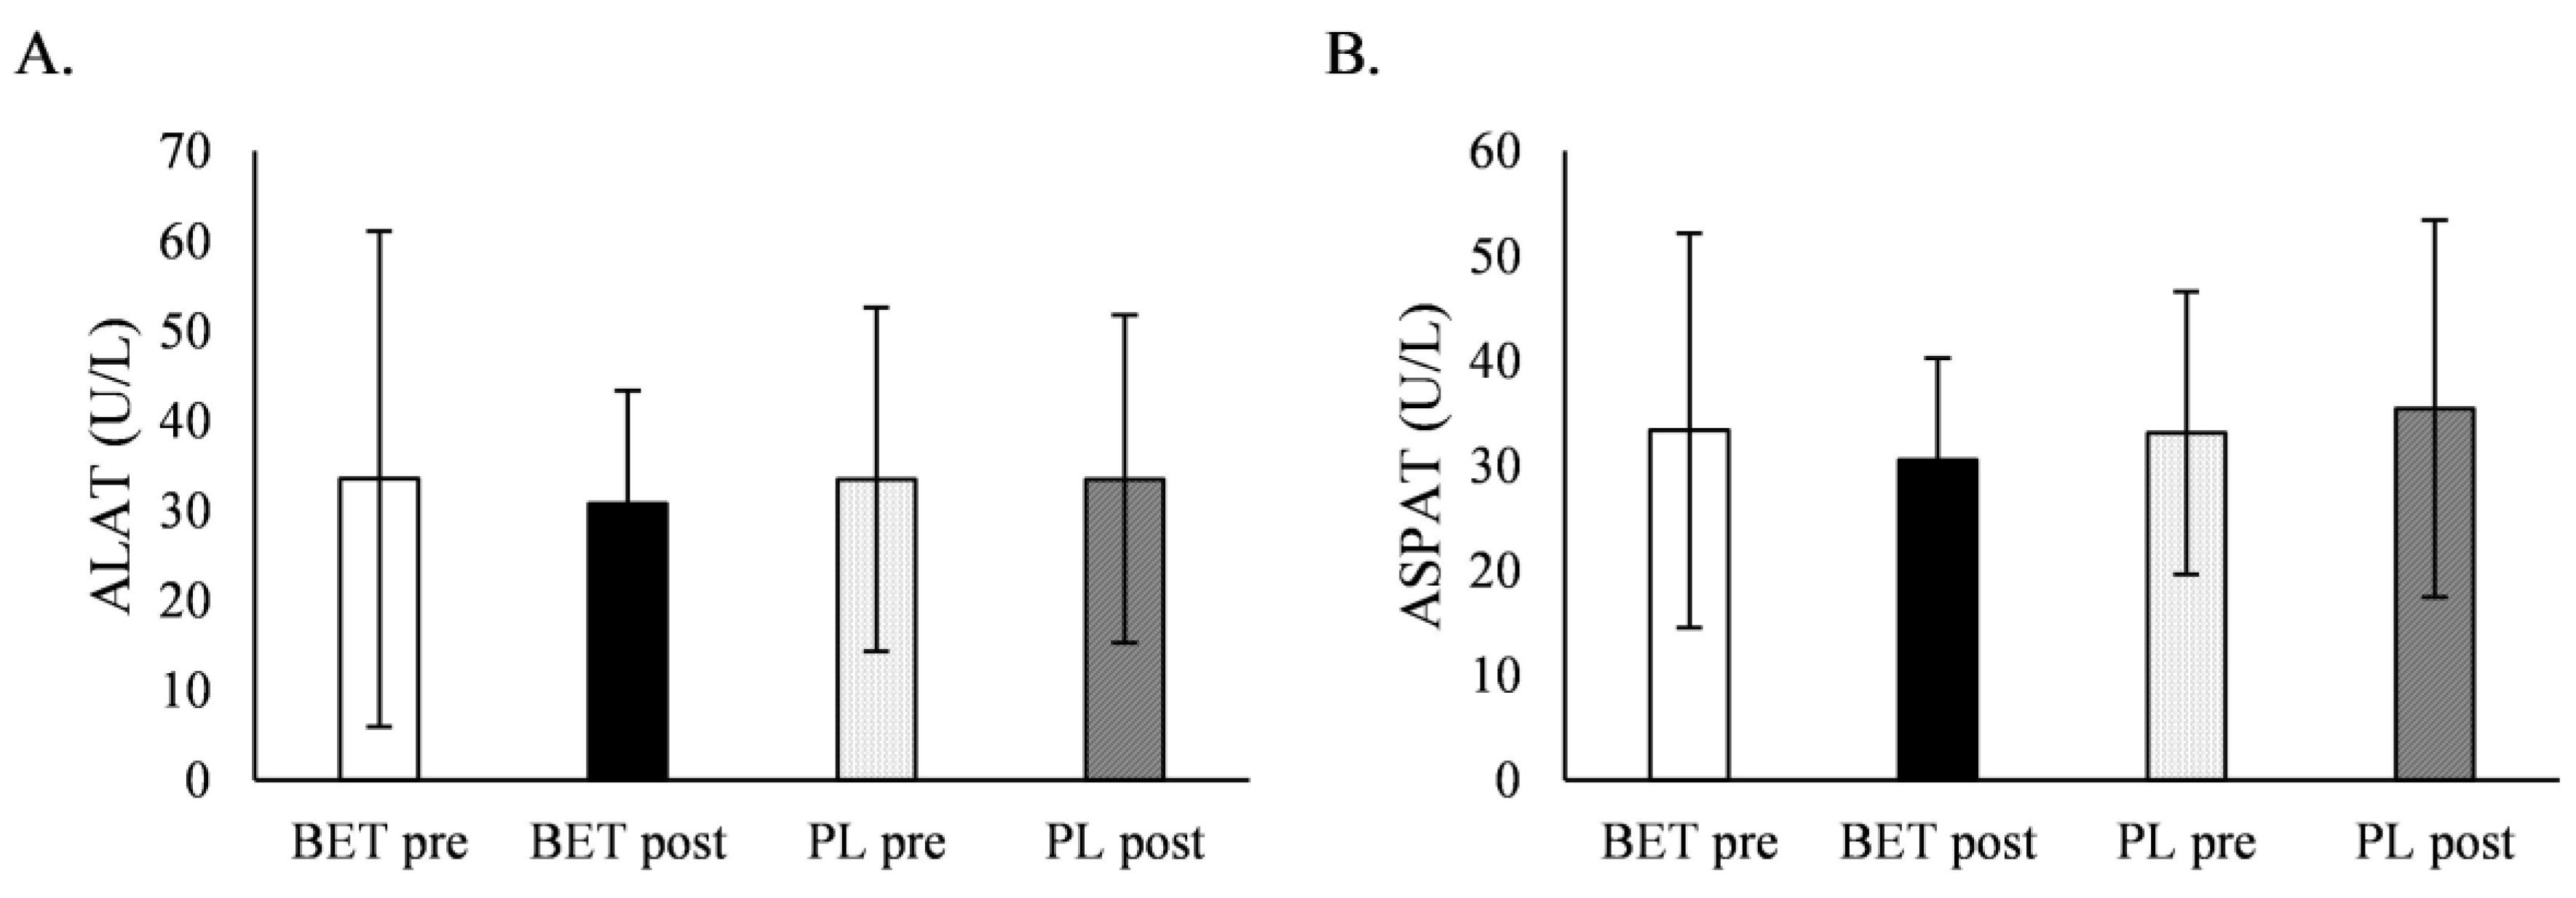
| Time x treatment | p = 0.617 η2 = 0.007 | Time x treatment x MTHFR: | p = 0.746 η2 = 0.003 | Time x treatment x dose: | p = 0.959 η2 = 0.000 |
| ASPAT (U/L) | BETpre | 34.9 ± 24.6 | 31.6 ± 8.7 | 31.9 ± 19.6 | 35.2 ± 18.2 |
| BETpost | 29.1 ± 7.9 | 32.1 ± 11.5 | 28.9 ± 5.5 | 32.6 ± 13.2 | |
| PLpre | 33.7 ± 16.6 | 32.5 ± 9.1 | 33.0 ± 11.6 | 33.2 ± 15.9 | |
| PLpost | 34.1 ± 15.5 | 36.9 ± 20.8 | 36.5 ± 21.0 | 34.0 ± 13.7 | |
| Time x treatment | p = 0.193 η2 = 0.043 | Time x treatment x MTHFR: | p = 0.768 η2 = 0.002 | Time x treatment x dose: | p = 0.661 η2 = 0.005 |
Publisher’s Note: MDPI stays neutral with regard to jurisdictional claims in published maps and institutional affiliations. |
© 2022 by the authors. Licensee MDPI, Basel, Switzerland. This article is an open access article distributed under the terms and conditions of the Creative Commons Attribution (CC BY) license (https://creativecommons.org/licenses/by/4.0/).
Share and Cite
Zawieja, E.; Durkalec-Michalski, K.; Muzsik-Kazimierska, A.; Chmurzynska, A. The Effect of 3-Week Betaine Supplementation on Blood Biomarkers of Cardiometabolic Health in Young Physically Active Males. Metabolites 2022, 12, 731. https://doi.org/10.3390/metabo12080731
Zawieja E, Durkalec-Michalski K, Muzsik-Kazimierska A, Chmurzynska A. The Effect of 3-Week Betaine Supplementation on Blood Biomarkers of Cardiometabolic Health in Young Physically Active Males. Metabolites. 2022; 12(8):731. https://doi.org/10.3390/metabo12080731
Chicago/Turabian StyleZawieja, Emilia, Krzysztof Durkalec-Michalski, Agata Muzsik-Kazimierska, and Agata Chmurzynska. 2022. "The Effect of 3-Week Betaine Supplementation on Blood Biomarkers of Cardiometabolic Health in Young Physically Active Males" Metabolites 12, no. 8: 731. https://doi.org/10.3390/metabo12080731
APA StyleZawieja, E., Durkalec-Michalski, K., Muzsik-Kazimierska, A., & Chmurzynska, A. (2022). The Effect of 3-Week Betaine Supplementation on Blood Biomarkers of Cardiometabolic Health in Young Physically Active Males. Metabolites, 12(8), 731. https://doi.org/10.3390/metabo12080731