
Accurate Lipid Quantification of Tissue Homogenates Requires Suitable Sample Concentration, Solvent Composition, and Homogenization Procedure—A Case Study in Murine Liver

 ,
,
Abstract
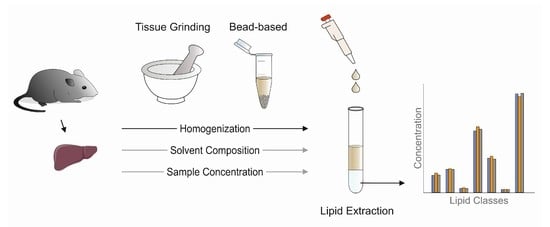
1. Introduction
2. Results
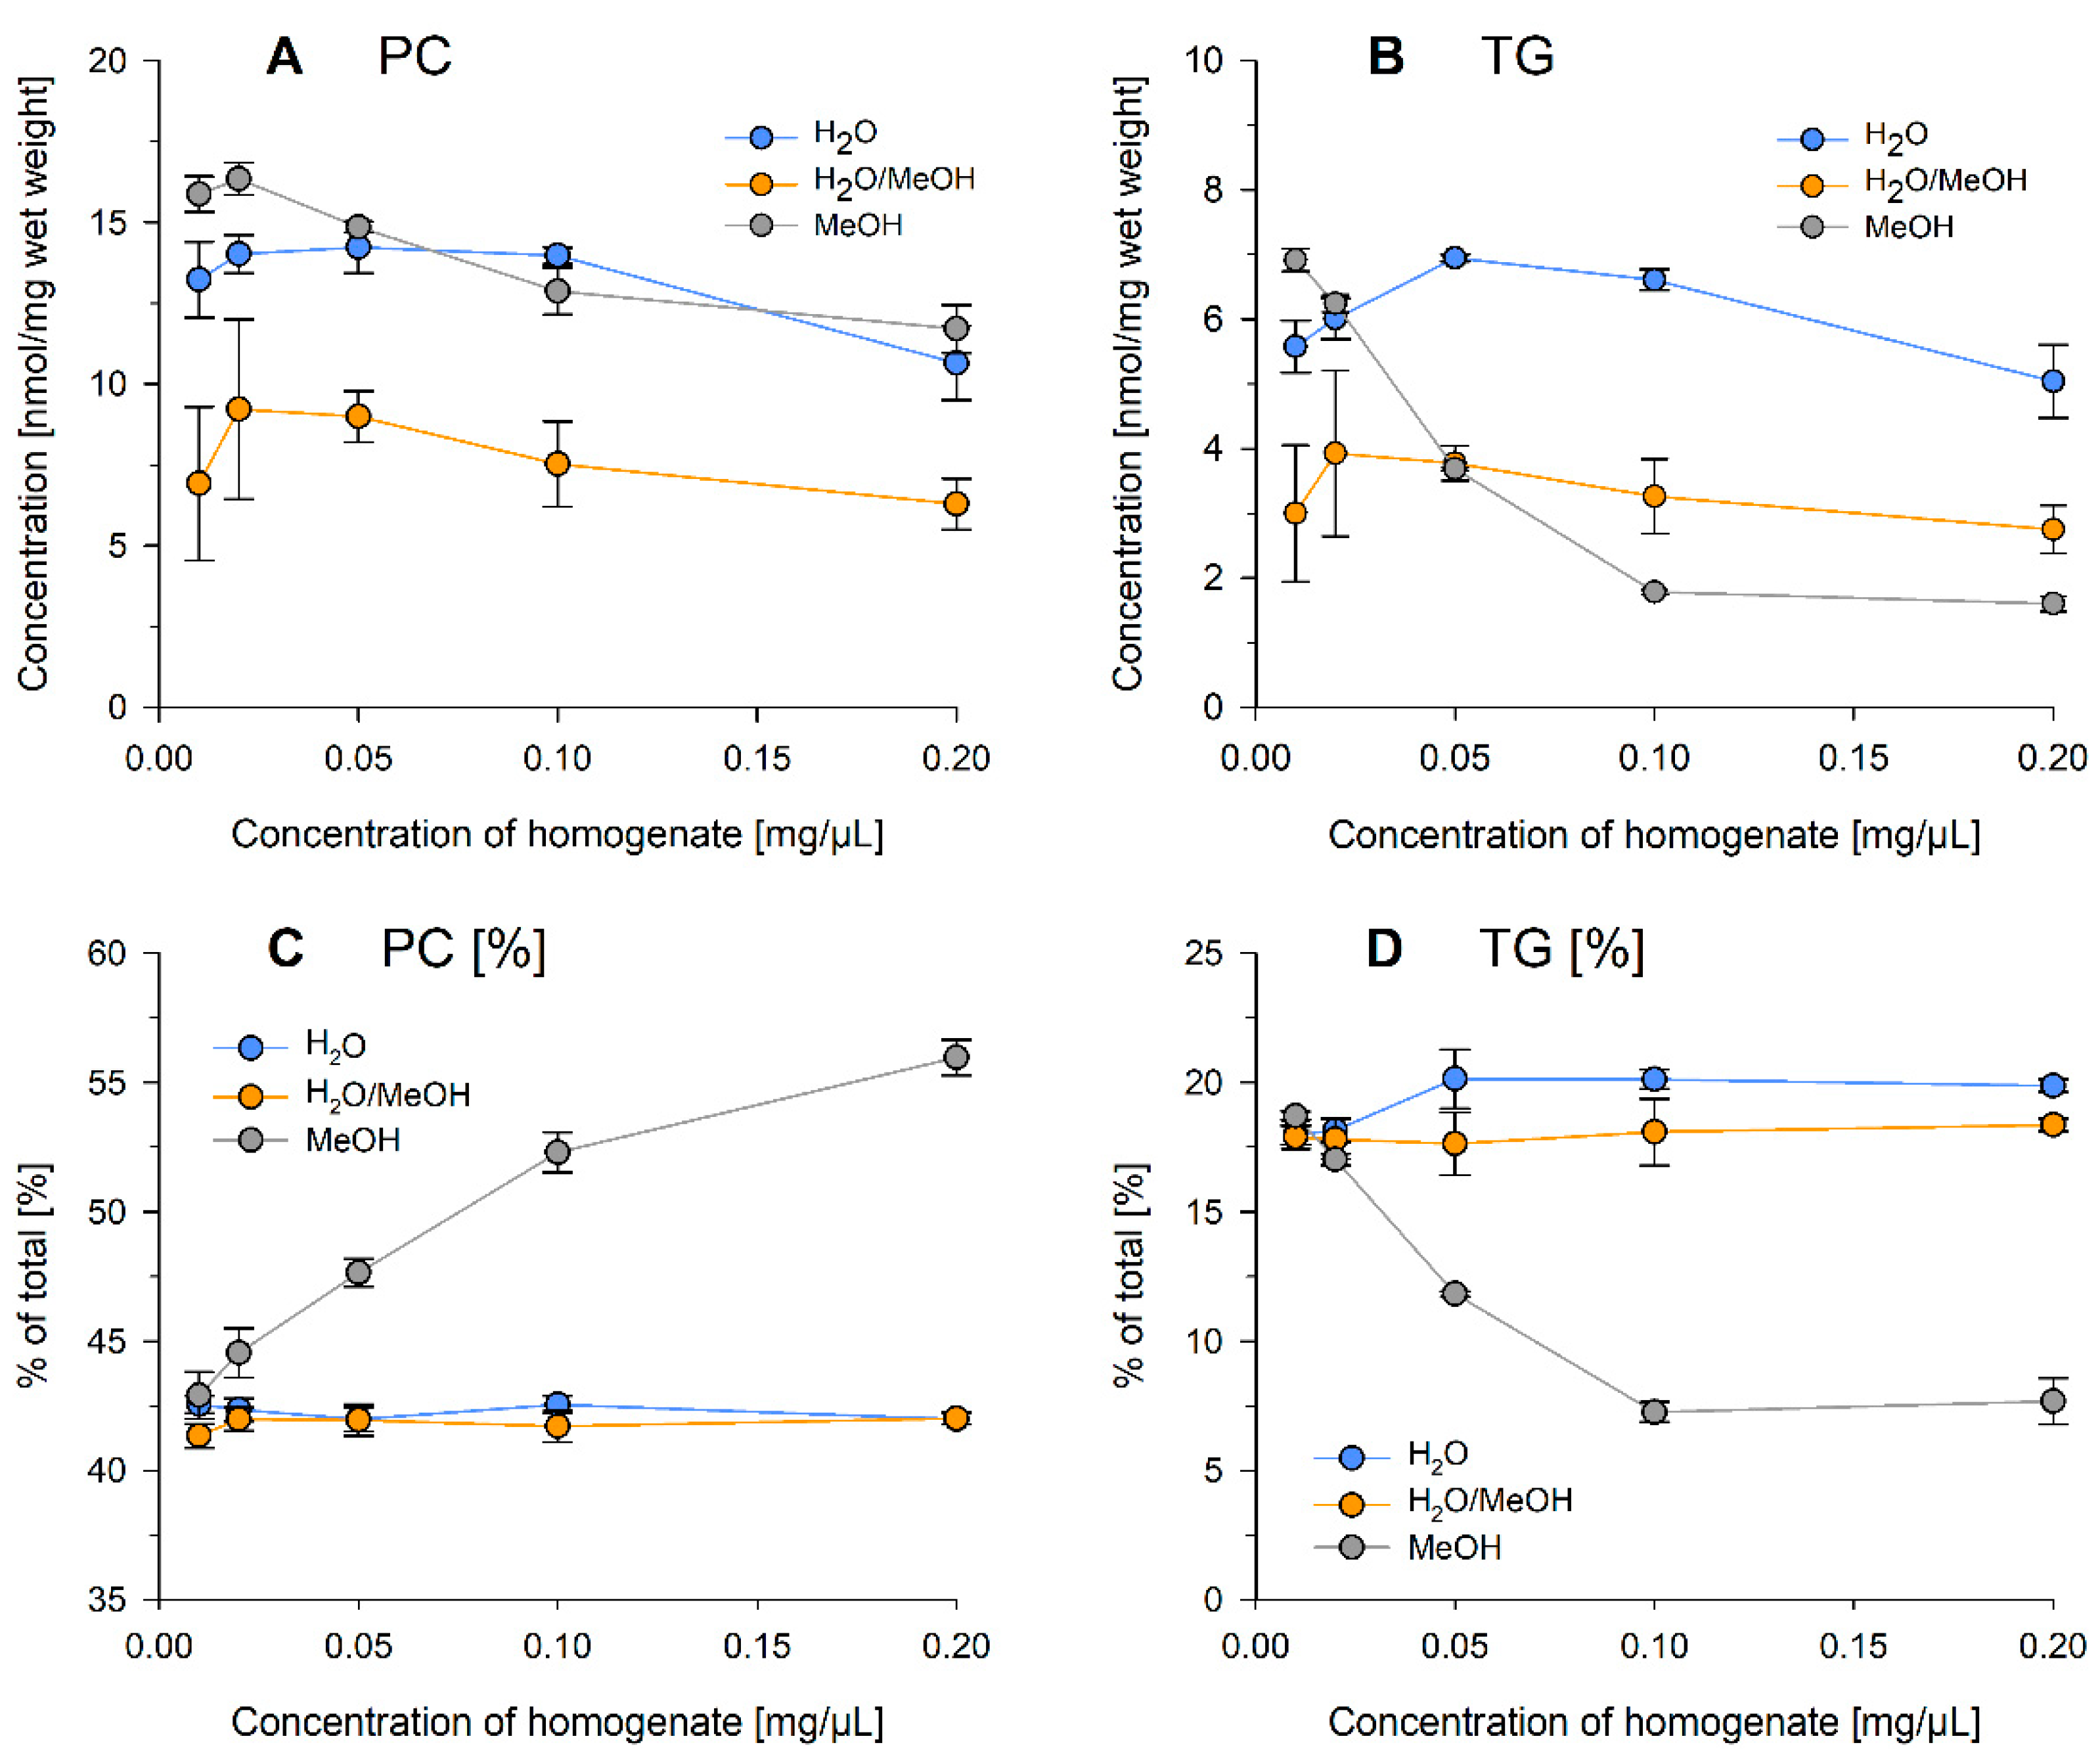
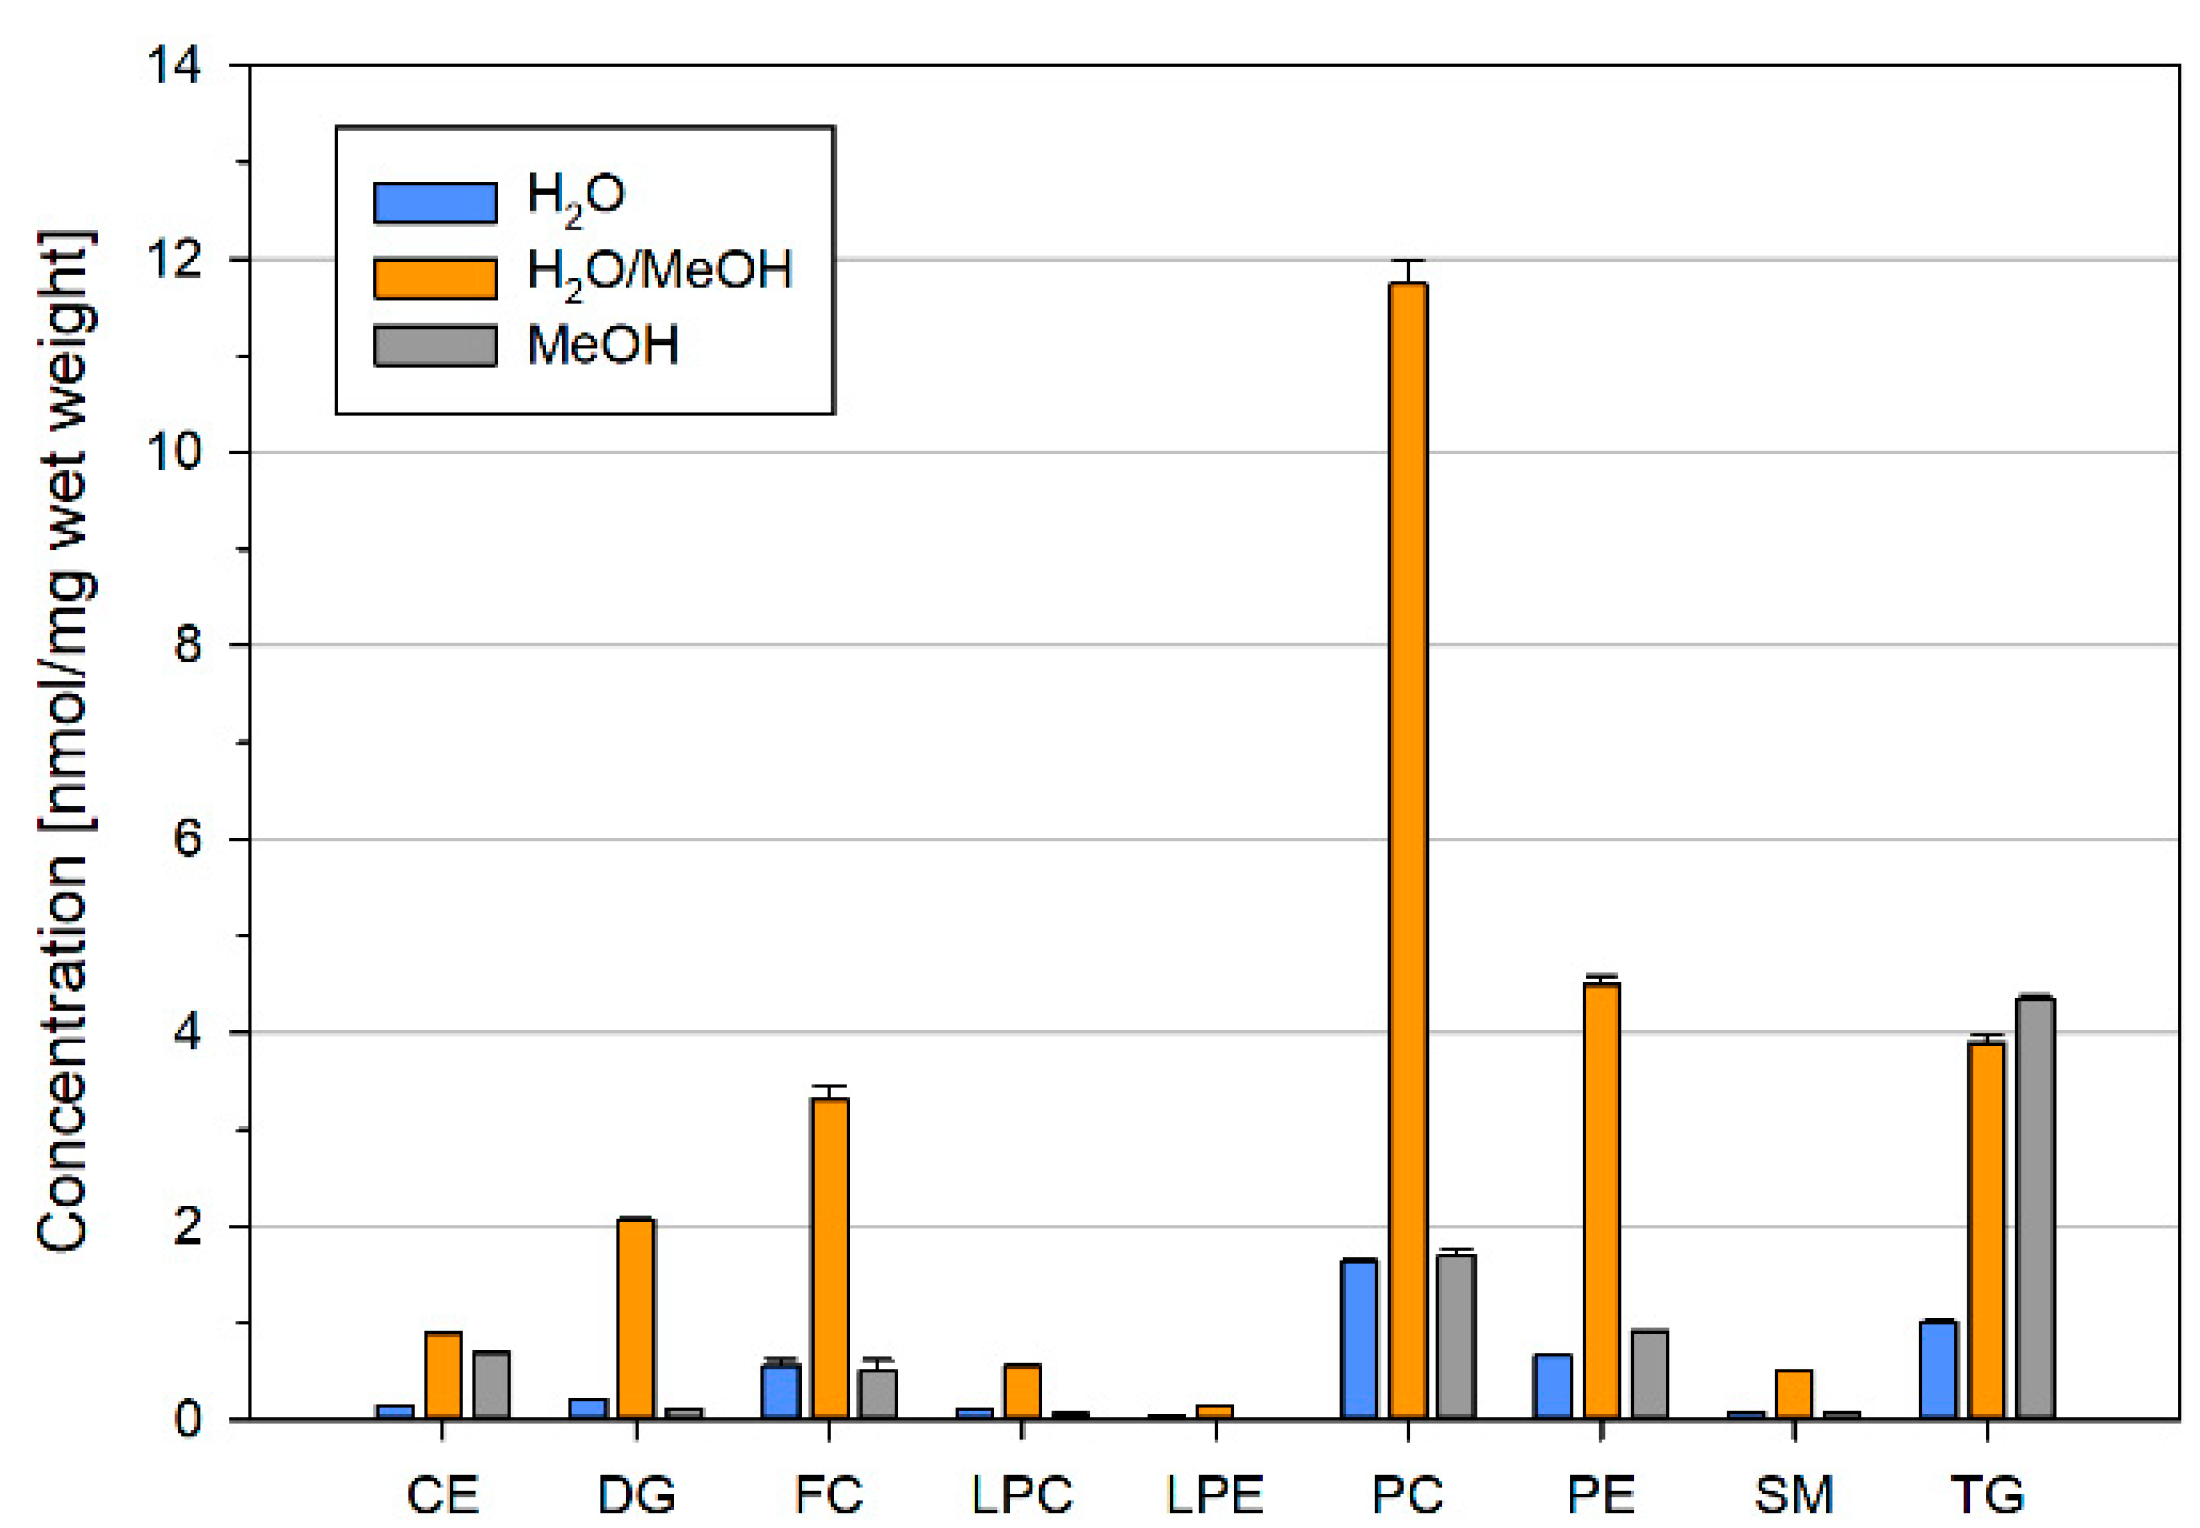
2.1. Lipid Recovery and Composition Is Influenced by Concentration and Solvent Composition of Ground Liver Homogenates
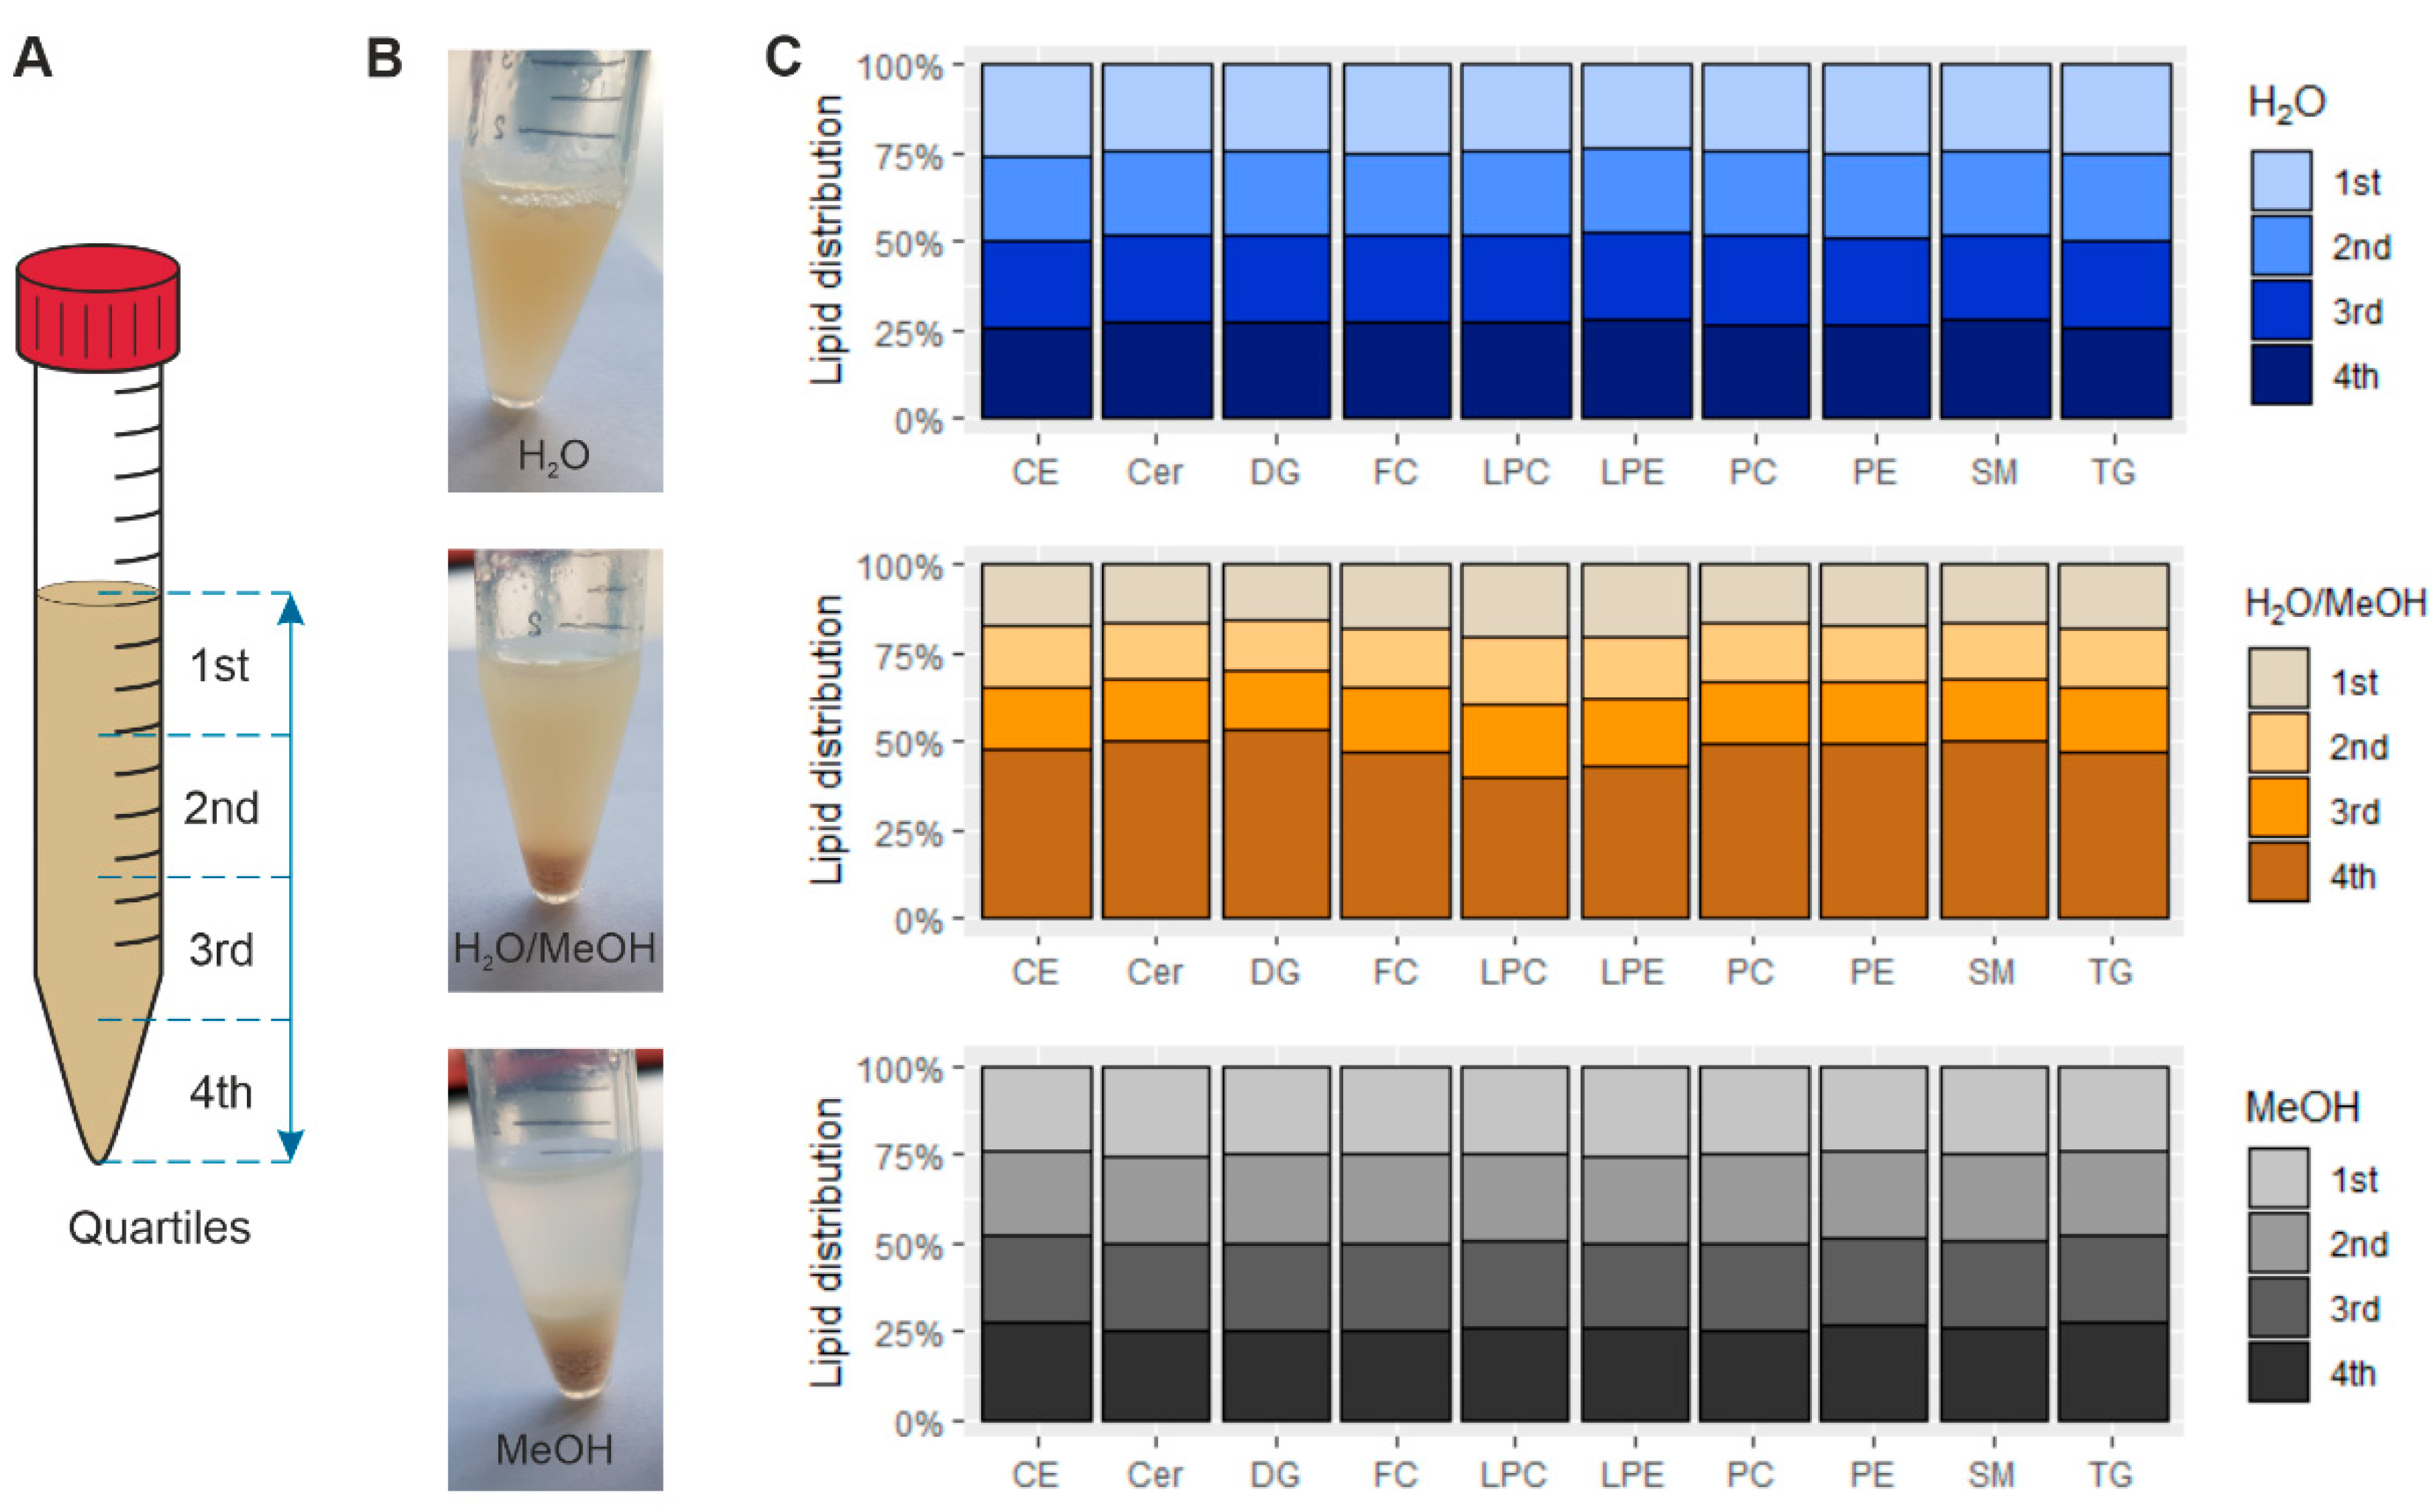
2.2. Sample Inhomogeneity of Ground Liver Homogenates Influences Lipid Recovery
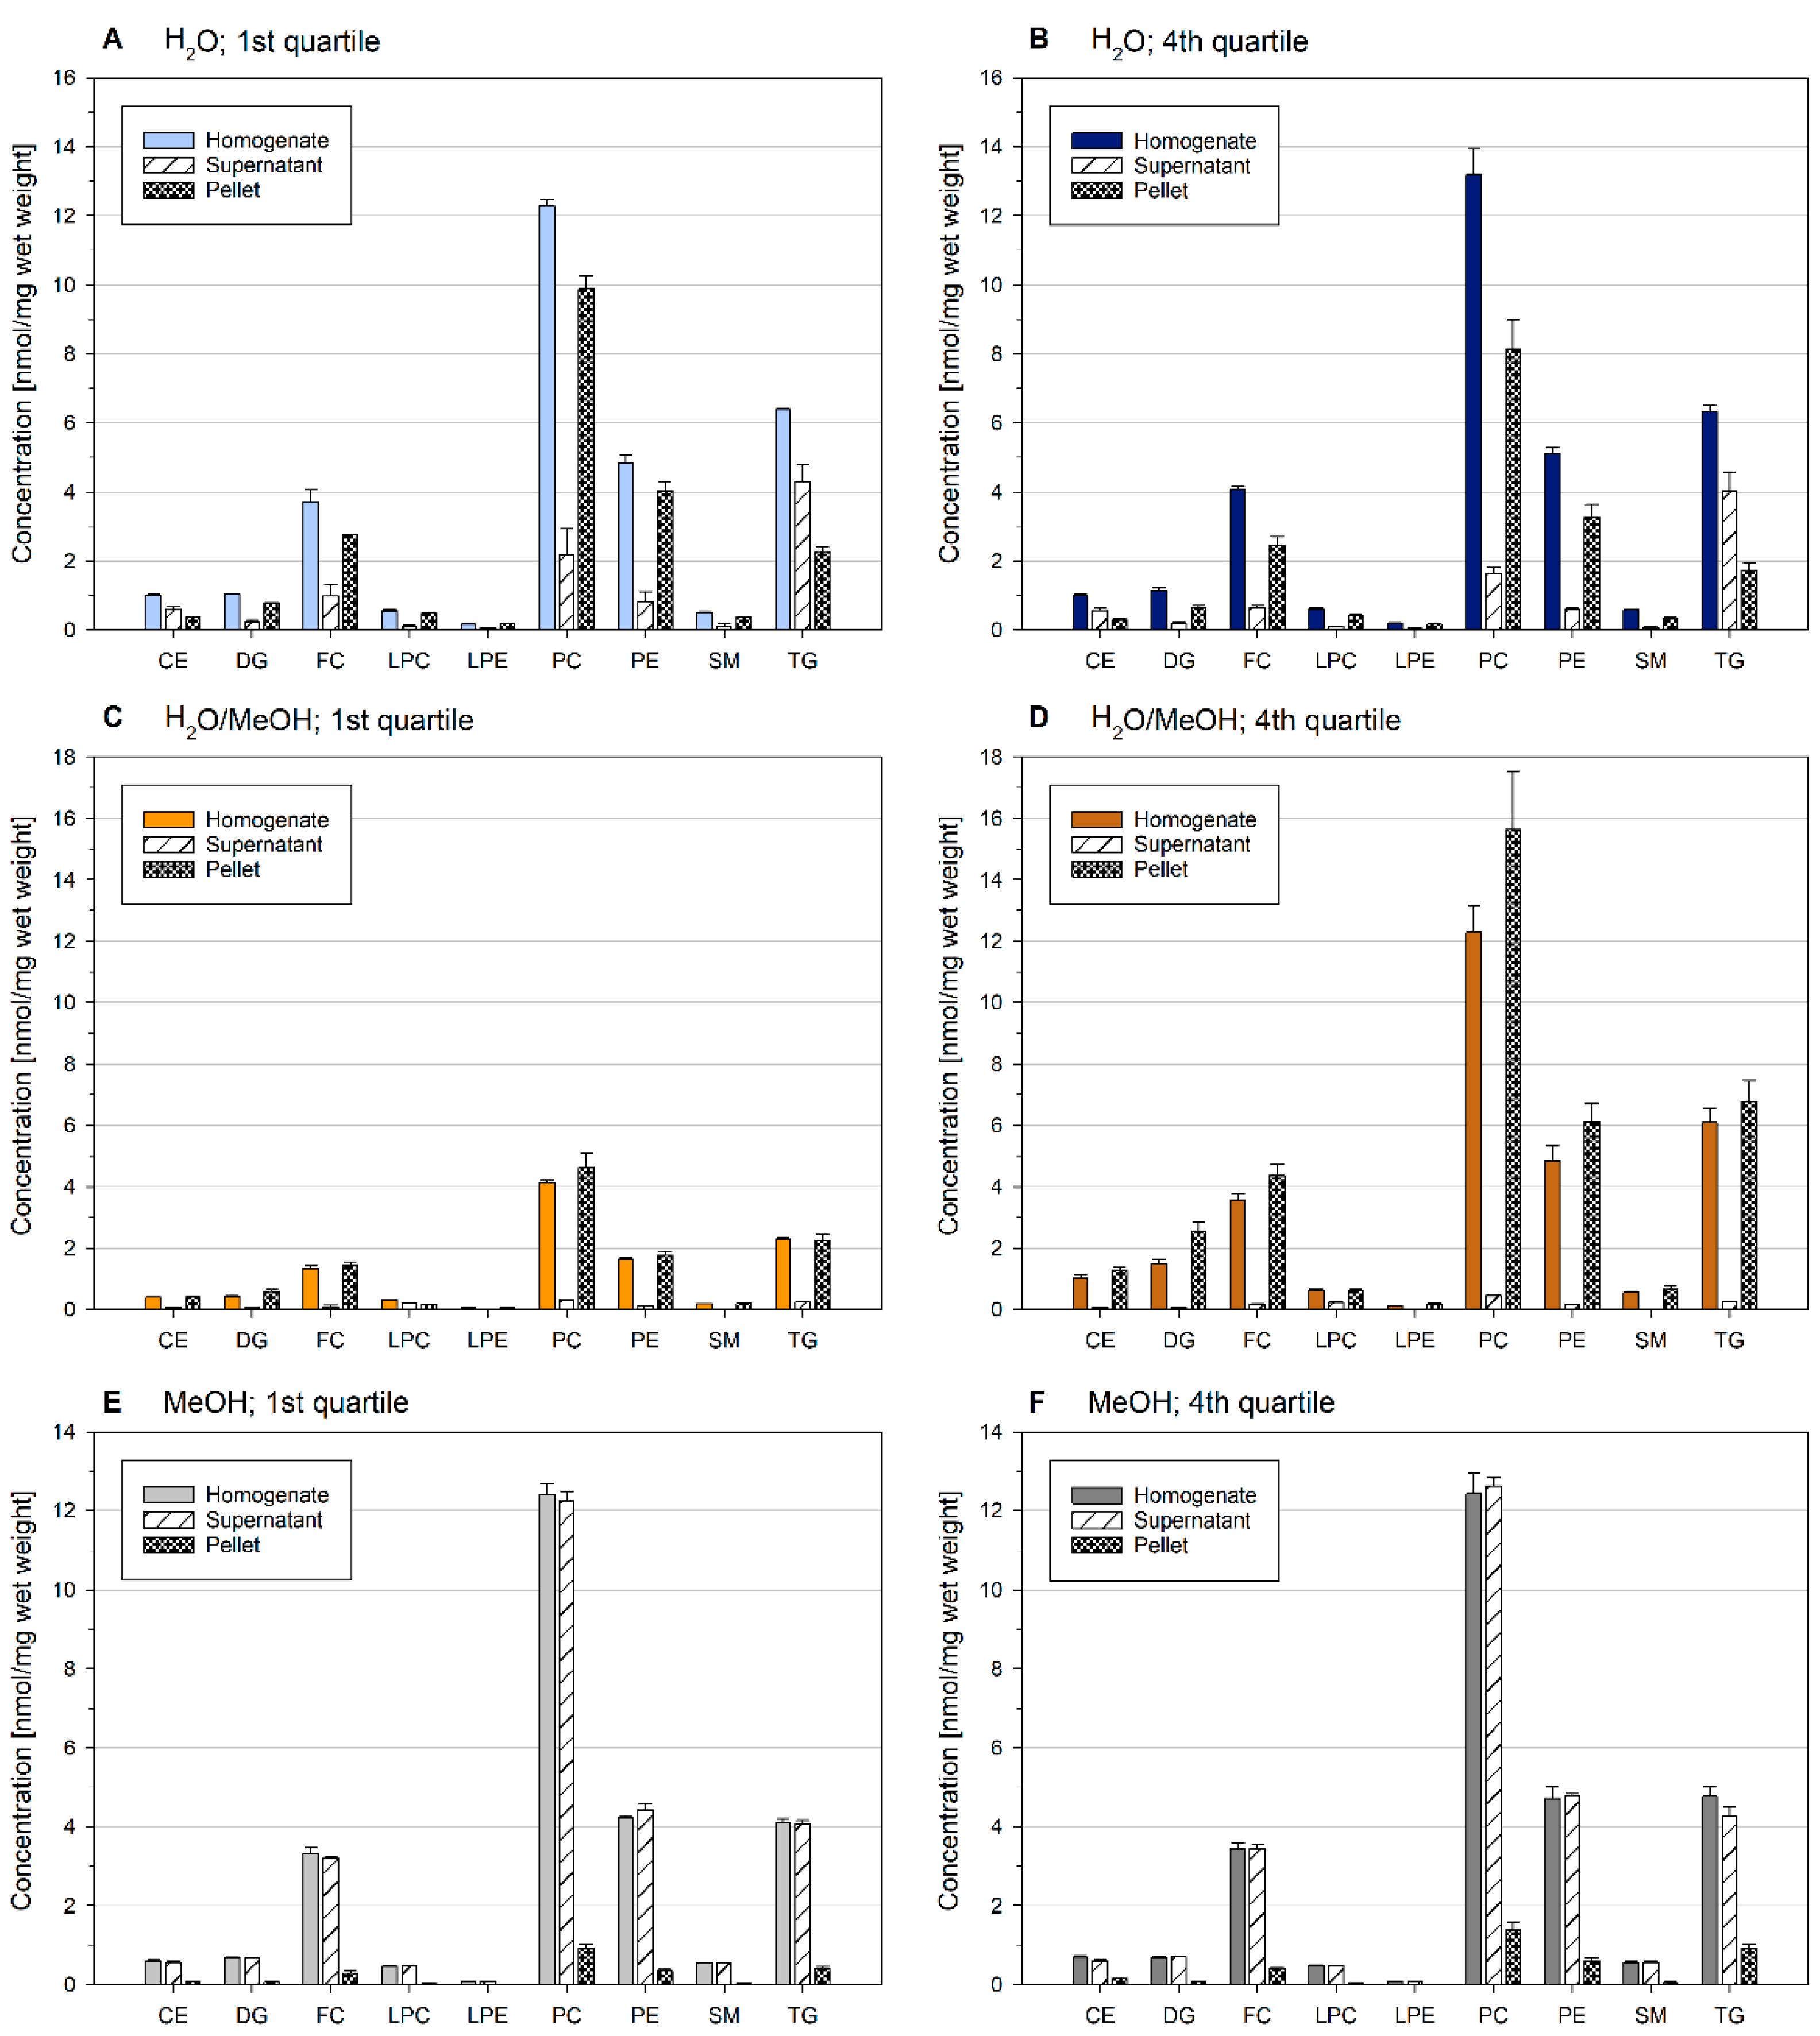
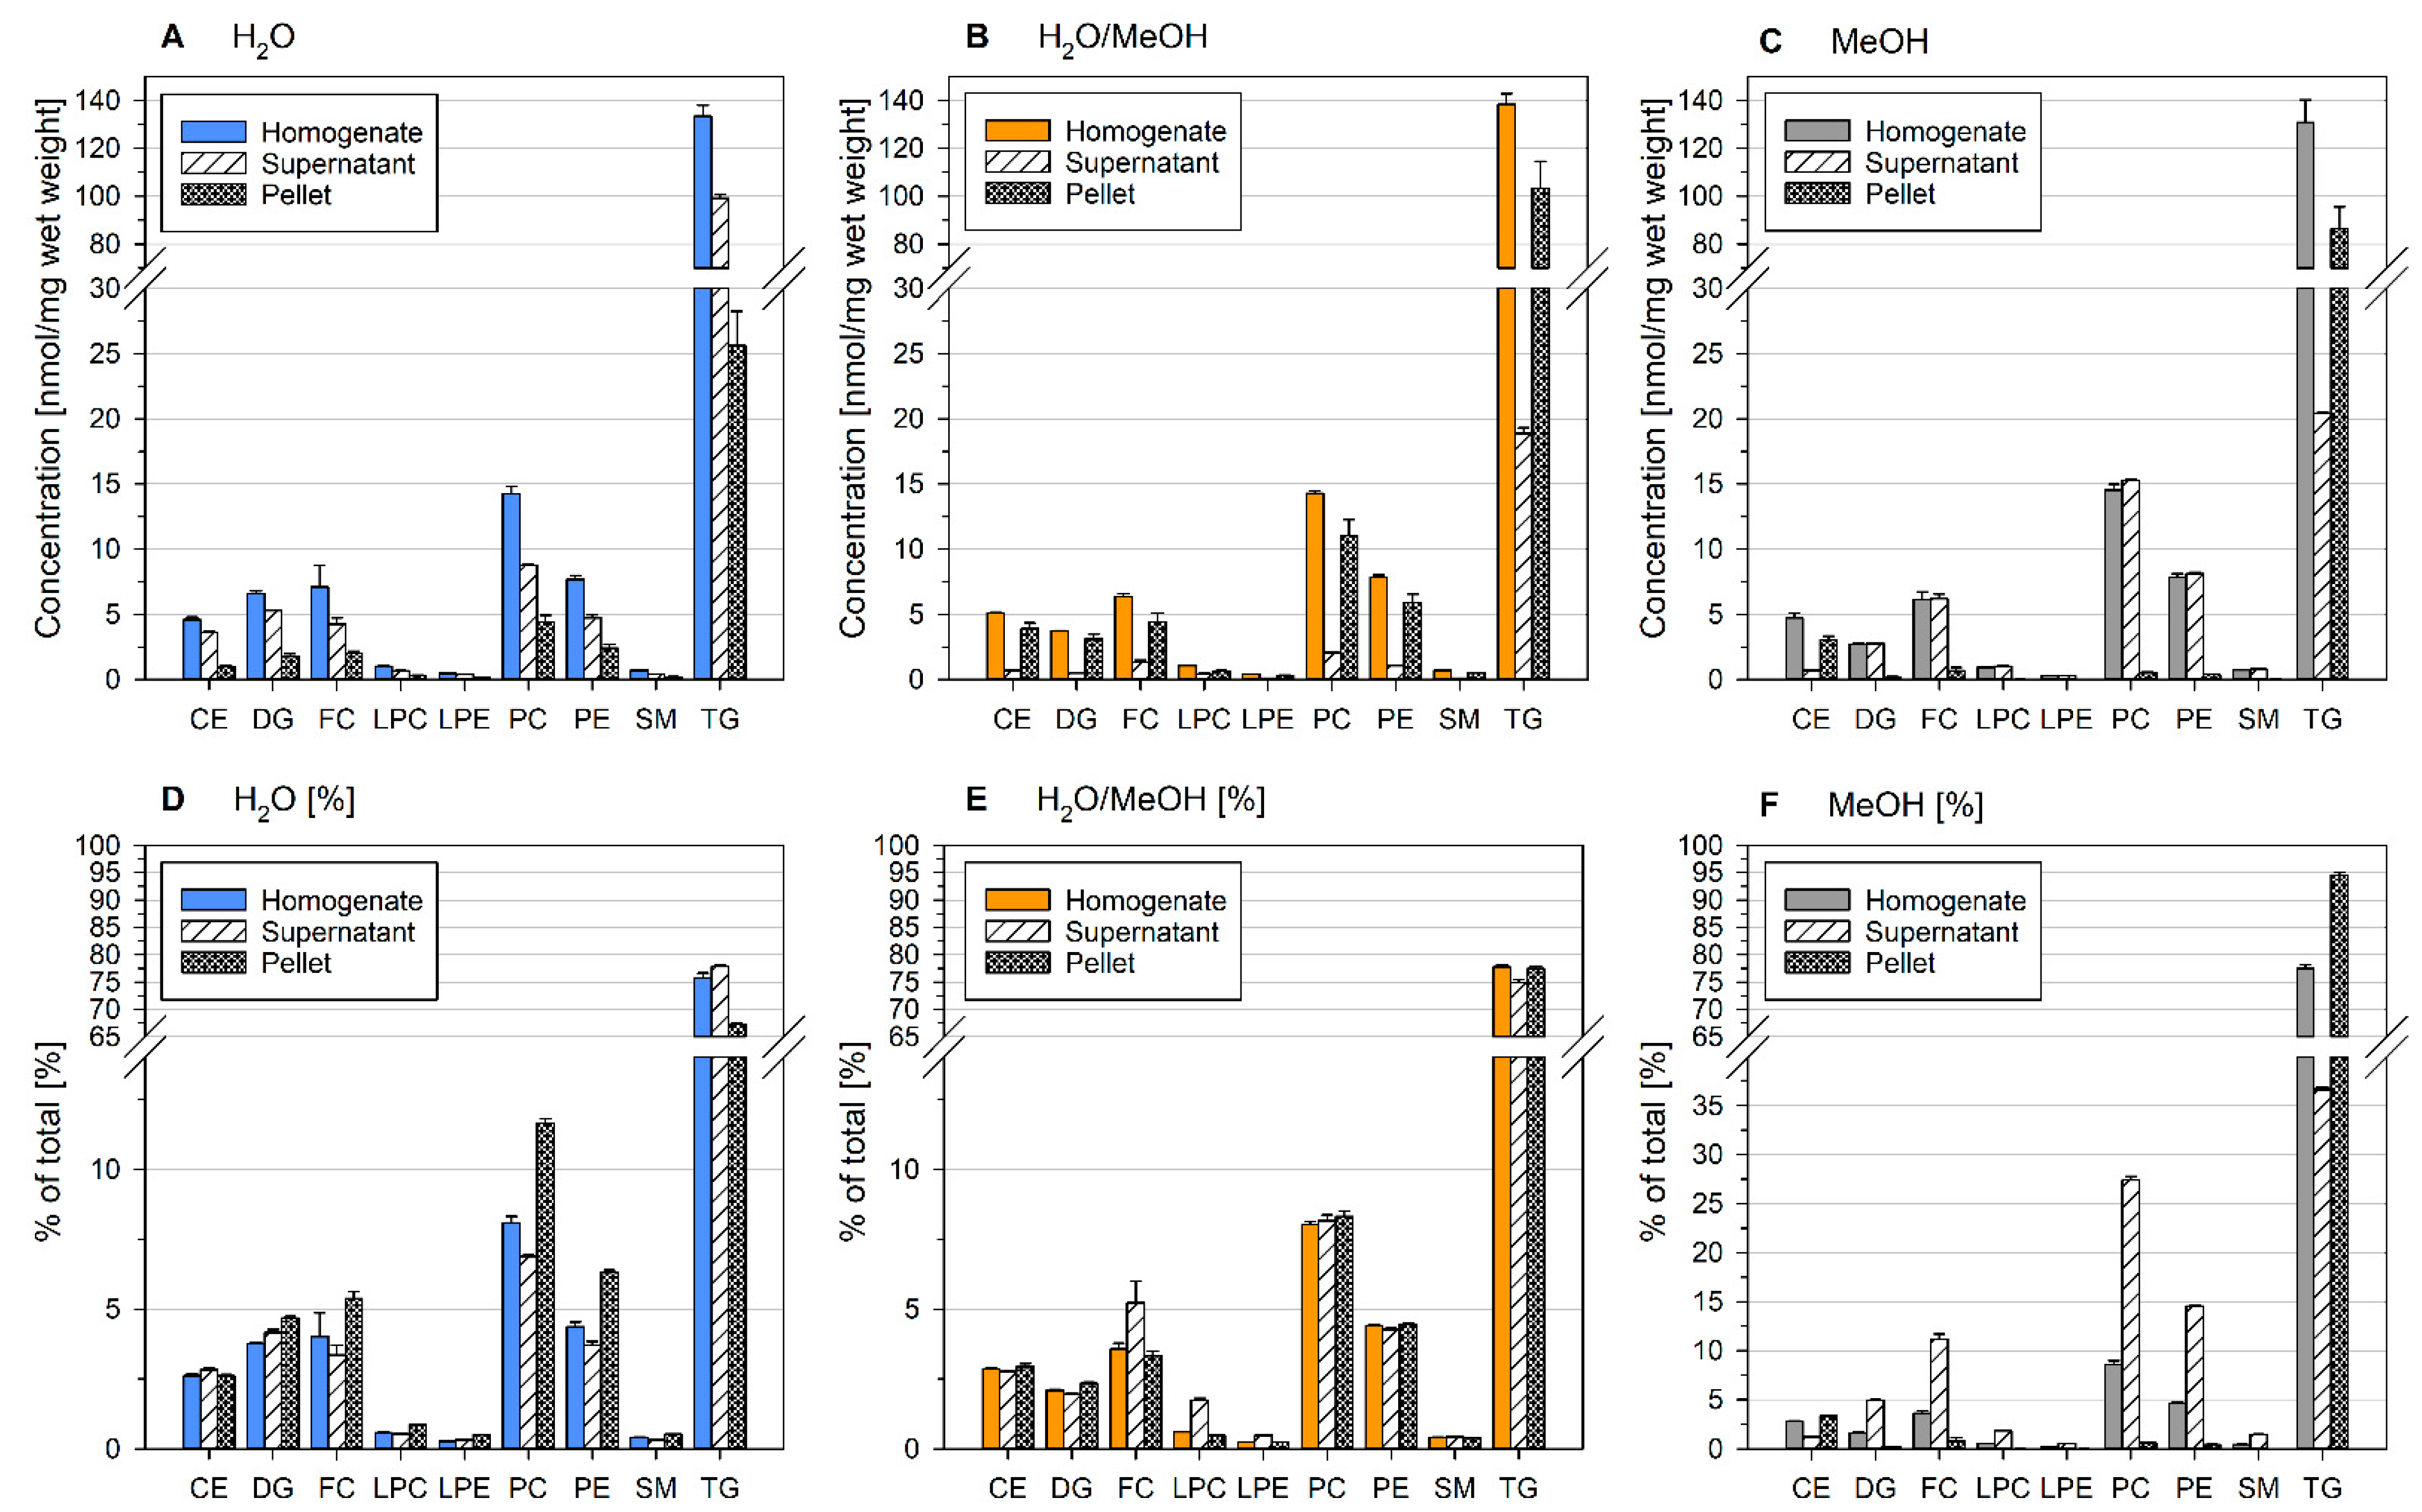
2.3. Lipid Content of Precipitates of Ground Liver Homogenates Depend on the Homogenization Solvent
2.4. Residual Lipid Content of Ground Liver Homogenates Depends on the Homogenization Solvent
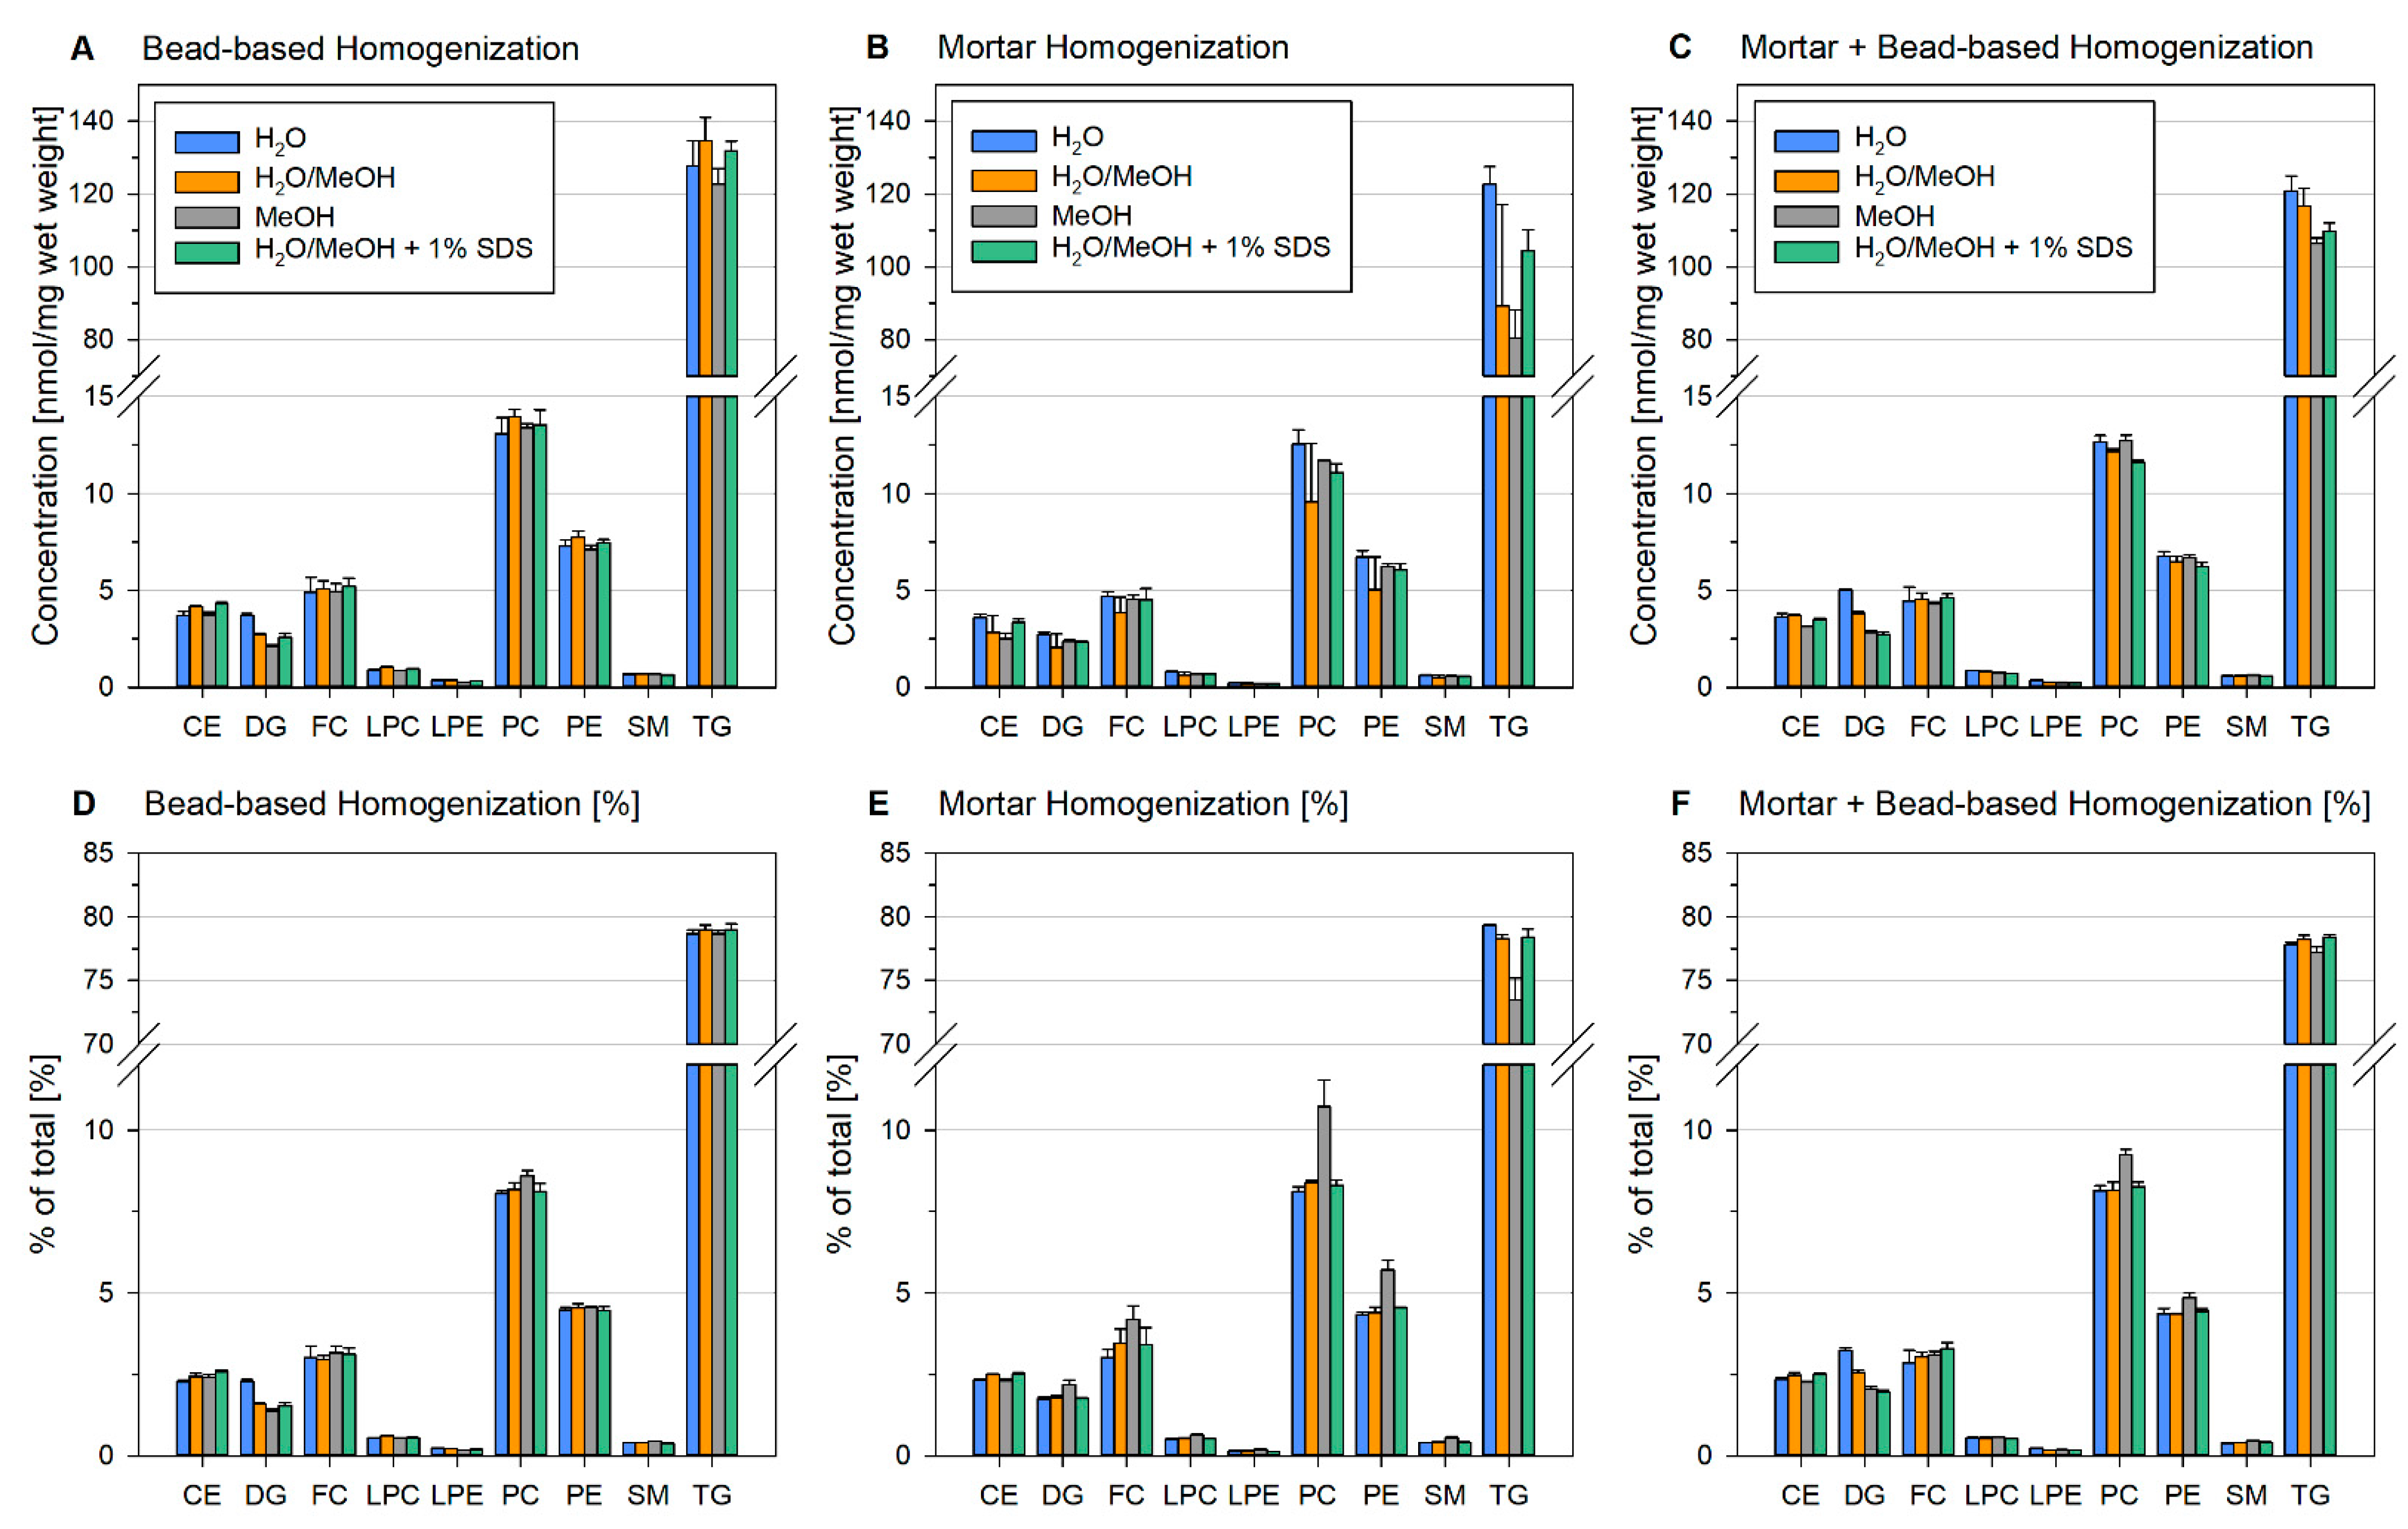
2.5. Bead-Based Homogenization Improves Lipid Recovery Due to Enhanced Sample Dispersion
2.6. Homogenization Solvent Influences Lipid Content of Sample Precipitates
3. Discussion
4. Materials and Methods
4.1. Chemicals and Lipid Standards
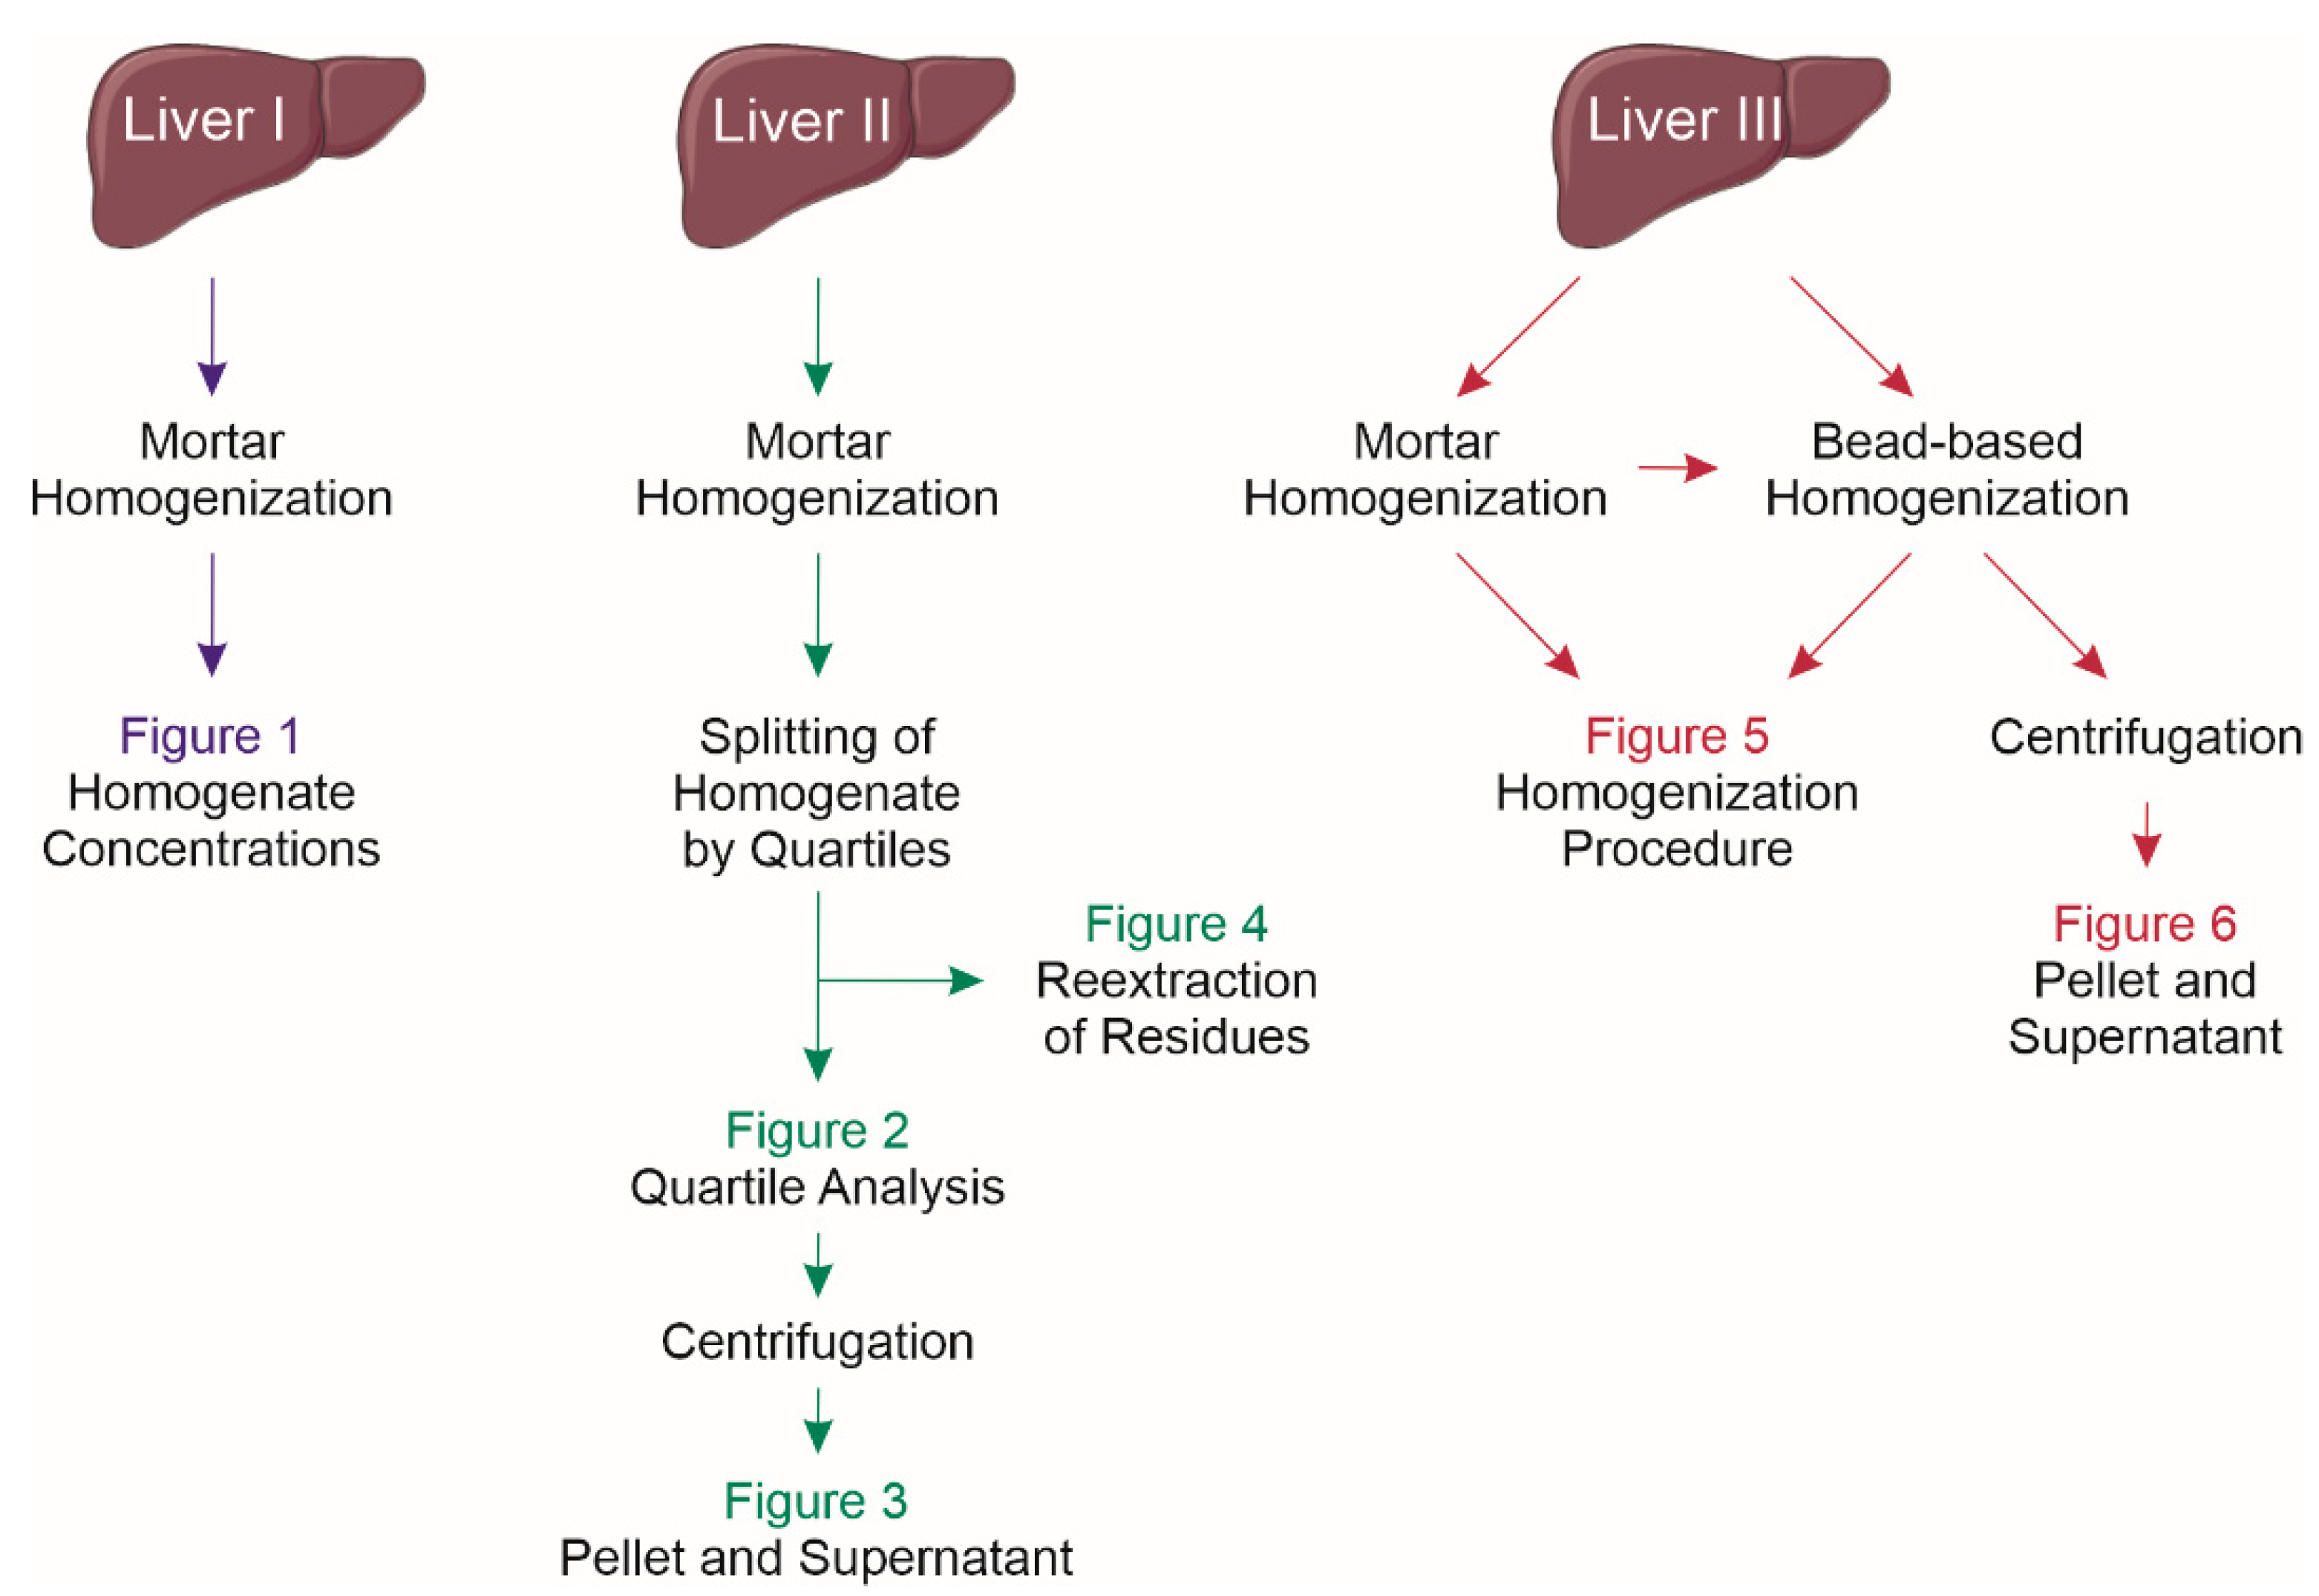
4.2. Biological Samples
4.3. Preparation of Tissue Homogenates
4.3.1. Mortar Homogenization
4.3.2. Bead-Based Homogenization
4.4. Experimental Design
4.5. Lipid Extraction
4.6. Direct Flow Injection High Resolution MS
Supplementary Materials
Author Contributions
Funding
Institutional Review Board Statement
Informed Consent Statement
Data Availability Statement
Acknowledgments
Conflicts of Interest
References
- Blanksby, S.J.; Mitchell, T.W. Advances in mass spectrometry for lipidomics. Annu. Rev. Anal. Chem. 2010, 3, 433–465. [Google Scholar] [CrossRef] [PubMed]
- Han, X.; Yang, K.; Gross, R.W. Multi-dimensional mass spectrometry-based shotgun lipidomics and novel strategies for lipidomic analyses. Mass Spectrom. Rev. 2012, 31, 134–178. [Google Scholar] [CrossRef]
- Rustam, Y.H.; Reid, G.E. Analytical Challenges and Recent Advances in Mass Spectrometry Based Lipidomics. Anal. Chem. 2018, 90, 374–397. [Google Scholar] [CrossRef] [PubMed]
- Züllig, T.; Trötzmüller, M.; Köfeler, H.C. Lipidomics from sample preparation to data analysis: A primer. Anal. Bioanal. Chem. 2020, 412, 2191–2209. [Google Scholar] [CrossRef] [PubMed]
- Holcapek, M.; Liebisch, G.; Ekroos, K. Lipidomic Analysis. Anal. Chem. 2018, 90, 4249–4257. [Google Scholar] [CrossRef]
- Liebisch, G.; Ekroos, K.; Hermansson, M.; Ejsing, C.S. Reporting of lipidomics data should be standardized. Biochim. Biophys. Acta 2017, 1862, 747–751. [Google Scholar] [CrossRef] [PubMed]
- Liebisch, G.; Ahrends, R.; Arita, M.; Arita, M.; Bowden, J.A.; Ejsing, C.S.; Griffiths, W.J.; Holcapek, M.; Köfeler, H.C.; Mitchell, T.W.; et al. Lipidomics needs more standardization. Nat. Metab. 2019, 1, 745–747. [Google Scholar]
- Murphy, S.A.; Nicolaou, A. Lipidomics applications in health, disease and nutrition research. Mol. Nutr. Food Res. 2013, 57, 1336–1346. [Google Scholar] [CrossRef]
- Ulmer, C.Z.; Koelmel, J.P.; Jones, C.M.; Garrett, T.J.; Aristizabal-Henao, J.J.; Vesper, H.W.; Bowden, J.A. A Review of Efforts to Improve Lipid Stability during Sample Preparation and Standardization Efforts to Ensure Accuracy in the Reporting of Lipid Measurements. Lipids 2020. [Google Scholar] [CrossRef]
- Naz, S.; Moreira dos Santos, D.C.; Garcia, A.; Barbas, C. Analytical protocols based on LC-MS, GC-MS and CE-MS for nontargeted metabolomics of biological tissues. Bioanalysis 2014, 6, 1657–1677. [Google Scholar] [CrossRef]
- Haberl, E.M.; Pohl, R.; Rein-Fischboeck, L.; Höring, M.; Krautbauer, S.; Liebisch, G.; Buechler, C. Hepatic lipid profile in mice fed a choline-deficient, low-methionine diet resembles human non-alcoholic fatty liver disease. Lipids Health Dis. 2020, 19, 250. [Google Scholar] [CrossRef]
- Dubacq, S. Performing efficient sample preparation with hard tumor tissue: Precellys® bead-beating homogenizer solution. Nat. Methods 2016, 13, i–iii. [Google Scholar] [CrossRef]
- Sprenger, R.R.; Hermansson, M.; Neess, D.; Becciolini, L.S.; Sørensen, S.B.; Fagerberg, R.; Ecker, J.; Liebisch, G.; Jensen, O.N.; Vance, D.E.; et al. Lipid molecular timeline profiling reveals diurnal crosstalk between the liver and circulation. Cell Rep. 2021, 34, 108710. [Google Scholar] [CrossRef]
- Ulmer, C.Z.; Patterson, R.E.; Koelmel, J.P.; Garrett, T.J.; Yost, R.A. A Robust Lipidomics Workflow for Mammalian Cells, Plasma, and Tissue Using Liquid-Chromatography High-Resolution Tandem Mass Spectrometry. Methods Mol. Biol. 2017, 1609, 91–106. [Google Scholar] [CrossRef] [PubMed]
- Kirkwood, J.S.; Maier, C.; Stevens, J.F. Simultaneous, untargeted metabolic profiling of polar and nonpolar metabolites by LC-Q-TOF mass spectrometry. Curr. Protoc. Toxicol. 2013, 4, 39. [Google Scholar] [CrossRef]
- Liebisch, G.; Plagge, J.; Höring, M.; Seeliger, C.; Ecker, J. The effect of gut microbiota on the intestinal lipidome of mice. Int. J. Med Microbiol. 2021, 311, 151488. [Google Scholar] [CrossRef] [PubMed]
- Hall, Z.; Bond, N.J.; Ashmore, T.; Sanders, F.; Ament, Z.; Wang, X.; Murray, A.J.; Bellafante, E.; Virtue, S.; Vidal-Puig, A.; et al. Lipid zonation and phospholipid remodeling in nonalcoholic fatty liver disease. Hepatology 2017, 65, 1165–1180. [Google Scholar] [CrossRef] [PubMed]
- Bligh, E.G.; Dyer, W.J. A rapid method of total lipid extraction and purification. Can. J. Biochem. Physiol. 1959, 37, 911–917. [Google Scholar] [CrossRef]
- Höring, M.; Ejsing, C.S.; Krautbauer, S.; Ertl, V.M.; Burkhardt, R.; Liebisch, G. Accurate quantification of lipid species affected by isobaric overlap in Fourier-Transform mass spectrometry. J. Lipid Res. 2021, 100050. [Google Scholar] [CrossRef] [PubMed]
- Lofgren, L.; Forsberg, G.B.; Stahlman, M. The BUME method: A new rapid and simple chloroform-free method for total lipid extraction of animal tissue. Sci. Rep. 2016, 6, 27688. [Google Scholar] [CrossRef]
- Krautbauer, S.; Blazquez, R.; Liebisch, G.; Höring, M.; Neubert, P.; Pukrop, T.; Burkhardt, R.; Sigruener, A. Application of Lipid Class Ratios for Sample Stability Monitoring-Evaluation of Murine Tissue Homogenates and SDS as a Stabilizer. Metabolites 2021, 11, 277. [Google Scholar] [CrossRef]
- Want, E.J.; Masson, P.; Michopoulos, F.; Wilson, I.D.; Theodoridis, G.; Plumb, R.S.; Shockcor, J.; Loftus, N.; Holmes, E.; Nicholson, J.K. Global metabolic profiling of animal and human tissues via UPLC-MS. Nat. Protoc. 2013, 8, 17–32. [Google Scholar] [CrossRef] [PubMed]
- Koelmel, J.P.; Jones, C.M.; Ulmer, C.Z.; Garrett, T.J.; Yost, R.A.; Schock, T.B.; Bowden, J.A. Examining heat treatment for stabilization of the lipidome. Bioanalysis 2018. [Google Scholar] [CrossRef] [PubMed]
- Höring, M.; Ejsing, C.S.; Hermansson, M.; Liebisch, G. Quantification of Cholesterol and Cholesteryl Ester by Direct Flow Injection High Resolution FTMS Utilizing Species-Specific Response Factors. Analytical. Chem. 2019. [Google Scholar] [CrossRef] [PubMed]
- Liebisch, G.; Fahy, E.; Aoki, J.; Dennis, E.A.; Durand, T.; Ejsing, C.S.; Fedorova, M.; Feussner, I.; Griffiths, W.J.; Kofeler, H.; et al. Update on LIPID MAPS classification, nomenclature, and shorthand notation for MS-derived lipid structures. J. Lipid Res. 2020, 61, 1539–1555. [Google Scholar] [CrossRef] [PubMed]


| Species | Molecular Weight | Stock Solution | Spiked Amount | |
|---|---|---|---|---|
| (g/mol) | (µg/mL) | (ng/sample) | (nmol/sample) | |
| CE 17:0 | 638.60 | 10 | 500 | 0.78 |
| CE 22:0 | 708.68 | 10 | 500 | 0.71 |
| Cer 32:1;O2 | 509.48 | 1 | 50 | 0.098 |
| Cer 35:1;O2 | 551.53 | 1 | 50 | 0.091 |
| DG 28:0 | 512.44 | 5 | 250 | 0.49 |
| DG 40:0 | 680.63 | 5 | 250 | 0.37 |
| [D7]FC | 393.40 | 75 | 3750 | 9.5 |
| LPC 13:0 | 453.29 | 1 | 50 | 0.11 |
| LPC 19:0 | 537.38 | 1 | 50 | 0.093 |
| LPE 13:0 | 411.24 | 1 | 50 | 0.12 |
| PC 28:0 | 677.50 | 25 | 1250 | 1.8 |
| PC 44:0 | 901.75 | 25 | 1250 | 1.4 |
| PE 28:0 | 635.45 | 10 | 500 | 0.79 |
| PE 40:0 | 803.64 | 10 | 500 | 0.62 |
| SM 30:1;O2 | 646.50 | 10 | 500 | 0.77 |
| TG 51:0 | 848.78 | 18 | 900 | 1.1 |
| TG 57:0 | 932.88 | 18 | 900 | 0.96 |
Publisher’s Note: MDPI stays neutral with regard to jurisdictional claims in published maps and institutional affiliations. |
© 2021 by the authors. Licensee MDPI, Basel, Switzerland. This article is an open access article distributed under the terms and conditions of the Creative Commons Attribution (CC BY) license (https://creativecommons.org/licenses/by/4.0/).
Share and Cite
Höring, M.; Krautbauer, S.; Hiltl, L.; Babl, V.; Sigruener, A.; Burkhardt, R.; Liebisch, G. Accurate Lipid Quantification of Tissue Homogenates Requires Suitable Sample Concentration, Solvent Composition, and Homogenization Procedure—A Case Study in Murine Liver. Metabolites 2021, 11, 365. https://doi.org/10.3390/metabo11060365
Höring M, Krautbauer S, Hiltl L, Babl V, Sigruener A, Burkhardt R, Liebisch G. Accurate Lipid Quantification of Tissue Homogenates Requires Suitable Sample Concentration, Solvent Composition, and Homogenization Procedure—A Case Study in Murine Liver. Metabolites. 2021; 11(6):365. https://doi.org/10.3390/metabo11060365
Chicago/Turabian StyleHöring, Marcus, Sabrina Krautbauer, Louisa Hiltl, Verena Babl, Alexander Sigruener, Ralph Burkhardt, and Gerhard Liebisch. 2021. "Accurate Lipid Quantification of Tissue Homogenates Requires Suitable Sample Concentration, Solvent Composition, and Homogenization Procedure—A Case Study in Murine Liver" Metabolites 11, no. 6: 365. https://doi.org/10.3390/metabo11060365
APA StyleHöring, M., Krautbauer, S., Hiltl, L., Babl, V., Sigruener, A., Burkhardt, R., & Liebisch, G. (2021). Accurate Lipid Quantification of Tissue Homogenates Requires Suitable Sample Concentration, Solvent Composition, and Homogenization Procedure—A Case Study in Murine Liver. Metabolites, 11(6), 365. https://doi.org/10.3390/metabo11060365