Gas Chromatography–Mass Spectrometry-Based Metabolomic Analysis of Wagyu and Holstein Beef


Abstract
1. Introduction
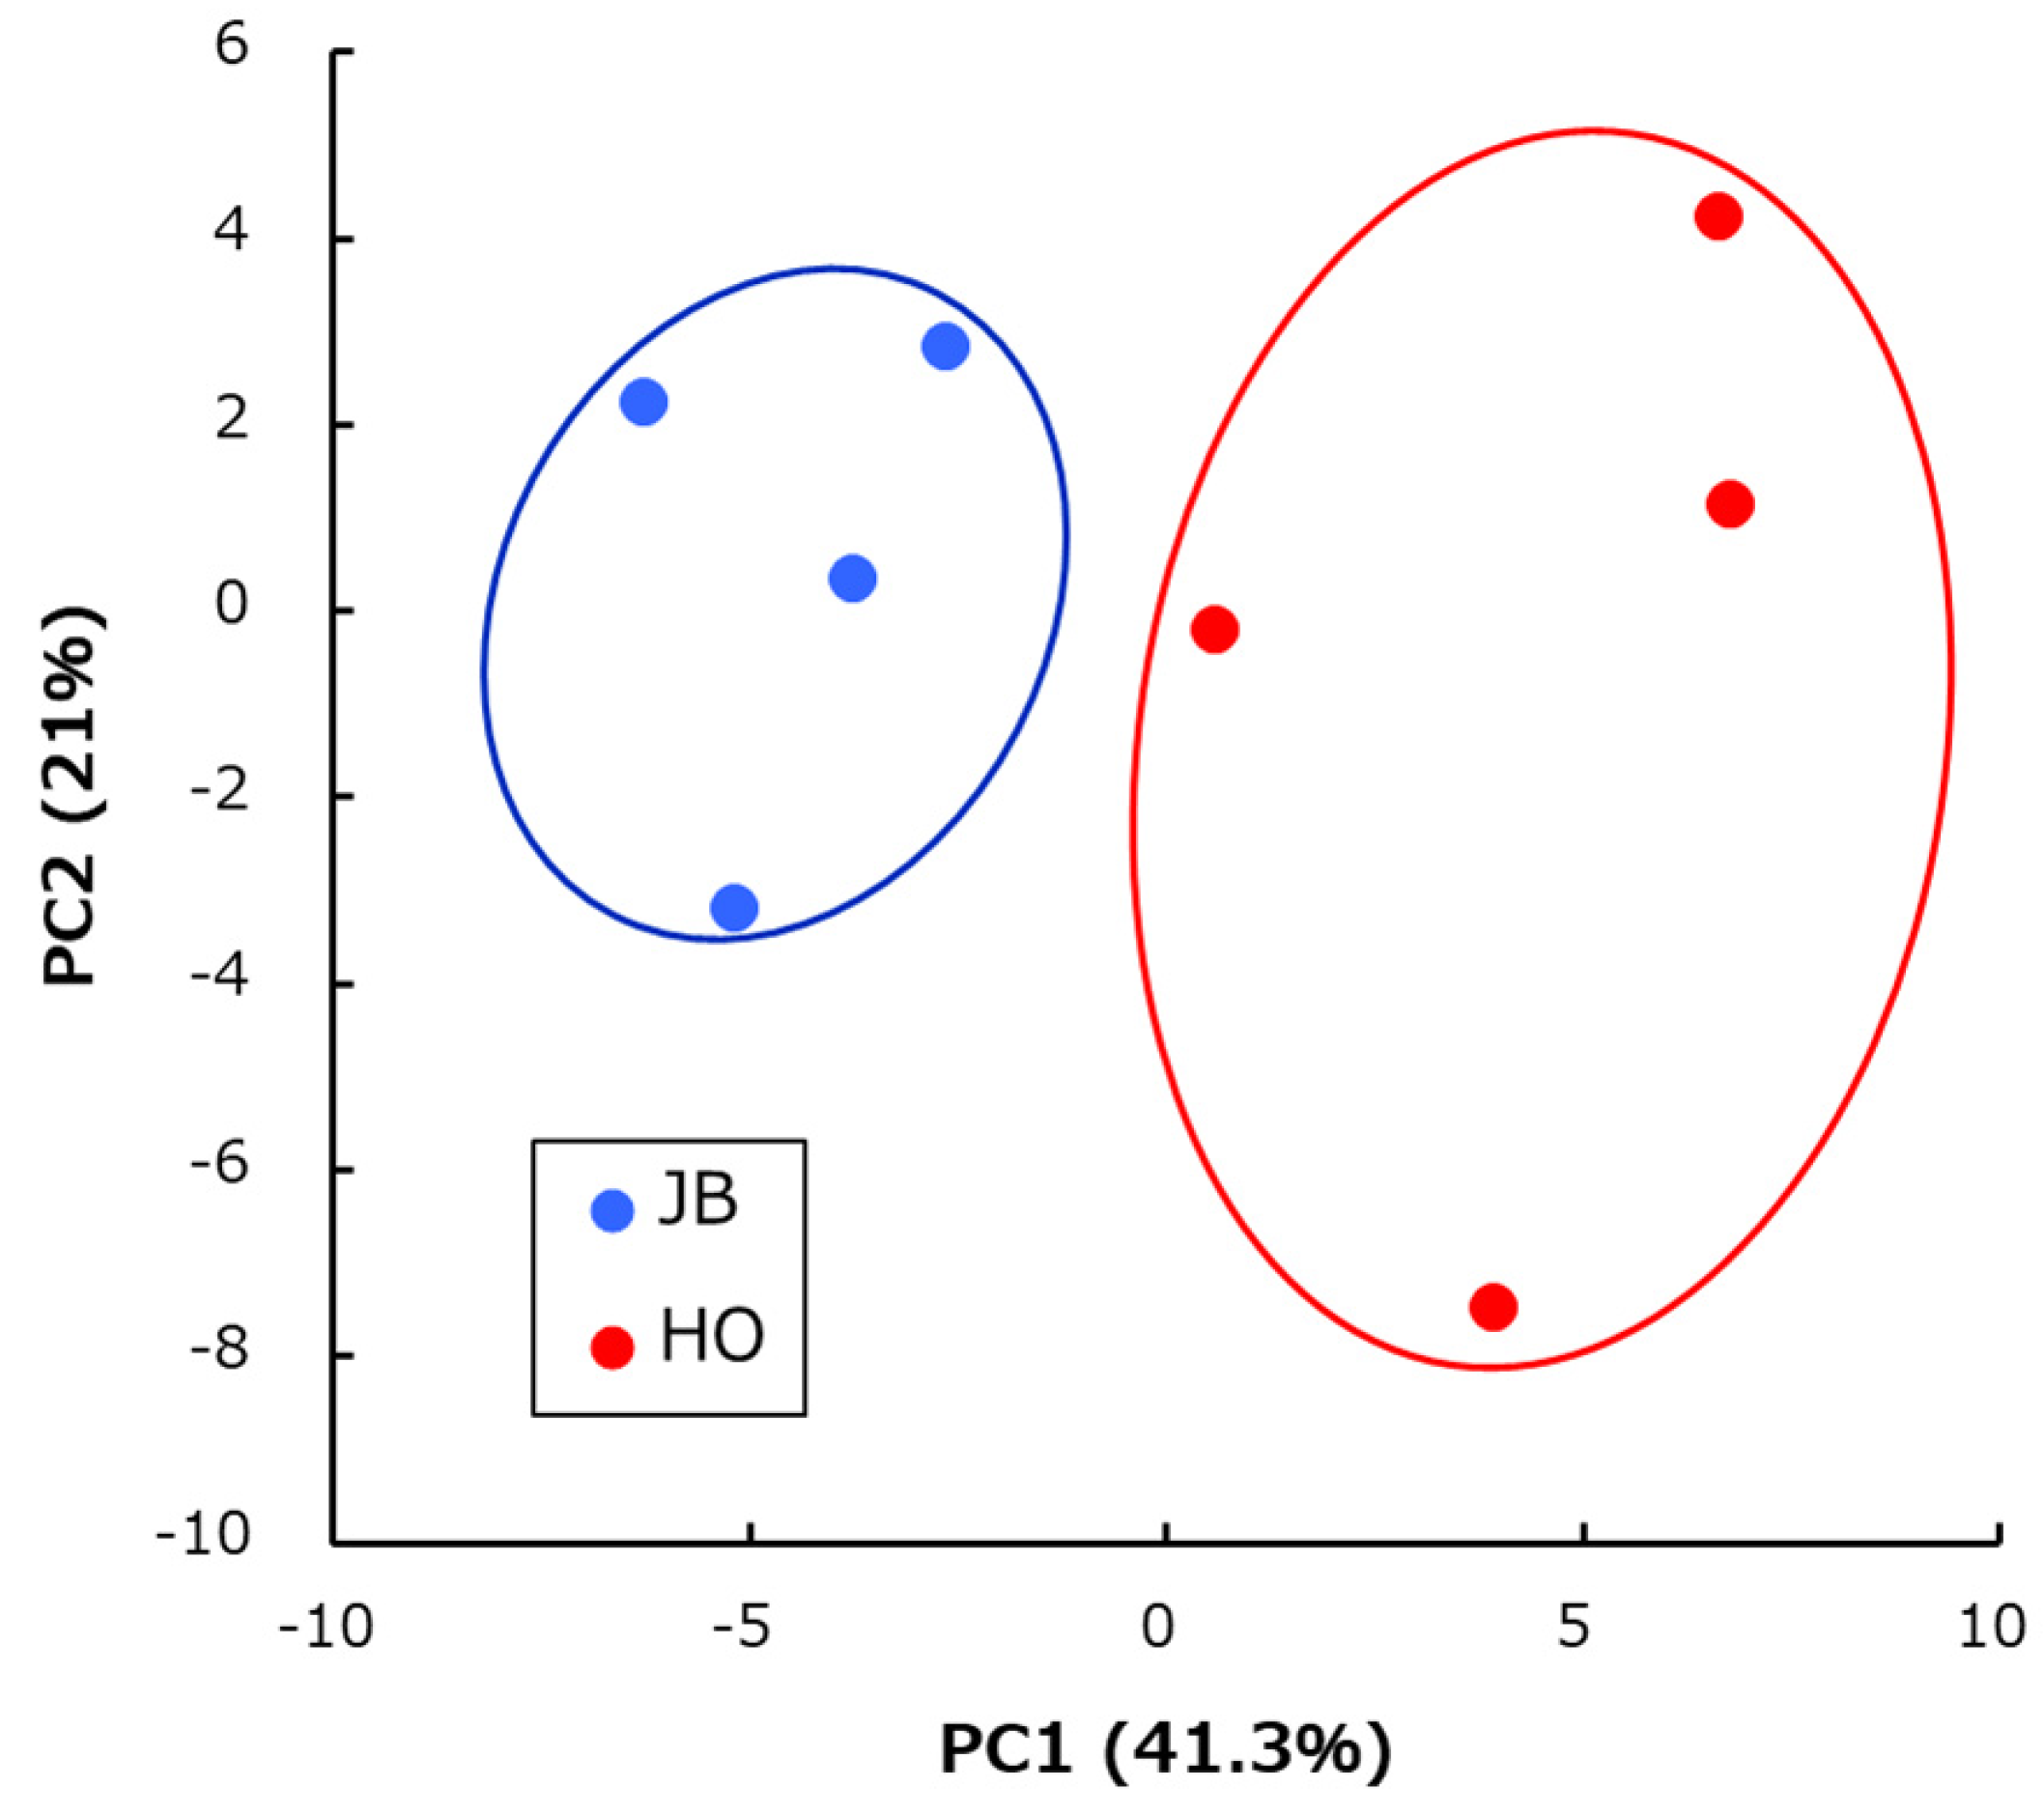
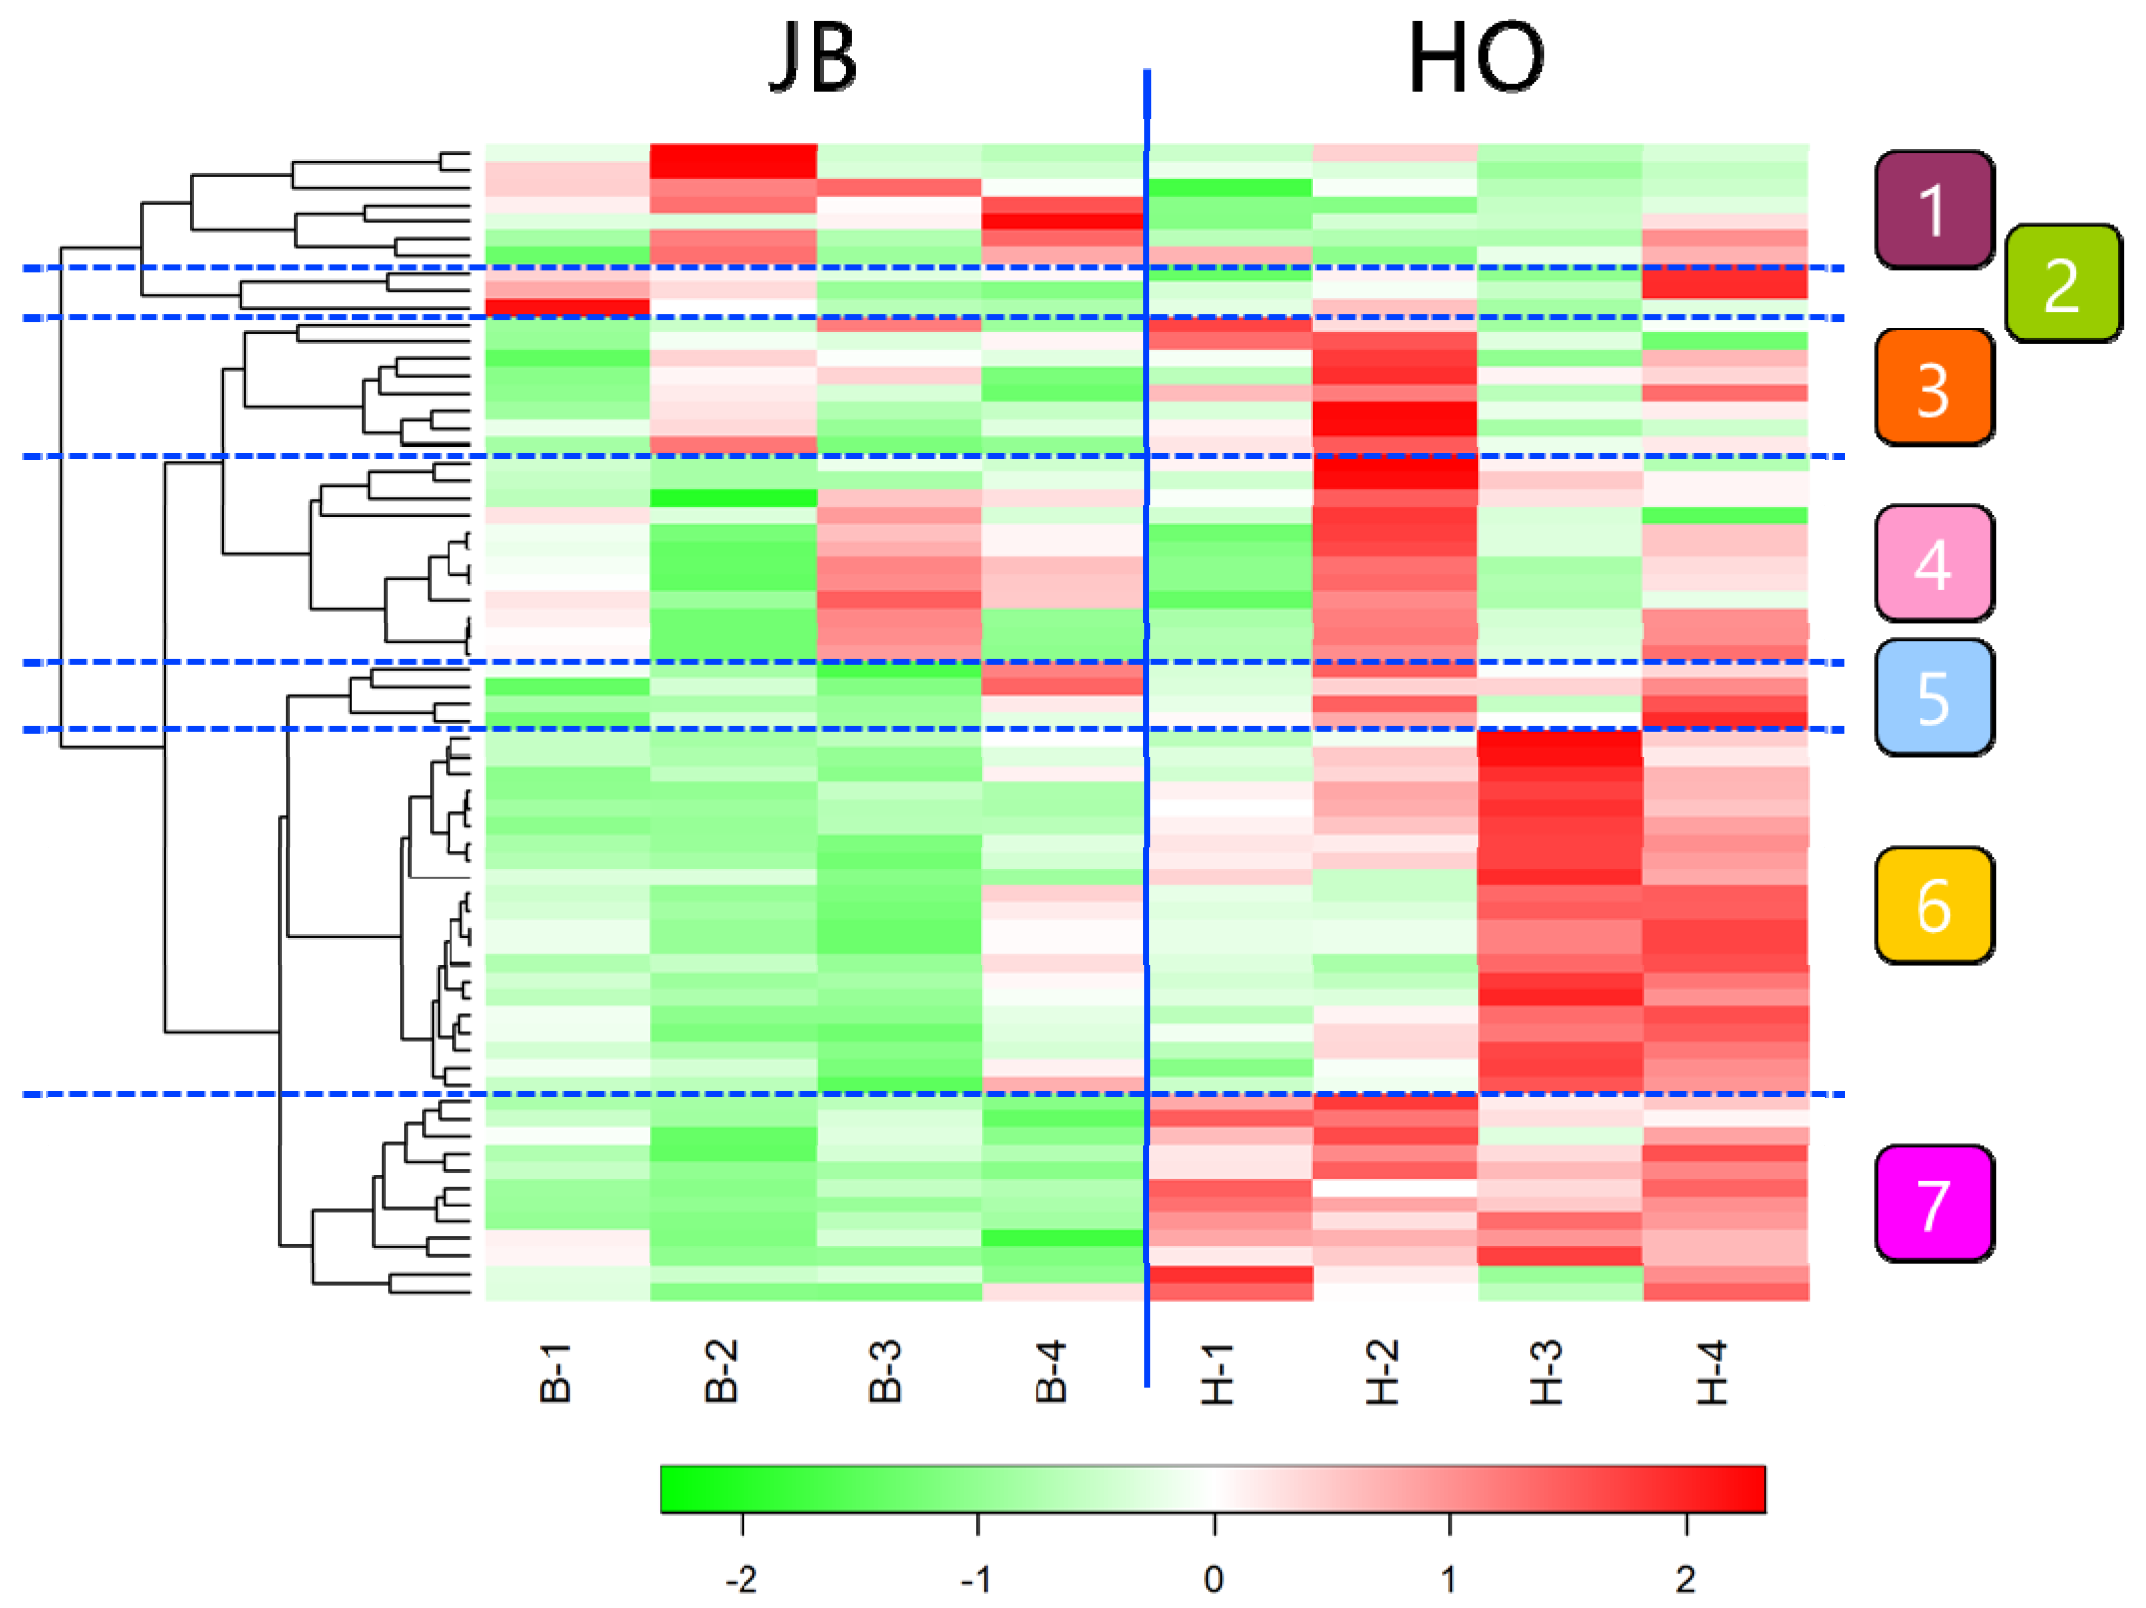
2. Results
3. Discussion
4. Materials and Methods
4.1. Animals
4.2. GC-MS Analysis
4.3. Statistical Analysis
Supplementary Materials
Author Contributions
Funding
Acknowledgments
Conflicts of Interest
References
- Takahashi, K.; Kohno, H. Different polor metabolites and protein profiles between high- and low-quality Japanese Ginjo sake. PLoS ONE 2016, 11, e0150524. [Google Scholar] [CrossRef] [PubMed]
- Sugimoto, M.; Goto, H.; Otomo, K.; Ito, M.; Onuma, H.; Suzuki, A.; Sugawara, M.; Abe, S.; Tomita, M.; Soga, T. Metabolomic profiles and sensory attributes of edamame under various storage duration and temperature conditions. J. Agric. Food Chem. 2010, 58, 8418–8425. [Google Scholar] [CrossRef] [PubMed]
- Malmendal, A.; Amoresano, C.; Trotta, R.; Lauri, I.; De Tito, S.; Novellino, E.; Randazzo, A. NMR spectrometers as “magic tongues”: Prediction of sensory descriptors in canned Tomatos. J. Agric. Food Chem. 2011, 59, 10831–10838. [Google Scholar] [CrossRef] [PubMed]
- Sugimoto, M.; Obiya, S.; Kaneko, M.; Enomoto, A.; Honma, M.; Wakayama, M.; Soga, T.; Tomita, M. Metabolic profiling as a possible reverse engineering tool for estimating processing conditions of dry-cured hams. J. Agric. Food Chem. 2017, 65, 402–410. [Google Scholar] [CrossRef] [PubMed]
- Muroya, S.; Oe, M.; Nakajima, I.; Ojima, K.; Chikuni, K. CE-TOFMS-based metabolomic profiling revealed characteristic metabolic pathways in postmortem porcine fast and slow type muscles. Meat Sci. 2014, 98, 726–735. [Google Scholar] [CrossRef] [PubMed]
- Straadt, I.K.; Aaslyng, M.D.; Bertram, H.C. An NMR-based metabolomics study of pork from different crossbreeds and relation to sensory perception. Meat Sci. 2014, 96, 719–728. [Google Scholar] [CrossRef] [PubMed]
- Jung, Y.; Lee, J.; Kwon, J.; Lee, K.S.; Ryu, D.H.; Hwang, G.S. Discrimination of the geographical origin of beef by H NMR-based metabolomics. J. Agric. Food Chem. 2010, 58, 10458–10466. [Google Scholar] [CrossRef]
- Ritota, M.; Casciani, L.; Failla, S.; Valentin, M. HRMAS-NMR spectroscopy and multivariate analysis meat characterization. Meat Sci. 2012, 92, 754–761. [Google Scholar] [CrossRef]
- Ueda, S.; Iwamoto, E.; Kato, Y.; Shinohara, M.; Shirai, Y.; Yamanoue, M. Comparative metabolomics of Japanese Black cattle beef and other meats using gas chromatography-mass spectrometry. Biosci. Biotechnol. Biochem. 2019, 83, 137–147. [Google Scholar] [CrossRef]
- Argyri, A.A.; Mallouchos, A.; Panagou, E.Z.; Nychas, G.J.E. The dynamics of the HS/SPME-GC-MS as a tool to assess the spoilage of minced beef stored under different packaging and temperature conditions. Int. J. Food Microbiol. 2015, 193, 51–58. [Google Scholar] [CrossRef]
- Muroya, S.; Oe, M.; Ojima, K.; Watanabe, A. Metabolomic approach to key metabolites characterizing postmortem aged loin muscle of Japanese Black (Wagyu) cattle. Asian-Australas. J. Anim. Sci. 2019, 32, 1172–1185. [Google Scholar] [CrossRef] [PubMed]
- Zembayashi, M.; Lunt, D.K. Distribution of intramuscular lipid throughout M. longissimus thoracis et lumborum in Japanese Black, Japanese Shorthorn, Holstein and Japanese Black crossbreds. Meat Sci. 1995, 211–216. [Google Scholar] [CrossRef]
- Motoyama, M.; Sasaki, K.; Watanabe, A. Wagyu and the factors contributing to its beef quality: A Japanese industry overview. Meat Sci. 2016, 120, 10–18. [Google Scholar] [CrossRef] [PubMed]
- Corbin, C.H.; O’Quinn, T.G.; Garmyn, A.J.; Legato, J.F.; Hunt, M.R.; Dinh, T.T.N.; Rathmann, R.J.; Brooks, J.C.; Miller, M.F. Sensory evaluation of tender beef strip loin steaks of varying marbling levels and quality treatments. Meat Sci. 2015, 100, 24–31. [Google Scholar] [CrossRef] [PubMed]
- Sasaki, K.; Ooi, M.; Nagura, N.; Motoyama, M.; Narita, T.; Oe, M.; Nakajima, I.; Tatsuro, H.; Ojima, K.; Kobayashi, M.; et al. Classification and characterization of Japanese consumer’s beef preferences by external preference mapping. J. Sci. Food. Agric. 2017, 97, 3453–3462. [Google Scholar] [CrossRef]
- Watanabe, G.; Motoyama, M.; Orita, K.; Takita, K.; Aonuma, T.; Nakajima, I.; Tajima, A.; Abe, A.; Sasaki, K. Assessment of the dynamics of sensory perception of Wagyu beef strip loin prepared with different cooking methods and fattening periods using the temporal dominance of sensations. Food Sci. Nutr. 2019, 7, 3538–3548. [Google Scholar] [CrossRef]
- Matsuishi, M.; Fujimori, M.; Okitani, A. Wagyu beef aroma in Wagyu (Japanese Black Cattle) beef preferred by the Japanese over imported beef. Anim. Sci. J. 2001, 72, 498–504. [Google Scholar] [CrossRef]
- Matsuishi, M.; Kume, J.; Itou, Y.; Takahashi, M.; Arai, M.; Nagatomi, H.; Watanabe, K.; Hayase, F.; Okitani, A. Aroma components of Wagyu beef and imported beef. Nihon Chikusan Gakkaiho 2004, 75, 409–415. [Google Scholar] [CrossRef]
- Inagaki, S.; Amano, Y.; Kumazawa, K. Identification and characterization of volatile components causing the characteristics flavor of Wagyu beef (Japanese Black cattle). J. Agric. Food. Chem. 2017, 65, 8691–8695. [Google Scholar] [CrossRef]
- Matsuzaki, M.; Takizawa, S.; Ogawa, M. Plasma insulin metabolite concentrations and carcass characteristics of Japanese Black, Japanese Brown, and Holstein steers. J. Anim. Sci. 1997, 75, 3287–3293. [Google Scholar] [CrossRef]
- Yamada, T.; Kawakami, S.; Nakanishi, N. Expression of adipogenic transcription factors in adipose tissue of fattening Wagyu and Holstein steers. Meat Sci. 2009, 81, 86–92. [Google Scholar] [CrossRef] [PubMed]
- Kerth, C.R.; Miller, R.K. Beef flavor: A review from chemistry to consumer. J. Sci. Food Agric. 2015, 95, 2783–2798. [Google Scholar] [CrossRef] [PubMed]
- Khan, M.I.; Jo, C.; Tariq, M.R. Meat flavor precursors and factors influencing flavor precursors-A systematic review. Meat Sci. 2015, 110, 278–284. [Google Scholar] [CrossRef] [PubMed]
- Kawai, M.; Sekine-Hayakawa, Y.; Okiyama, A.; Ninomiya, Y. Gustatory sensation of L- and D- amino acids in humans. Amino Acids. 2012, 43, 2349–2358. [Google Scholar] [CrossRef] [PubMed]
- Tuoria, H.; Sommardahl, C.; Hyvönen, L.; Leporanta, K.; Merimma, P. Does fat affect the timing of flavor perception? a case study with yoghurt. Food Qual. Pref. 1995, 6, 55–58. [Google Scholar] [CrossRef]
- Metcalf, K.L.; Vickers, Z.M. Taste intensities of oil-in-water emulsions with varying fat content. J. Sens. Stud. 2002, 17, 379–390. [Google Scholar] [CrossRef]
- Kearsley, M.W.; Dziedzic, S.Z.; Birch, G.G.; Smith, P.D. The production and properties of glucose syrups III. Sweetness of glucose syrups and related carbohydrates. Starch 1980, 32, 244–247. [Google Scholar] [CrossRef]
- Birch, G.G.; Munton, S.L. Evidence for constant number of available sweet receptor sites at threshold concentration of sugars. Experientia 1981, 37, 839–840. [Google Scholar] [CrossRef]
- Bouton, P.E.; Ford, P.V.; Harris, P.V.; Shorthose, W.R.; Ratcliff, D.; Morgan, J.H.L. Influence of animal age on the tenderness of beef: Muscle differences. Meat Sci. 1978, 2, 301–311. [Google Scholar] [CrossRef]
- Okumura, T.; Saito, K.; Sowa, T.; Sakuma, H.; Ohhashi, F.; Tameoka, N.; Hirayama, M.; Nakayama, S.; Sato, S.; Gogami, T.; et al. Changes in beef sensory traits as somatic-cell-cloned Japanese black steers increased in age from 20 to 30 months. Meat Sci. 2012, 90, 159–163. [Google Scholar] [CrossRef]


| Change | Relative Area | Comparative Analysis | |||||
|---|---|---|---|---|---|---|---|
| Compound Name | JB | Ho | JB/Ho | ||||
| Mean | S.D. | Mean | S.D. | Ratio | p-Value | ||
| Increase | Maltose | 7.1 × 10⁴ | 1.4 × 10⁴ | 4.0 × 10⁴ | 1.5 × 10⁴ | 1.8 | 0.022 * |
| Xylitol | 2.7 × 10⁴ | 4.4 × 10³ | 1.8 × 10⁴ | 2.3 × 10³ | 1.5 | 0.022 * | |
| Palmitic acid | 8.8 × 10⁴ | 3.6 × 10⁴ | 6.0 × 10⁴ | 8.8 × 10³ | 1.5 | 0.221 | |
| Stearic acid | 6.7 × 10⁴ | 4.0 × 10⁴ | 5.2 × 10⁴ | 1.3 × 10⁴ | 1.3 | 0.513 | |
| Ribose | 4.3 × 10⁵ | 1.2 × 10⁵ | 3.5 × 10⁵ | 5.6 × 10⁴ | 1.2 | 0.264 | |
| Sedoheptulose7-phosphate | 7.9 × 10⁴ | 3.2 × 10⁴ | 6.5 × 10⁴ | 2.3 × 10⁴ | 1.2 | 0.513 | |
| Mannose | 1.1 × 10⁶ | 2.7 × 10⁵ | 8.9 × 10⁵ | 2.8 × 10⁵ | 1.2 | 0.406 | |
| Glycerol 3-phosphate | 2.4 × 10⁴ | 7.9 × 10³ | 2.1 × 10⁴ | 3.3 × 10³ | 1.1 | 0.623 | |
| Decrease | Glycine | 1.6 × 10⁶ | 1.1 × 10⁵ | 2.6 × 10⁶ | 2.4 × 10⁵ | 0.6 | 0.001 ** |
| Ornithine | 3.9 × 10⁴ | 6.3 × 10³ | 6.7 × 10⁴ | 2.3 × 10⁴ | 0.6 | 0.094 | |
| 5-Oxoproline | 9.2 × 10⁴ | 9.2 × 10³ | 1.7 × 10⁵ | 3.2 × 10⁴ | 0.6 | 0.014 * | |
| Inosine monophosphate | 1.8 × 10⁵ | 7.9 × 10⁴ | 3.3 × 10⁵ | 1.4 × 10⁴ | 0.5 | 0.030 * | |
| Uric acid | 1.1 × 10⁴ | 1.4 × 10³ | 2.2 × 10⁴ | 4.8 × 10³ | 0.5 | 0.014 * | |
| 2-Hydroxyglutaric acid | 5.8 × 10³ | 2.0 × 10³ | 1.3 × 10⁴ | 5.3 × 10³ | 0.5 | 0.075 | |
| Ribose 5-phosphate | 3.2 × 10⁴ | 5.4 × 10³ | 6.9 × 10⁴ | 1.2 × 10⁴ | 0.5 | 0.004 ** | |
| Glutamine | 3.5 × 10⁴ | 3.8 × 10³ | 9.8 × 10⁴ | 3.1 × 10⁴ | 0.4 | 0.026 * | |
© 2020 by the authors. Licensee MDPI, Basel, Switzerland. This article is an open access article distributed under the terms and conditions of the Creative Commons Attribution (CC BY) license (http://creativecommons.org/licenses/by/4.0/).
Share and Cite
Yamada, T.; Kamiya, M.; Higuchi, M. Gas Chromatography–Mass Spectrometry-Based Metabolomic Analysis of Wagyu and Holstein Beef. Metabolites 2020, 10, 95. https://doi.org/10.3390/metabo10030095
Yamada T, Kamiya M, Higuchi M. Gas Chromatography–Mass Spectrometry-Based Metabolomic Analysis of Wagyu and Holstein Beef. Metabolites. 2020; 10(3):95. https://doi.org/10.3390/metabo10030095
Chicago/Turabian StyleYamada, Tomoya, Mituru Kamiya, and Mikito Higuchi. 2020. "Gas Chromatography–Mass Spectrometry-Based Metabolomic Analysis of Wagyu and Holstein Beef" Metabolites 10, no. 3: 95. https://doi.org/10.3390/metabo10030095
APA StyleYamada, T., Kamiya, M., & Higuchi, M. (2020). Gas Chromatography–Mass Spectrometry-Based Metabolomic Analysis of Wagyu and Holstein Beef. Metabolites, 10(3), 95. https://doi.org/10.3390/metabo10030095