Article

Evaluating Determinant Priority of License Fee in Biotech Industry

1
Graduate School of Health Science Business Convergence, College of Medicine, Chungbuk National University, 1 Chungdae-ro, Seowon-Gu, Cheongju, Chung-cheongbuk-do 28644, Korea
2
Department of Computer and Telecommunications Engineering, College of Science and Technology, Yonsei University, 1 Yonseidae-gil, Wonju, Gangwon-do 26492, Korea
*
Author to whom correspondence should be addressed.
J. Open Innov. Technol. Mark. Complex. 2018, 4(3), 30; https://doi.org/10.3390/joitmc4030030
Submission received: 11 June 2018 / Revised: 15 July 2018 / Accepted: 27 July 2018 / Published: 2 August 2018

Abstract

:
This research aimed to build a solid basis through analytic hierarchy process (AHP) analysis to develop a reliable and practical valuation model that reflects the characteristics of the biotech industry and propose a reference formula to estimate the license fee by drug class for potential business transactions. In this study, we reviewed 135 related studies and found 167 related determinants. We surveyed 25 or more specialists in the biopharmaceutical industries. The survey group consisted of National Research Institutes (‘Group 1’), Companies (‘Group 2’), and Government Agencies–Universities (‘Group 3’). The average of the total group and Group 3 showed the same tendency at a Level 3 ranking, where the priority in determining the license fee was arranged in the order of ‘the market factor, the technology factor, the financial factor, and the environmental factor’ in light of the factors, and ‘patent characteristics, licensee characteristics, and licensor characteristics’ for the characteristics. We noted that the patent characteristics were primarily significant in technology transactions and their contract fee in the groups (Total, Group 2 and Group 3), followed by licensee characteristics. In terms of the in-depth index, we noted that the development phase and attrition rate, intellectual property tradability, and licensee licensing experience, followed by quality of technology, were the most influential determinants.

1. Introduction

More than 1000 licensing deals have been recorded each year within the biotech industry since 2002 and global licensing activity has seen approximately 100 licensing deals in the TMT (technology, media and telecommunications) industry each year. We can see by the number of licensing transfers in the biotech industry that it is at least 10 times more active than other industries [1,2]. Drug development requires a long time (i.e., over 10 years) and over GBP 500 million from the initial concept to approval by the regulatory authorities. Therefore, drug development is a process requiring significant money and time, and may also be risky [3,4]. For this reason, licensing is regarded as a good strategy during development [5]; therefore more licensing transactions are generated compared to other industries [1,2], and valuation is used to calculate the transaction price for licensing or Merge and Acquisition (M&A) transactions [6]. Furthermore, royalties are recognized as one of the major revenue sources in the biotech industry, and licensing is recognized as a good exit strategy to overcome the economic crisis of biopharmaceutical companies.
The valuation for a drug under development is required for various purposes, such as licensing and M&A transactions. The prediction of the future value of the asset is useful and important to determine future economic action [7]. Two quantitative valuation approaches have been mainly used in the biotechnology sector: The discounted cash flow (DCF) method, which utilizes net present value (NPV) as the technology value before applying the technology factor; and, the real options method, which involves the concept of future opportunity cost for commercialization cost and term [8]. However, the DCF method often results in a negative value when applied to early-stage drugs. Meanwhile, the real options methodology is relatively complicated and theoretical, and thus has a lot of poor case studies and is not preferred by the new drug experts [3]. The real options methodology can be classified into four methods: The formula method, the finite differences method, the simulation method, and the tree method. The advantages and disadvantages of the four methods are as follows. The formula and finite differences methods are easy to use and can handle complex assumptions, but have the disadvantage of not being able to explain the estimation basis, as the calculation process is not transparent. The simulation method has the advantage of good risk measurement because it implements a number of simulations through random number generation to compensate for the uncertainty of value, but has the disadvantage that the process is time consuming and path dependent. The tree method makes it easy to understand and visualize what might happen in the marketplace, but it is difficult to estimate the cause as the link to the value driver is missing [6].
The risk-adjusted net present value (rNPV) method has emerged to overcome the disadvantages of the DCF and real options methodologies. The rNPV method is an NPV method that uses only the attrition rate as a discount rate for considering the risk at each development stage [9]. The attrition rates proposed by DiMasi [10] are used most often for valuation among technology traders in biotechnology and pharmaceutical companies. The recent study of Thomas et al. derived the attrition rate at each development stage for four drug types [11]. This study is believed to be helpful for enhancing the rNPV method as it can be applied by considering the drug type as well as the development phase. Currently, the rNPV method has been introduced to overcome the shortcomings of the DCF and the real options methods, which are mainly used as valuation methods in the biotech industry but are nonetheless limited in reflecting the characteristics of the biotech industry.
We conducted analytic hierarchy process (AHP) analysis to derive the priority of determinants affecting the license fee from the survey results of three groups and found that Group 1 and Group 2 were more concerned with the environmental factor than Group 3. In the case of Group 1, the market and financial factors of patent technology were more important than the technology factor. There was nothing related to the licensor among the determinants that make up the top five ranking in the level four ranking comparison, while the four related to the licensee.
This rest of this paper is organized as follows. In Section 2, we present a review of the preceding research. In Section 3, we introduce the AHP methodology, sample, and AHP Framework. Section 4 presents the findings of the AHP analysis and Section 5 provides our conclusions and implications. In Section 6, we provide the scope and limitations of our research. In Section 7, we provide topics for further research. We provide Appendix A, including tables and figures, for a clearer understanding of the conclusions and implications.

2. Review of Preceding Research

2.1. Technology Licensing Characteristics in Biotech Industry

The value of the global licensing market was estimated as USD 200 billion in 2011 [12]. Furthermore, licensing has been an integral part of commercial biotechnology since its inception [13]. Licensing deals between pharmaceutical companies and biotech/academia are active in the biotechnology area as drug development is a process requiring significant money and time, and may also be risky [8]. However, numerous patents still remain unlicensed [14] and many firms have difficulties in finding licensing partners [15,16]. There are many reasons to decide whether to sell or license a patent. The literature has commented on the need for a limited capacity to use the technology, the possibility to enter or expand into new geography and product markets, the lack of complementary assets, economic profit creation, and strategic motivational factors (such as suppression of entry) as the reasons for the decision to license or sell a patent [14,17,18,19,20,21,22].
Licensing is the process in which both parties wish to make an optimal deal by being paired with the best partner. Beyond the technical motives of a particular license agreement, the choice of licensing a patent may be a complex decision. Technical licensing involves the transfer of intellectual property (IP) between the IP owner (licensor) and buyer (licensee). The licensor aims to derive its value in the form of licensing revenue and is willing to license the technology due to a lack of intellectual, financial, or physical resources for commercialization [23].

2.2. Determinants Affecting Technology Licensing Fee

Reddy and Zhao [24] identified the factors influencing effective technology transfer from two perspectives: The technology provider (licensor) and technology consumer (licensee). Technology provider perspectives include ‘technology transfer experience, technology competition level, previous experiences’, and ‘efforts and R&D investment and technology adoption experience’ are presented as the technical consumer’s side in the study [24]. Paik confirmed that technology providers (licensors) and technology adopters (licensees) differ in factors that are important to technology transfer [25]. Past research has tended to concentrate only on the factors of one type of technology provider or technology consumer [26]
In the past, quantitative indicators of the number of patents have mainly been used to evaluate the value of patent information, but there has been a problem that attributes of individual patents have not been considered [27]. Sakakibara suggested that patent characteristics, such as the similarity between licensed patents and the core technology of a technology provider, the number of patents owned by a technology provider, and the number of patents applied by a technology consumer, are used as the determinants of the price of patent licensing [26] and several studies that suggested patent characteristics followed [25,28,29,30,31,32,33,34,35,36].
Relatively recently, environmental variables have been referred to as determinants affecting technology licensing fees. Several studies on environmental factors conducted since Sung have highlighted the importance of the business environment of the licensee’s market [25,28,29,30,32,33,34,35,37,38].

2.3. Developing Determinants of License Fee in Biotech Industry

There is a need for an objective and reliable new valuation methodology to overcome the current methodology, which generally produces negative values for early-stage drugs, and to better reflect the characteristics of the biotech industry. This study was conducted as a first step towards a new methodology. First, the variables affecting the license fee of biotechnology contracts were extracted from a literature review. To find factors that affected the amount of licensing paid for technology transfer in the biotech industry, we reviewed 135 related pieces of literature and derived 167 related determinants, and found that it was effective to classify the derived determinants as four factors: Technological factors, financial factors, market factors, and environmental factors.

2.3.1. Technological Factor

Several studies of technical factors conducted since Sung have suggested that factors, such as the technical life cycle and stability of patent rights, are among the major factors in estimating the running royalties of biopharmaceutical technology in licensing agreements [26,29,30,31,35,38,39,40]; Sung believed that licensees required technological differentiation in pursuing strategic business [41]. The study of Sung et al. added the quality of technology to the technology factor as the determinant affecting the value of the patent [40] and several studies have followed [8,23,28,42,43,44,45]. Sakakibara added the similarity between licensed patents and the core technology of the technology provider (i.e., the ratio of the number of a licensor’s patents in the same International Patent Classification (IPC) as the licensed patent to the total number of patents applied by a technology consumer), licensor patent stock (i.e., the number of patent applications by a licensor), and licensee patent stock as the determinants that affected the amount of licensing paid for technology transfer [26] and several studies have followed [19,29,32,35,39,46].

2.3.2. Financial Factor

Several studies on financial factors conducted [26,29,30,31,34,41,43] since Zaharoff have suggested that financial factors, such as profit margins, are a business factor involved in determining the value and royalty rate for biotechnology businesses [36]. Joo et al.’s study added the ease of exercising patent rights as a determinant affecting the value of the patent [30]. Svačina added the R&D costs of the licensor and licensee as factors affecting the value of intangibles [45] and several studies have followed [17,23,31,32,43,47,48]. Sakakibara added the sales per capital of the licensor and licensee as a size indicator among the determinants of the price of patent licensing [26] and several studies have followed [23,34,38].

2.3.3. Market Factor

Several studies on market factors conducted since Paik have suggested that market factors, such as the stage of development, experience of technology transfer, and marketability, are some of the major determinants affecting technology transfer in his AHP analysis [3,4,8,23,28,29,30,31,34,38,40,47,49,50,51,52]; Paik believed that the application of transferred technology could pioneer new markets for the licensee, or enhance the competitive edge of the licensee [30]. The study of Joo et al. suggested that the proportion of the patent protected technologies applied to the product (i.e., product sales technology weight) was one of the crucial factors of the IP valuation model for IP mortgage lending [30]. Eom added company age as the determinant of knowledge transfer [53].

2.3.4. Environmental Factor

Several works on environmental factors conducted since Sung have suggested that environmental factors, such as the business environment of a licensee’s market (i.e., the size of the target market, market compound annual growth rate (CAGR), and degree of competition), are among the major factors in determining the royalty rate [38] because if the business environment is favorably applied to licensees, high profits can be expected and will have a significant impact on royalty decisions [28,29,30,34]. The study of Fischer and Leidinge added the number of patented countries to the environment factor as the determinant affecting patent value [35] and several studies have since followed [32,33]. Paik added transaction type as the determinant affecting technology transfer [25] and another study followed [37]. Svačina added agreement type as the determinant affecting the price of intangible assets [45].
We identified determining factors affecting the license fee in biotech industry licensing from the literature review. We tried to classify many of these factors in a simpler form, where we found that the classified factors could be effectively expressed by two views of factors and characteristics in the form of the 3 × 4 matrix shown in Figure 1. The vertical axis was divided into three levels: Patent characteristics, licensor (technology provider) characteristics, and licensee (technology consumer) characteristics. The horizontal axis was divided into four columns: Technology factor, financial factor, market factor, and environmental factor.

3. Methodology

3.1. AHP Analysis Method

The AHP technique developed by Saaty can be applied not only to factors that can be quantified, but also to qualitative factors that are difficult to quantify in a rational and systematic manner in complex multi-criteria decision situations. AHP can be regarded as the most suitable analysis tool for analyzing the importance of multi-criteria decision-making factors [54,55]. AHP is a widely used method of making decisions based on a number of criteria that systematically scales the relative attractiveness of various alternatives in problem situations where there are multiple criteria. AHP has been adopted in many areas where it is necessary to make decisions because of its theoretical simplicity and wide applicability. This is useful for prioritizing multiple choices in situations where choosing the best option is complicated by conflicting criteria, imperfect information, or other forms of constraints in the resource approach [55].
AHP measures the weight of each element and generates a pairwise comparison matrix. A single normalized priority vector is computed from this diagonal matrix for each level of hierarchy using the mathematical method called the eigenvalue method. When using AHP, it is necessary to execute the decision-making structure in four stages: (1) The collection of information for evaluation by pairwise comparisons; (2) estimations of relative weights; (3) aggregations; and, (4) decisions on priority levels.
To reach the highest-rated goal, the priority in each hierarchy needs to be derived by comparing each pair of elements in the hierarchy. Upon completion of this analysis, an overall ranking of the composite weight and the alternatives is created. The aggregate importance generated by this process is the rating-based score for the alternatives under test. This is important when determining the priority of different alternatives.
To make our understanding easier in terms of weighting matrices, let us consider a pairwise comparison matrix, denoted A. The element at row i and column j in the pairwise comparison matrix A, a i j , is calculated from w i / w j ( i , j = 1 , , n ) where w 1 , w 2 , , w n are the weights of n elements, A1, A2, …, An. The next problem is to assign numerical weights w 1 , w 2 , , w n to n elements, c 1 , c 2 , , c n , that reflect the recoded decision. If A is a consistency matrix, then the relationship between weights w i and the judgments a i j are simply given by w i / w j = a i j (for i , j = 1 , 2 , , n ), as shown by Equation (1) below.
A = C 1 C 2 C 3 C n [ W 1 / W 1 W 1 / W 2 W 1 / W 3 W 1 / W n W 2 / W 1 W 2 / W 2 W 2 / W 3 W 2 / W n W 3 / W 1 W 3 / W 2 W 3 / W 3 W 3 / W n W n / W 1 W n / W 2 W n / W 3 W n / W n ]
The elements of matrix A are multiplied by the weight vector ( x ), yielding n x ; that is, ( A n I ) x = 0 , where x = ( w 1 , w 2 , , w n ) and n is an eigenvalue. Given that a i j denotes the subjective judgment of decision-makers concerning the comparison and evaluation with the actual value ( w i / w j ) having a certain degree of variation, A x = n x cannot be established. Therefore, Saaty [56] defines the largest eigenvalue, λ max , as follows:
λ max = j = 1 n a i j w j / w i .
If A is a consistency matrix, then eigenvector X can be computed using the following formula:
( A λ max I ) X = 0 .
Here, the reciprocal matrix A is n or more. Therefore, in consistent pairwise comparisons, it is the same as n. In order to verify the consistency of the comparison matrix, Saaty [57] proposed the use of the consistency index (CI) and the consistency ratio (CR). The CI and random index (RI) are defined as follows:
CI = ( λ max n ) / ( n 1 ) ,
CR = ( CI / RI ) × 100 % .
RI is the average consistency index generated from the inverse matrix created by the random setting of a value between one and nine. RI represents the allowable rate of consistency. To achieve the highest-rated goal, the priority in each hierarchy should be derived by comparing each pair of elements of the hierarchy. Once this analysis is complete, an overall prioritization of the compound weight calculations and alternatives should be performed. The integrated importance rates derived from this process becomes the rating-based points for the alternatives to be tested. This becomes very important in the process of completing priority ratings of different alternatives. For the statistical verification and analysis, we hereby chose an AHP decision-making program, referred to as Expert Choice 11.

3.2. Survey Sample

The AHP survey was distributed and gathered from 9 April to 16 April 2018. In selecting the experts for the surveys, we selected experts who had experience in technology valuation and technology trading of biotechnology, satisfying one of the following conditions: (1) Expert Forum member of KISTI (Korea Institute of Science and Technology Information) Technology Valuation LAB; (2) best specialist pool of KVA (Korea Valuation Association); and (3) specialist pool of KTTAA (Korea Technology Transfer Agents Association) with a technology transfer agent certificate. KISTI is a Korean government-funded research institute designed to maximize the efficiency of science and technology R&D and support high-tech R&D for researchers; KVA is the Korean branch of IACVS (International Valuers’ Association). KVA and KTTAA are nonprofit organizations under the MOTIE (Ministry of Trade, Industry and Energy) of Korea. We surveyed 32 experts who worked in one of a national research institutes, company, national agency, or university. With regards to national research institute employees, nine professionals from the KISTI (Korea Institute of Science and Technology Information), FACT (Foundation of Agri. Tech. Commercialization and Transfer), KIMST (Korea Institute of Marine Science and Technology Promotion), KITECH (Korea Institute of Industrial Technology), KRIBB (Korea Research Institute of Bioscience and Biotechnology), ETRI (Electronics and Telecommunications Research Institute), and SNUH BRI (Seoul National University Hospital Biomedical Research Institute) were selected as participants. For the firm sample, we chose eight professionals from the KVA (Korea Valuation Association), T-Value, the law firm Hanmaru, the Jidam IP Law Firm, Mirawiz, Techwith, Orum Therapeutics, and Bridge Biotherapeutics. Finally, for the national agency and university sample, we chose nine professionals from Dongguk University, Yonsei University, Myongji University, Korea University of Technology and Education, KIPA (Korea Invention Promotion Association), KIPSA (Korea Intellectual Property Strategy Agency), KIAT (Korea Institute for Advancement of Technology), STEPI (Science and Technology Policy Institute), and MSIT (Ministry of Science and ICT) as participants. In grouping the survey samples, different roles and positioning in technology transfer were considered. Companies have traditionally been clearly identified as technology consumers and we reviewed universities, national research institutes, and government agencies as technology providers. According to Ryu, in the case of technology transactions, the national research institutes focused on whether to make technology transactions, while universities focused on preventing core technology leakage [58]. According to Park, the main barrier to the technology trading market in the case of a government research institute was the strategy for revitalizing the transaction, while the main barriers in the case of the university were found to be the difficulties in releasing key technologies [48]. Even though government research institutes and universities were located in the same technology provider position as the above-mentioned two studies, the viewpoints that are important in technology transactions are different, and government research institutes have more advantages in licensing performance. For that reason, we classified national research institutes and universities into separate groups, although they are the same technology providers. According to Tony, technology-based technology startups in university research will attract investment from the private and public sectors, strengthen local and international networks, create jobs and diversify the local economy, attract talented people and investment, and contribute to economic development [59]. Additionally, government agencies, except for government research institutes, are in the position to activate the start-up and focus on policies for regional economic development. For this reason, we classified government agencies and universities into the same group. Therefore, we conducted research into three groups, (1) Group 1: technology users (company), (2) Group 2: technology supplier 1 (national research institutes), and (3) Group 3: technology supplier 2 (university-government agency). Table 1 shows the statistics of the survey distribution, response rates for each group, and the results of consistency.
We achieved a response rate of approximately 90% and verified the integrity of the data in consideration of the consistency ratio (CR). If the derived value of CR was less than 0.1, the response had reasonable consistency, and if it was less than 0.2, the response was allowed [60]. The CR of this study was 0.01 and proved to be very consistent. A total of 25 valid survey samples was reached by deleting four inconsistent survey samples according to the CR criteria.

3.3. AHP Framework

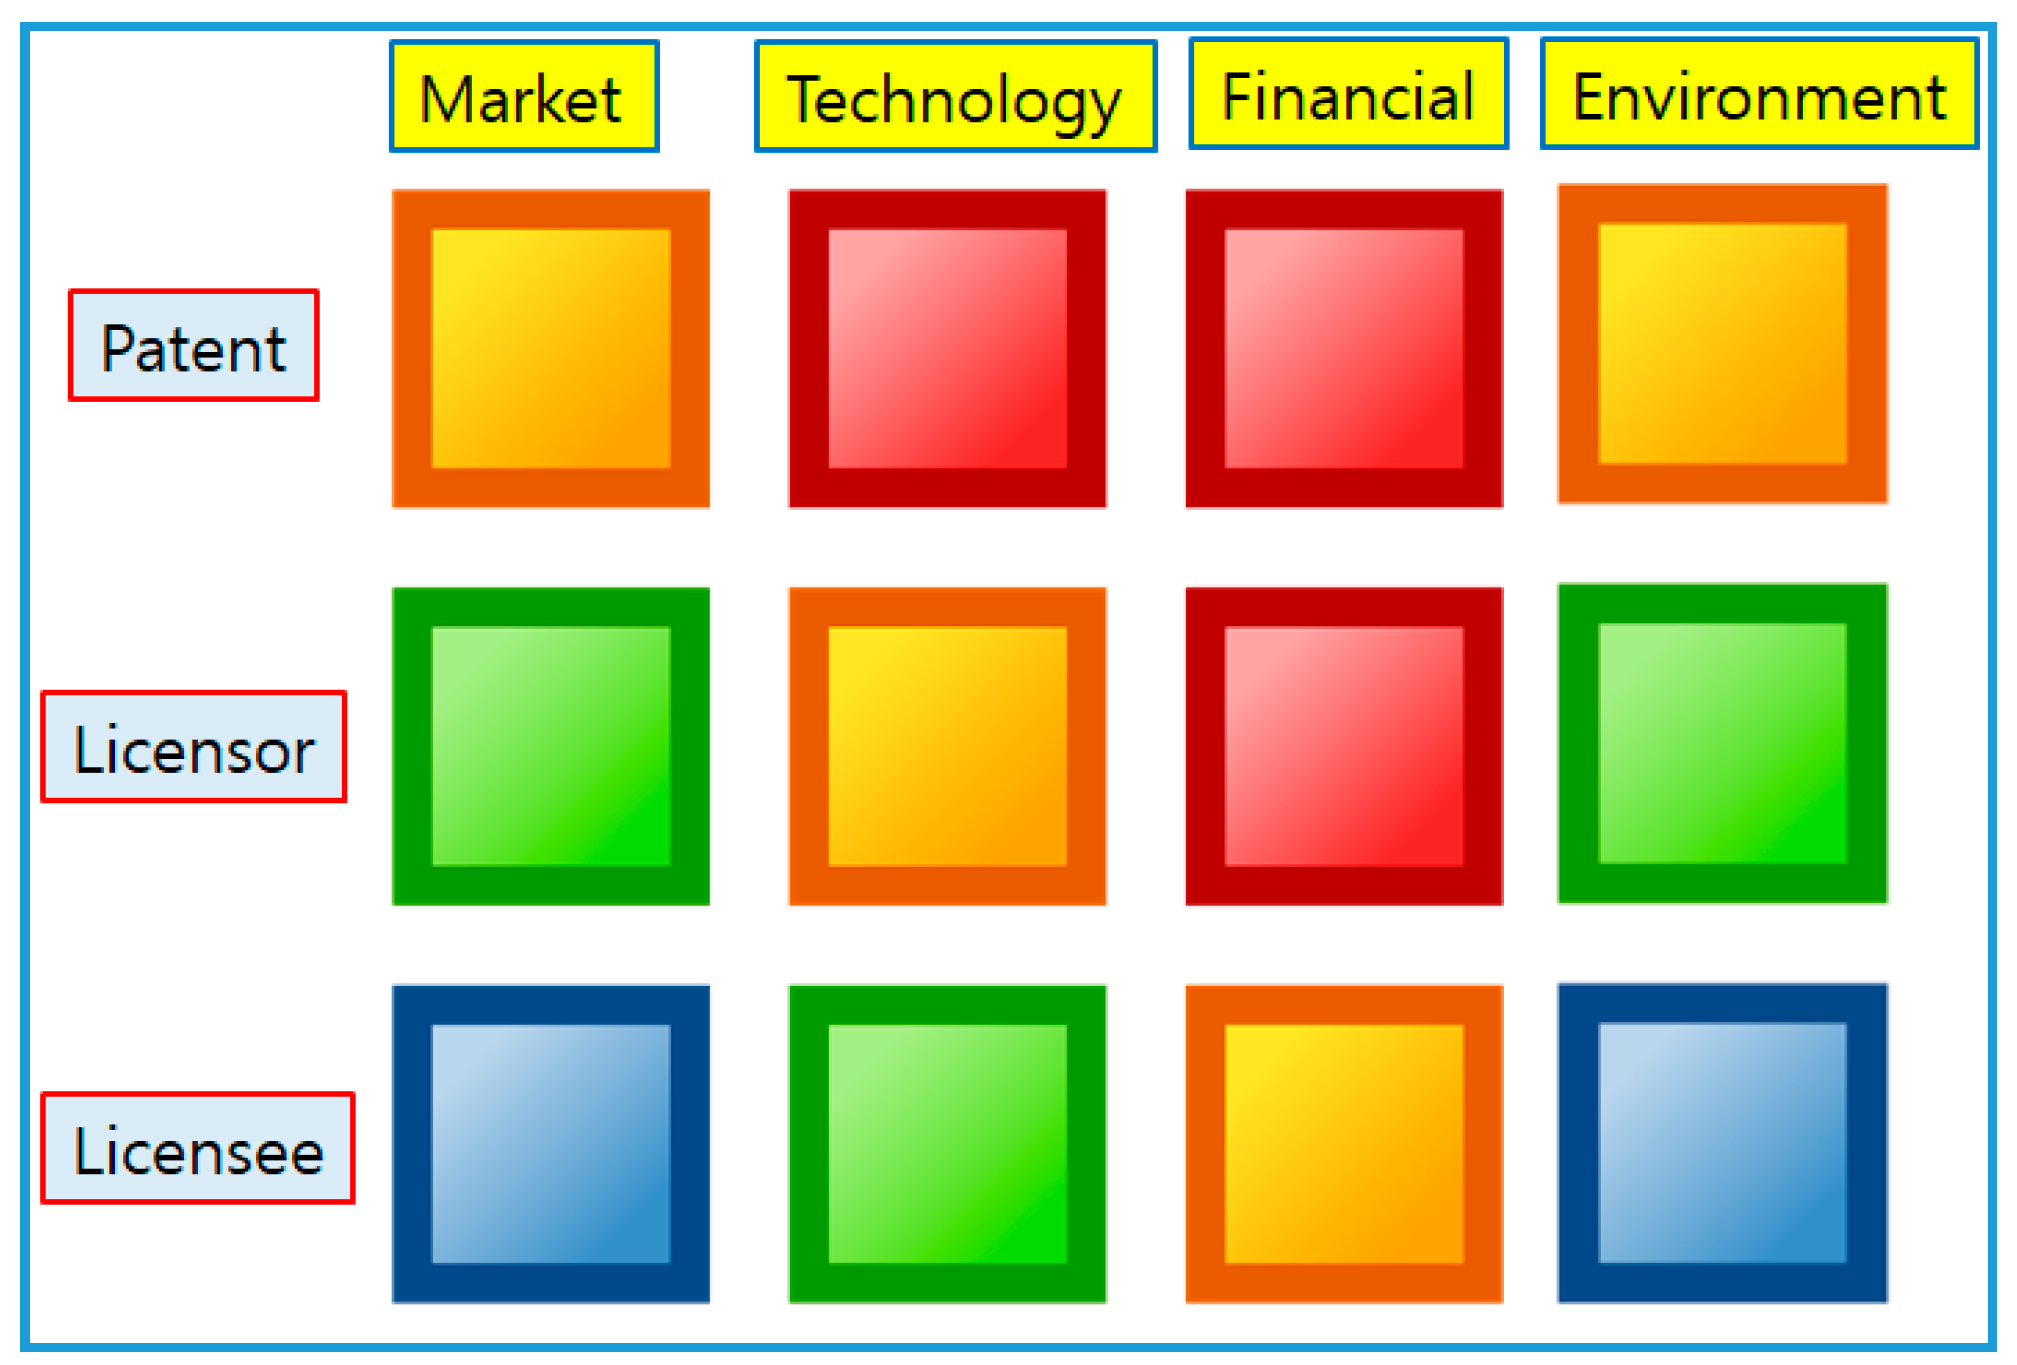
This research derived the weight of each variable through AHP analysis and proposed the priority of factors affecting the license fee. In order to find the factors that affected the license fee of technology transfer, we reviewed 135 related studies and integrated 167 related factors from 36 papers. To analyze the significance of the determinants of the license fee, the primary common factors related to the determinants of the license fee were derived from the previous research and classified into groups to set the decision hierarchy. We classified the variables affecting the license fee of the technology contracts extracted from the literature, and then assigned the variables in a framework of a 3 × 4 matrix. The 3 × 4 matrix is the framework in which technological factors, financial factors, market factors, and environmental factors are placed on the x-axis, and patent characteristics, technology supplier characteristics, and technology user characteristics are arranged on the y-axis. The survey regarding factors determining the royalty was conducted through email and sent directly to 25 or more specialists including technical value evaluators, technology transfer experts, and technology licensing experts in biopharmaceutical industries. The survey groups consisted of Group 1, Group 2, and Group 3. Based on the survey results, we calculated the importance and priority of AHP weighting analysis on the relative importance of factors of license fee determination.
Determining factors affecting the license fee derived from the review of preceding research could be effectively expressed in the form of the 3 × 4 matrix shown in Table 2. Table 2 shows the structure of the AHP hierarchy and the determinants assigned in Level 4. We chose the following four factor groups as Level 2: Technical factor, financial factor, market factor, and environmental factor. Next, we chose the following three characteristics groups as Level 3: Patent characteristics, licensor characteristics, and licensee characteristics.
When we analyzed the frequency of each determinant, we found that ‘technical life cycle (12)’ was superior relative to its frequency in the literature. The frequency of determinants was in the order of ‘Stability of patent rights, Profitability (9)’, ‘Development Phase & Attrition Rate (8)’, ‘Quality of technology, Licensor R&D Costs, IP Tradability (7)’, ‘Technology Commercialization environment (5)’, and ‘Licensor patent number, Licensor patent similarity, Licensee patent similarity, Licensor sales per capital, Licensee sales per capital, Licensor licensing experience, Licensee licensing experience (4)’.
The definitions and explanations of the Hierarchy 4 factors in the tables shown in Appendix A were included in the questionnaires to prevent misunderstanding and to provide an effective survey.

4. Results

The priority analysis results of factors affecting the license fee for future possible transactions are illustrated in detail in Table 3. From examining Table 3 in conjunction with Figure 2 and 
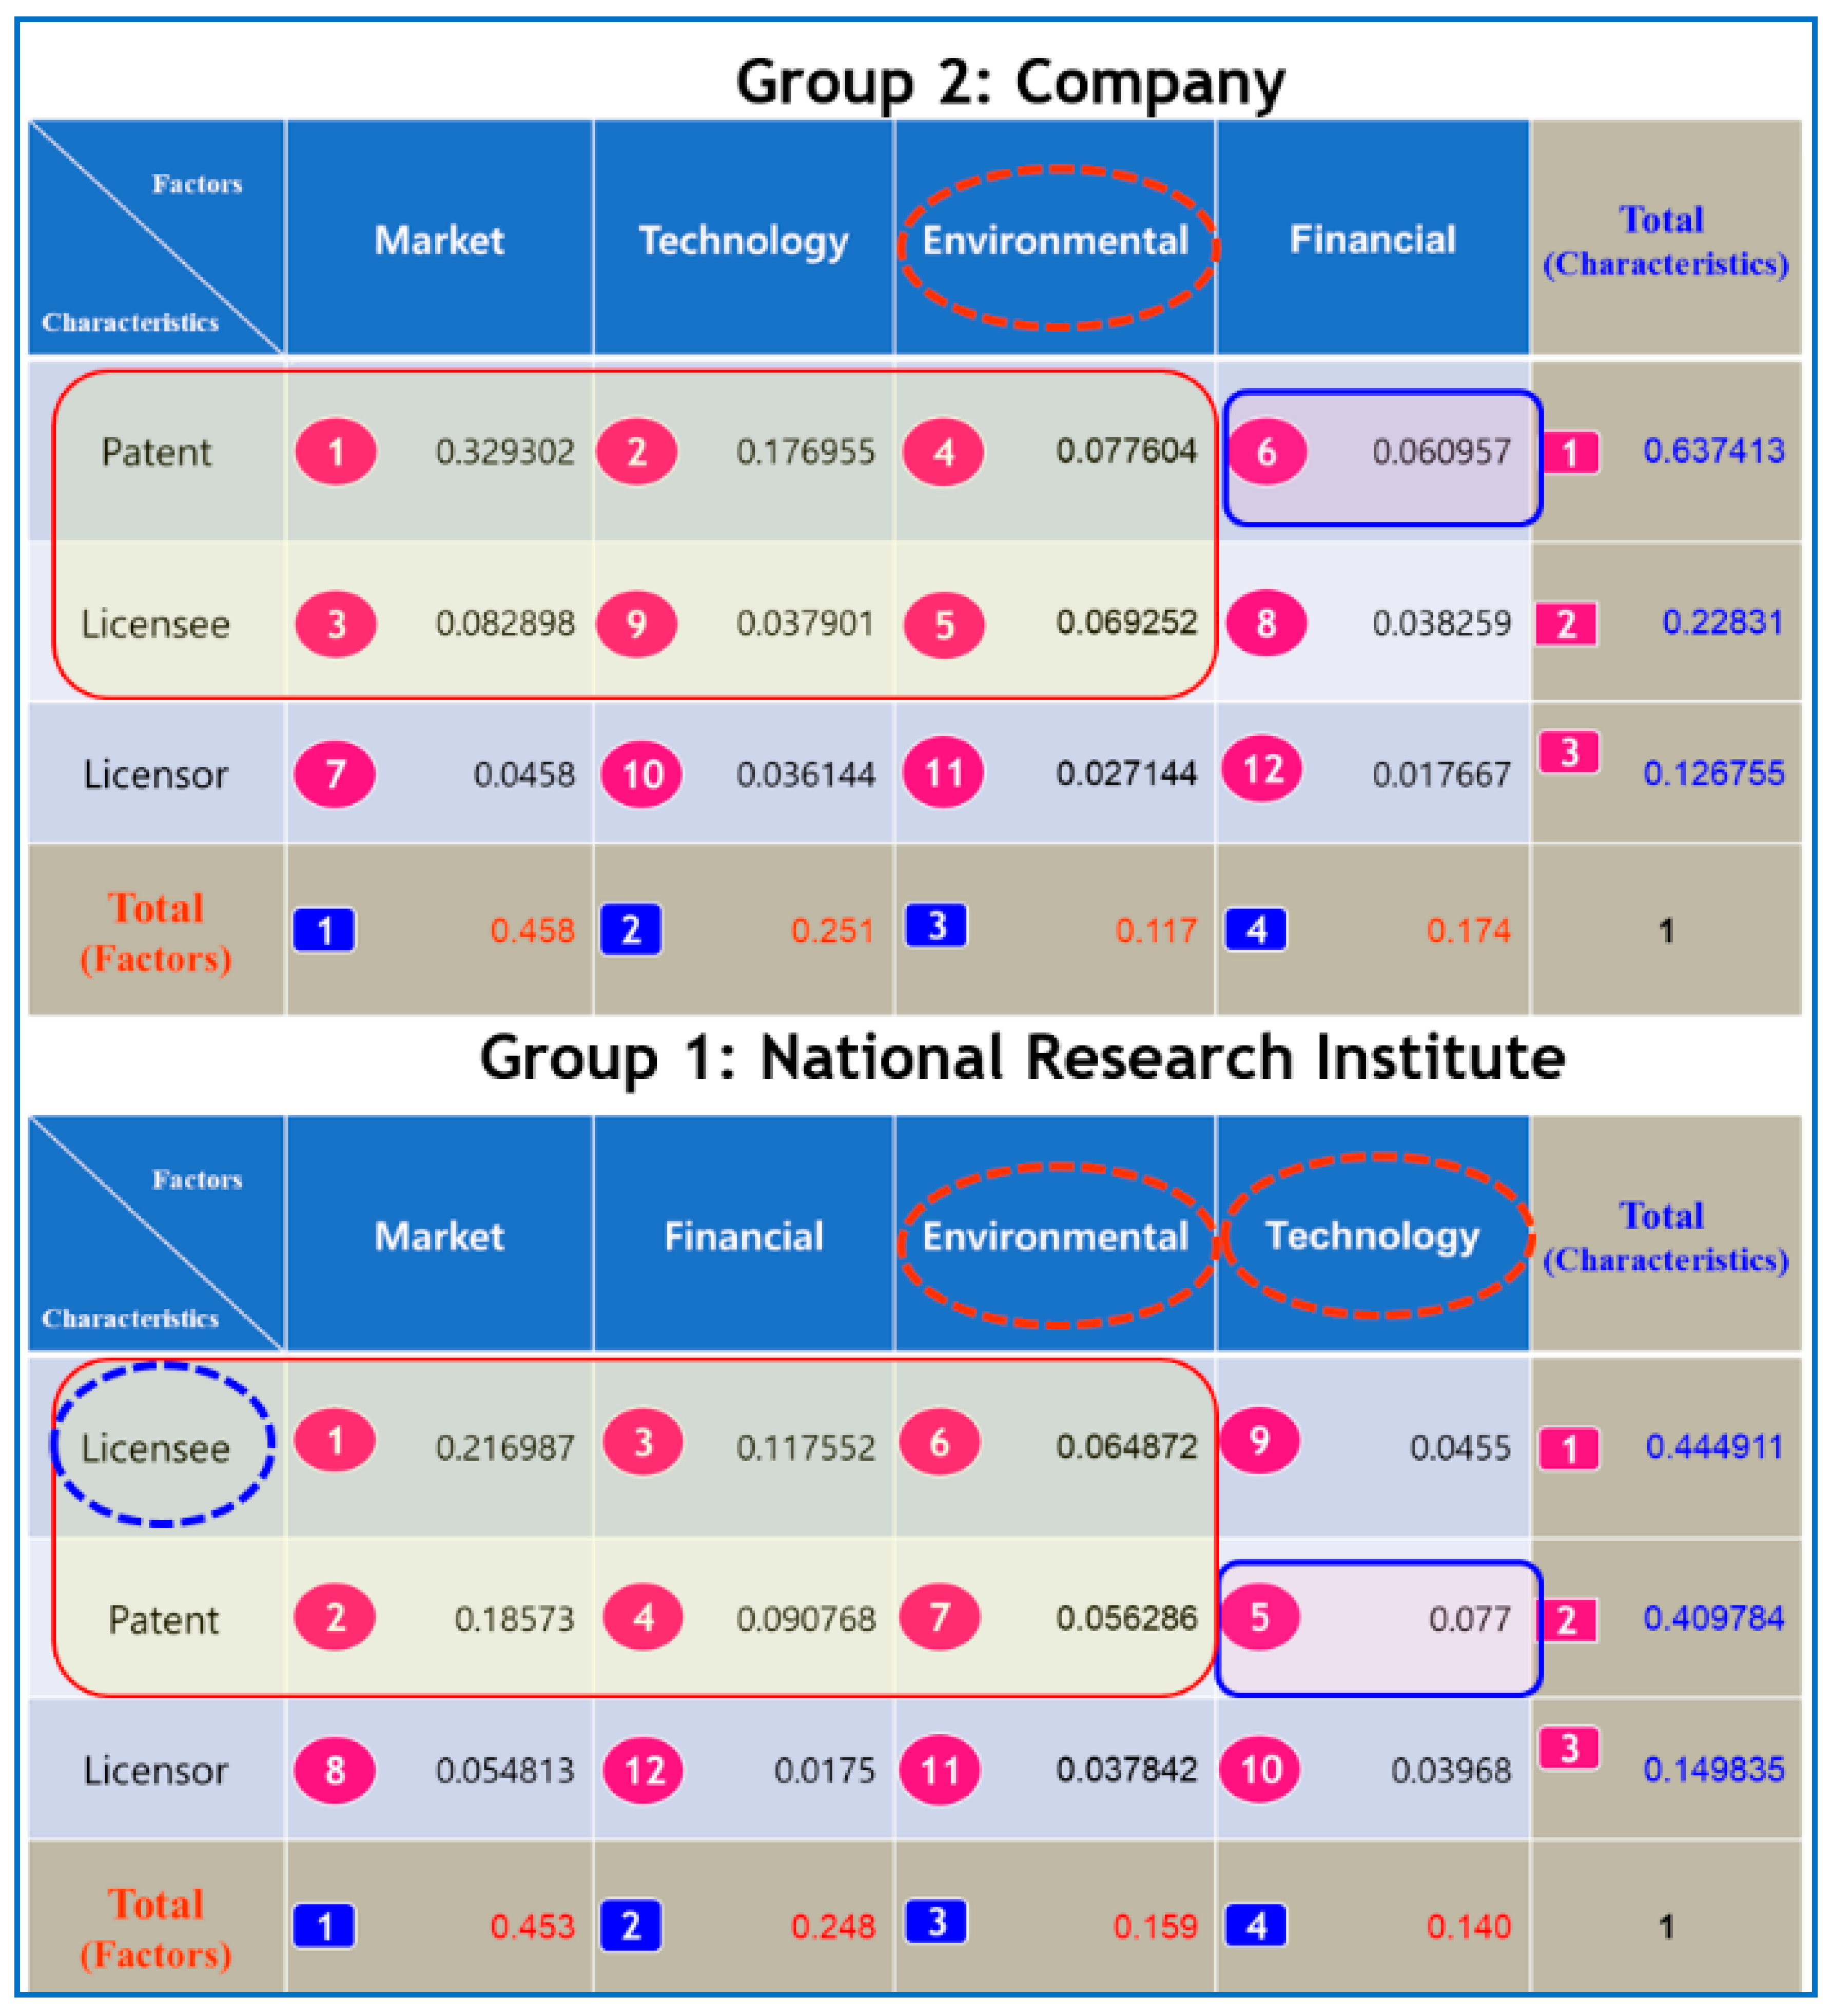
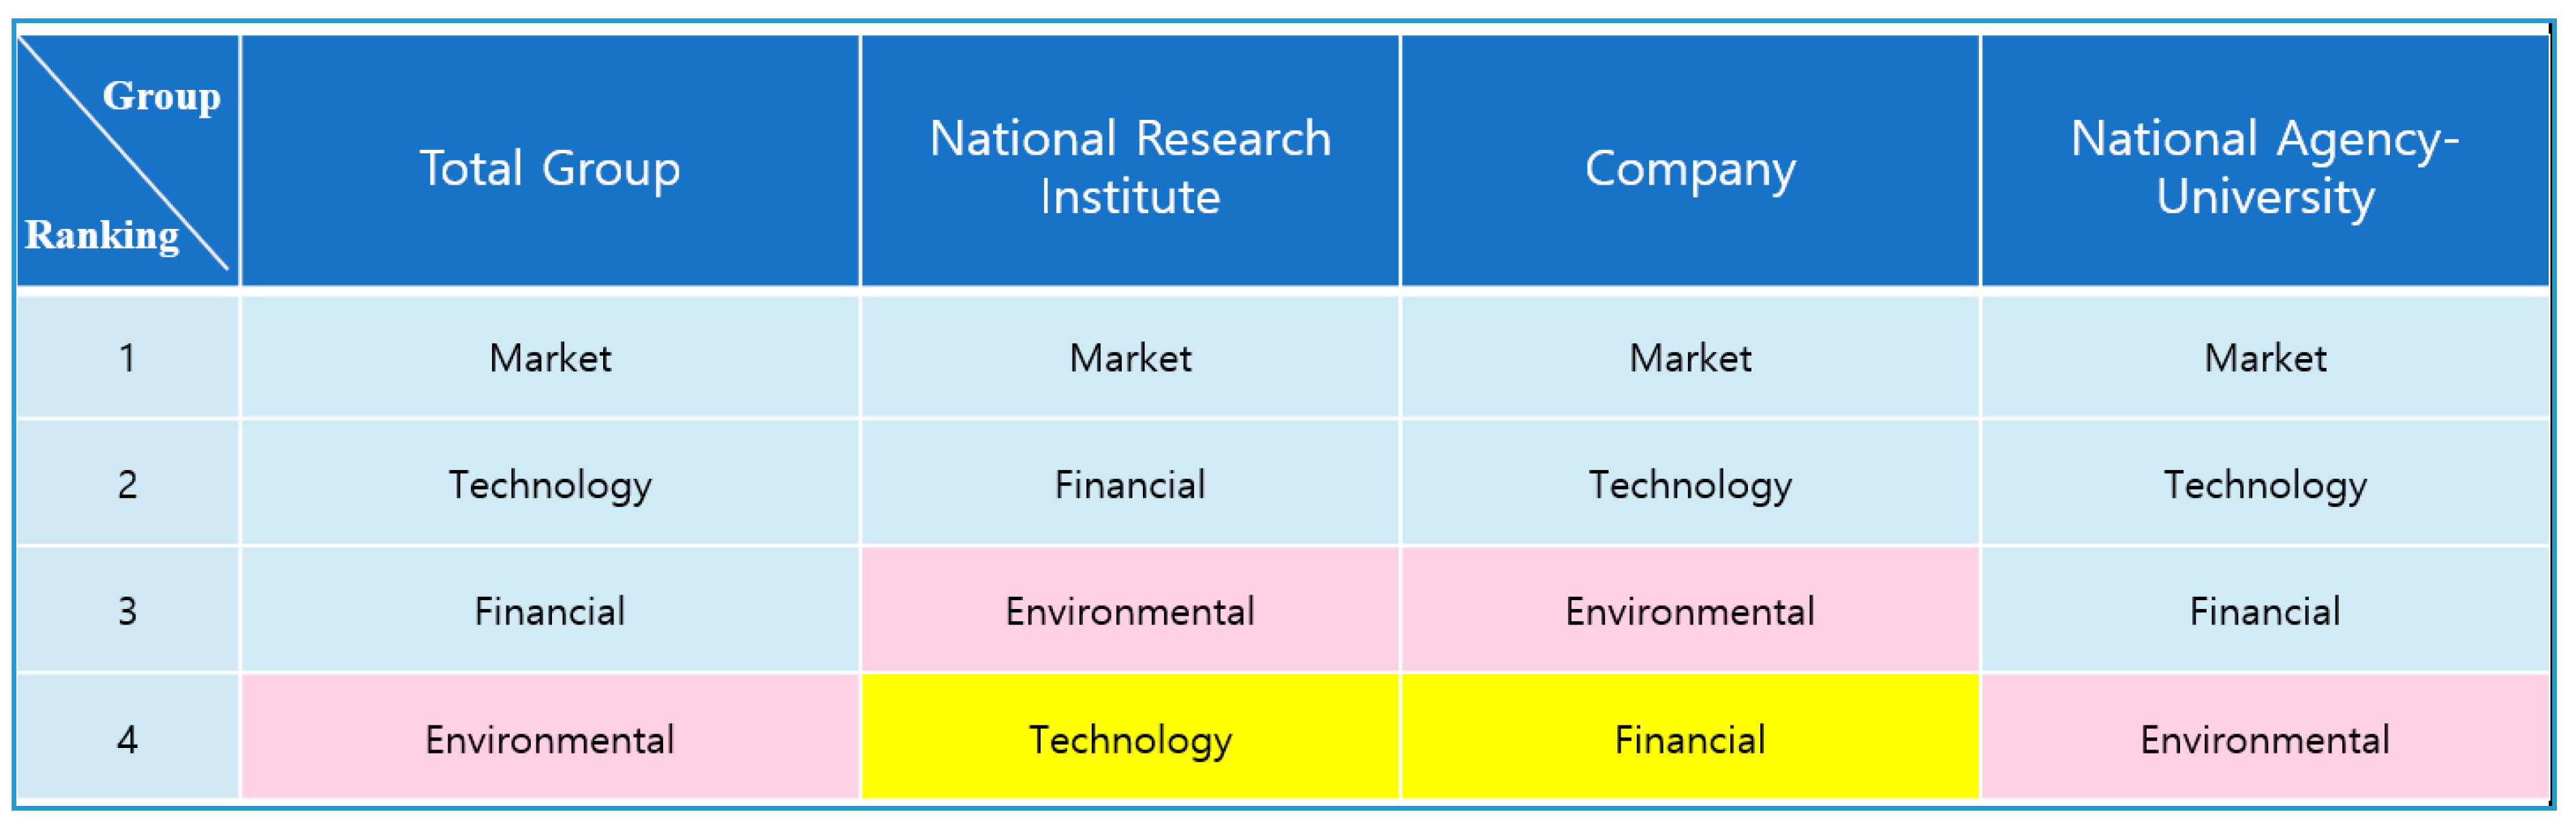
Figure 3, in the case of the total group, market factor (0.423) appeared to have the largest weight, followed by technical factor (0.237), financial factor (0.195), and environmental factor (0.145) in terms of the factor. When we analyzed Group 1 in Figure 3, we found that market factor (0.453) was superior in terms of the factor. The weightings of financial factor (0.248), environmental factor (0.157), and technical factor (0.140) followed, in that order. In Group 2 in Figure 3, we noted that the market factor (0.458) was the most important, followed by technical factor (0.251), environmental factor (0.174), and financial factor (0.117). For Group 3 in Figure 2, we found that the market factor (0.341) was the most important, followed by technical factor (0.327), financial factor (0.227), and environmental factor (0.105).
For the average of the Total group in Figure 2, the patent characteristic index (0.503613) appeared to have the largest weight, followed by licensee characteristics (0.323467), and licensor characteristics (0.17258) in terms of characteristics. In a similar way, we found that in the case of Group 1, licensee characteristics (0.444911) was superior in terms of characteristics in Figure 3. The weightings of the patent characteristic index (0.409784), and licensor characteristics (0.149835) followed in that order. In Group 2 in Figure 3, we noted that the patent characteristic index (0.637413) was the most important, followed by licensee characteristics (0.22831), and licensor characteristics (0.126755). For Group 3 in Figure 2, we found that the patent characteristic index (0.434689) was the most important, followed by licensee characteristics (0.320963), and licensor characteristics (0.244243).
The average of the Total group and Group 3 showed the same tendency at a Level 3 ranking, in which the priority of determining the license fee was the ranking of ‘the market factor, the technology factor, the financial factor and the environmental factor’ in terms of factor, and ‘patent characteristics, licensee characteristics, and licensor characteristics’ in terms of characteristics. The determinants belonging to the top 50% ranking were mostly included in the ‘Factor (Market, Technology, Financial)—Characteristics (Patent, Licensee)’ surrounded by circles in Figure 2. ‘Factors (Environmental)-Characteristics (Licensee)’ in the total group and ‘Factor (Technology)—Characteristics (Licensor)’ in the National Agency—University group were determinants belonging to the 50% rank outside the circle. In the Level 3 ranking analysis, the Total group and the National Agency–University group, we could see that the environmental factor and licensor characteristics were the least important determinants.
In the Level 3 ranking, Groups 1 and 2 showed different tendencies from the Total group. For Group 2, the priority of determining the license fee was the ranking of ‘the market factor, the technical factor, the environmental factor, and the financial factor’ in terms of factor. For Group 1, the priority in determining the license fee in terms of factor was in the order of ‘the market factor, the financial factor, the environmental factor, and the technology factor’. For Group 2, the priority was the order of ‘patent characteristics, licensee characteristics, and licensor characteristics’ in terms of characteristics. For Group 1, the priority was in the order of ‘licensee characteristics, patent characteristics, and licensor characteristics’ for characteristics. It is noteworthy that ‘licensee characteristics’ was the most important priority in Group 1 and ‘the environmental factor’ was the third most important priority in both Group 1 and Group 2. It was also beyond our usual expectation that ‘the technology factor’, with the second most important priority in the other groups, had the least important priority in Group 1.
The determinants belonging to the top 50% ranking in Group 2 mostly included the ‘Factor (Market, Technology, Environment)—Characteristics (Patent, Licensee)’ surrounded by circles in Figure 3. The determinants belonging to the top 50% ranking in Group 1 mostly included the ‘Factor (Market, Technology, Environmental)—Characteristics (Patent, Licensee)’ surrounded by circles. ‘Factors (Financial)—Characteristics (Patent)’ in Group 2 and ‘Factor (Technology)—Characteristics (Patent)’ in Group 1 were determinants belonging to the 50% rank outside the circle. In the Level 3 ranking analysis, we could see that the financial factor and licensor characteristics were the least important determinants in Group 2, and the technology factor and licensor characteristics were the least important determinants in Group 1.
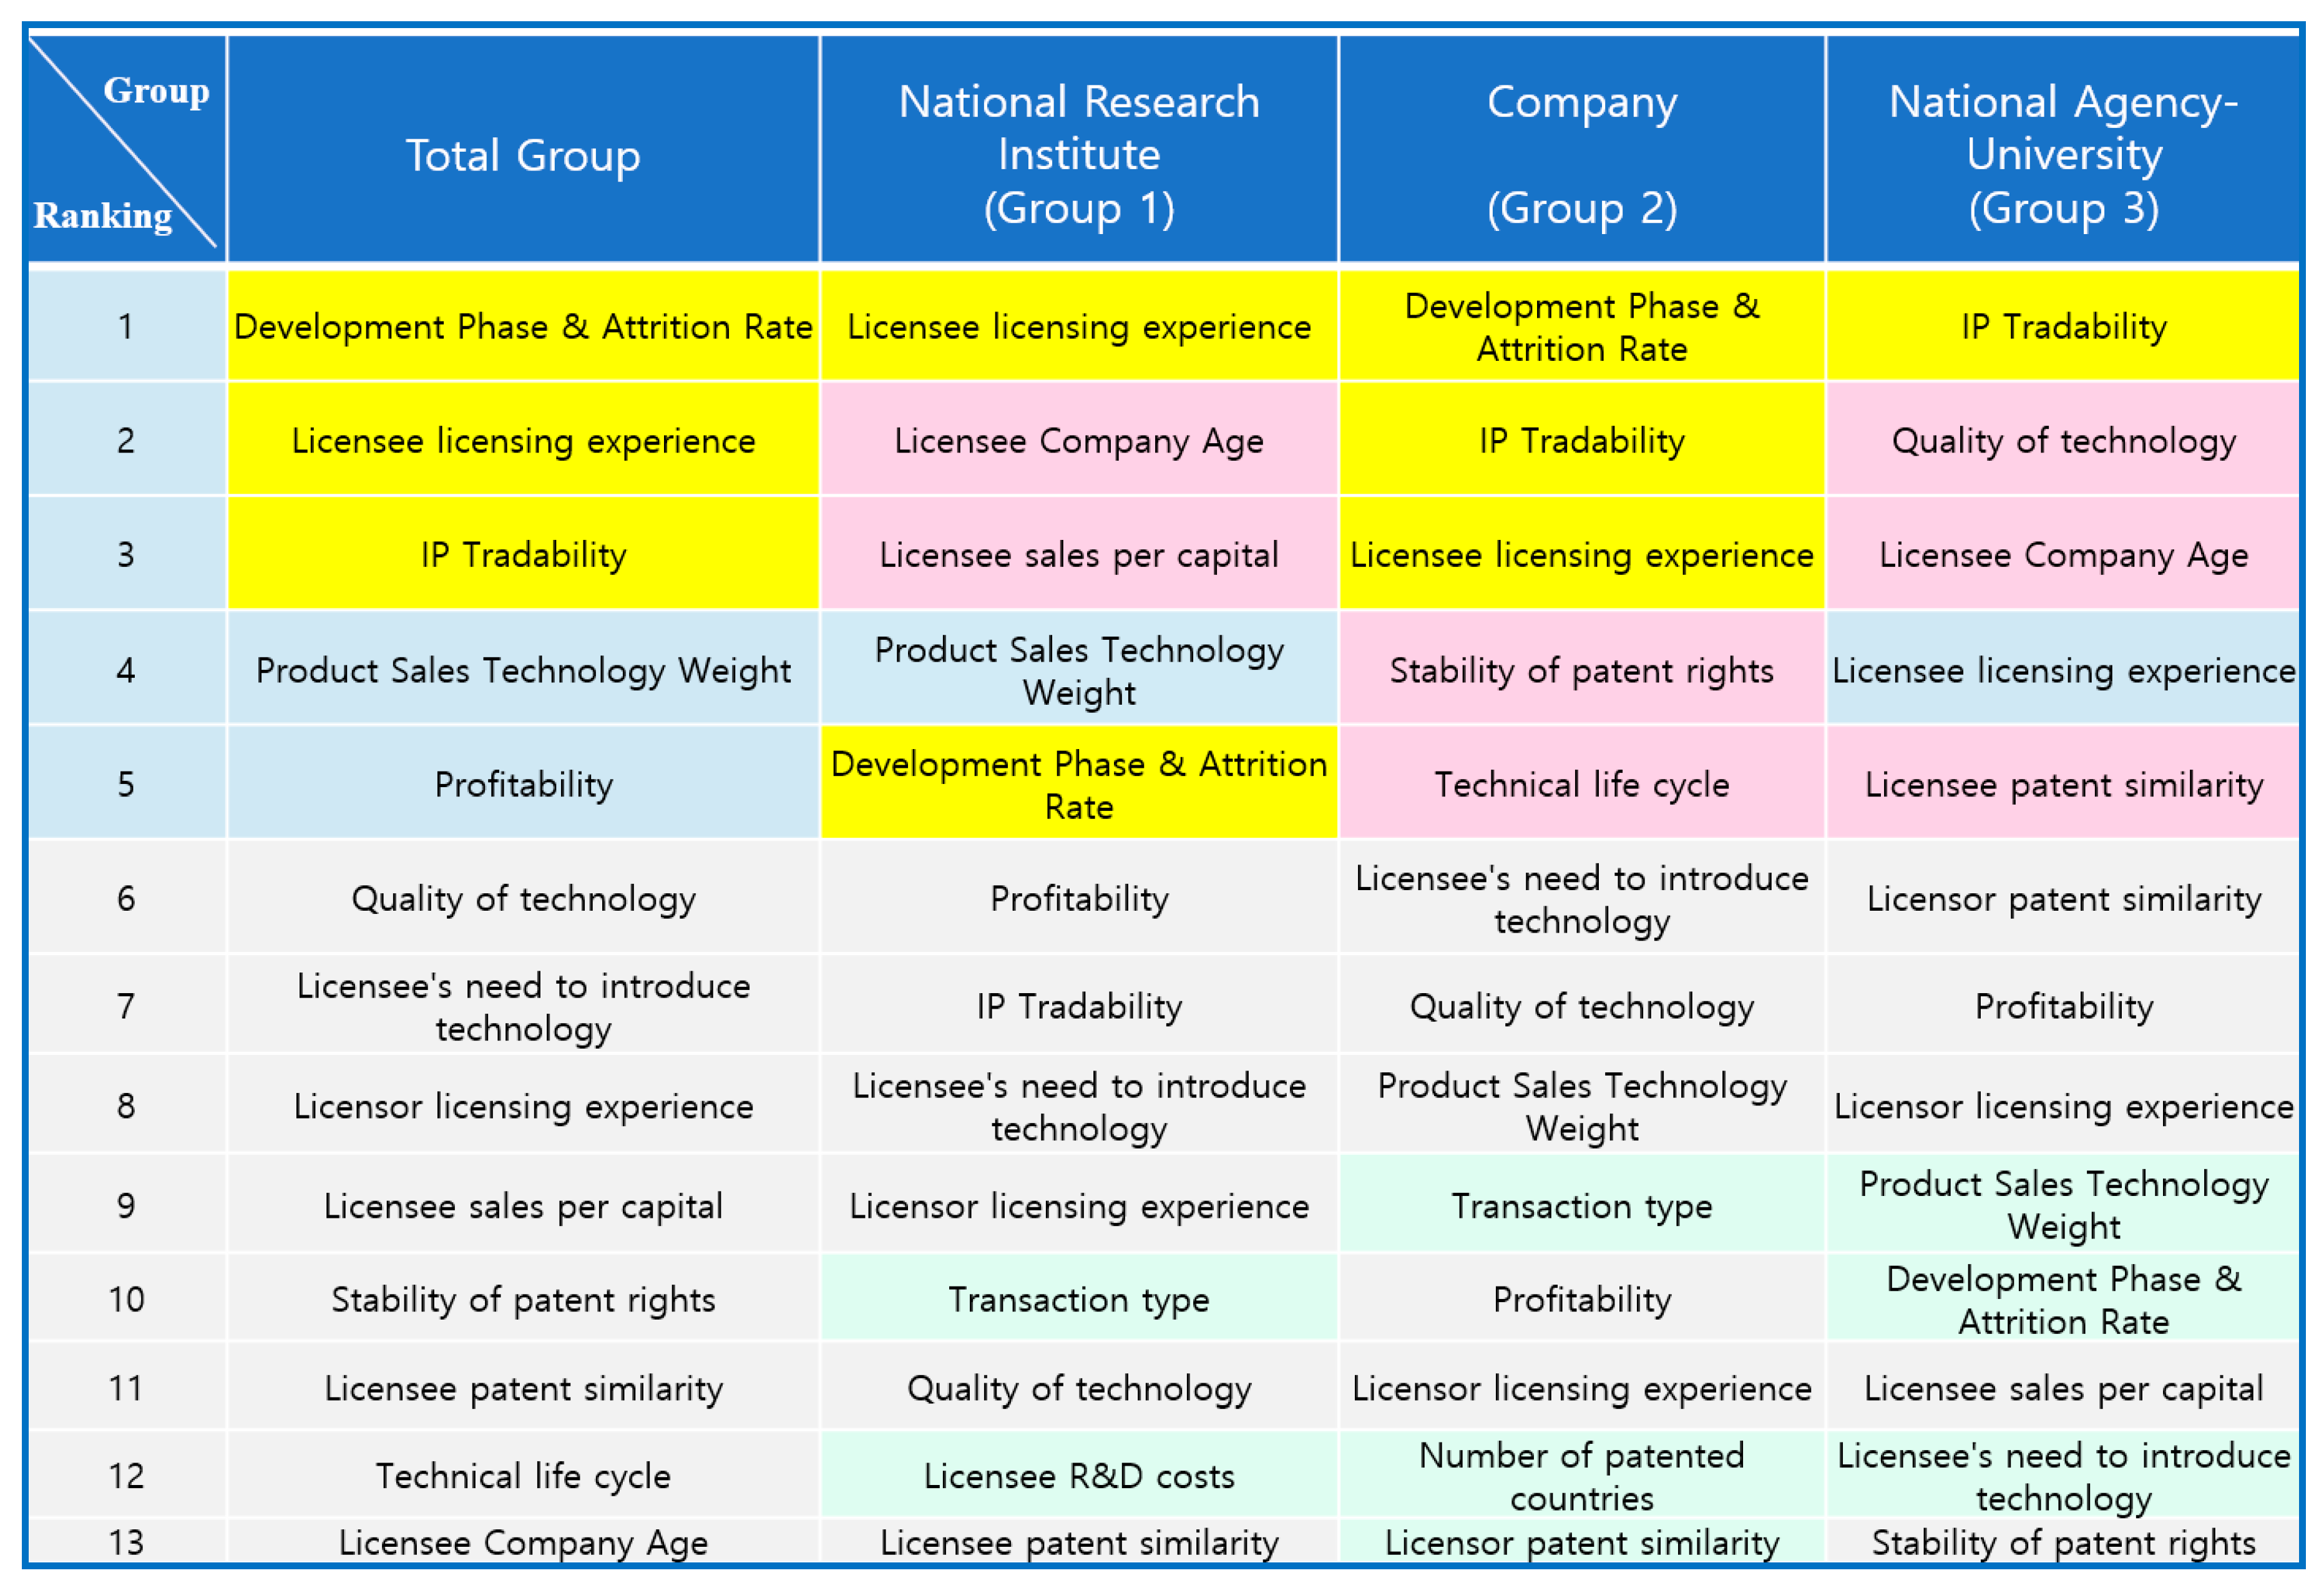
The determinants that belonged to the top five ranking in the Total group that showed in more than two groups were ‘Development Phase & Attrition Rate’, ‘Licensee licensing experience’, and ‘IP Tradability’, as shown in Figure 4. The determinants in the top five ranking in Group 1, but not in the Total group, were ‘Licensee Company Age’ and ‘Licensee sales per capital’. The determinants in the top five ranking in Group 2, but not in the Total group, were ‘Stability of patent rights’ and ‘Technical life cycle’. The determinants in the top five ranking in Group 3, but not in the Total group, were ‘Quality of technology, ‘Licensee Company Age’, ‘and Licensee patent similarity’.
The determinants that were in the top 50% ranking in Group 1, but not shown in the Total group, were ‘Transaction type’ and ‘Licensee R&D costs’, and the determinants in the top 50% ranking in Group 2, but not in the Total group, were ‘Transaction type’, ‘Number of patented countries’, and ‘Licensor patent similarity’, and the only determinant in the top 50% ranking in the National Agency-University group, but not in the Total group, was ‘Licensor patent similarity’, as shown in Figure 4.
The determinants that belonged to the top five reverse ranking in all groups and showed in more than two groups were ‘Licensor contract type’, ‘Licensor patent number’, and ‘Licensor company age’, as shown in Figure 5. The determinants in the top five reverse ranking in Group 1, but not in the Total group, were ‘Licensor patent similarity’ and ‘Licensee patent number’. The determinants in the top five reverse ranking in Group 2, but not in the Total group, were ‘Licensor sales per capital’ and ‘Licensor R&D costs’. The only determinant in the top five reverse ranking in the National Agency-University group, but not in the Total group, was ‘Transaction type’.

5. Conclusions and Implications

5.1. Conclusions

As shown in Figure 6, The Level 3 factor ranking was the same for the Total group and Group 3. The environmental factor was the third most important determinant in Groups 1 and 2, while the environmental factor was the least important determinant in the Total group and Group 3. This shows that Group 1 and Group 2 were more concerned with the environmental factor than Group 3.
The least important determinant in Group 1 was the technology factor, and the least important determinant in Group 2 was the financial factor. In the case of Group 1, the market factor and financial factors (Profitability, Licensee sales per capital) of patent technology were more important than the technology factor because it was the position of the technology provider (licensor).
The Level 3 characteristics ranking was the same for the Total group, Group 2, and Group 3, which was patent characteristics, licensee characteristics, and licensor characteristics in that order. The analysis showed that licensors were the least important in all groups. The ranking of Group 1 was in the order of licensee characteristics, patent characteristics, and licensor characteristics. It seems that the licensee (technology buyer) was the most important for Group 1 as it is the position of the technology provider (licensor).
There was nothing related to the licensor among the determinants that made up the top five ranking in the Level 4 ranking comparison, while the four determinants related to the licensee were the licensee licensing experience, the licensee patent similarity, the licensee company age, and the licensee sales per capital. Group 1 believed that the licensee was very important as there were three determinants related to the licensee in the top five ranking of Group 1 in the Level 4 ranking comparison.
In the Level 4 ranking comparison shown in Figure 4, the most important determinants common to all groups were ‘Development Phase & Attrition Rate’, ‘Licensee licensing experience’, and ‘IP Tradability’. In the Level 4 ranking comparison, additional important determinants in Group 1 were ‘Licensee Company Age’ and ‘Licensee sales per capital’, ‘Transaction type’, and ‘Licensee R&D costs’. In the Level 4 ranking comparison, additional important determinants in Group 2 were ‘Stability of patent rights’, ‘Technical life cycle’, ‘Transaction type’, ‘Number of patented countries’, and ‘Licensor patent similarity’. In the Level 4 ranking comparison, additional important determinants in Group 3 were ‘Quality of technology’, ‘Licensee Company Age’, ‘Licensee patent similarity’, and ‘Licensor patent similarity’.
In the Level 4 reverse ranking comparison, the least significant determinants common to all groups were ‘Licensor contract type’, ‘Licensor patent number’, and ‘Licensor company age’. Similarly, in the case of the Level 4 reverse ranking comparison, the least significant additional determinants in Group 1 were ‘Licensor patent similarity’ and ‘Licensee patent number’. On the other hand, the least significant additional determinants in Group 2 were ‘Licensor sales per capita’ and ‘Licensor R&D costs’. As shown in Figure 5, the least significant additional determinant in Group 3 was “Transaction type”.

5.2. Implications

From the AHP analysis above, we reached the following implications. In terms of factor, the market factor was the most influential consideration when determining the technology fee and was observed in all groups (Total and Groups 1, 2 and 3). The technical factor was the second most influential in the Total group, Group 2, and Group 3. In the Level 3 ranking analysis result, Groups 1 and 2 tended to differ from the average of the Total group. This was presumably because Groups 1 and 2 were the major direct parties in the technology licensing value chain. Meanwhile, Group 1 thought highly of the financial factor as the second influential factor, since they were concerned with licensee R&D costs and licensee sales per capital rather than technical level and stability. This is presumably because national institutes and companies are more likely to be concerned with the environmental factors that affect technology transactions since they are the major direct parties in the technology licensing value chain. Next, looking into characteristics, we noted that patent characteristics was primarily significant in technology transactions and their contract fee in the Total group and groups 2 and 3, followed by licensee characteristics. In particular, the company group (Group 2) prioritized patent characteristics at a weight of about 63.7%, and Group 1 recognized that licensee characteristics were as significant as patent characteristics. In terms of the in-depth index, we noted that ‘Development Phase & Attrition rate’, ‘IP tradability’, and ‘Licensee licensing experience’, followed by ‘Quality of technology’, were the most influential determinants, which provides a crucial implication in this study. There was nothing related to the licensor among the determinants that made up the top five ranking in the Level 4 ranking comparison, while four related to the licensee. These results showed that the factor of the licensee (technical consumer) was highly emphasized in the Level 4 ranking comparison. According to Yang, 23% of Korea’s total R&D budget is invested in national institutes, so the commercialization of source technologies developed by national institutes must be successfully undertaken to provide a basis for national technological competitiveness and economic power generation [63]. Since the research focus of national institutes is basic research and applied research, the technology developed by national institutes is not that which can be commercialized as a product. Therefore, additional development research is needed to develop it into mature technology that can be commercialized. For this reason, in the case of Group 1, who were in the position of a licensor, market factors and financial factors, such as profitability of patented technology and sales per person of licensees (technology consumer), were considered to be more important than the technical factors. This also implies that market factor–patent characteristics and market factor–licensee characteristics were further considered compared with environmental factors, licensor characteristics, patent numbers, etc., for the determination of technology fee.

6. Scope and Limitation of Research

The AHP analysis method used in this study had a limitation as it required the sincere response of the respondent, and it is difficult to consistently respond to more than a certain number of items.
The number of subjects that could be analyzed by Expert Choice software, which is the AHP decision-making program used in this study, was limited to 25 respondents, which implies that the maximum number of subjects that can be analyzed is 25 persons. If more answers are received from the survey respondents in future study, it is assumed that better results will be obtained.

7. Topics for Further Research

Further in-depth research is necessary for the following topics in the future:
(1)
The identification of the priorities of the factors affecting the success of technology transactions.
(2)
The estimation of appropriate royalty rates, up-front payments, and deal values of drug candidates by drug classes covering all types of drugs.

Author Contributions

J.H.L. primarily conducted research. T.-E.S. and E.K. participated in the design of the research and helped to draft the manuscript. E.K. helped to carry out a systematic literature review and T.-E.S. and E.K. helped to derive the implication from the AHP analysis. K.S. conceived of the research and participated in its design and coordination as the corresponding author. All authors read and approved the final manuscript.

Funding

The publishing fee of this paper was supported by the DGIST R&D Program of the Ministry of Science, Technology and ICT (DGIST-18-IT-01). This research is also supported by The International Science and Business Belt Program through the Ministry of Science, ICT and Future Planning (2016K000282), Republic of Korea., and by the Medical Research Information Center of the National Research Foundation through the Ministry of Science and ICT (2018R1A6A6040880), Republic of Korea.

Acknowledgments

We would like to show our gratitude to Jongtaik Lee and Seung-pyo Jun of KISTI (Korea Institute of Science and Technology Information); Hyung Min Chung of FACT (Foundation of Agri. Tech. Commercialization & Transfer); Min Ho Ahn of KIMST (Korea Institute of Marine Science & Technology Promotion); Se Ho Park of KITECH (Korea Institute of Industrial Technology), Lee Jong Hyuk of KRIBB (Korea Research Institute of Bioscience and Biotechnology); Kim, Eunjung of ETRI (Electronics and Telecommunications Research Institute); Saram Lee of SNUH BRI (Seoul National University Hospital Biomedical Research Institute); Kee Heon Cho of KVA (Korea Valuation Association); Choi, Jeong-Un of T-Value; Lawyer HoeMok Chung of the law firm Hanmaru; Attorney HanjungJoo of the JIDAM IP law firm, Kim Young-Kee of Gisang; Kyung Mo Song of Mirawiz; Ki Hwa Kim of Techwith; Sung-Joo Lee of Orum Therapeutics; James Jungkue Lee of Bridge Biotherapeutics; Sungwook Chung of STEMON/Wonik Investment Partners); Sungmook Lim of Dongguk University; Sung, Tae-Eung of Yonsei University; Kim, Do Hyeon of Myongji University; Ko Jung-eon of Korea University of Technology and Education; Jung-ae Kwak of KIPA (Korea Invention Promotion Association); Lee Chang Han of Kdata (Korea Data Agency); Cha Jong Sub of KIPSA (Korea Intellectual Property Strategy Agency); Dae Woo Baek of KIAT (Korea Institute for Advancement of Technology); Choi, Jisun of STEPI (Science and Technology Policy Institute); and Jae Heun Lee of MSIT (Ministry of Science and ICT) of KOREA for their faithful answers to the survey used in this study.

Conflicts of Interest

The authors declare that there are no competing interests.

Appendix A. Definitions and Explanations of Hierarchy 4 Factors

Table A1. The definitions and explanations of Hierarchy 4 factors (Technical Factor).
Hierarchy 2 (H2)Hierarchy 4 (H4)Hierarchy 4 Description
Technical Factor (F1)Technical life cycle (F111)The technology life cycle is the period in which the economic benefits to be generated by the technology commercialization of the patent can occur. The technology life cycle can be increased or decreased somewhat by other influencing factors within the remaining patent rights period (20 years-elapsed time after patent application).
Quality of technology (F112)The quality of technology is evaluated by the degree of technological innovation, technical competitiveness, and technological feasibility. The quality of technology can be judged by the number of patents cited.
Stability of patent rights (F113)Stability of patent rights is an evaluation index that evaluates the possibility of invalidation of patent rights by whether it is a prior art and novelty or inventive factor and how to overcome it and judges the risk level after analyzing the legal stability of the patent.
Licensor patent number (F121)Licensor patent number is the number of patents owned by Licensor. The more patents owned by Licensor, the greater the R&D capability of the technology.
Licensor patent similarity (F122)Licensor patent similarity is an indicator of the similarity between licensor (technology provider) core technology and licensed patents. It may be judged that the similarity between the patents in which the core technology of the licensor (technology provider) is described and the patents that provide the technology license maybe increase the value of the licensed patents.
Licensee patent similarity (F131)Licensee patent similarity is an evaluation index of the similarity of licensed patents with the core technology of licensees. It may be judged that the necessity of introducing a patent is increased because the licensee (technical consumer)’s patented technology and the patent obtained the right to use technology are less similar.
Licensee patent number (F132)The licensee patent number is the number of patents owned by Licensee. If the number of patents owned by the licensee is large, it can be judged that the technology absorption capability from the outside is high.
Table A2. The definitions and explanations of Hierarchy 4 factors (Financial Factor).
Hierarchy 2 (H2)Hierarchy 4 (H4)Hierarchy 4 Description
Financial factor (F2)Profitability (F211)Profitability is an indicator of the profitability of utilizing patented technology. Profitability can be judged by evaluating the duration, breadth, and size of the profits generated by the use of patent technology.
Ease of exercise of patent rights (F212)Ease of exercise of patent rights is an indicator of the extent to which it is easy to find out whether or not infringement of patent rights can be easily detected and verified. The greater the ease with which the patent rights are exercised, the greater the likelihood of obtaining financial benefits from the technology commercialization of patents.
Licensor R&D Costs (F221)Licensor (Technology Provider) R&D costs are the concentration of company-available resources in technology development. Licensor R&D Costs can be judged as the degree of R&D intensity (R&D expenditure on sales ratio).
Licensor sales per capital (F222)Licensor sales per capital is a financial indicator that determines the productivity of licensors (technology providers). Licensor sales per capita can be judged to be high as the sales per capita is high.
Licensee sales per capital (F231)Licensee sales per capital is a financial indicator to judge the productivity of licensee (technical consumer). If sales per capital is high, it can be judged that technology commercialization capacity is high.
Licensee R&D Costs (F232)Licensee R&D Costs is the concentration of Licensee (technical consumer)’s available resources on technology development. Licensee R&D costs can be judged as the degree of R&D intensity (R&D cost of sales).
Table A3. The definitions and explanations of Hierarchy 4 factors (Market Factor).
Hierarchy 2 (H2)Hierarchy 4 (H4)Hierarchy 4 Description
Market Factor (F3)Development Phase and Attrition Rate (F311)The probability of success (attrition rate) according to the phase of technology development is the average probability of success of technology commercialization in the market. Candidates who are in the clinical phase 2 development phase are much more likely to be commercialized under FDA approval than drug candidates in the preclinical development phase. In the latter stage of development, the average probability of successful commercialization of technology is high.
IP Tradability (F312)IP Tradability is an indicator of the complexity of the size of the relevant market size and market size of the patent. IP Tradability can be judged to be highly marketable as the market size is large and the market growth rate is high.
Product Sales Technology Weight (F313)Product Sales Technology Weight is an indicator of the proportion of technology in the product sales It can be judged that the higher Product Sales Technology Weight, the higher the contribution of technology to commercialization.
Licensor licensing experience (F321)Licensor (technology provider) licensing experience is an indicator of the number of patents licensor licenses its technology. If Licensor has a high licensing experience, it can be judged that the technology user has a lot of core technologies desired.
Licensor Company Age (F322)If the company age of the licensor (technology provider) is high, it can be judged that the maturity of the technology is high.
Licensee licensing experience (F331)Licensee licensing experience is an indicator of the number of patents licensed by technology licensees. Licensee has high licensing experience, high possibility of introducing external technology through licensing, and high demand for external technology.
Licensee Company Age (F332)If the company age of licensee (technology consumer) is high, it can be judged that technology absorption capacity and technology commercialization capability are high.
Table A4. The definitions and explanations of Hierarchy 4 factors (Environmental Factor).
Hierarchy 2 (H2)Hierarchy 4 (H4)Hierarchy 4 Description
Environmental factor (F4)Number of patented countries (F411)The more countries where patents are registered, the larger the area of technology commercialization where profits from technology commercialization of patents can be obtained.
Transaction type (F412)Types of transactions can be divided into Partnership Deals, Public Offering Deals, M&A, Private Equity and Venture Financing Deals and so on. It can be judged that the scope and target to be traded are different depending on the transaction type and the amount is influenced.
Licensor contract type (F421)The types of contracts can be classified into patent ownership transactions, exclusive licenses, non-exclusive licenses, exclusive license rights reservations, and so on. Depending on the status of the residual technology of the licensor (technology provider), it can be judged that the type of contract desired by the licensor is different.
Technology Commercialization environment (F422)In the technology commercialization environment, the higher the maturity of the surrounding technology and the larger the social needs for the technology, the higher the possibility of technology trading and the higher the amount of money.
Licensee’s need to introduce technology (F431)If the licensee (technology consumer)’s need to introduce technology is high in company strategy, it can be judged that the investment cost for technology purchase is high.
Licensee contract type (F432)The types of contracts can be classified into patent ownership transactions, exclusive licenses, non-exclusive licenses, exclusive license rights reservations, and so on. It can be judged that the size of the rights granted to a licensee varies depending on the type of contract.

References

  1. Nigel Borshell, N.; Ahmed, T. Approaches to Valuation of Pharmaceutical Licensing Deals. PharmaVentures, 2012. Available online: http://files.pharmadeals.net/contents/Sample_Valuation.pdf (accessed on 22 June 2016).
  2. Mergermarket. Global Technology, Media & Telecommunications Trend Report. Available online: https://qz.com/244435/whats-really-going-on-with-all-those-crazy-tech-deals-in-charts/ (accessed on 22 April 2018).
  3. Lee, J.H.; In, Y.; Lee, I.; Lee, J.W. Valuations using royalty data in the life sciences area—Focused on anticancer and cardiovascular therapies. J. Open Innov. Technol. Mark. Complex 2016, 2, 1–25. [Google Scholar] [CrossRef]
  4. Yourgenome. How Are Drugs Designed and Developed? Available online: https://www.yourgenome.org/facts/how-are-drugs-designed-and-developed (accessed on 26 April 2018).
  5. Deloitte Centre for Health Solutions. 2015 Global Life Sciences Outlook: Adapting in an Era of Transformation. Available online: https://www2.deloitte.com/content/dam/Deloitte/global/Documents/Life-Sciences-Health-Care/gx-lshc-2015-life-sciences-report.pdf (accessed on 22 June 2016).
  6. Bogdan, B.; Villiger, R. Valuation in Life Sciences: A Practical Guide, 3rd ed.; Springer: New York, NY, USA, 2010. [Google Scholar]
  7. Lee, S.; Lee, K. Heterogeneous expectations leading to bubbles and crashes in asset markets: Tipping point, herding behavior and group effect in an agent-based model. J. Open Innov. Technol. Mark. Complex 2015, 1, 12. [Google Scholar] [CrossRef] [Green Version]
  8. Lee, J.H.; Bae, K.S.; Lee, J.W.; In, Y.; Kwon, T. Valuation method by regression analysis on real royalty-related data by using multiple input descriptors in royalty negotiations in life science area-focused on anticancer therapies. J. Open Innov. Technol. Mark. Complex. 2016, 2, 21. [Google Scholar] [CrossRef]
  9. Blair, E.D. Assessing the value-adding impact of diagnostic-type tests on drug development and marketing. Mol. Diagn. Ther. 2008, 12, 331–337. [Google Scholar] [CrossRef] [PubMed]
  10. DiMasi, J.A.; Feldman, L.; Seckler, A.; Wilson, A. Trends in risks associated with new drug development: Success rates for investigational drugs. Clin. Pharmacol. Ther. 2010, 87, 272–277. [Google Scholar] [CrossRef] [PubMed]
  11. Thomas, D.W.; Burns, J.; Audette, J.; Carroll, A.; Dow-Hygelund, C.; Hay, M. Clinical Development Success Rates 2006–2015, BIO Industry Analysis, Biotechnology Innovation Organization (BIO). Available online: https://www.bio.org/sites/default/files/Clinical%20Development%20Success%20Rates%202006-2015%20-%20BIO,%20Biomedtracker,%20Amplion%202016.pdf (accessed on 2 January 2018).
  12. Alvarez, R.; Lopez, R.A. Foreign technology acquisition and changes in the real exchange rate. World Econ. 2015, 38, 613–628. [Google Scholar] [CrossRef]
  13. Arnold, K.; Coia, A.; Saywell, S.; Smith, T.; Minick, S.; Löffler, A. Value drivers in licensing deals. Nat. Biotechnol. 2002, 20, 1085–1089. [Google Scholar] [CrossRef] [PubMed]
  14. Gambardella, A.; Giuri, P.; Luzzi, A. The market for patents in Europe. Res. Policy 2007, 36, 1163–1183. [Google Scholar] [CrossRef]
  15. Kani, M.; Motohashi, K. Understanding the technology market for patents: New insights from a licensing survey of Japanese firms. Res. Policy 2012, 41, 226–235. [Google Scholar] [CrossRef]
  16. Zuniga, M.P.; Guellec, D. Survey on Patent Licensing: Initial Results from Europe and Japan; OECD: Paris, France, 2008. [Google Scholar]
  17. Fosfuri, A. The licensing dilemma: Understanding the determinants of the rate of technology licensing. Strat. Manag. J. 2006, 27, 1141–1158. [Google Scholar] [CrossRef] [Green Version]
  18. Arora, A.; Fosfuri, A. Licensing the market for technology. J. Econ. Behav. Org. 2003, 52, 277–295. [Google Scholar] [CrossRef] [Green Version]
  19. Arora, A.; Gambardella, A. Ideas for rent: An overview of markets for technology. Ind. Corp. Chang. 2010, 19, 775–803. [Google Scholar] [CrossRef]
  20. Gallini, N.T. Deterrence through market sharing: A strategic incentive for licensing. Am. Econ. Rev. 1984, 74, 931–941. [Google Scholar]
  21. Monk, A.H.B. The emerging market for intellectual property: Drivers, restrainers, and implications. J. Econ. Geogr. 2009, 9, 469–491. [Google Scholar] [CrossRef]
  22. Teece, D.J. Profiting from technological innovation: Implications for integration, collaboration, licensing and public policy. Res. Policy 1986, 15, 285–305. [Google Scholar] [CrossRef]
  23. Ruckman, K.; McCarthy, I. Why do some patents get licensed while others do not? Ind. Corp. Chang. 2017, 26, 667–688. [Google Scholar] [CrossRef]
  24. Reddy, A.M.; Zhao, L. International technology transfer: A review. Res. Policy 1990, 19, 285–307. [Google Scholar] [CrossRef] [Green Version]
  25. Paik, S. Identification of factors affecting technology licensing via expert survey. J. Korea Technol. Innov. Soc. 2008, 11, 476–509. [Google Scholar]
  26. Sakakibara, M. An empirical analysis of pricing in patent licensing contracts. Ind. Corp. Chang. 2010, 19, 927–945. [Google Scholar] [CrossRef]
  27. Yoo, J. A Study on Developing a Citation Prediction Model Based on the Major Factors Influencing Patent Citations. Ph.D. Thesis, Yonsei University, Seoul, Korea, February 2010. [Google Scholar]
  28. Chung, B.; Hyun, B.-H. Analysis of success factors of technology transfer and commercialization through systematic literature review. Asia-Pac. J. Multimedia Serv. Converg. Art Humanit. Sociol. 2018, 8, 79–90. [Google Scholar]
  29. Yun, D.; Park, I.; Yoon, B. Development of a technology valuation method for buyers in technology transfer. J. Korea Acad.-Ind. Coop. Soc. 2016, 17, 155–167. [Google Scholar] [CrossRef] [Green Version]
  30. Joo, H.; Lim, C.; Hwang, J.; Jeong, Y.; Kim, Y.; Min, B.; Mun, D.; Park, K.; Eom, S. A Study on IP Valuation Model for IP-Backed Loan; Korean Intellectual Property Office: Daejeon, Korea, 2013; pp. 1–208.
  31. Baek, J.; Hyun, B. A comparative study on the determinants priority of the royalty in national R&D project—Focused on the case of ‘N’ center’s technology transfer. J. Korea Technol. Innov. Soc. 2017, 20, 430–457. [Google Scholar]
  32. Lee, J.; Jung, M.; Lee, S.; Cho, K. The effect of patent characteristics on the diffusion performance in technology and market area. J. Intellect. Prop. 2016, 11, 223–246. [Google Scholar]
  33. Grimaldi, M.; Cricelli, L.; Di Giovanni, M.; Rogo, F. The patent portfolio value analysis—A new framework to leverage patent information for strategic technology planning. Technol. Forecast. Soc. Chang. 2015, 94, 286–302. [Google Scholar] [CrossRef]
  34. Kumar, S.; Luthra, S.; Abid Haleem, A.; Mangla, S.K.; Garg, D. Identification and evaluation of critical factors to technology transfer using AHP approach. Int. Strateg. Manag. Rev. 2015, 3, 24–42. [Google Scholar] [CrossRef]
  35. Fischer, T.; Leidinger, J. Testing patent value indicators on directly observed patent value—An empirical analysis of Ocean Tomo patent auctions. Res. Policy 2014, 43, 519–529. [Google Scholar] [CrossRef]
  36. Zaharoff, H. Setting values and royalty rates for medical and life science businesses. J. Biolaw Bus. 2004, 7, 7–9. [Google Scholar]
  37. De Rassenfosse, G.; Palangkaraya, A.; Webster, E. Why do patents facilitate trade in technology? Testing the disclosure and appropriation effects. Res. Policy 2016, 45, 1326–1336. [Google Scholar] [CrossRef]
  38. Sung, O.H. Preliminary Study on Royalty Decision Model in Biotechnology; Biotech Policy Research Center: Daejeon, Korea, 2008. [Google Scholar]
  39. Wang, B.; Hsieh, C.-H. Measuring the value of patents with fuzzy multiple criteria decision making: Insight into the practices of the Industrial Technology Research Institute. Technol. Forecast. Soc. Chang. 2015, 92, 263–275. [Google Scholar] [CrossRef]
  40. Sung, T.; Kim, D.S.; Jang, J.; Park, H. An empirical analysis on determinant factors of patent valuation and technology transaction prices. J. Korea Technol. Innov. Soc. 2016, 19, 254–279. [Google Scholar]
  41. Sung, O.H. A study on the estimation of running royalty of biopharmaceutical technologies in licensing agreements. Knowl. Manag. Rev. 2010, 11, 37–50. [Google Scholar]
  42. Caviggioli, F.; Ughetto, E. The drivers of patent transactions: Corporate views on the market for patents. R D Manag. 2013, 43, 318–332. [Google Scholar] [CrossRef]
  43. Baek, J.; Hyun, B. A study on the determinant priority of royalty between government-funded research centers and companies who were transferred the technology; focused on the case of ‘N’ center. J. Korea Acad.-Ind. Coop. Soc. 2017, 18, 135–145. [Google Scholar]
  44. Kim, Y.; Park, S.; Lee, S. Selection of important factors for patent valuation using Delphi method. Entrue J. Inf. Technol. 2010, 9, 7–17. [Google Scholar]
  45. Svačina, P. An empirical analysis of factors affecting prices of intangible assets: A preliminary testing in consumer durables sector. Prague Econ. Pap. 2015, 24, 354–363. [Google Scholar] [CrossRef]
  46. Jang, G. A Study on the Biotechnology Firm Valuation & IPO Pricing in the KOSDAQ Market. Ph.D. Thesis, Soongsil University, Seoul, Korea, February 2012. [Google Scholar]
  47. IPRA Inc. Royalty Rates for Pharmaceuticals & Biotechnology, 8th ed.; IPRA Inc.: Yardley, PA, USA, 2012. [Google Scholar]
  48. Park, K.H. The determinants of technology transfer of output from national R&D program. J. Intellect. Prop. 2012, 7, 187–215. [Google Scholar]
  49. Byun, J.W.; Lee, S.C.; Huh, N.I. A study on the effects of negotiation technique on the terms and conditions of technology transaction agreement. Korean Corp. Manag. Rev. 2013, 20, 215–232. [Google Scholar]
  50. Kwon, K.W. Activation of IP and technology trading market as a medium of open innovation. Sci. Technol. Policy 2015, 25, 36–45. [Google Scholar]
  51. Park, S.M.; Park, I.S. Effects of prior experience and the number of project on individual-Level technology commercialization. J. Technol. Innov. 2013, 21, 95–119. [Google Scholar]
  52. Hong, S.I.; Kim, J.S.; Kim, J.H. A Study on Antecedents and Performance of Technology Transfer from Overseas R&D Center. In Proceedings of the KIIE (Korean Institute of Industrial Engineers), Spring Conference, Busan, Korea, 24–25 April 1998; pp. 725–733. [Google Scholar]
  53. Eom, B.-Y. Industry-Industry vs. Industry-PRO Knowledge Transfer Modes and Firm Performance: The Case of Korea; STEPI: Sejong, Korea, 2009. [Google Scholar]
  54. Saaty, T.L. The Analytic Hierarchy Process; McGraw-Hill: New York, NY, USA, 1980. [Google Scholar]
  55. Jo, G.T.; Jo, Y.G.; Kang, H.S. AHP Decision Making, Seoul; DongHyun Press: Seoul, Korea, 2003. [Google Scholar]
  56. Saaty, T.L. Priority setting in complex problems. IEEE Trans. Eng. Manag. 1983, 30, 140–155. [Google Scholar] [CrossRef]
  57. Saaty, T.L. A scaling method for priorities in hierarchical structures. J. Math. Psychol. 1977, 15, 234–281. [Google Scholar] [CrossRef]
  58. Ryu, C.H.; Suh, M.S.; Joh, W.I. Encourage Technology Transfer for Public Research Institutes and Universities in Korea. Korean Bus. Educ. Rev. 2016, 31, 335–360. [Google Scholar]
  59. Tony, B. Fostering Student Entrepreneurship and University Spinoff Companies. Technol. Innov. Manag. Rev. 2011, 1, 7–12. [Google Scholar] [Green Version]
  60. Ko, G.G.; Ha, H.Y. Applying and utilizing AHP analysis method in policy research. Korea Policy Soc. 2008, 17, 287–313. [Google Scholar]
  61. Park, H.W. Structure and Determinants of Royalty in Pharmaceutical Licensing. J. Korea Technol. Innov. Soc. 2007, 10, 406–430. [Google Scholar]
  62. Sung, O.H. Estimation method for reasonable running royalty rate based on classic 25% rule and royalty influential factors. J. Korea Technol. Innov. Soc. 2013, 16, 1090–1108. [Google Scholar]
  63. Yang, Y.; Choi, J.I. The Effective Technology Commercialization of Government Research Institutes: Focus Daedeok Innopolis Research Company. J. Korea Acad.-Ind. Coop. Soc. 2010, 11, 287–294. [Google Scholar] [CrossRef]
Figure 1. Determining factors affecting the license fee for licensing in biotech industry.
Joitmc 04 00030 g001
Figure 2. Level 3 ranking (Total group vs. Group 3). Red and blue-Colored lines: Within the 50% category of rankings (within sixth place of 12).
Joitmc 04 00030 g002
Figure 3. Level 3 ranking (Group 2 vs. Group 1). Red and blue-Colored lines: Within the 50% category of rankings (within sixth place of 12).
Joitmc 04 00030 g003
Figure 4. Level 4 ranking comparison. Yellow-colored cells: The determinants that belonged to the top five ranking in the Total group and were shown in more than two groups. Pink-colored cells: The determinants that belonged to the top five ranking in each group and were not shown in the Total group. Blue-colored cells: The determinants that belonged to the top five ranking in the Total group and were shown in Group 1. Green-colored cells: The determinants in the top 50% ranking in each group, but not in the Total group.
Joitmc 04 00030 g004
Figure 5. Level 4 reverse ranking comparison. Yellow-colored cells: The determinants that belonged to the top five reverse-ranking in the Total group and showed in more than two groups. Pink-colored cells: The determinants that belonged to the top five reverse-ranking in each group and not shown in the Total group. Blue-colored cells: The determinants that belonged to the top five reverse-ranking in the Total group and shown in Group 1.
Joitmc 04 00030 g005
Figure 6. Level 3 factor ranking comparison in terms of factor.
Joitmc 04 00030 g006
Table 1. Statistics of survey distribution.
Actor GroupTotal Survey DistributedSurvey GatheredInconsistent SurveyFinal Valid Sample
Group 19808
Group 2121138
Group 3111019
Total3229425
Table 2. Classified determinants.
Factor Group (Level 2)Characteristics Group (Level 3)Determinants (Level 4)Research
Technical FactorPatent characteristicsTechnical life cycle[8,26,29,30,31,35,39,40,41,42,43,45]
Quality of technology[29,31,32,35,37,39,40]
Stability of patent rights[26,28,29,30,31,40,41,44]
Licensor characteristicsLicensor patent number[26,32,35,46]
Licensor patent similarity[21,26,29,39]
Licensee characteristicsLicensee patent similarity[21,26,29,39]
Licensee patent number[26,35]
Financial FactorPatent characteristicsProfitability[26,29,30,31,34,36,41,43,47]
Ease of exercise of patent rights[30]
Licensor characteristicsLicensor R&D Costs[17,31,32,45,48,49]
Licensor sales per capital[23,26,34,38]
Licensee characteristicsLicensee sales per capital[3,8,26,34]
Licensee R&D Costs[17,43,45]
Market FactorPatent characteristicsDevelopment Phase and Attrition Rate[3,8,29,36,38,40,48,61]
IP Tradability[25,28,29,30,31,34,36]
Product Sales Technology Weight[30]
Licensor characteristicsLicensor licensing experience[23,25,50,51]
Licensor Company Age[54]
Licensee characteristicsLicensee licensing experience[25,50,52,53]
Licensee Company Age[53]
Environmental FactorPatent characteristicsNumber of patented country[32,33,35]
Transaction type[25,37]
Licensor characteristicsLicensor contract type[45]
Technology Commercialization environment[28,29,30,34,38]
Licensee characteristicsLicensee’s need to introduce technology[31,43,62]
Licensee contract type[45]
Table 3. Weights of factor group and factor.
Value GroupValue (Actor)Total GroupGroup 1
Weights of Factor Group (Order)Weights of FactorWeights of Overall LevelsOrderWeights of Factor Group (Order)Weights of FactorWeights of Overall LevelsOrder
Technical Factor–Patent characteristic index (F11)Technical life cycle (F111)0.134 (2)0.2480.033120.077 (5)0.2380.01835
Quality of technology (F112)0.4290.05760.4450.03427
Stability of patent rights (F113)0.3230.043100.3170.02444
Technical Factor–Licensor characteristics (F12)Licensor patent number (F121)0.04 (10)0.2540.01250.0175 (12)0.2720.004823
Licensor patent similarity (F122)0.7460.031140.7280.012713
Technical Factor–Licensee characteristics (F13)Licensee patent similarity (F131)0.062 (7)0.6750.042110.0455 (9)0.7020.03214
Licensee patent number (F132)0.3250.021200.2980.013621
Financial Factor–Patent characteristic index (F21)Profitability (F211)0.083 (4)0.7130.05950.0908 (4)0.6560.059510
Ease of exercise of patent rights (F212)0.2870.024170.3440.031220
Financial Factor–Licensor characteristics (F22)Licensor R&D Costs (F221)0.039 (11)0.540.021190.0397 (10)0.5580.022122
Licensor sales per capita (F222)0.460.018210.4420.017526
Financial Factor–Licensee characteristics (F23)Licensee sales per capita (F231)0.07 (5)0.620.04690.1175 (3)0.7150.08415
Licensee R&D Costs (F232)0.380.028160.2850.033517
Market Factor–Patent characteristic index (F31)Development Phase & Attrition Rate (F311)0.239 (1)0.4060.09710.186 (2)0.3370.06261
IP Tradability (F312)0.3160.07630.3020.05612
Product Sales Technology Weight (F313)0.2780.06740.3610.0678
Market Factor–Licensor characteristics (F32)Licensor licensing experience (F321)0.06 (8)0.8090.04980.055 (8)0.7910.043411
Licensor Company Age (F322)0.1910.012240.2090.011524
Market Factor–Licensee characteristics (F33)Licensee licensing experience (F331)0.123 (3)0.7480.09220.217 (1)0.6090.1323
Licensee Company Age (F332)0.2520.031130.3910.08518
Environment Factor–Patent characteristic index (F41)Number of patented countries (F411)0.047 (9)0.3730.018220.056 (7)0.3860.021712
Transaction type (F412)0.6270.03150.6140.03469
Environment Factor–Licensor characteristics (F42)Licensor contract type (F421)0.033 (12)0.3150.01260.038 (11)0.3560.013525
Technology Commercialization environment (F422)0.6850.022180.6440.024416
Environment Factor–Licensee characteristics (F43)Licensee’s need to introduce technology (4231)0.065 (6)0.7980.05170.065 (6)0.7440.04836
Licensee contract type(F432)0.2020.013230.2560.016619
Value groupValue (Actor)Group 2Group 3
Weights of Factor Group (Order)Weights of FactorWeights of Overall LevelsOrderWeights of Factor Group (Order)Weights of FactorWeights of Overall LevelsOrder
Technical Factor–Patent characteristic index (F11)Technical life cycle (F111)0.177 (2)0.3220.05750.141 (2)0.1940.027318
Quality of technology (F112)0.310.05570.5270.07422
Stability of patent rights (F113)0.3680.06540.2790.039313
Technical Factor–Licensor characteristics (F12)Licensor patent number (F121)0.036 (100.2580.0093230.081 (6)0.2360.019121
Licensor patent similarity (F122)0.7420.0268130.7640.06176
Technical Factor–Licensee characteristics (F13)Licensee patent similarity (F131)0.038 (9)0.6720.0255140.105 (3)0.6530.06885
Licensee patent number (F132)0.3280.0124210.3470.036514
Financial Factor–Patent characteristic index (F21)Profitability (F211)0.061 (6)0.7840.0478100.087 (5)0.6920.06037
Ease of exercise of patent rights (F212)0.2160.0132200.3080.026819
Financial Factor–Licensor characteristics (F22)Licensor R&D Costs (F221)0.018 (12)0.5840.0103220.065 (9)0.4860.031816
Licensor sales per capital (F222)0.4160.0073260.5140.033615
Financial Factor–Licensee characteristics (F23)Licensee sales per capital (F231)0.038 (8)0.5290.0202150.075 (7)0.6090.045311
Licensee R&D Costs (F232)0.4710.018170.3910.029117
Market Factor–Patent characteristic index (F31)Development Phase & Attrition Rate (F311)0.329 (4)0.6370.209810.184 (1)0.2740.050310
IP Tradability (F312)0.2010.066220.4190.0771
Product Sales Technology Weight (F313)0.1610.05380.3070.05649
Market Factor–Licensor characteristics (F32)Licensor licensing experience (F321)0.046 (7)0.8080.037110.069 (8)0.8250.05718
Licensor Company Age (F322)0.1920.0088240.1750.012123
Market Factor–Licensee characteristics (F33)Licensee licensing experience (F331)0.083 (3)0.7860.065230.088 (4)0.8140.07164
Licensee Company Age (F332)0.2140.0177180.8160.07183
Environment Factor–Patent characteristic index (F41)Number of patented countries (F411)0.078 (4)0.3510.0272120.022 (12)0.380.008726
Transaction type (F412)0.6490.050490.620.014122
Environment Factor–Licensor characteristics (F42)Licensor contract type (F421)0.027 (8)0.2790.0076250.029 (11)0.3140.00924
Technology Commercialization environment (F422)0.7210.0196160.6860.019820
Environment Factor–Licensee characteristics (F43)Licensee’s need to introduce technology (4231)0.069 (5)0.8050.055860.053 (10)0.8330.044312
Licensee contract type (F432)0.1950.0135190.1670.008925

