1. Introduction
Cotton is an essential commercial crop worldwide. The cotton industry in the USA has been growing and is now the third largest agricultural industry in the USA, employing more than 200,000 people, with a value of
$25 billion per year [
1]. The USA is third in the production of cotton in the world, behind India and China. As a large industry, however, cotton production operations have faced multiple challenges, of which timely harvesting of quality cotton fiber is among the most pressing [
2]. Since its introduction in the 1950s, the practice of mechanical harvesting after defoliation has provided fast harvesting speed, but also substantial losses in quantity and quality of cotton [
2]. Open cotton bolls can wait up to 50 days to be picked when at least 60% to 75% of the cotton bolls are opened [
3]. Moreover, harvesting is only recommended when it is done while moisture content in fiber is less than 12% after the application of defoliants [
4]. The waiting time exposes the open bolls to harsh conditions that degrade quality. Any change that would reduce cotton losses, improve quality, and increase return on investment would be welcomed by the industry.
In most cases, the mechanical harvester is huge and expensive (a 2019 picker costs around
$725,000 and sits in storage more than nine months a year, without being used). Cotton combines also weigh more than 33 tons, which can cause soil compaction that reduces land productivity. The maintenance of such machines is also expensive and complicated [
5]. Repairing breakdowns in the field can take days, which can reduce operating efficiency and expose bolls to further weather-related quality degradation. In addition, most of the machines use proprietary software and hardware that prevent farmers from repairing their machines and, therefore, deny the use of the right-to-repair tools that they own [
6]. Finally, cotton plants must be chemically defoliated to harvest, which can cause an additional expense to the farmer [
3].
Furthermore, the labor shortage in agriculture is getting worse, while the cost and the wage of available labor are skyrocketing [
7,
8,
9]. Moreover, the average age of 58 years old among the farmer population is threatening the development of agriculture, as they are too old to attend to most of the manual work required in farming [
10]. The emergence of robotics in agriculture, particularly in specialty crops, has created an opportunity in the domain of row crops, such as cotton, which have received little attention until recently [
11,
12,
13,
14,
15]. The most recent research done by Reference [
15] discussed many kinds of robots and found that, currently, there are more robots developed in harvesting. Still, they did not mention any robotic system for cotton harvesting [
15]. To the best of our knowledge, there have been no commercial cotton-harvest robots developed [
14]. Most robotic harvesting investigations are examining how fruit can be picked individually to mimic conventional hand-harvesting [
11,
14].
Consequently, robotics may provide an efficient and cost-effective alternative for small farmers unable to buy and own large machines [
11,
12,
16,
17]. To achieve a robust robotic harvesting system, the robot designs must consider four aspects carefully: sensing, mobility, planning, and manipulation [
14]. Locomotion, stability, and balancing in mobility is so challenging in agricultural robots because they move on uneven terrain, and oscillations might alter their position easily; hence, sensors like LIDAR and GPS can be utilized to help the machine to maintain its path efficiently [
18,
19,
20,
21]. Hence, a predefined navigation path and a Real-Time Kinematic–Global Navigation Satellite System RTK–GNSS can provide absolute path following for row crops, but the design of the manipulators must be considered carefully to match the harvesting speed and efficiency of harvest requirements to be economically viable for farmers. There have been several approaches proposed by scientists using high Degree-of-Freedom (DOF) manipulators. Nonetheless, the systems have proven to be slow because of the extensive matrix calculations required to determine joint manipulations that move the end-effector to the fruit for harvesting [
22]. For row-crops with a high number of fruits to harvest, the best option would be a capable manipulator that harvests while moving. A potential solution is to use multiple harvesting manipulators with low degrees of freedom.
In this study, a four-wheel center-articulated hydrostatic rover with a 2DOF Cartesian manipulator that moves linearly, vertically, and horizontally was developed. The kinematics of the manipulator were analyzed to calculate the arm trajectories for picking cotton bolls. Image-based visual servoing was achieved by using a stereo camera to detect and localize cotton bolls, determine the position of the end-effector, and decide the movement and position of the rover. Additionally, a Proportional-Integral-Derivative Controller (PID) control was developed to enhance the robot’s movement and control position along the cotton rows, using feedback control after obtaining visual information. A PID was used to control the hydrostatic transmission, which rotated to the robot’s tires. The articulation angle was controlled by using a proportional controller to ensure that the vehicle maintained its path within the cotton rows. The robot used an extended Kalman filter to fuse the sensors to localize the rover’s position while harvesting cotton bolls [
23]. Therefore, the specific objectives of this study were as follows:
To design and develop a cotton harvesting robot, using a center-articulated hydrostatic rover and 2D Cartesian manipulator; and
To perform preliminary and field experiments of the cotton-harvesting rover.
2. Materials and Methods
2.1. System Setup
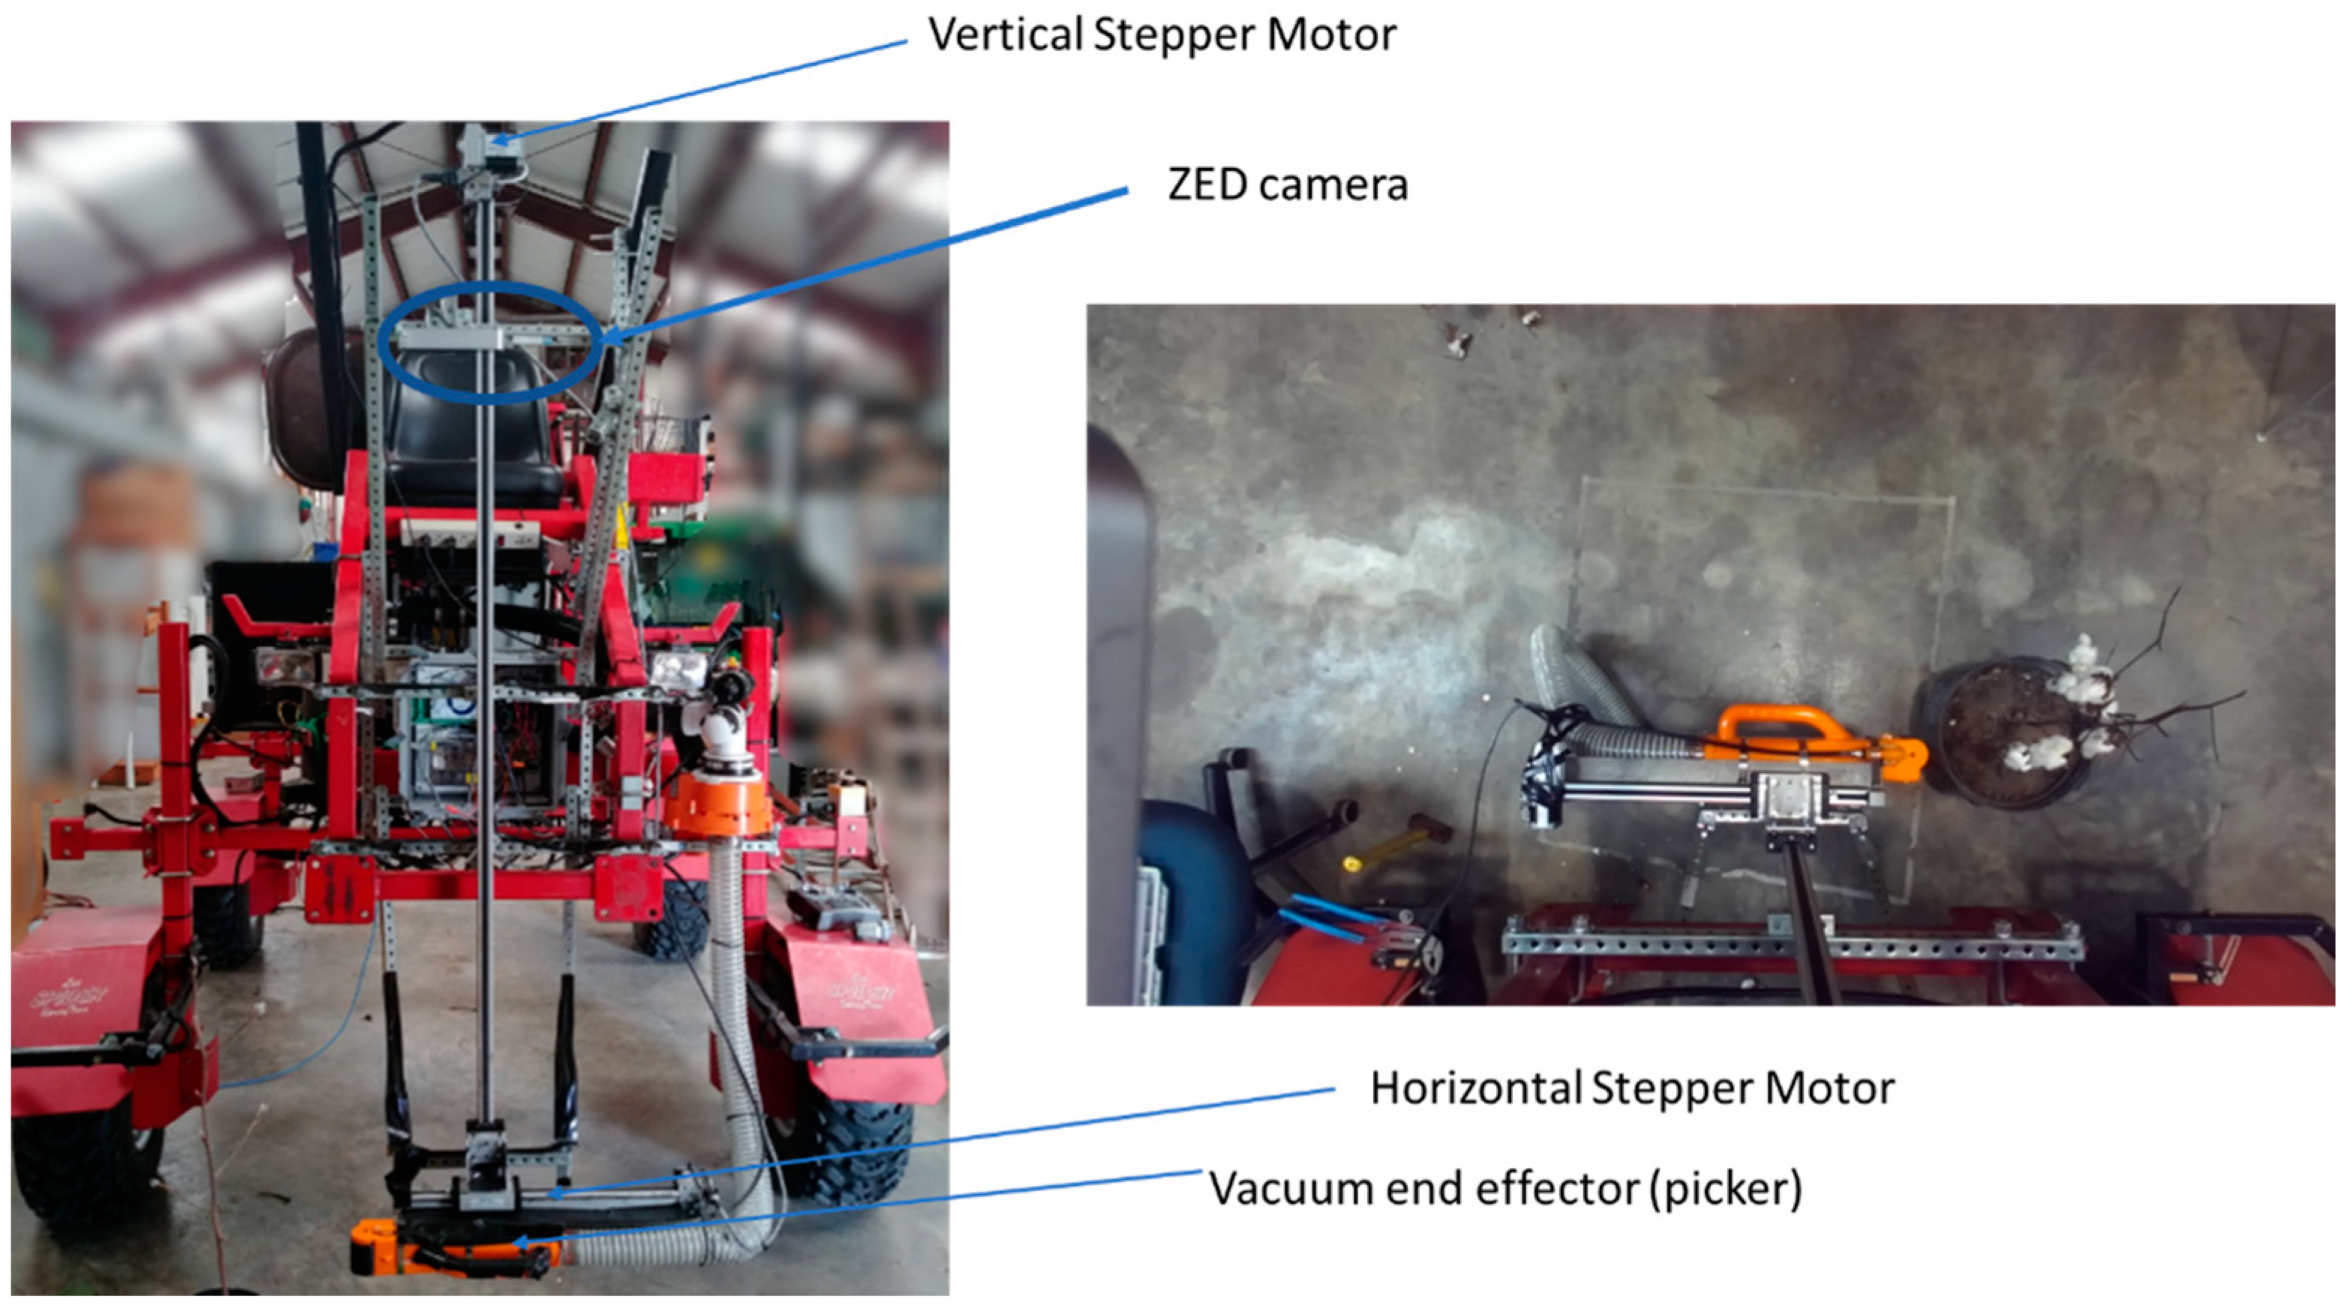
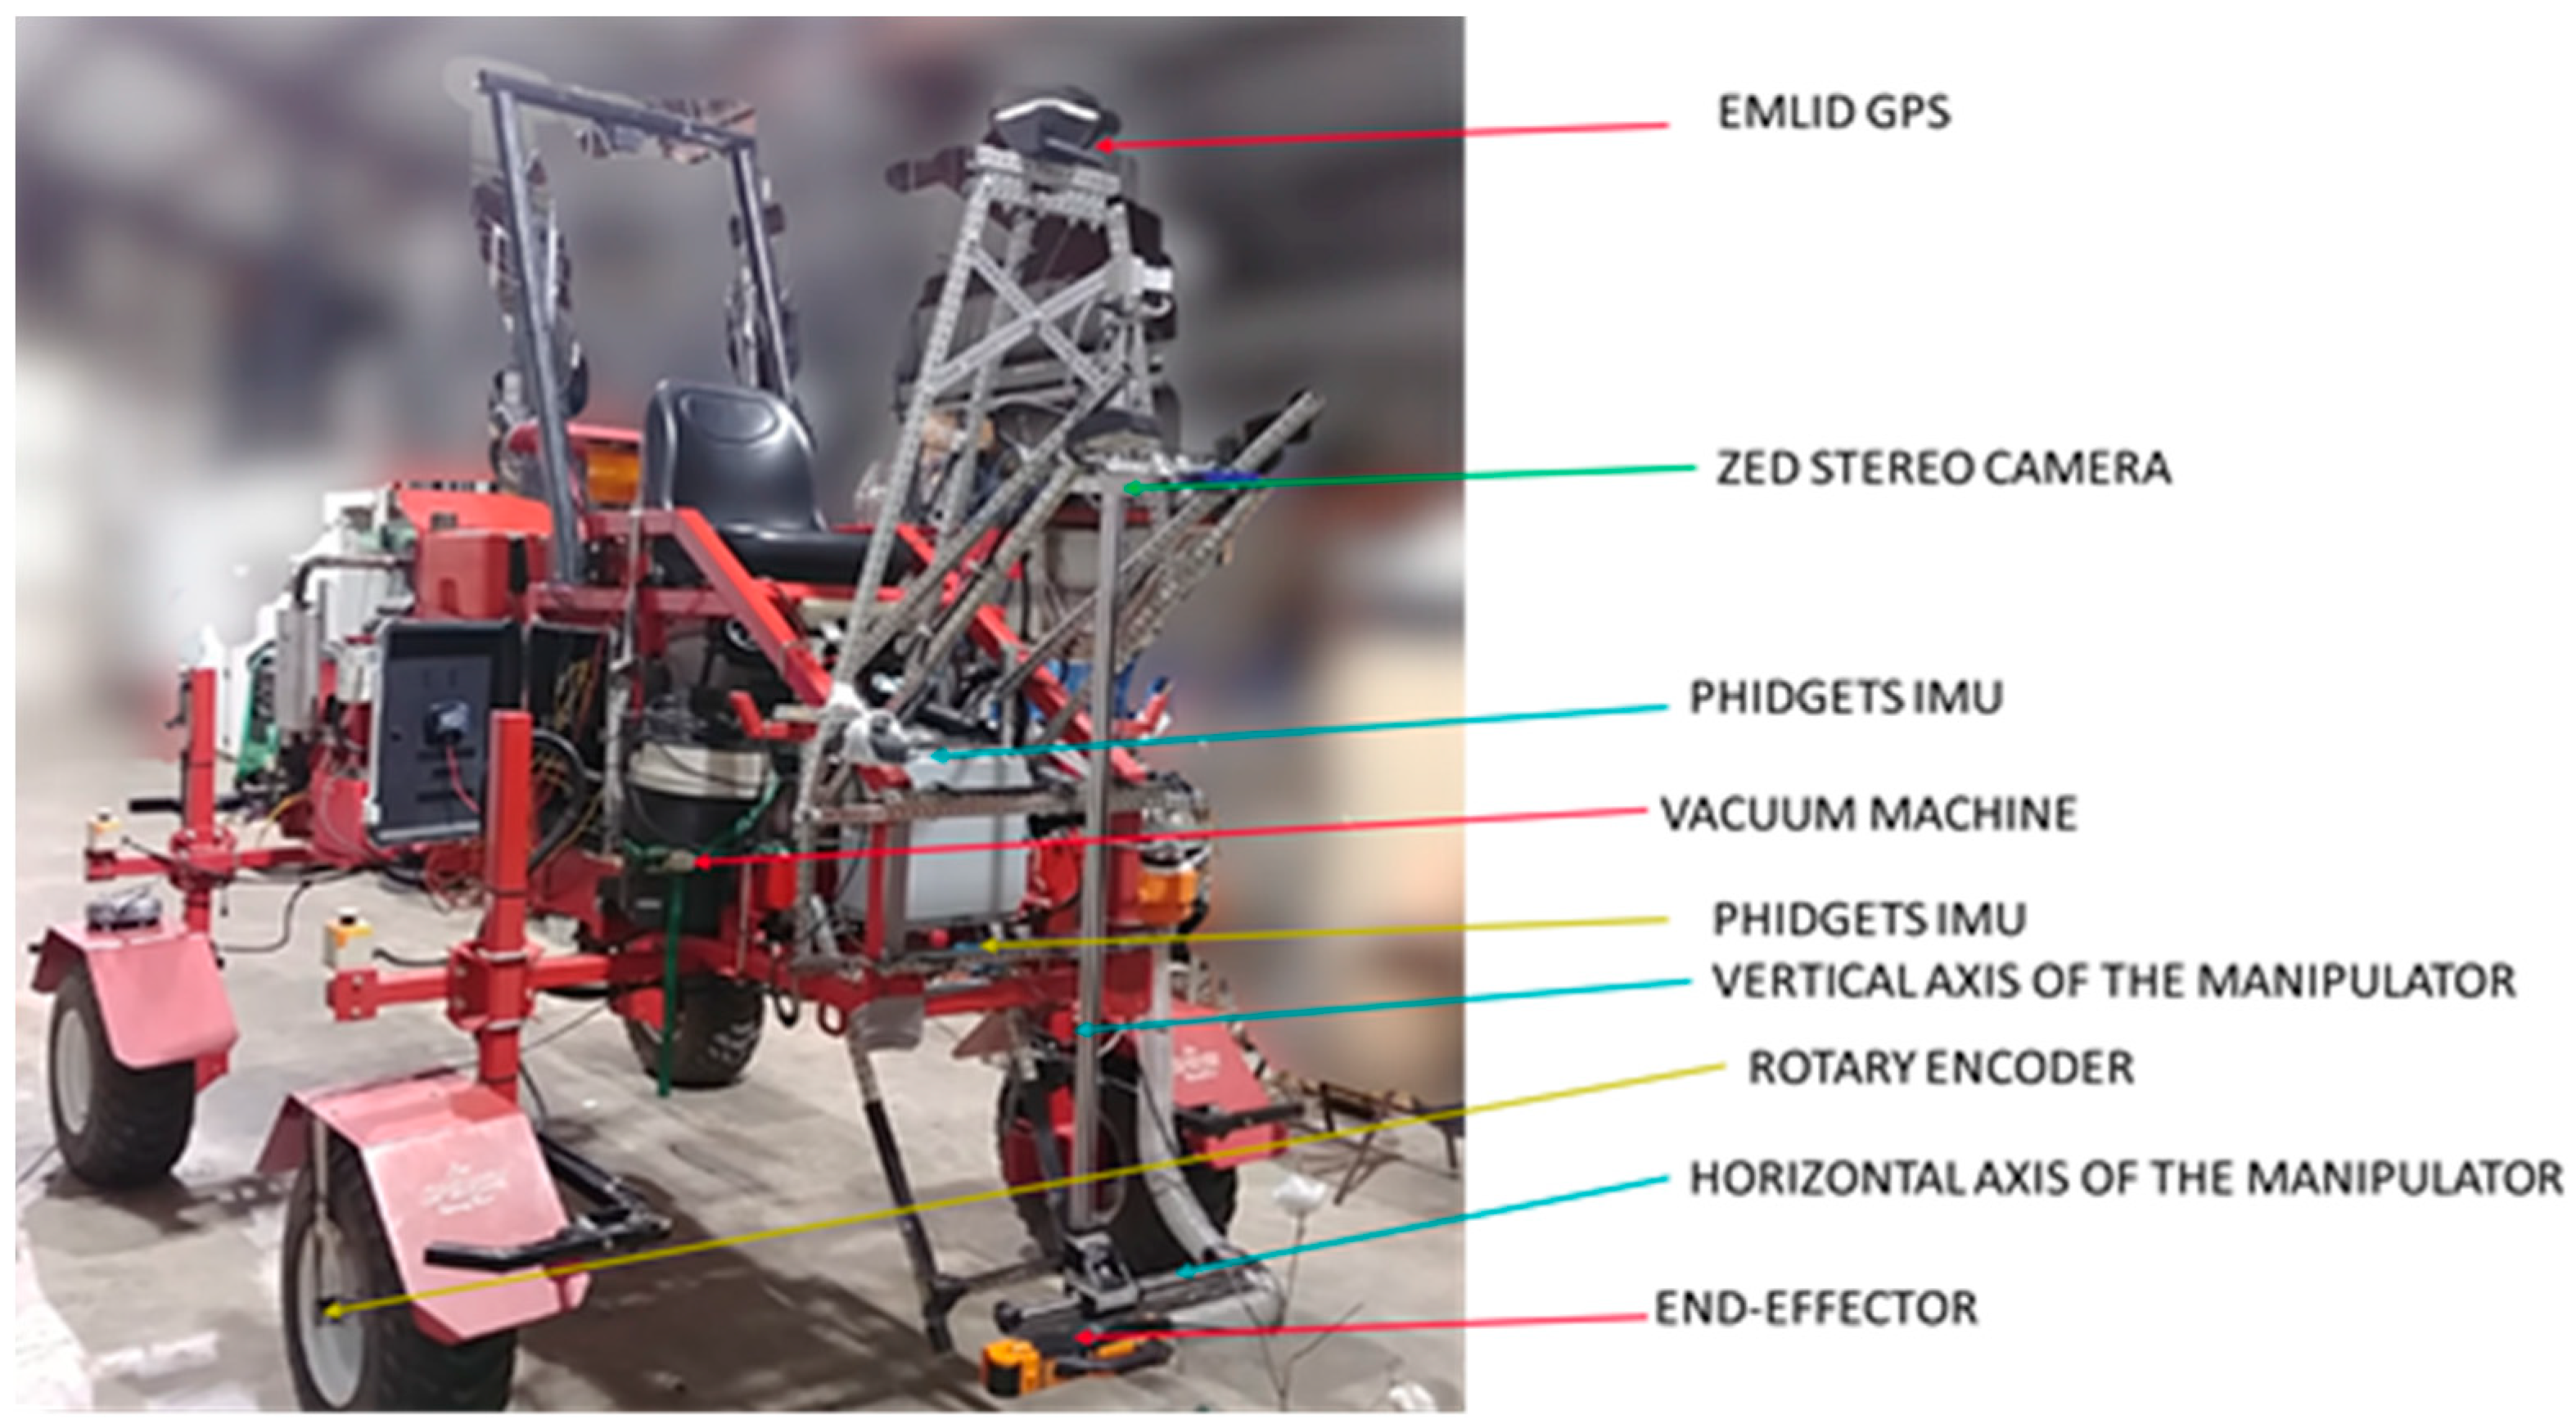
The rover (
Figure 1 and
Figure 2) used in this study was a four-wheel hydrostatic vehicle (West Texas Lee Corp., Lubbock, Texas) that was customized to be controlled remotely by using an embedded system to navigate autonomously in an unstructured agricultural environment [
24,
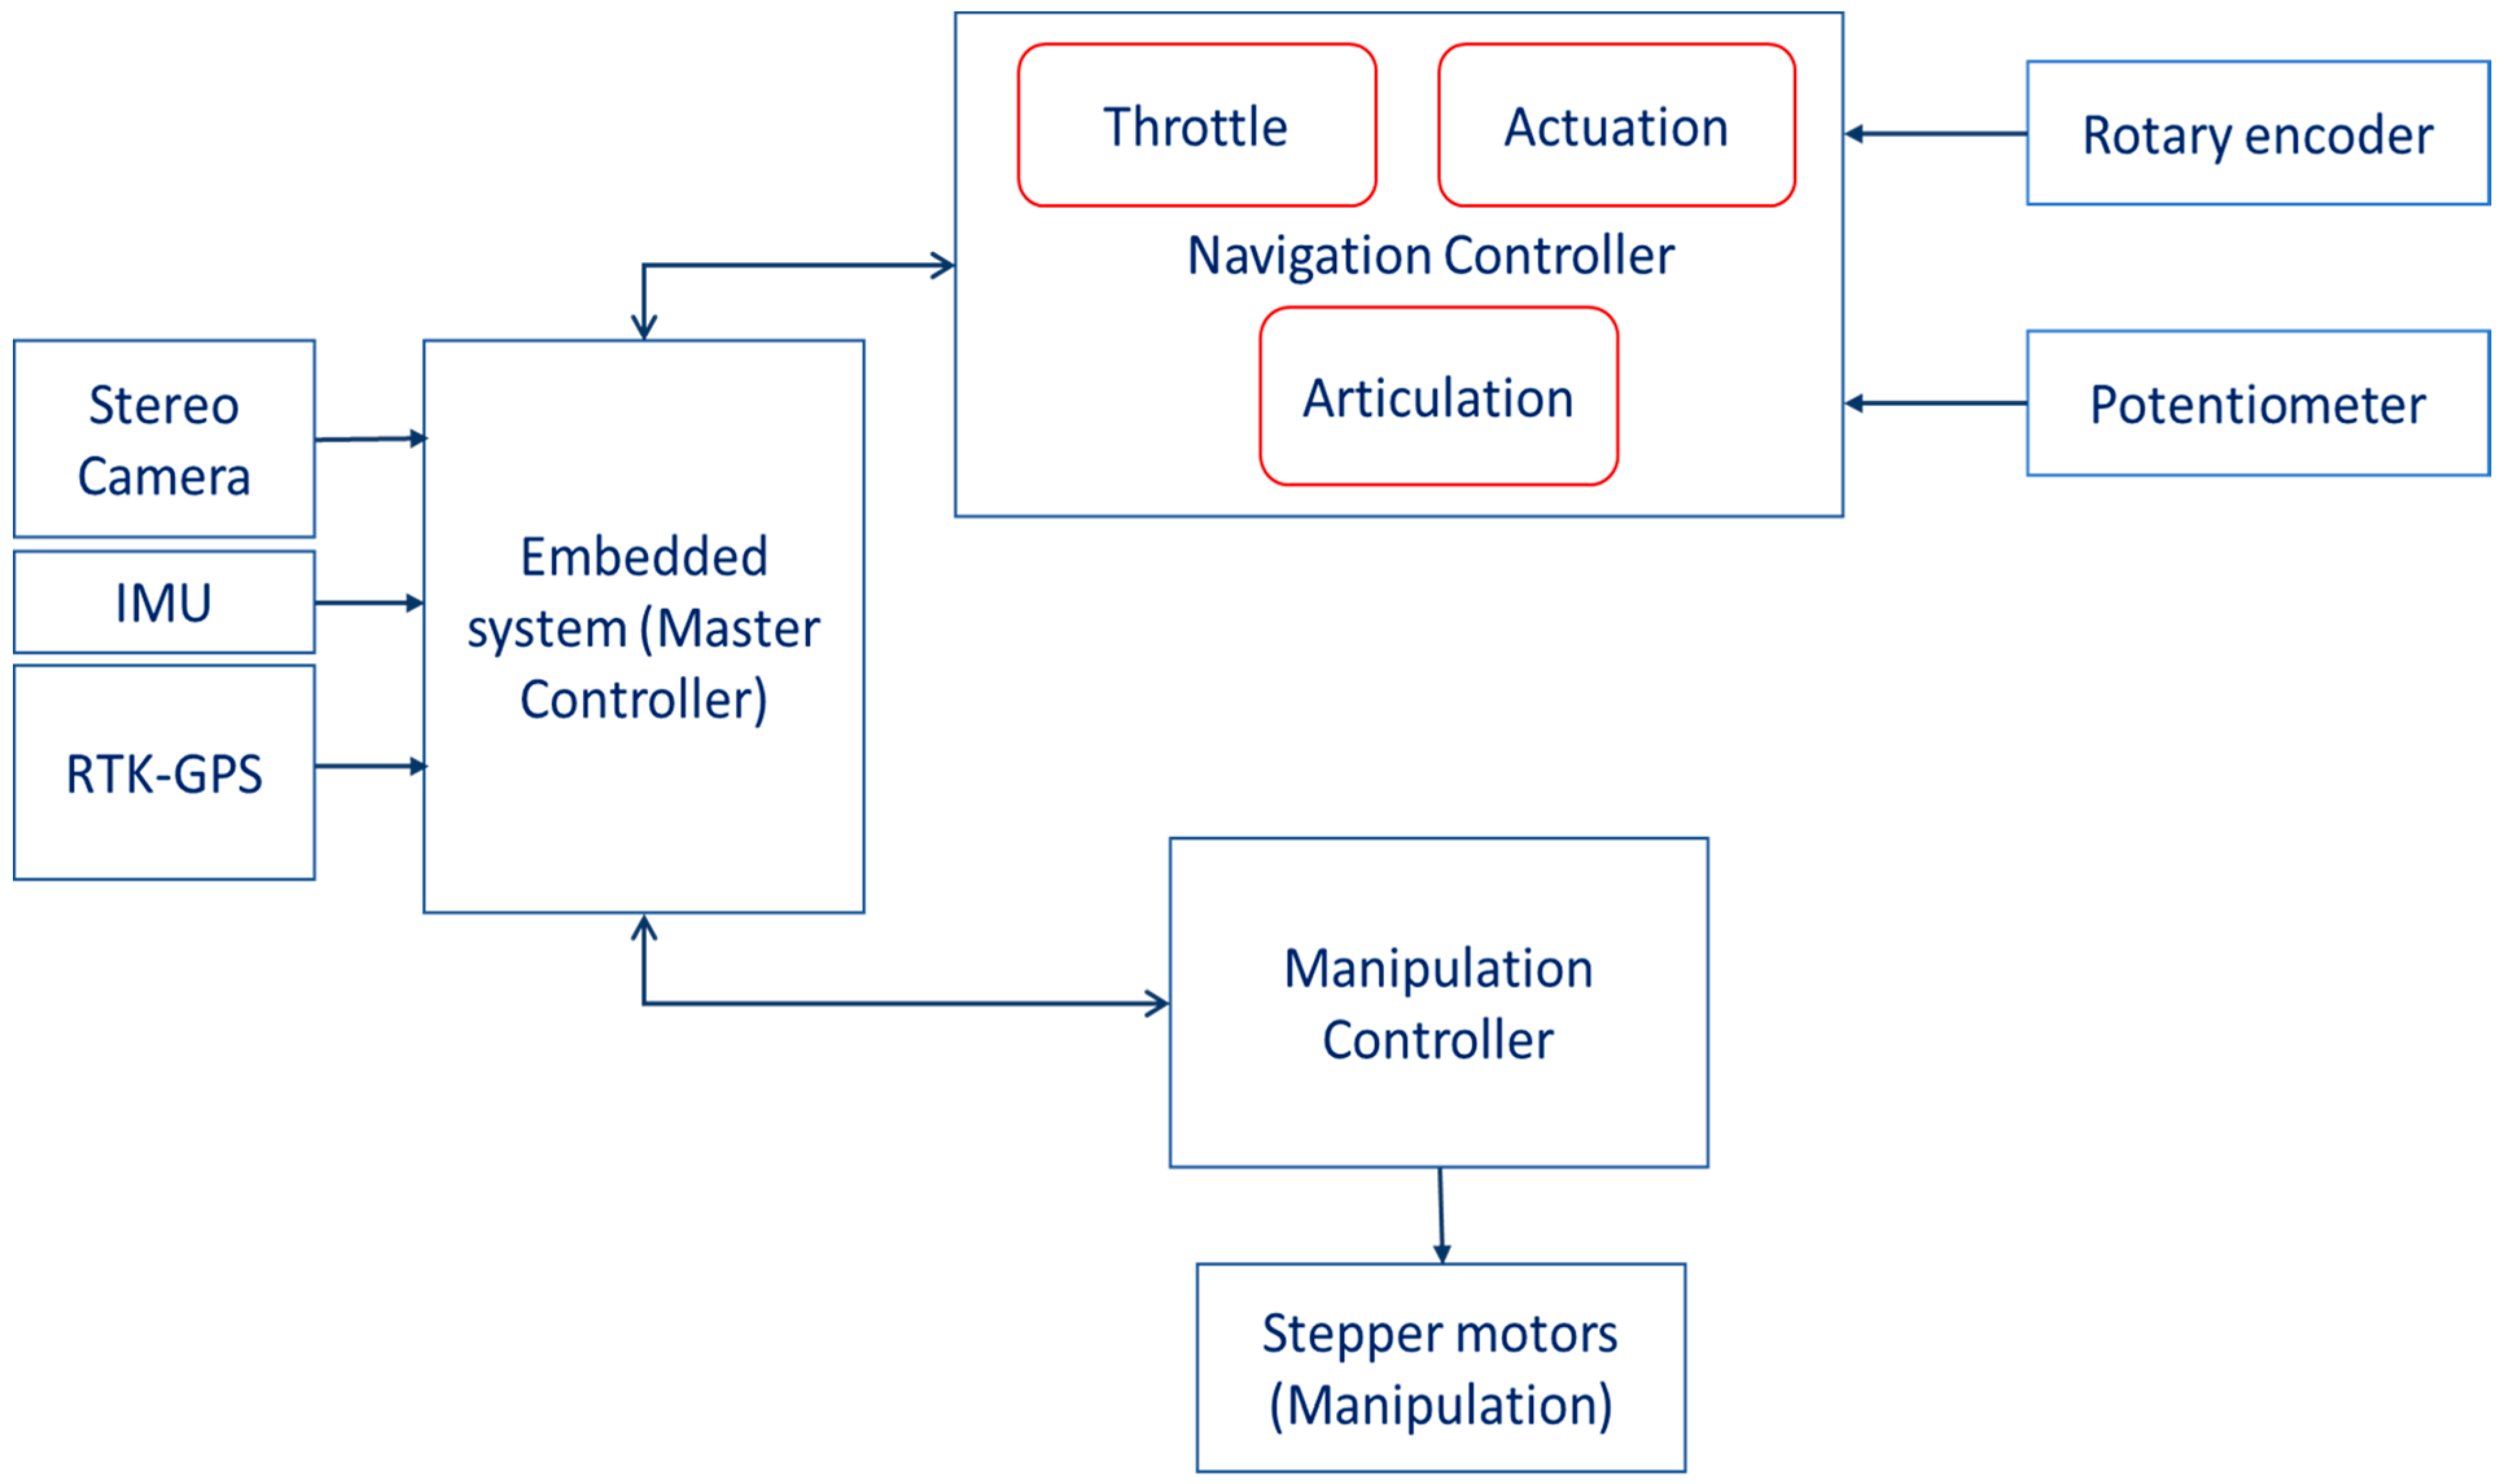
25]. The rover was 340 cm long and with front and back parts being 145 cm and 195 cm long, respectively. The rover was 212 cm wide, with a tire width of 30 cm. Each of the four tires had a radius of 30.48 cm and a circumference of 191.51 cm. The rover’s front-axle and rear-axle were 91 cm from the center of the vehicle, and the ground clearance was 91 cm. To make turns, the rover articulated (bent) in the middle. A 2DOF manipulator was attached to the front of the rover. The manipulator consisted of two parts: a horizontal axis, which was 70 cm, and a vertical axis, which was 195 cm. The manipulator was placed in the front of the rover with a 27 cm ground clearance. The rover had three electronic controllers: a master controller, navigation controller, and manipulation controller.
2.2. Master Controller System
The master controller (
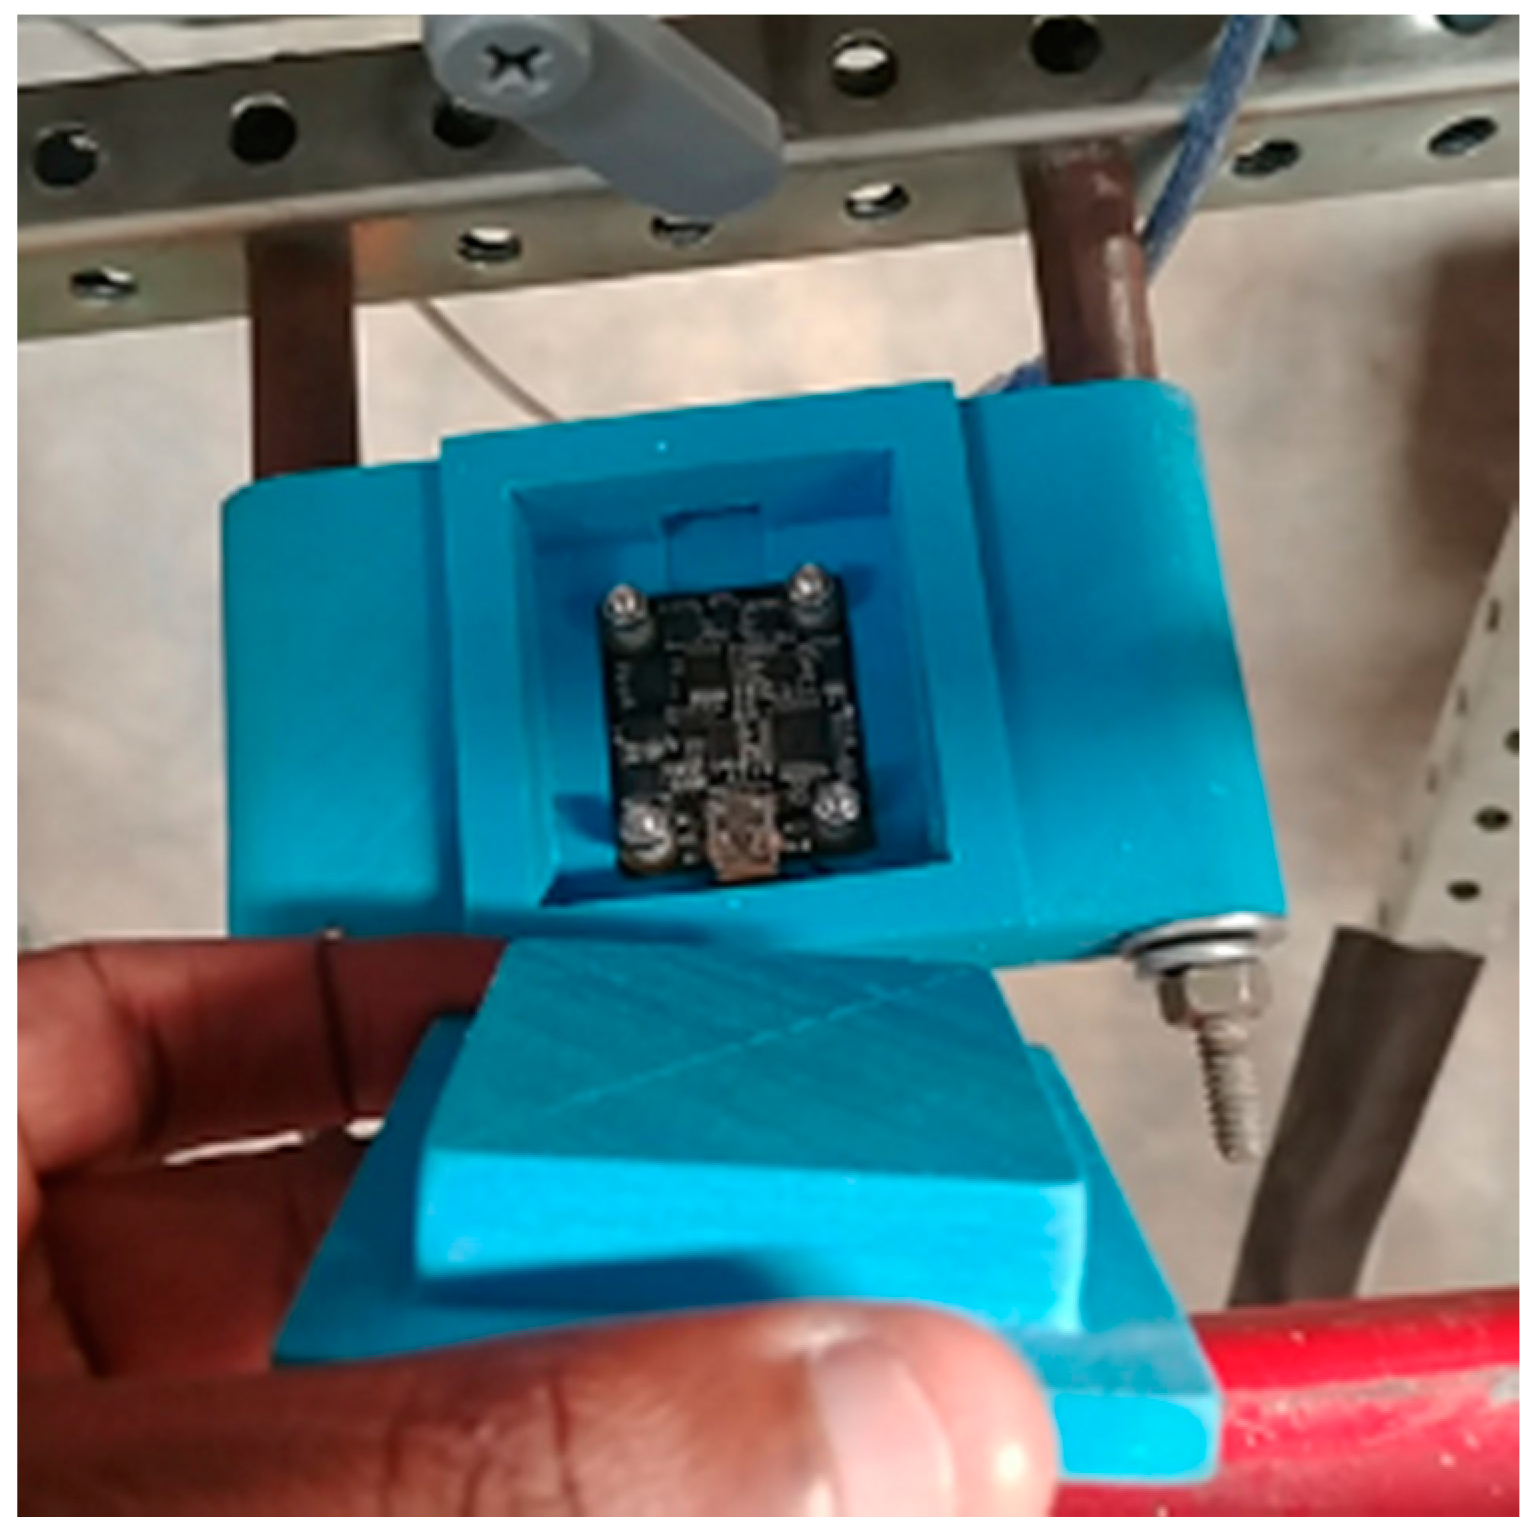
Figure 3) was installed with the embedded system (NVIDIA Jetson AGX Xavier development kit, Nvidia Corp., Santa Clara, CA, USA) connected to four sensors: two Inertial Measurement Units (IMUs), a stereo camera, and an RTK–GPS. IMUs were publishing data at 120 Hz, while the RTK–GPS was publishing data at 5 Hz. The two IMUs (Phidget Spatial Precision 3/3/3 High-Resolution model 1044_1B, Calgary, AB, Canada) were placed in front of the rover. The first IMU was placed 95 cm above the ground and 31 cm from the front of the vehicle (
Figure 4). The second IMU was placed 132 cm above the ground and 46 cm from the front of the vehicle. The RTK–GNSS receiver (EMLID Reach R.S., Mountain View, CA, USA) with an integrated antenna was placed 246 cm above the ground and 30 cm from the front of the vehicle. The RTK correction signal was obtained by using NTRIP signal (eGPS Solutions, Norcross, GA, USA) with a mounting point within 2 miles of the test plot and downloaded to the Emlid through a Verizon modem (Inseego Jetpack MiFi 8800L, Verizon Wireless, New York, NY, USA) hotspot and 802.11 wireless signals.
An RGB stereo camera (a ZED camera, Stereo labs Inc., San Francisco, CA, USA) was installed and used to acquire images. The ZED was 175 mm × 30 mm × 33 mm and had 4M pixel sensor per lens with large 2-micron pixels. The left and right sensors were 120 cm apart. The sensor was placed 220 cm above the ground in front of the vehicle, facing downward, so it could image cotton bolls. The sensor took 720 p resolution images at the rate of 60 frames per second. The ZED camera was chosen because of the need to work outdoors and provide depth data in real time. The ZED camera provided a 3D rendering of the scene, using the ZED Software Development Kit (SDK), which was compatible with the robot operating system (ROS) and OpenCV library.
ROS provided all the services required for robot development, such as device drivers, visualizers, message-passing, package design, and management and hardware abstraction [
26]. ROS was initiated remotely by using a client machine, and images were acquired directly from the ZED SDK, which took images and processed the 3D point clouds. Then, images were parsed to the processing unit and analyzed by using OpenCV (version 3.3.0) machine vision algorithms.
2.3. Rover Navigation Controller Using Extended Kalman Filter for Robot Localization
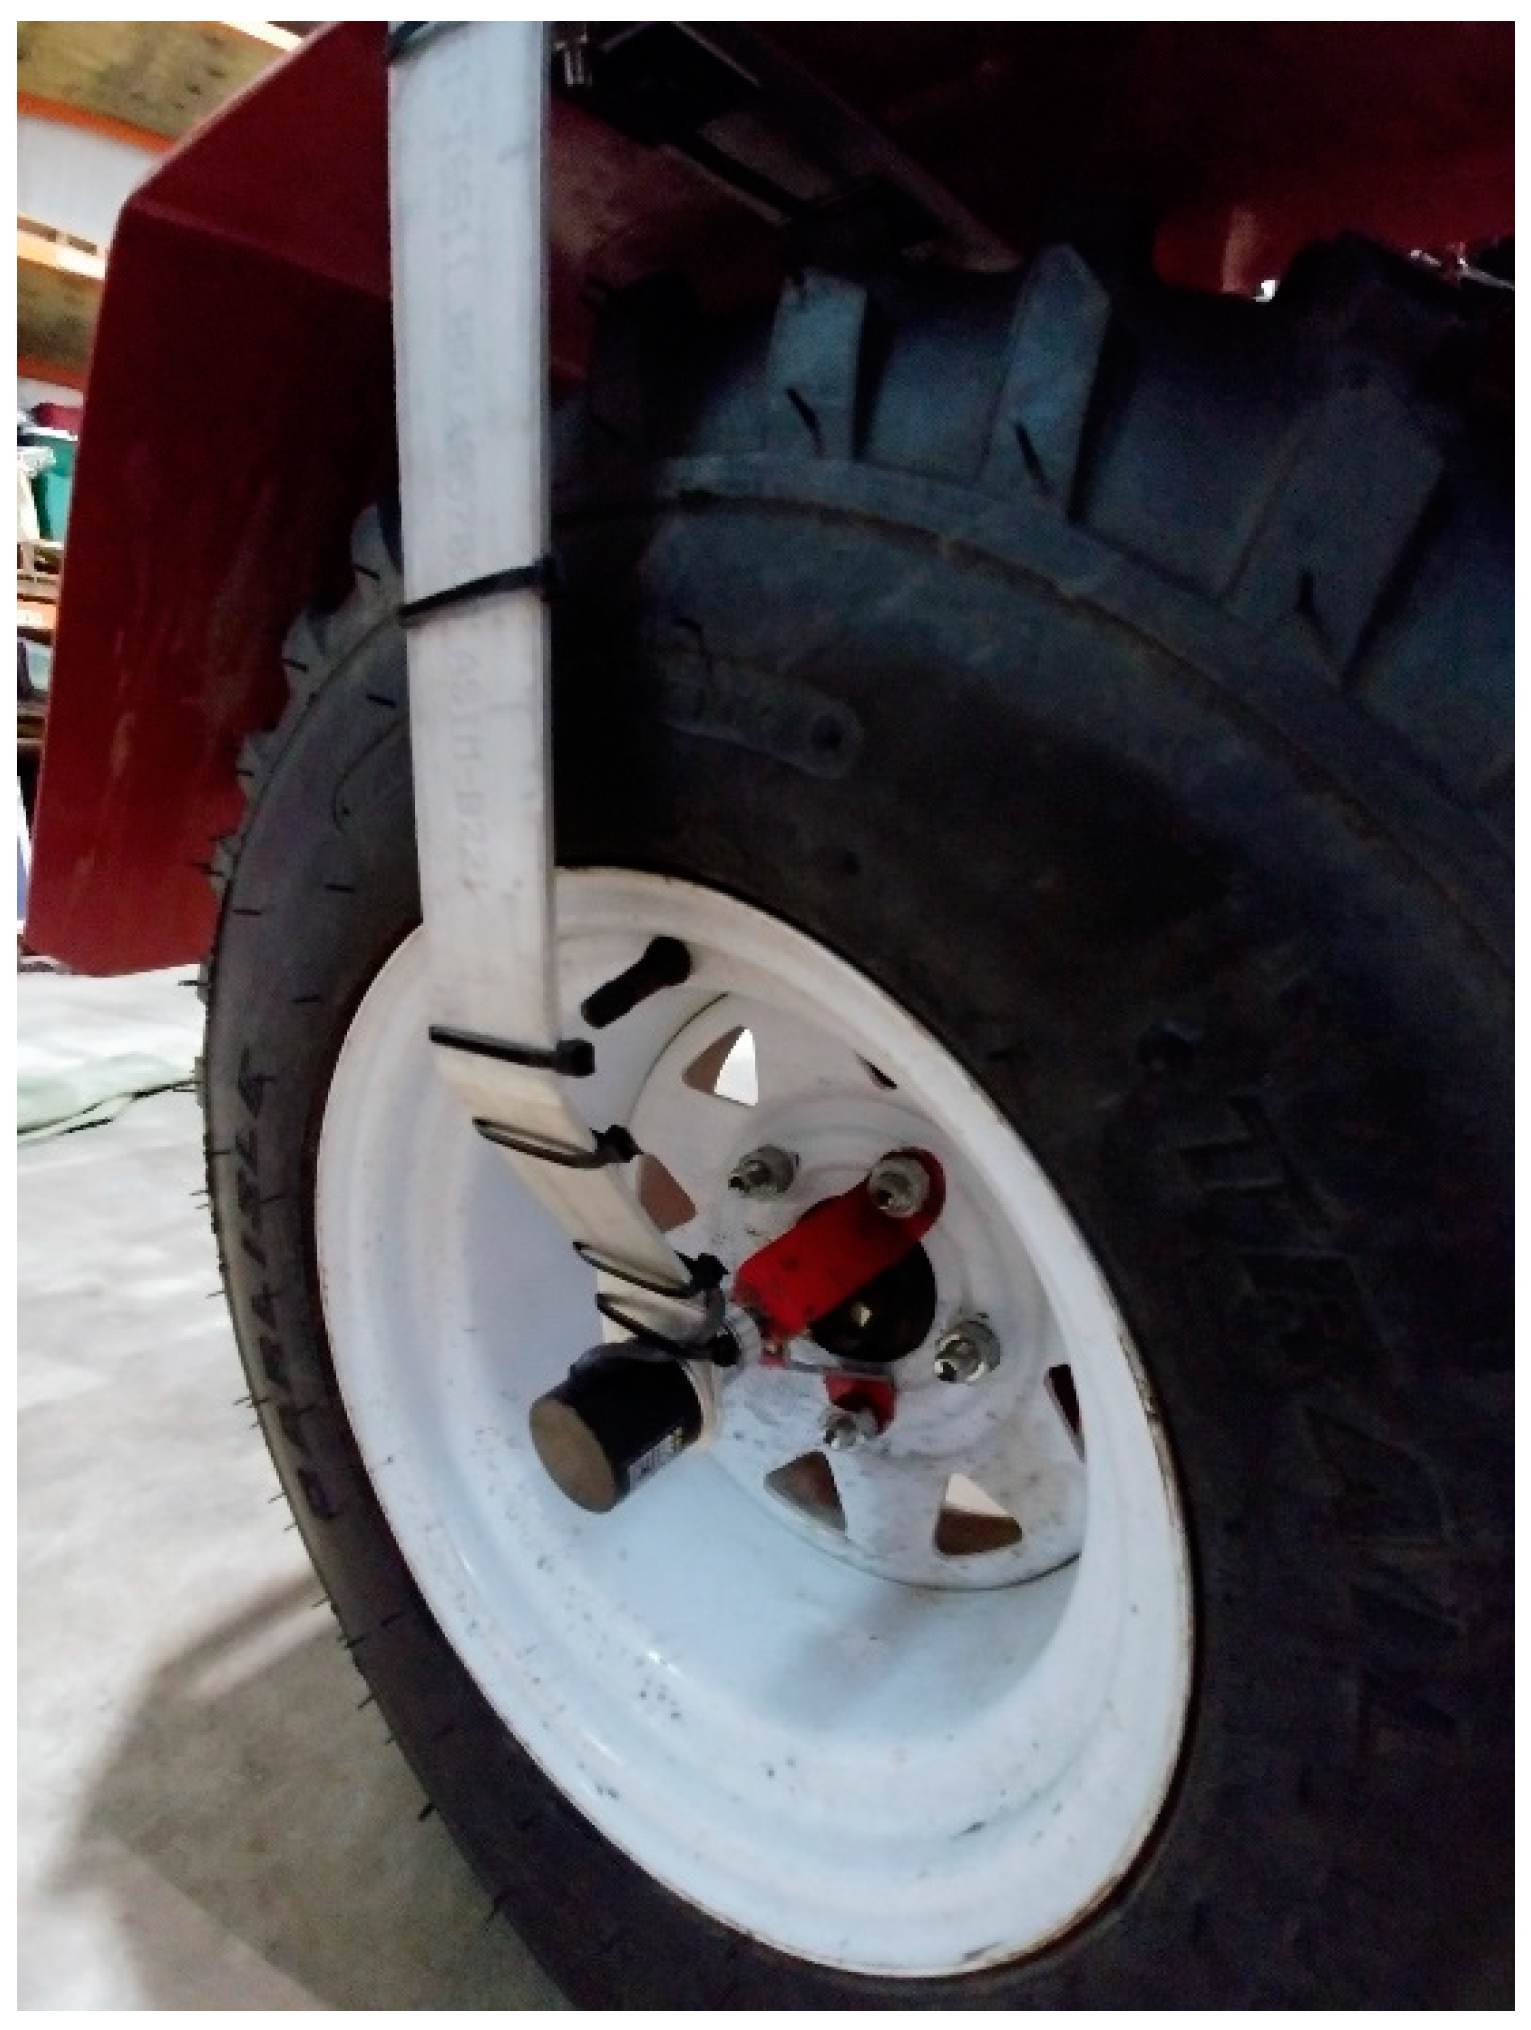
The front two wheels of the rover were connected to rotary encoders (Koyo incremental (quadrature) TRDA-20R1N1024VD, Automationdirect.com, Atlanta, GA, USA). The encoders (
Figure 5) were connected to the Rover navigation controller (Arduino Mega 2560, Arduino LLC, Somerville, MA, USA), using four wires (signal A, signal B, power, and ground) to register wheel rotation by detecting the rising edge of the generated square waves. A high-precision potentiometer (Vishay Spectral Single Turn, Malvern, PA, USA) reported the articulation angle of the vehicle by measuring the electric potential caused by the turn of the vehicle. The potentiometer was connected to the rover navigation controller.
The rover navigation controller received a signal from the embedded computer to control the rover articulation, actuation, and throttling. The sensors (RTK–GNSS, IMU, and encoders) were fused by using a ROS software package “robot_localization” [
23]. The package “robot_localization” provided continuous nonlinear state estimation of the mobile vehicle in a 3D space by using signals obtained from the RTK–GPS, two IMUs, and wheel encoders. The fusion of the data was done by using state estimation node “ekf_localization_node” and “navstat_transform_node” [
23]. The vehicle was configured using the procedure described in
http://docs.ros.org. The IMUs published two ROS topics (imu_link1/data and imu_link2/data), the encoders published wheel odometry (/wheel_odom), and RTK–GNSS published /gps/fix signal. The topics were both sent to ekf_localization to get vehicle state estimation simultaneously [
23]. The system used two IMUs, RTK–GNSS, and odometry of the encoders, because
Table 1 shows that this configuration provided excellent results [
23]. Unlike the GNSS configuration shown in
Table 1, our GNSS was a low-cost RTK–GNSS system that provided centimeter-level accuracy, so configuration (odometry + two IMUs + one GNSS) was a proper configuration to adopt.
The hydraulic motors mounted to the rover wheels were controlled by using a servo to the engine throttle and a servo to the variable-displacement pump swashplate arm. Each front tire was connected to a rotary encoder to provide feedback on the movement of the rover along the crop rows. The throttle was connected to the onboard Kohler Command 20 HP engine (CH20S, Kohler Company, Sheboygan, WI, USA) with a maximum of 2500 RPM and driving an axial-piston variable rate pump (OilGear, Milwaukee, WI, USA) with a maximum displacement of 14.1 cc/rev. The OilGear pump displacement was controlled by a swashplate for directing the forward and rearward movement of the rover. The swashplate angle was controlled by the rover controller, which determined the placement of the linear electric servo (Robotzone HDA4, Servocity, Winfield, KS, USA). Left and right articulations were controlled by using linear hydraulic actuators connected to a 4-port 3-way open-center directional control valve (DCV) powered by a 0.45 cc/rev fixed displacement pump (Bucher Hydraulics, Klettgau-Griessen, Germany) in tandem with the Oilgear pump. The rover could turn a maximum of 45 degrees with a wheelbase of 190 cm.
2.4. Manipulation Controller
The robot manipulation controller received a 4-byte digital signal from the Jetson Xavier embedded computer. The signal provided the number of steps and direction of the manipulator (up, down, back, and forth). Then, the controller sent the signal to the micro-stepping drive (Surestep STP-DRV-6575 micro-stepping drive, AutomationDirect, Cumming, GA, USA), which in turn sent it to the appropriate stepper signal for action. The manipulator controller was connected to the Jetson, using a USB 3.0 hub shared by the ZED camera.
The robotic manipulator was designed to work within a two-dimensional Cartesian coordinate system (
Figure 6). Each arm of the manipulator was moved by using two 2-phase stepper motors (MS048HT2 and MS200HT2, ISEL Germany AG, Eichenzell, Germany). The MS048HT2 model stepper motor was installed to drive the horizontal linear axis arm (60 cm long), and the MS200HT2 to drive the vertical linear axis arm (190 cm long). The connecting plates and mounting brackets used a toothed belt that was driven by the stepper motor. Two micro-stepping drives (Surestep STP-DRV-6575 micro-stepping drive, Automation Direct, Cumming, GA, USA) were installed to provide accurate position and speed control with a smooth motion. The micro-stepping drive DIP switch that controlled the motors was set to run a step pulse at 2 MHz and 400 steps per revolution. This setting provided smooth motion for the manipulator. The step angle was 1.8°. The arms of the manipulator were connected in a vertical crossbench Cartesian configuration (
Figure 2 and
Figure 6). The sliding toothed belt drive (Lez 1, ISEL Germany AG, Eichenzell, Germany) was used to move the end effector. The toothed belt had 3 mm intervals and was 9 mm wide. The error of the toothed belt was ±0.2 mm per 3 mm interval.
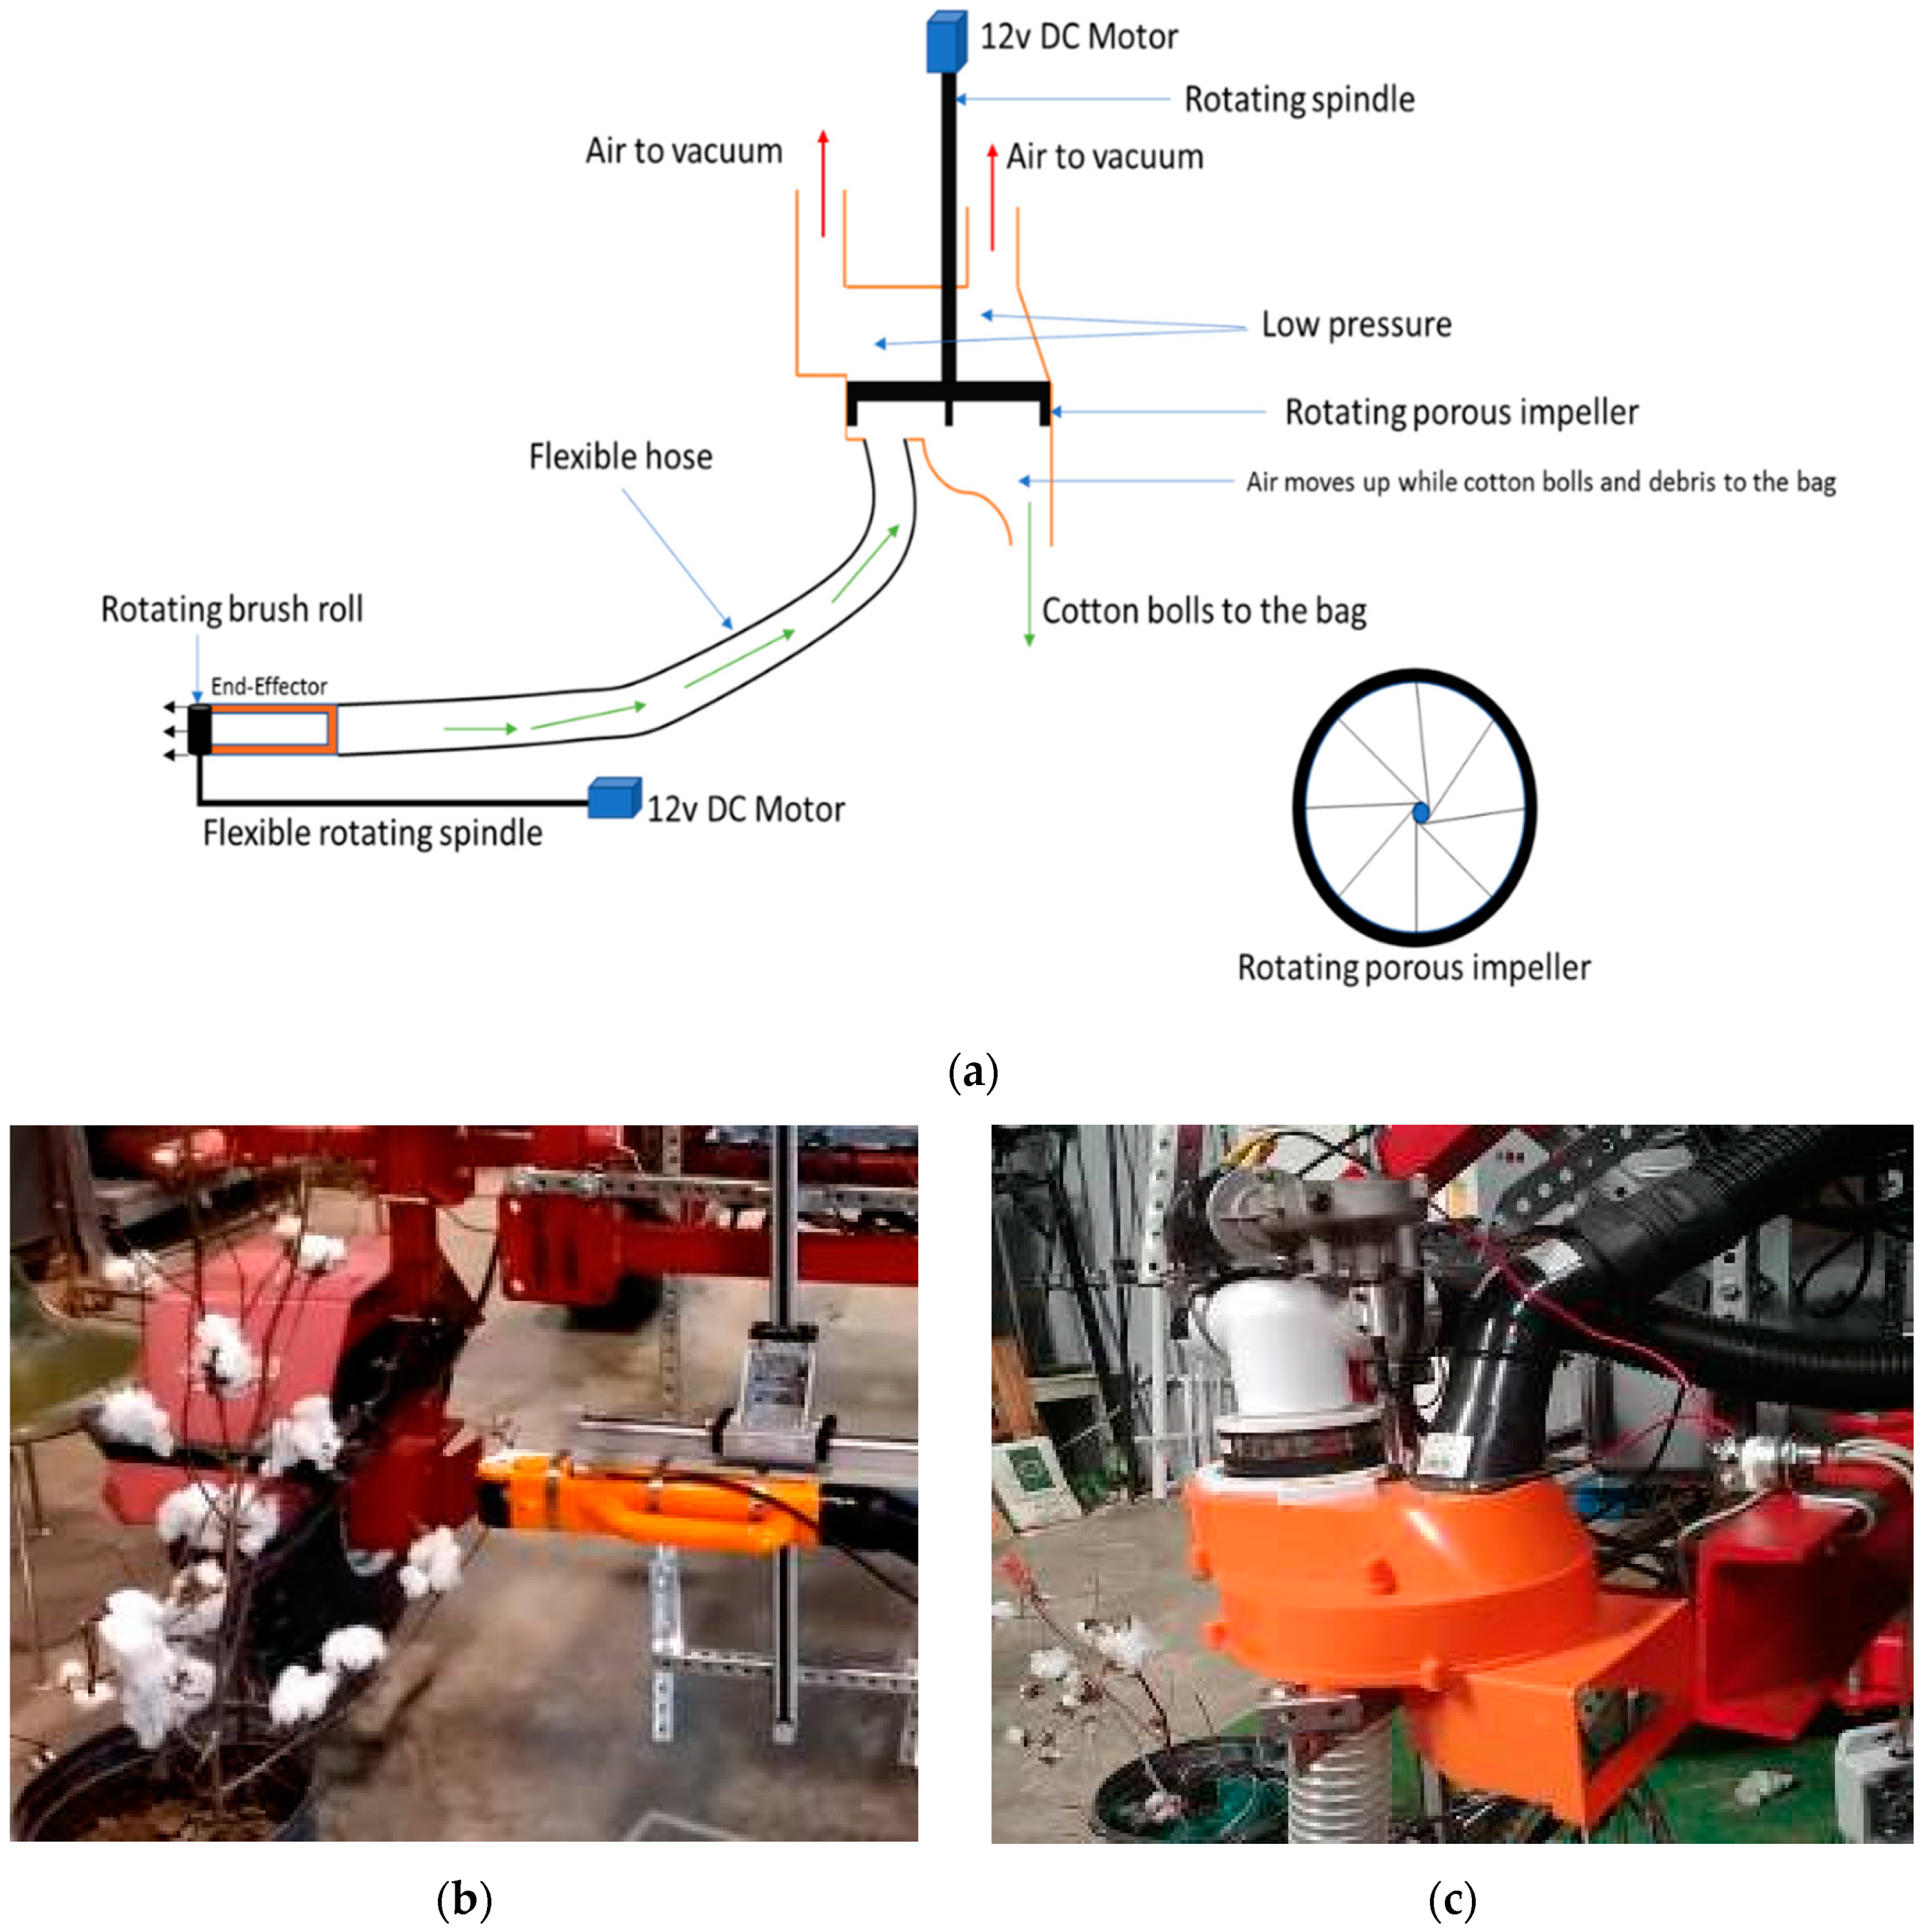
A 2.5 hp wet/dry vacuum was installed on the rover, to help pick and transport the picked cotton bolls—the vacuum connected to the end-effector via a 90-cm flexible plastic hose. Cotton bolls were vacuumed into the hose, which was placed close to the cotton bolls (
Figure 7). The end-effector had a rotating brush roller that grabbed and pulled cotton bolls, using a combination of vibration, rotation, and sweeping motions. The brush roll was powered by a 12 VDC motor (
Figure 7). The cotton bolls were grabbed and passed through a flexible hose to a porous impeller mounted with the suction opening from the vacuum. The porous impeller was rotated by using the 12 VDC motor, and the cotton bolls were dropped into a bag.
2.5. Boll Detection Algorithm Improvements Using Tiny YOLOv3
Cotton boll images were used to train a tiny YOLOv3 deep neural network model [
27]. The tiny YOLOv3 is a simplified version of YOLOv3, which has seven convolutional layers [
27]. Tiny YOLOv3 is optimized for speed with reduced accuracy compared to YOLOv3 [
27]. The images were augmented 26 times, using various techniques, namely average blurring, bilateral blurring, blurring, cropping, dropout, elastic deformation, equalize histogram, flipping, gamma correction, Gaussian noise, Gaussian blurring, median blurring, raise blue channel, raise green channel, raise hue, raise red channel, raise saturation, raise value, resizing, rotating, salt and pepper, sharpen, shift channels, shearing, and translation. Augmentation was accomplished by using the CLoDSA library. CLoDSA is an open-source image augmentation library for object classification, localization, detection, semantic segmentation, and instance segmentation [
28]. We collected and labeled 2085 images from the Internet and camera images. The new augmented and labeled image dataset consisted of 56,295 images.
The dataset was used to train the tiny YOLOv3 model, using a Lambda Server (Intel Core i9-9960X (16 Cores, 3.10 GHz) with two GPUs RTX 2080 Ti Blowers with NVLink and Memory of 128 GB, Lambda Computers, San Francisco, CA 94107, USA). The learning rate was set to 0.001 and maximum iterations to 2000 [
27]. The batch size was 32. The model was trained for 4 h and then frozen, a process of combining graph and trained weights, and transported to the rovers’ embedded system.
The ZED Library, Zed-YOLO in Github [
29], the free open-source library package provided by the manufacturer of the ZED camera (Stereolabs Labs), was used to connect ZED camera images to tiny YOLOv3 model to perform object detection. The library used image bilinear interpolation to convert ZED SDK images to OpenCV images so that it could perform detection tasks. The bilinear interpolation was compared with the nearest-neighbor and no interpolation, to evaluate object detection. The results (
Figure 8) show that the model performed well when no interpolation was applied (
Figure 8c). The images in
Figure 8 show that the bilinear interpolation detected only three bolls, the nearest-neighbor interpolation detected five bolls, and with no interpolation, the system detected eight bolls. Therefore, the boll detection algorithm improved its accuracy when no interpolation was performed. The library code was modified to avoid image interpolation and implemented in this study. The algorithm was able to perform well with illuminated images of undefoliated cotton (
Figure 9), where the right image in
Figure 9 shows cotton boll detection in natural direct sunlight.
2.6. End-Effector Detection Using Color Segmentation
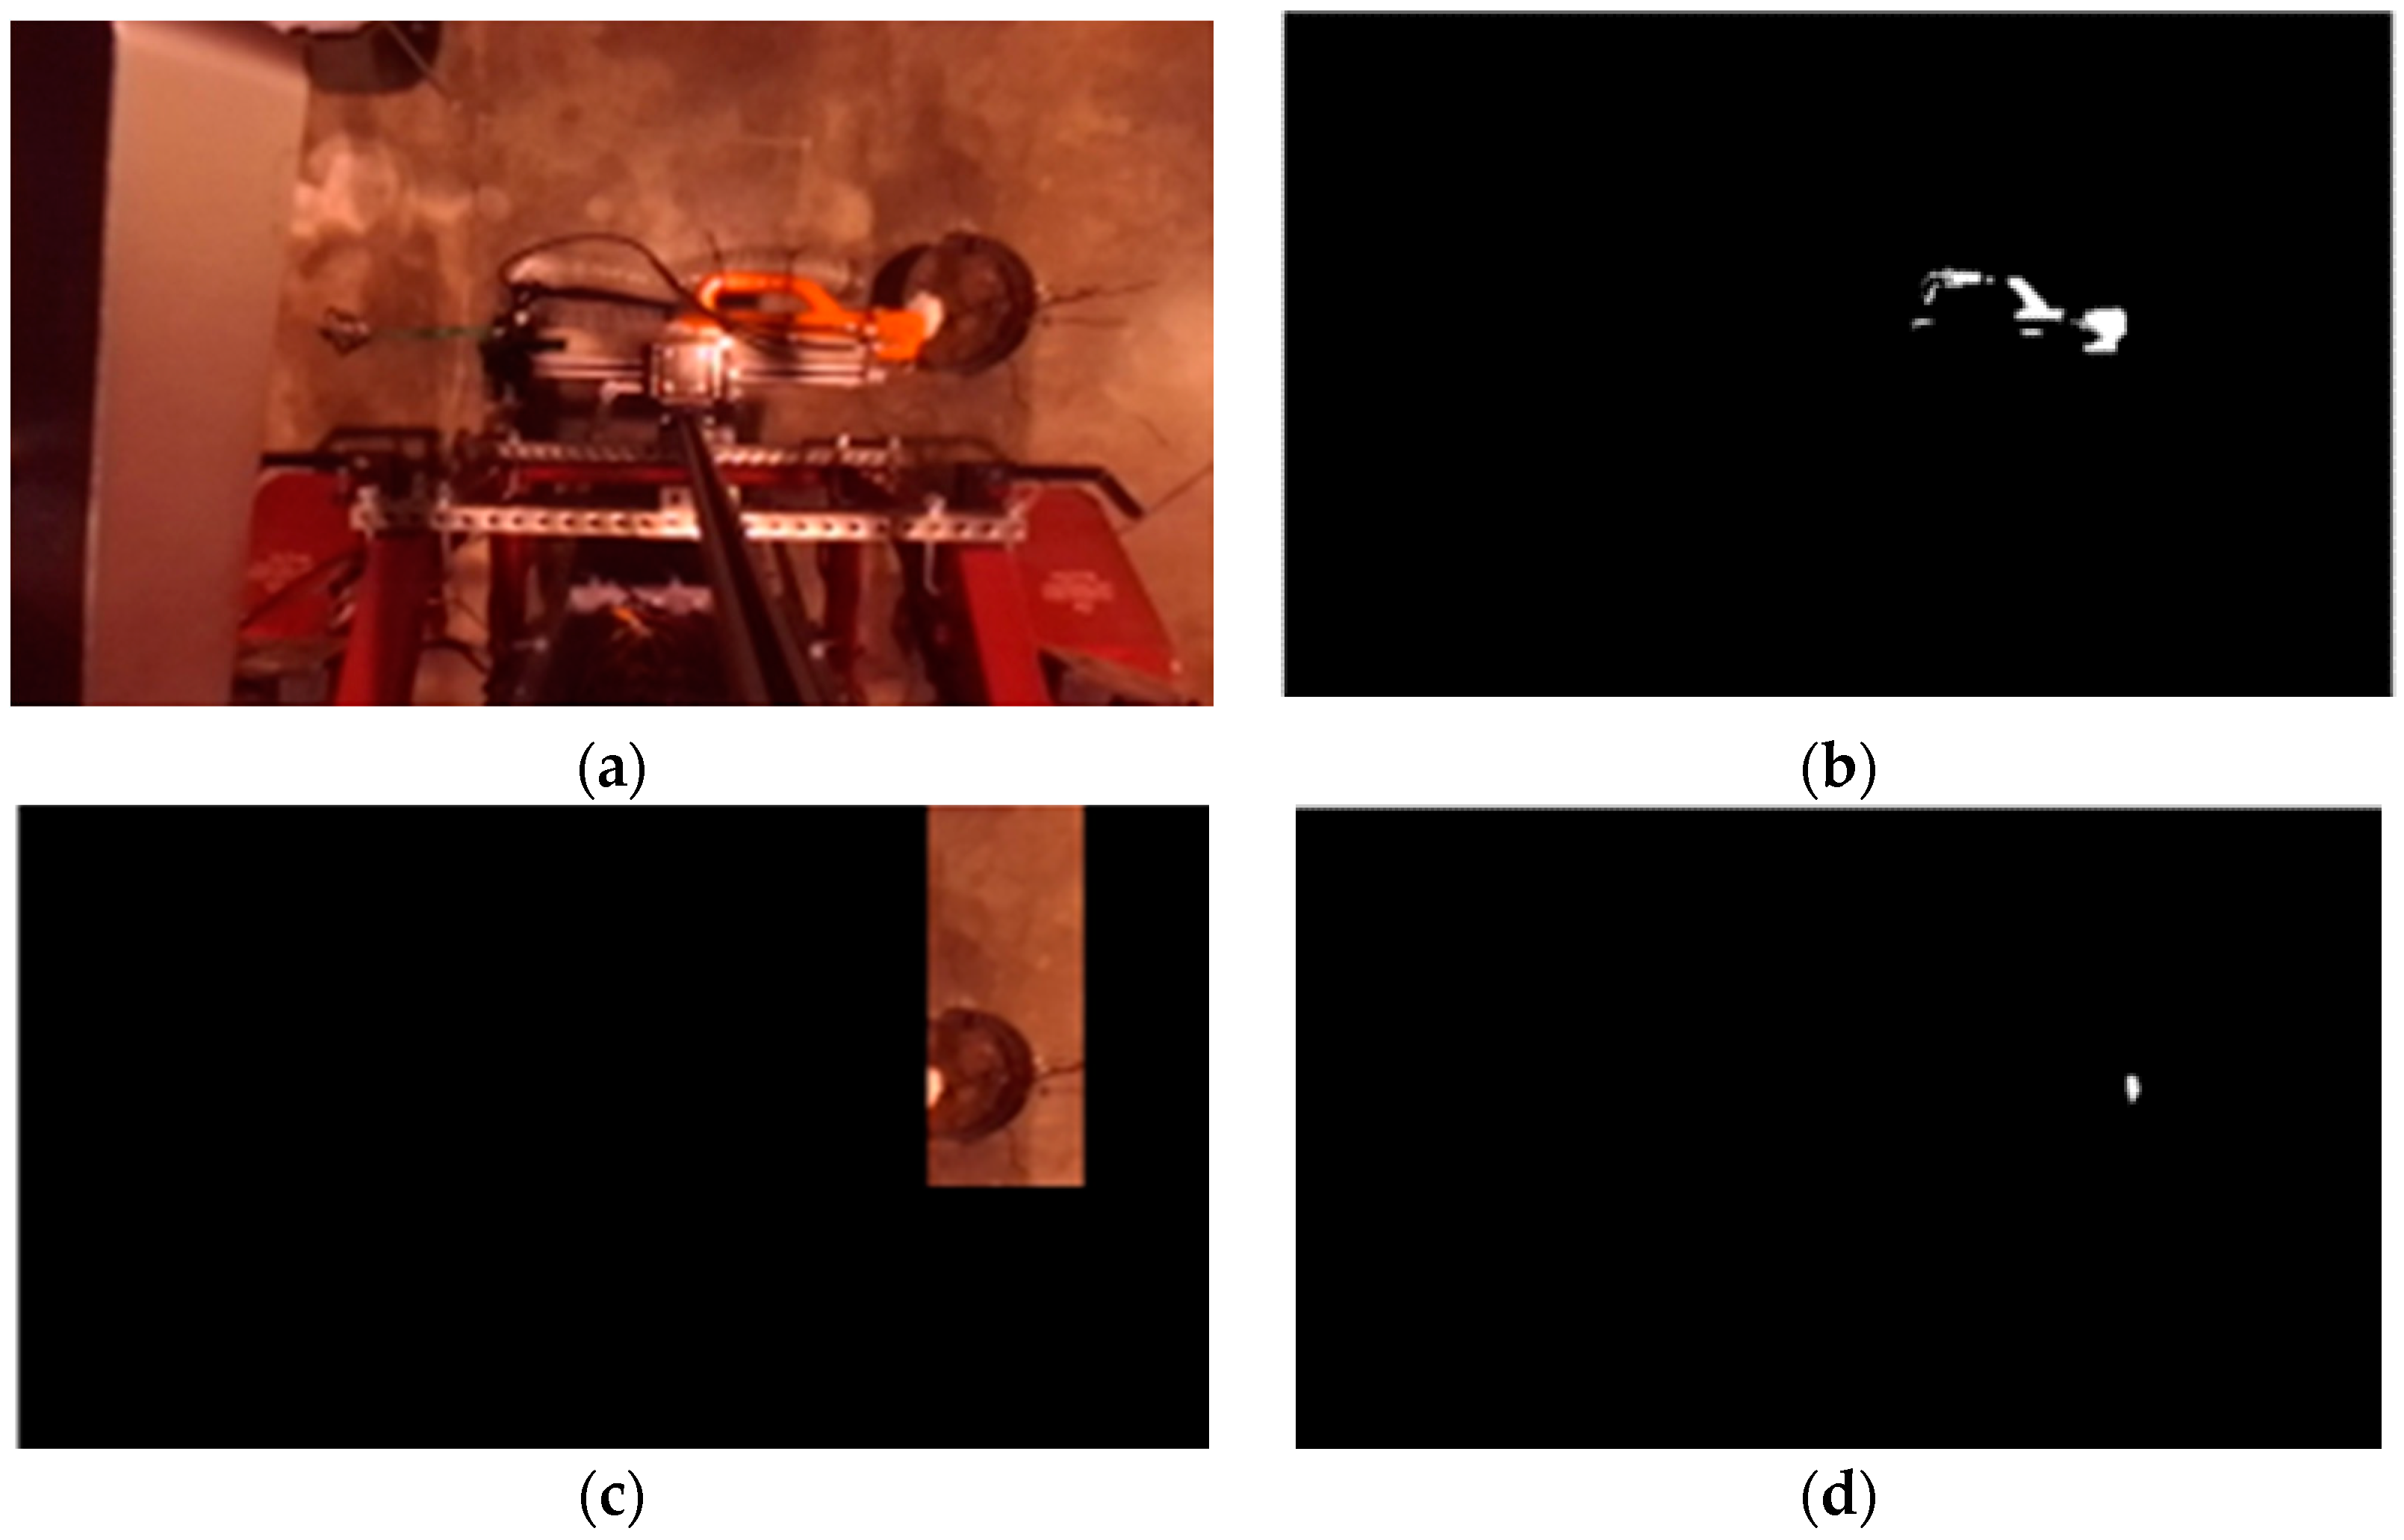
Each image frame was acquired and analyzed to detect the orange end-effector, using a 4-step process: (1) depth processing, (2) color segmentation, (3) feature extraction, and (4) depth matching with features. These steps were handled by the graphics optimized rugged development kit (NVIDIA Jetson Xavier) to achieve improved performance, as image calculations require massive graphics computing resources like NVIDIA CUDA cores. The ZED SDK acquired and processed the images to get depth disparity and rectified images for both lenses. In this case, the ZED SDK was provided with 60 fps of 720 p quality images and 3D point clouds.
The images acquired (
Figure 10a) were first analyzed for arm movement. Since the arm was orange in color, the threshold color was determined so that the arm could be segmented from the rest of the image (
Figure 10b). The cotton boll and end-effector segmentation task involved the following four steps [
30]:
Grab an image.
Using the RGB color threshold, separate each RGB component of the image. The end-effector, which is orange in color, can be masked. The threshold was (Red from 200 to 255, Green from 0 to 255, and Blue from 0 to 60).
Subtract the image background from the original image.
Remove all the regions where the contours were less than value M. Value M was determined by estimating the number of pixels defining the smallest boll.
Feature extraction was performed by finding contours of the consecutive points which have the same intensity and were clustered. The cotton boll was then detected by using tiny YOLOv3 after segmenting the contour of the arm (
Figure 10c,d).
After obtaining the contours for the end-effector, the centroid of the contour was calculated. All the depths were calculated for bolls by matching YOLOv3 detected bolls and end-effector coordinates with 3D point clouds or depth disparity maps, as described in Algorithm 1. The cotton bolls’ coordinates (
x,
y,
z) and robot manipulator coordinates (
x0,
y0,
z0) were obtained and used by the robot for picking decisions.
| Algorithm 1 Algorithm describing the detection of cotton bolls. |
| Input: current video frame |
| Output: decision to move manipulator or rover (Ci) |
| 1. Get end-effector position Xm, Ym and Zm; |
| 2. Get prediction results of the YOLO model; |
| 3. Get the list of centroids for each boll detected (Oj); |
| 4. FOR EACH Oj in (Oj): |
| a. Boll_depth <- calculate the closest distance of the centroid using left lens point cloud; |
| 5. END FOR; |
| 6. Get the closest boll position; |
| 7. Calculate the position of the boll Xb, Yb, and Zb; |
| 8. Find the difference between (Xm and Xb), (Ym and Yb), and (Zm and Zb); |
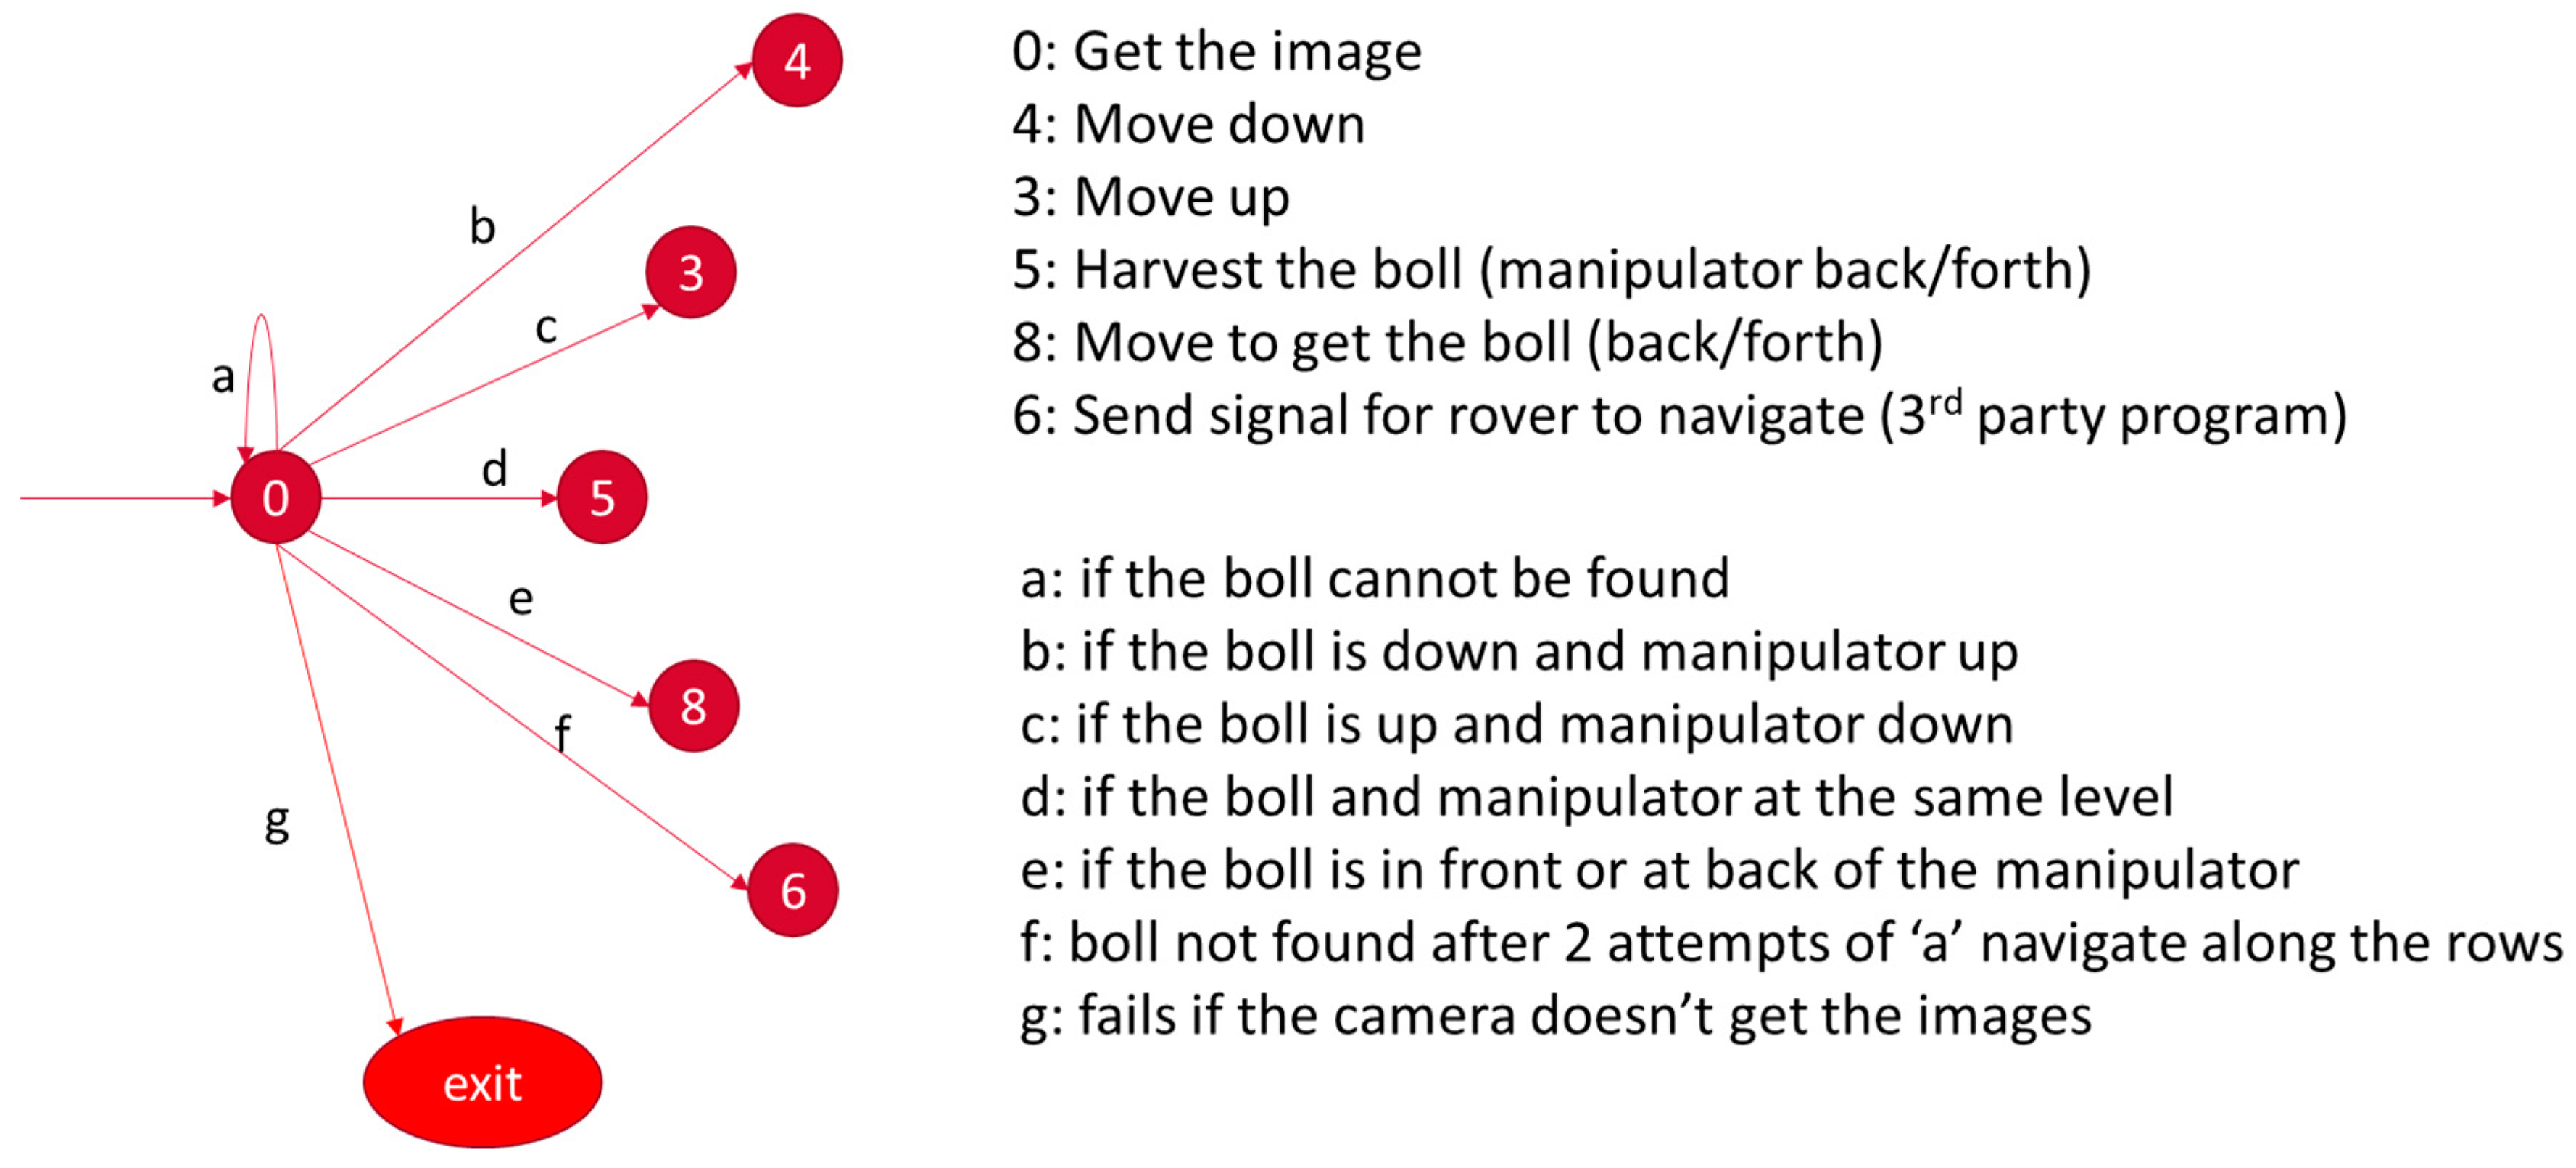
| 9. IF (Yb > Ym) transition e (move forward); |
| 10. IF (Yb < Ym) transition e (move backward); |
| 11. IF (Yb = Ym and Zm > Zb) transition b (move the arm up); |
| 12. IF (Yb = Ym and Zm < Zb) transition c (move the arm down); |
| 13. IF (Yb = Ym and Zm = Zb and Xm – Xb < 37 cm) transition d (pick the boll) ##the manipulator can only cover bolls close from 0 cm to 37 cm from vertical arm; |
| 14. Return the state decisions (Ci). |
2.7. Inverse Kinematics of the Robot
The robot was designed to operate in 3D space and for a 2D Cartesian manipulator to pick a cotton boll as the end-effector reached the bolls.
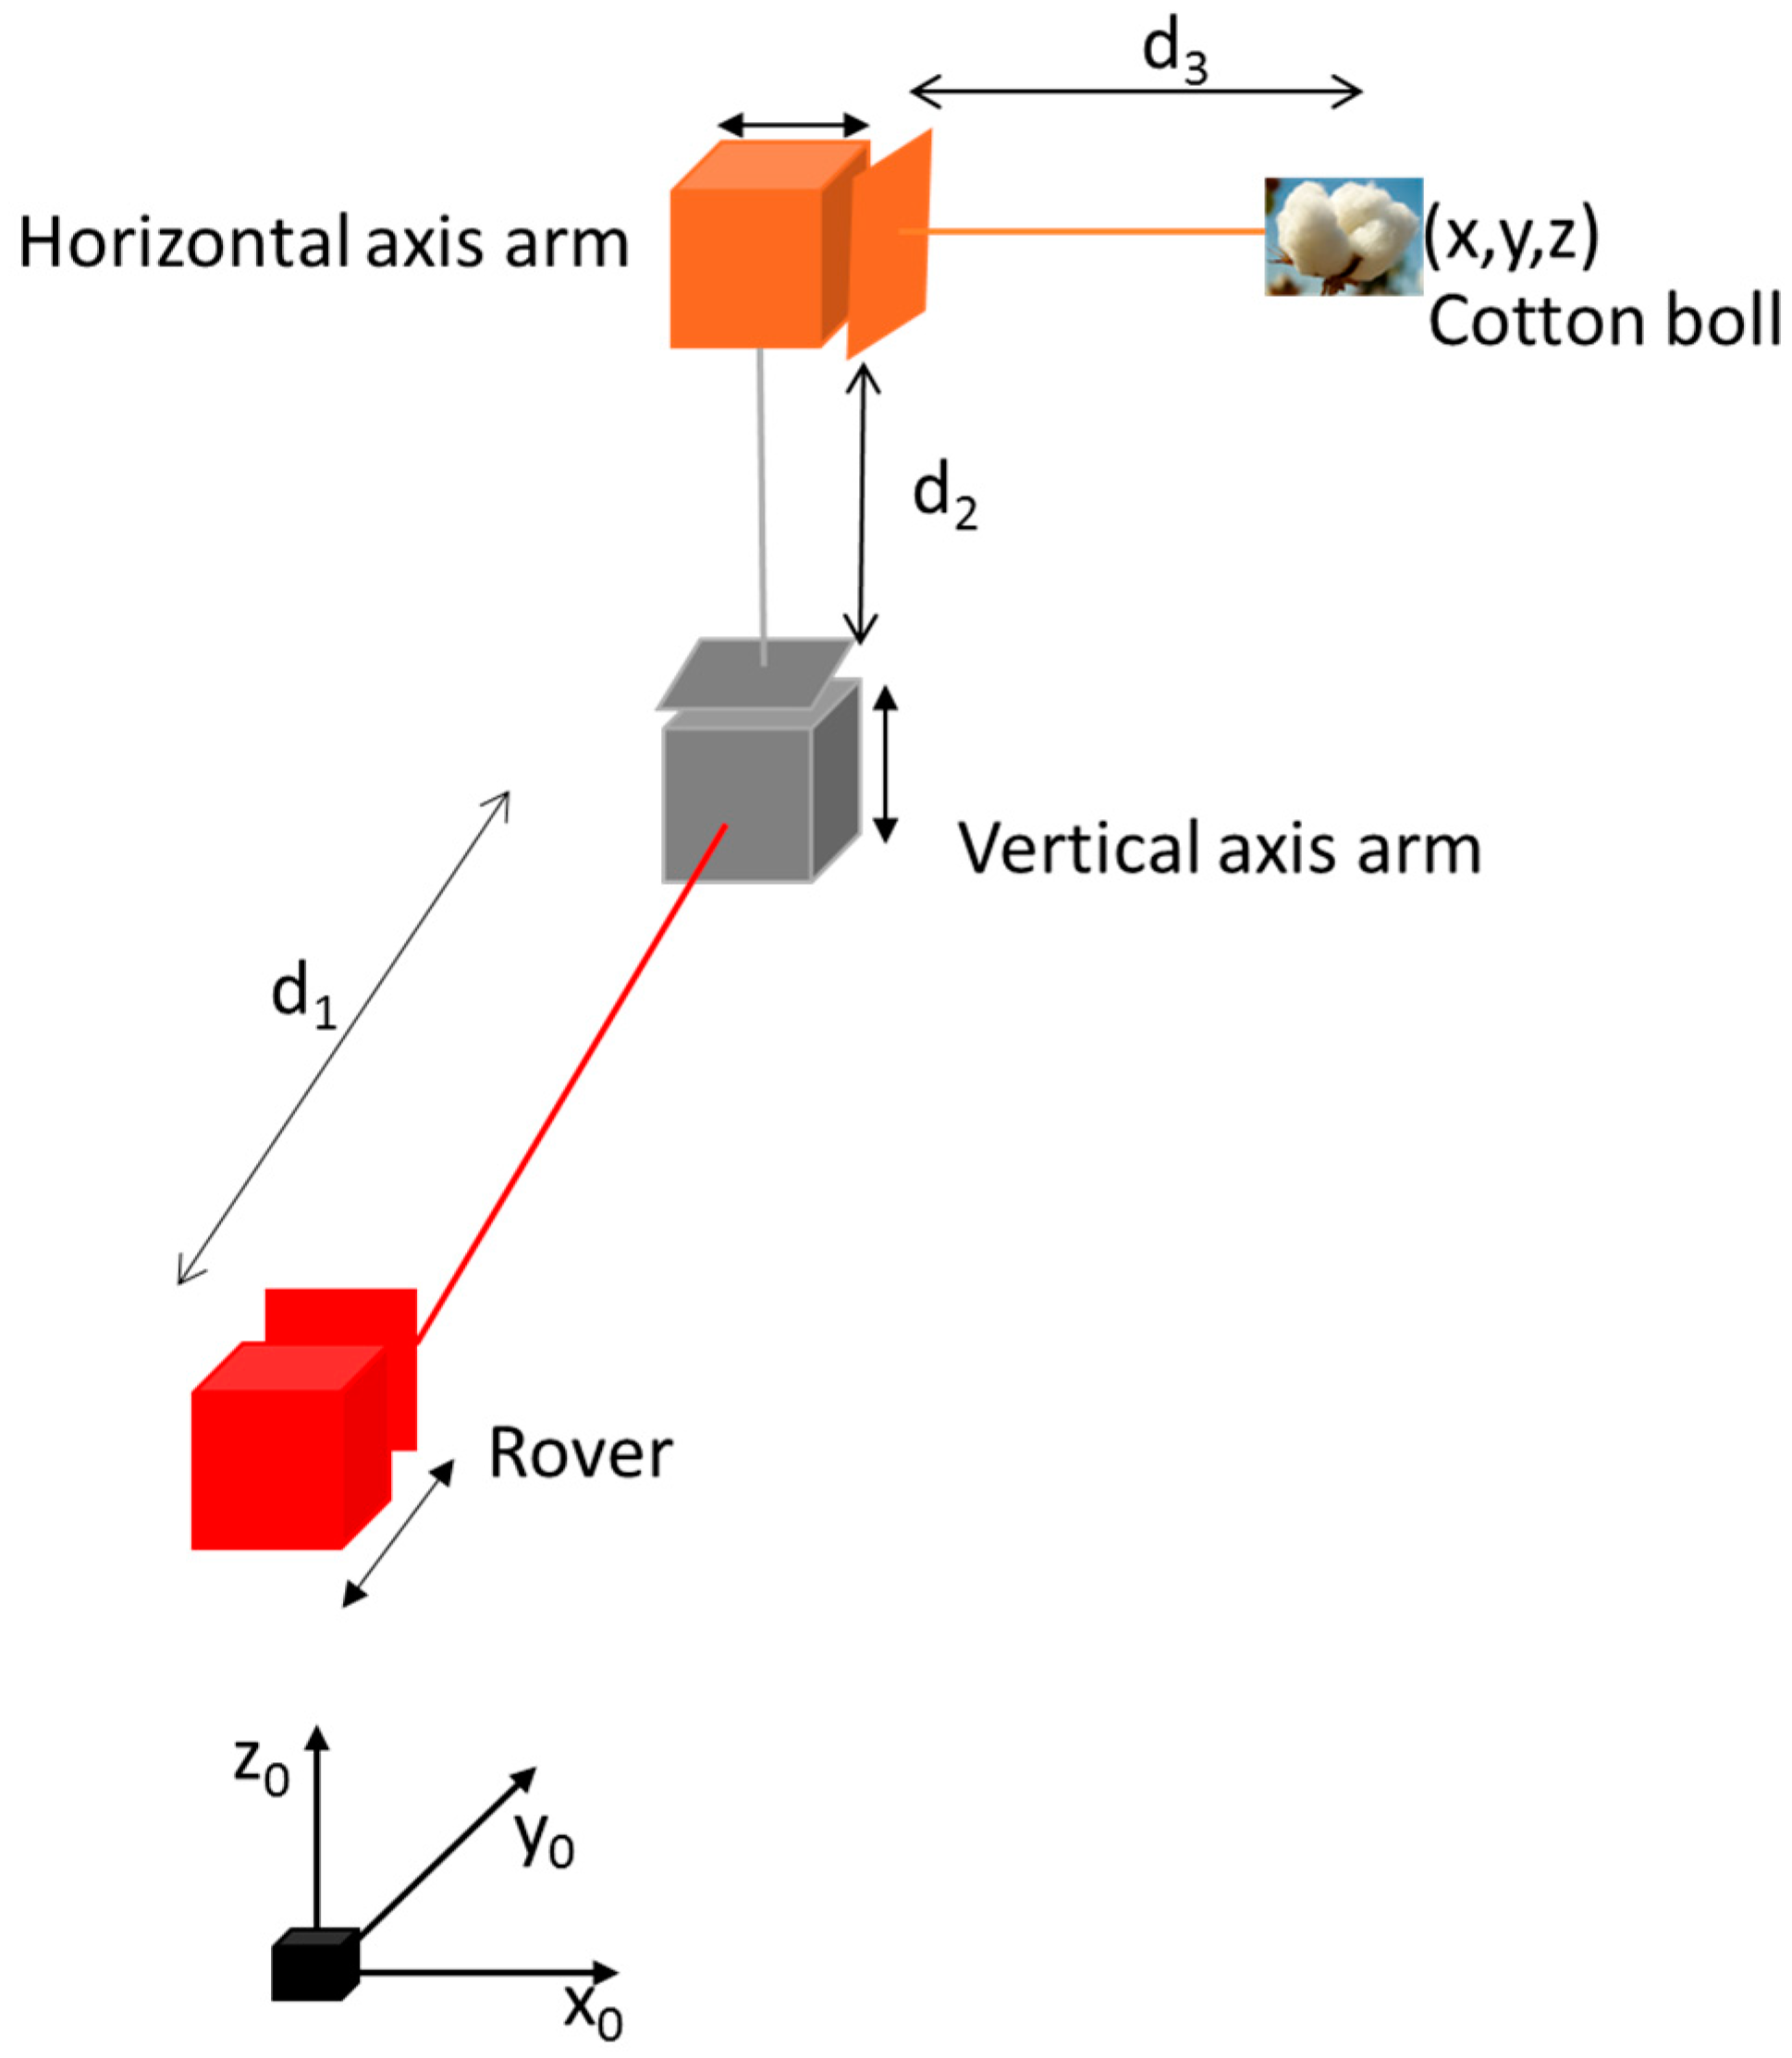
Figure 11 shows the inverse kinematics of the robot. The red cube represents the front of the rover, while the horizontal axis arm and vertical axis arm make up the rover’s manipulator.
The inverse kinematics (
Figure 11 and
Figure 12) was obtained by getting the values of the point (
x,
y,
z), which is boll position from the origin of the rover (
x0,
y0,
z0). The robot could move distances d
1, d
2, and d
3 to pick the cotton boll at the point (
x,
y,
z).
2.8. Depth and Coordinates of Cotton Bolls and Arm
After matching the depths and contours of the Cartesian arm and cotton bolls, each reading of the arm and boll position was logged. Then, by using the tip of the end-effector (
Figure 10c), the system obtained the image coordinates of its front part. Then, using the centroids of each boll, the system calculated the real-world coordinates (W) of the bolls from the image coordinates obtained (I) by using image geometry. The stereo camera was calibrated by using the ZED Calibration tool of the ZED SDK to obtain the camera transformation matrix (Equation (2)) parameters. The procedures to calibrate the ZED camera were learned from their website [
31]. The camera matrix consists of f
x and f
y (the focal length in pixels); C
x and C
y (the optical center coordinates in pixels); and k
1 and k
2 (distortion parameters). The real-world coordinates of a cotton boll, W
x and W
y (Equations (4) and (5)), can be obtained if the algorithm is provided with the value of I
x and I
y, which was the coordinate of the centroid of the front part of the end-effector. Alternatively, by finding the inverse of the camera matrix and multiplying the vector image (I
x and I
y), the world coordinates (W
x and W
y) could be obtained. C
x, f
x, C
y, and f
y were found by calibrating the camera, while W
z was determined from the 3D point cloud provided by the ZED SDK. The parameter values of the calibrated camera used were as follows:
where f
x and f
y equal the focal length in pixels; C
x and C
y equal the optical center coordinates in pixels; W
x and W
y equal the real-world coordinates; and I
x and I
y equal the coordinate of the centroid of the front part of the horizontal arm.
Object depth in an image (W
z) was obtained from the 3D point clouds. For each boll and end-effector location, the distance points (d
x, d
y, d
z) were provided by the ZED SDK. It was recommended to use the 3D point cloud instead of the depth map when measuring depth distance. The Euclidean distance (Equation (6)) is the calculated distance of an object (end-effector or bolls) relative to the left lens of the camera.
Depth distance (Wz) should be greater than zero and less than the distance of the camera to the lowest position of the end-effector, to avoid the rover attempting to harvest unreachable bolls. Moreover, the horizontal distance (Wx) of the boll from the center of the camera should not exceed the length of the horizontal axis arm. After obtaining such measurements, the system executed other tasks, like controlling the arm or moving the rover. For the machine to be able to execute each task independently and in coordination with the other tasks, the finite state machine was developed to manage task-based requests.
2.9. Finite State Machine
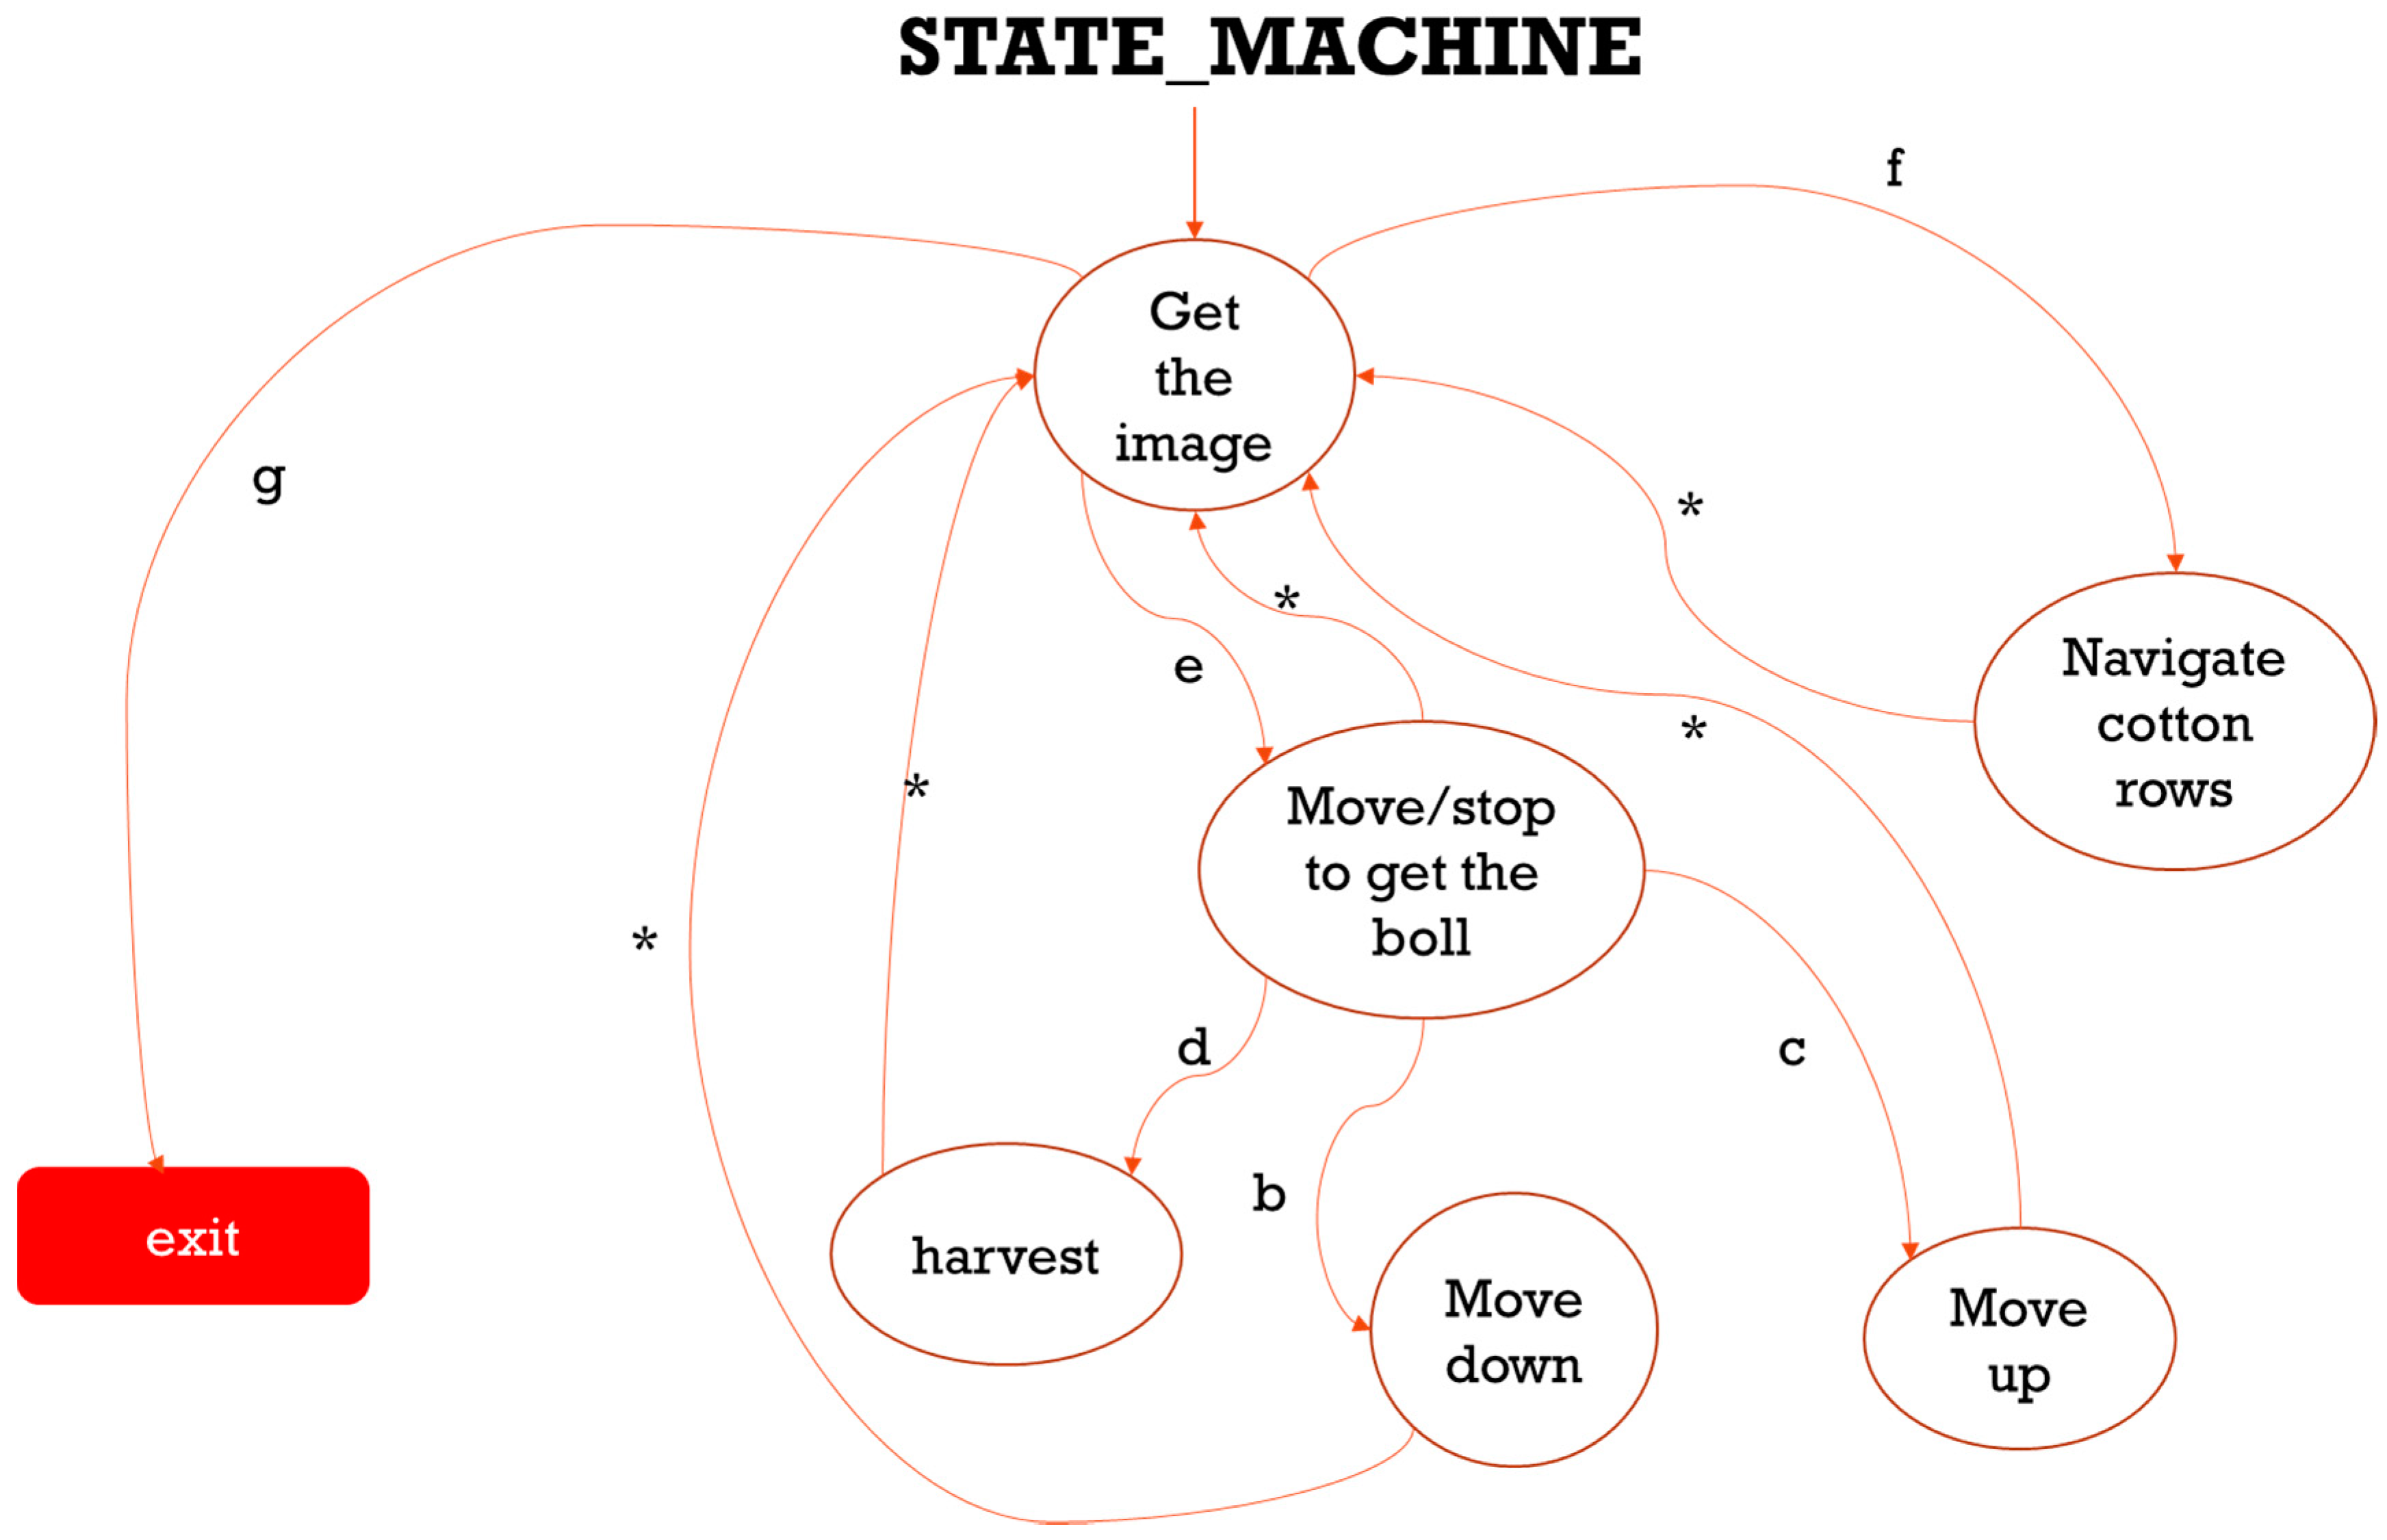
Robot tasks and actions were categorized as states, and state “transitions” were modeled in a task-level architecture to create the rover actions required to harvest cotton bolls. This approach provided a maintainable and modular code. Using an open-source ROS library known as SMACH, we smoothly implemented the tasks, to build complex behavior (
Figure 13) [
32].
The state machine had six necessary states and seven transitions (
Figure 13 and
Figure 14). After every state, the system reverted to state 0 (get the image) and searched for cotton bolls. If a cotton boll was found, the system would calculate the distance of the boll from the manipulator in three-dimensional space (
X,
Y,
Z), as described in the inverse kinematics section. If the boll was lined up horizontally, then the system would get the manipulator to move up or down relative to the position of the manipulator to the boll. If the boll was at the same level, then the system would harvest it. If the boll was in the front or back, the system would send a signal for the rover to move forward or back, using the PID control. If the system failed to see any bolls, the rover proceeded to pass over the cotton rows. Algorithm 1 describes the detection of the bolls and actions taken by the state machine algorithm to accommodate the rover transition of the tasks.
2.10. Calibration of the Manipulator
The manipulator was calibrated for its horizontal and vertical movements. The equation was obtained by first moving the arm to the furthest location away from the ZED camera. The distance of the arm from the camera was then recorded and was continually recorded as the arm was moved by each step of the stepper drive, until it was closest to the camera. The equation obtained (R
2 = 0.99) by fitting the points is as follows:
2.11. Rover Movement Controller
The rover movement controller ran an adaptive PID to control the rover forward and rearward movement. The position of the rover and the target position were published from the master, and the Arduino clients subscribed to the topic accordingly. The throttle was set at a constant maximum RPM to maintain constant power to the hydraulic systems. A topic that subscribed to this message was developed in the rover microcontroller. Articulation was done after the rover controller received a topic that published the instruction for the rover to turn or go straight. For this study, the rover only moved straight. The master controller published an articulation message at the rate of 50 Hz to the rover controller, which had subscribed to the topic. The rover movement controller published the gains of the adaptive PID controller together with the position of the rover relative to the encoder pulses. The master controller subscribed to the messages, so as to provide an accurate position of the rover, which was used to pass the signal to the arm controller for boll picking.
Tuning was done by first identifying the deadband of the hydraulic swashplate arm for the variable displacement pump. Up to a particular movement angle of the swashplate arm, there was insufficient fluid flow and pressure to move the rover. For operation, the rover movement controller sent a servo signal to the linear actuator (
Figure 15), to proportionally increase fluid flow to the hydraulic wheel motors. The linear actuator pushed the swashplate to a certain angle and was directly controlled by using a rover navigation controller. The linear actuator extends from 0 cm to 20 cm after receiving an analog servo signal. Retracting and extending the linear actuator changed the position of the swashplate arm, which in turn controlled the speed and direction of the hydraulic fluid, which provided the motion capability of the rover. The angle of the swashplate can be changed by sending a servo Pulse Width Modulation (PWM) signal that ranged from 65 to 120, using the Arduino servo library. When a 90 PWM signal was sent to the rover controller, the rover stoped, since the swashplate was positioned in its neutral position, and the fluid flow was zero. If the PWM signal was decreased slowly from 90 to 65, the rover moved in reverse motion, while if it was increased from 90 to 120, the rover moved forward. It meant the 65 PWM signal provided maximum speed in reverse motion, while 120 PWM signal provided maximum speed forward. The rotary encoder installed on the wheel of the rover sends back input pulses to the PID, which measures how far the rover has moved. However, the system had a large deadband from a PWM signal of 80 to 98, which means the angle change was not enough to make the rover move. The deadband was the signal angle sent from the rover Arduino microcontroller to the linear actuator servo that cannot make the rover move either forward or reverse. Consequently, when the rover missed the target, it became challenging to get close to the target, as the PID can either be a direct relationship or reverse relationship between output (actuator signal) and input (encoder pulses).
In order to remove the deadband, the system was redesigned such that it gave the output
u(x) from −100 to 100 (Equation (8)). Then, the signal was mapped to the correct settings of the rover. The actual servo signal was set to move (extend) from 98 to 108 by mapping positive output values (0 to 100) of
u(x), while moving back (retract) from 70 to 80 for negatives output values (−100 to 0); zero was set to be a PWM signal of 90.
The PID controller was manually tuned. It was done by increasing K
p until the rover oscillated with neutral stability, while setting K
i and K
d values to zero. Then, K
i was increased until the rover oscillated around the setpoint. After that, K
d was increased until the system was settling at the given setpoint quickly. The PID gains obtained were K
p = 0.5, K
i = 0.15, and K
d = 1. Later, the navigation controller was recalibrated to determine if the performance could be improved. The PID gains that create a small overshoot response but aggressively moved the rover forward were obtained: K
p = 0.7, K
i = 0.04, and K
d = 5.0. The rqt_graph library [
33], which is the ROS computation visualizing graph, was used to study the pulses. Each of the encoder pulses was equivalent to 1.8 mm in distance. The system performed the same way going forward or backward. The overshoot was approximately 18 cm.
2.12. Proportional Control of the Articulation Angle
The rover turned to the target articulation angle, γ, by using proportional control. The current articulation angle, γk, and required target angle, γk+1, were used to find the error used to control the signal to turn the rover. The gain Kp was set to 1. The articulation angle was controlled by the hydraulic linear actuators, which were connected to two relays. The two relays were used to connect the left and right control signals from the navigation controller to a 12 V power source to move the hydraulic directional control valve spool. Hydraulic cylinders in series were used to push and pull the front and rear halves of the rover, to create a left or right turn. If the rover turned left, the left actuator retracted while the right actuator expanded, until a desired left articulation angle was achieved. If the rover turned right, the right actuator retracted while the left actuator expanded, until a desired right articulation angle was achieved. The angle was reported by a calibrated high-precision potentiometer.
2.13. Preliminary Experimental Setup
The navigation and manipulation of the system were tested as one unit of the robot. It is essential to determine the performance of the whole robot in navigating to cover 3D space and picking of the bolls.
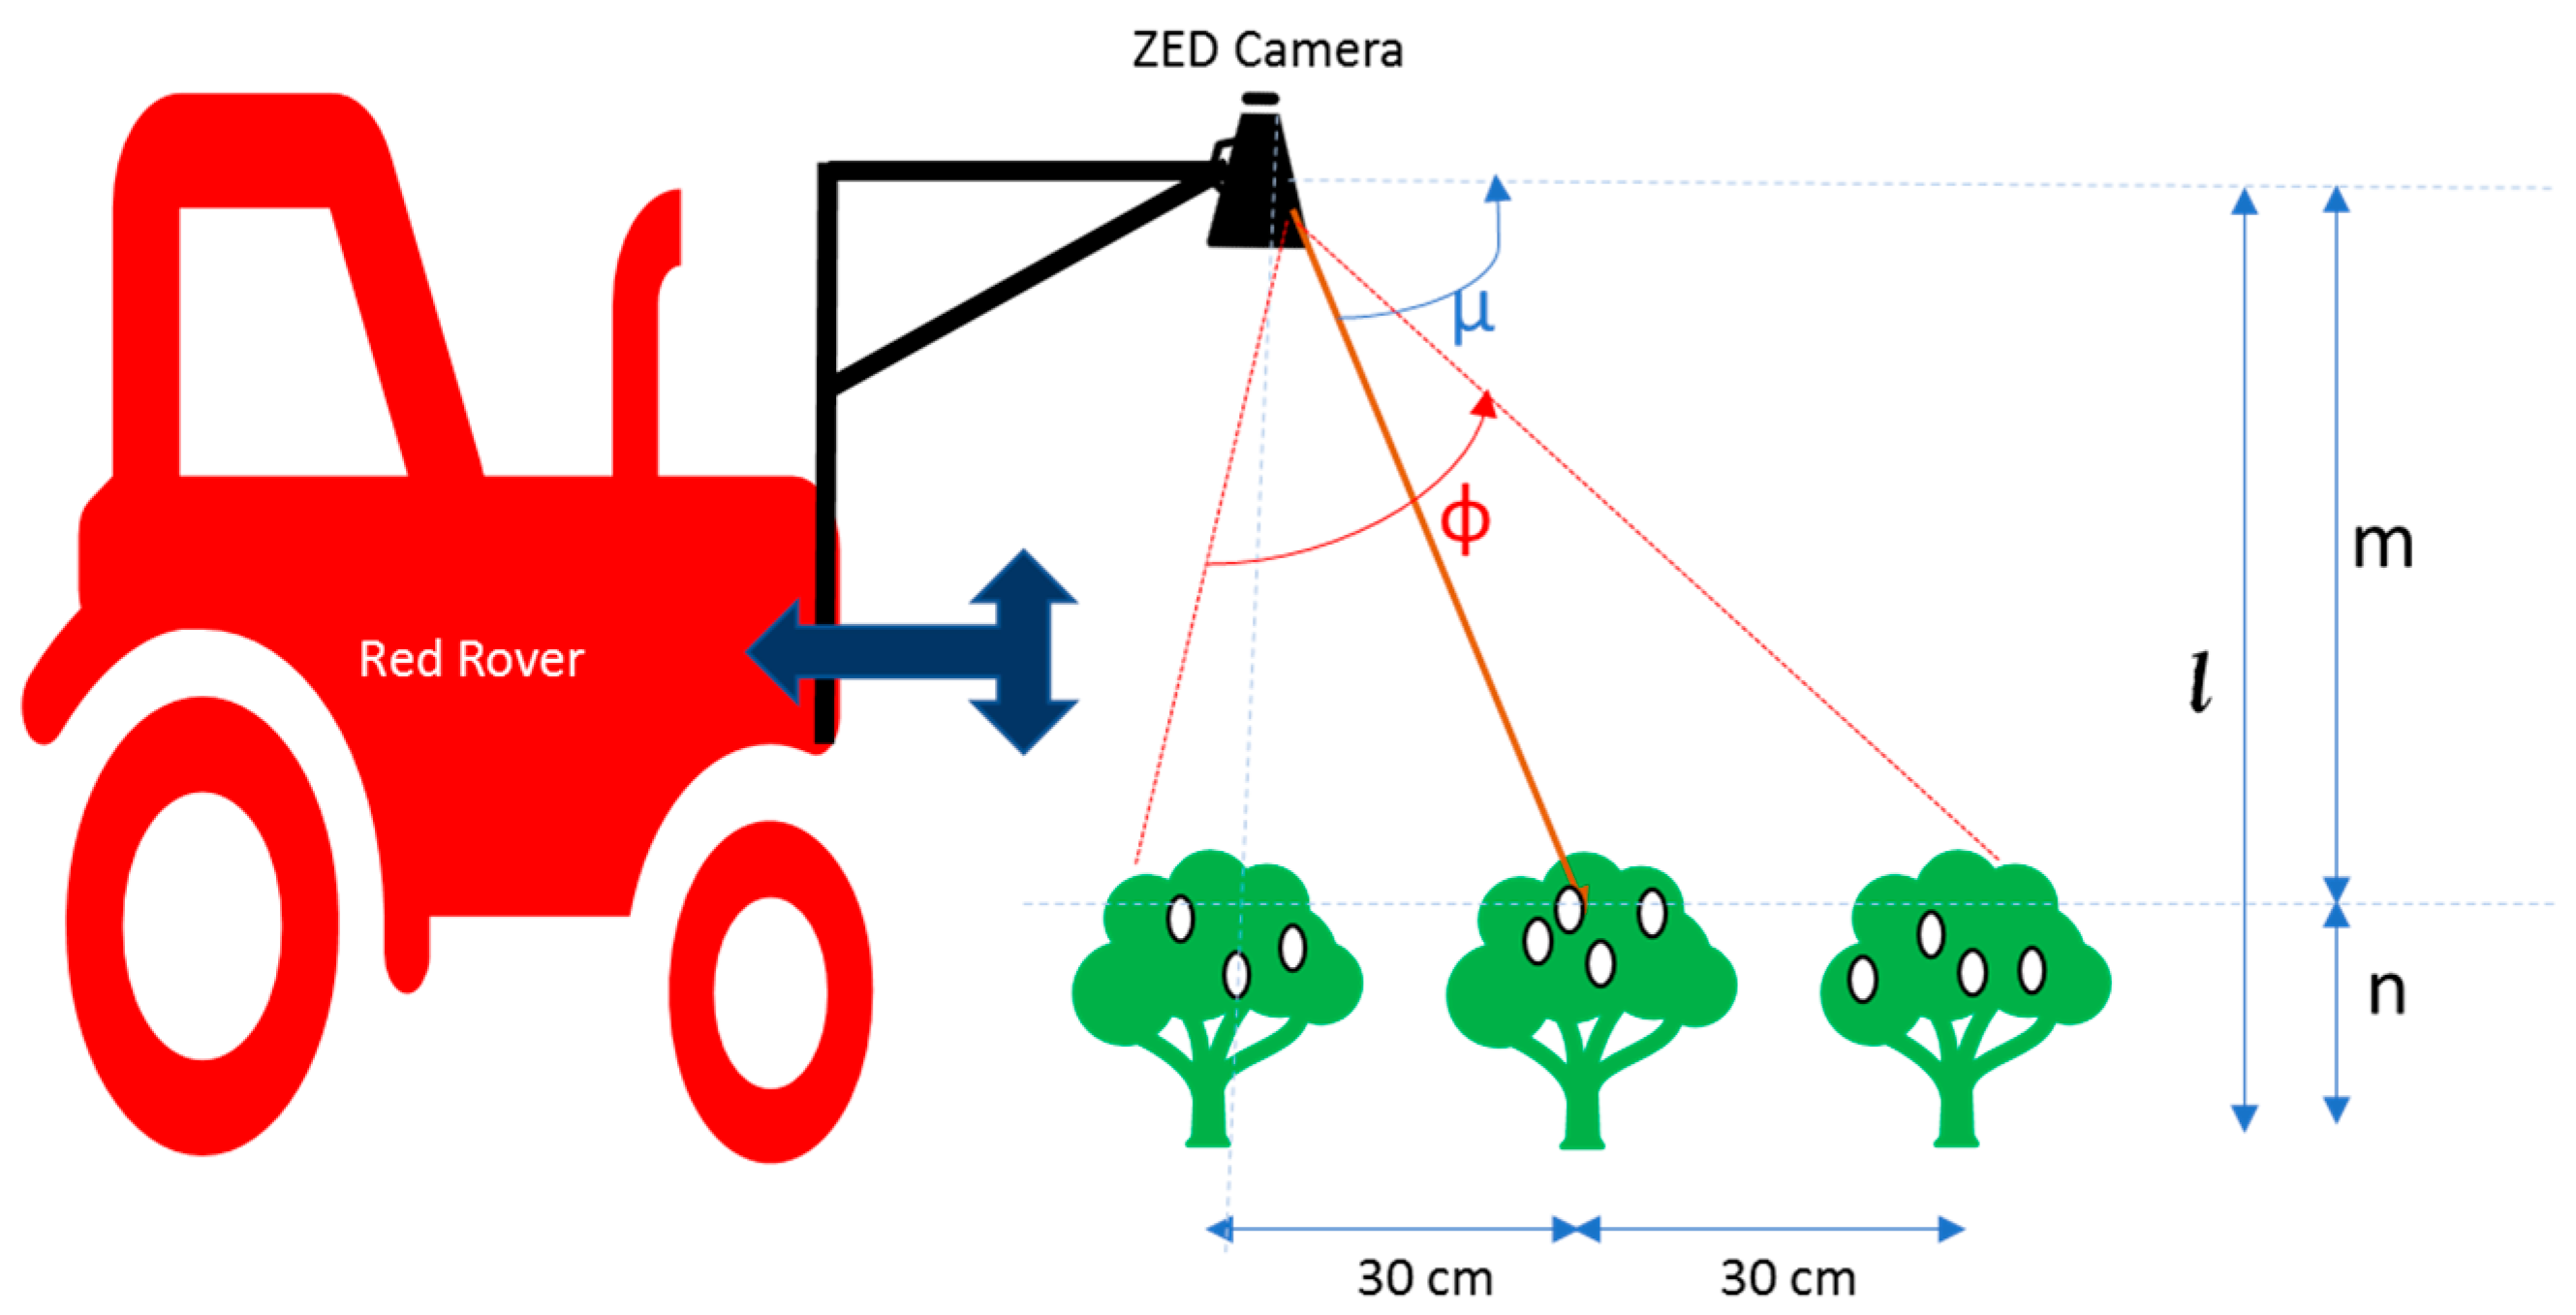
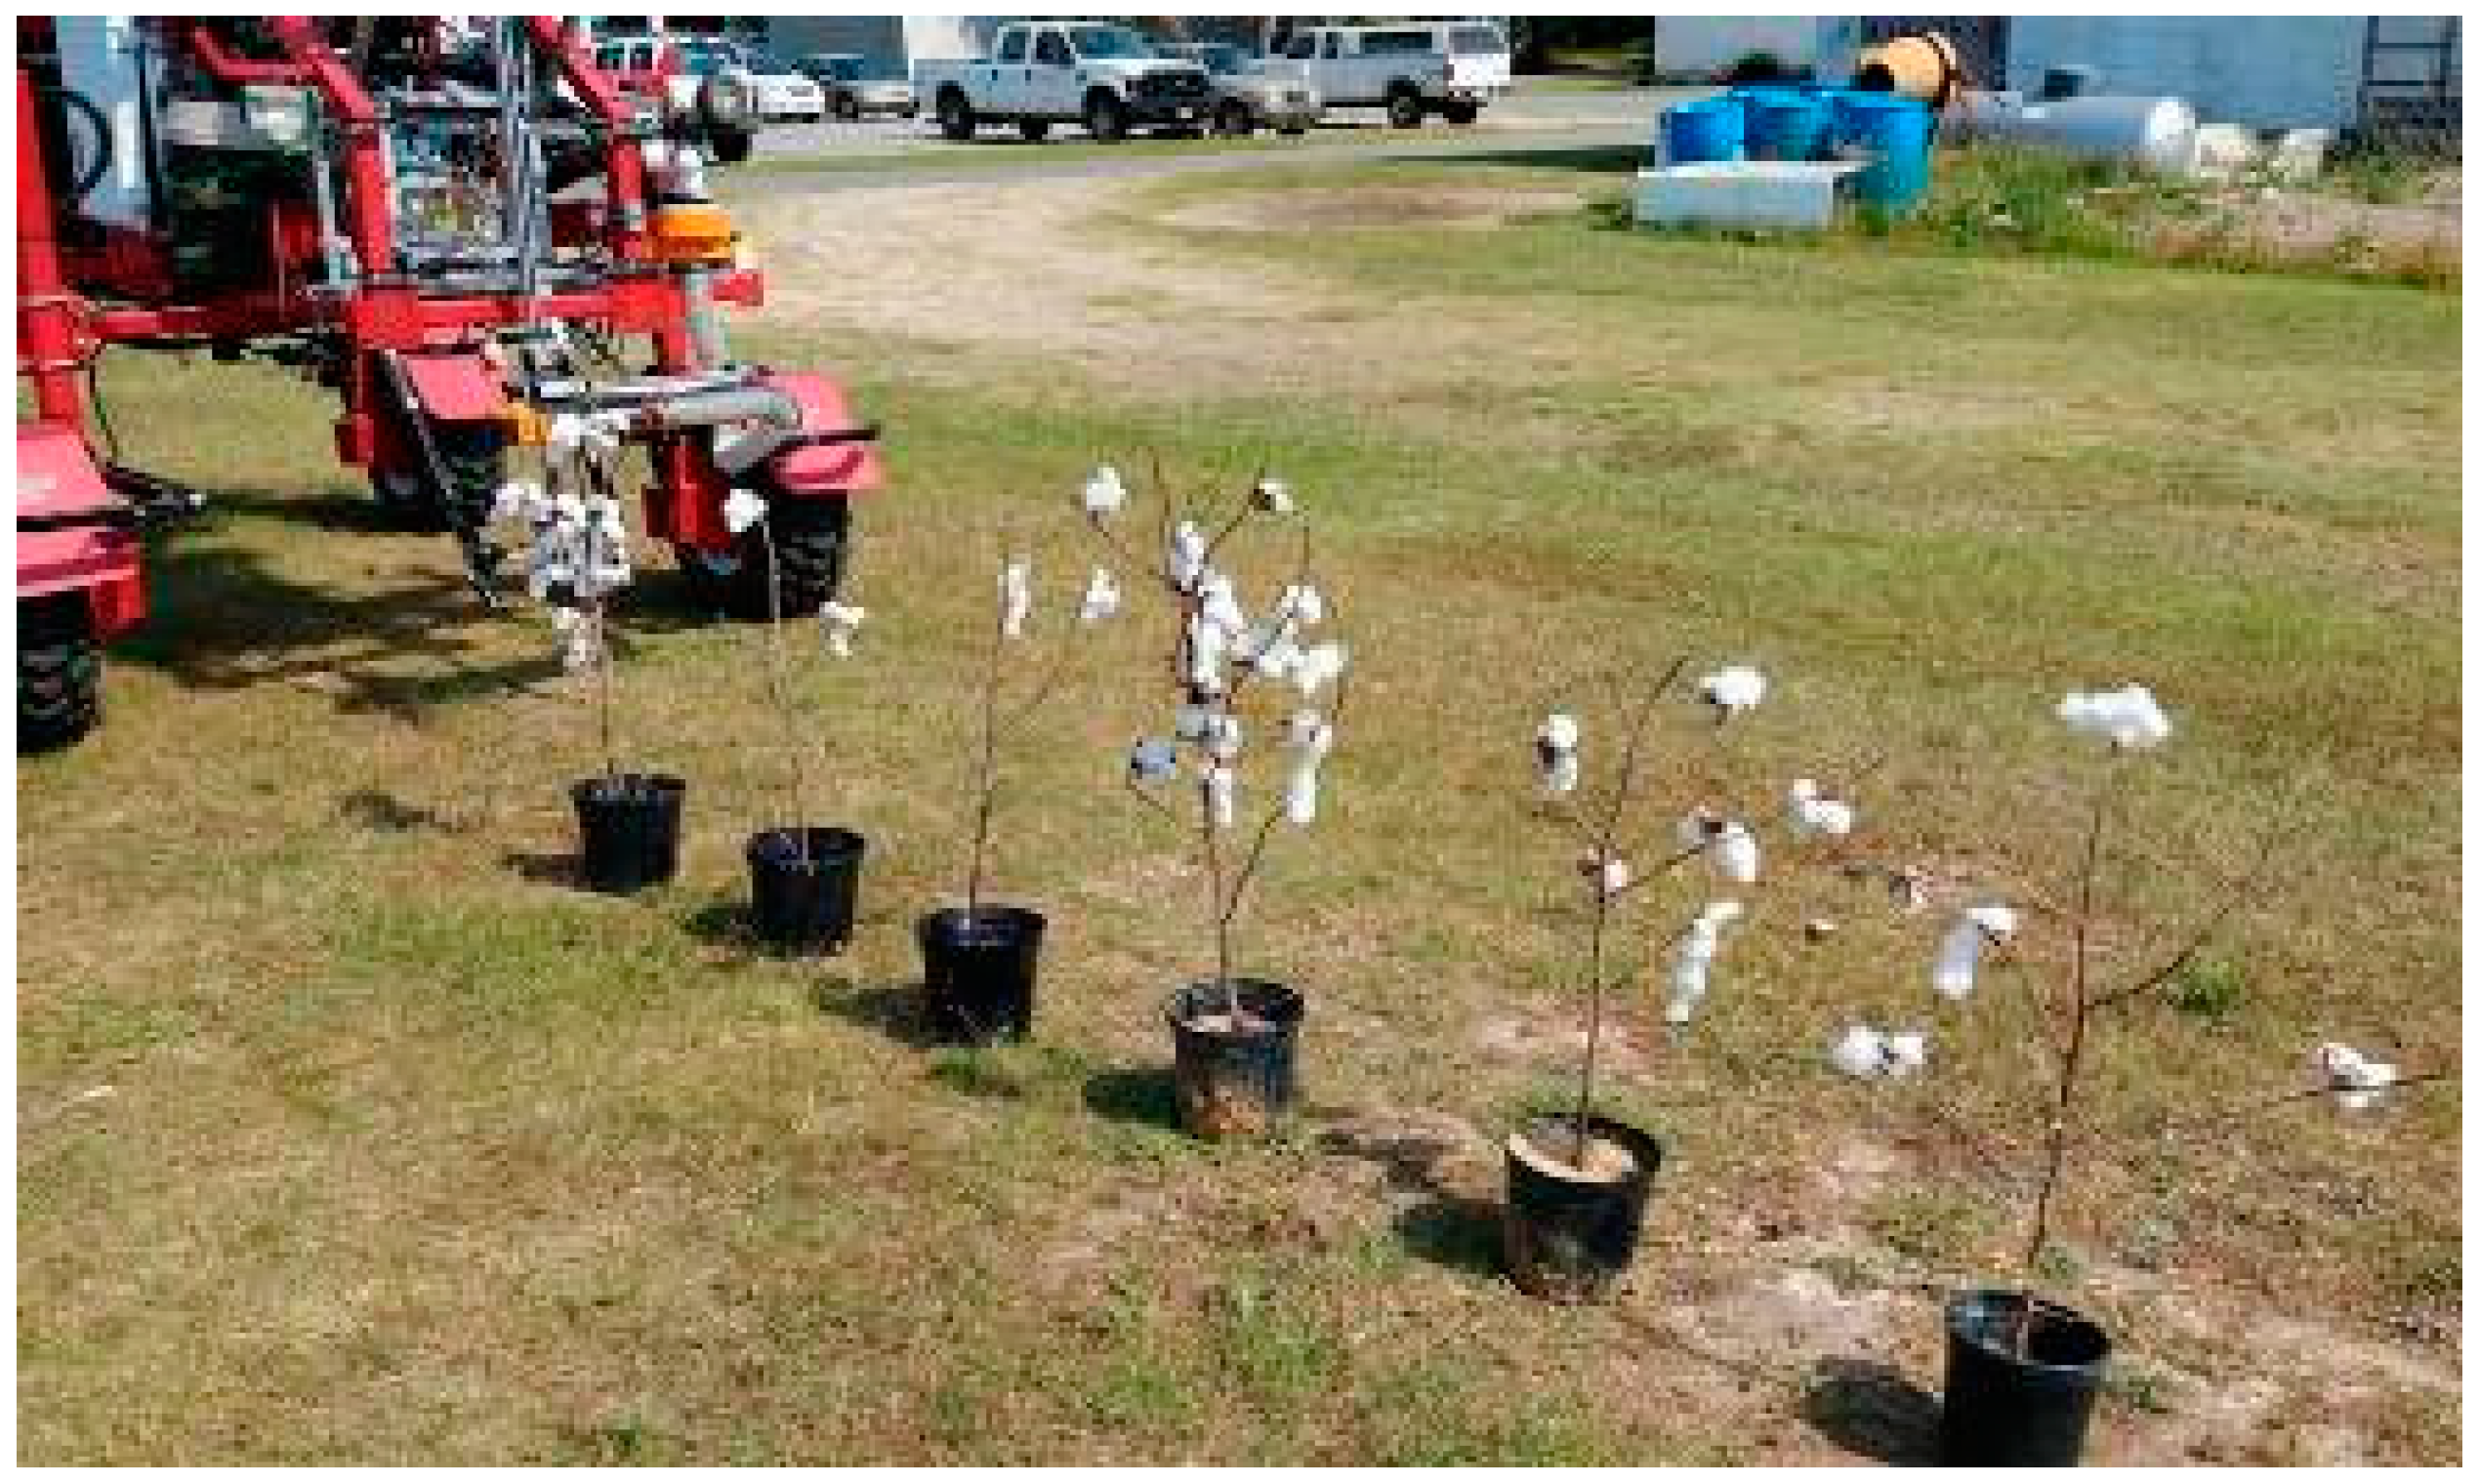
Five experiments were set up at the University of Georgia (UGA) Tifton campus grounds (N Entomology Dr, Tifton, GA, 31793). The experiments were undertaken on 29th and 30th May 2019. Six cotton plants were placed 30 cm apart, three bolls per plant. The slope of the ground surface in the direction of the forwarding movement was 0.2513°. The rover was driven over the plants, and the manipulator moved into a position to pick the bolls from the plants (
Figure 16 and
Figure 17). The camera was 220 m above the ground (l). The first boll detected by the system was distance “m” from the camera. The camera also checked the distance of the arm from the camera, and then the manipulator controller sent a signal to move the arm to harvest the first boll. Subsequent boll picking was repeatedly accomplished by getting the distance of the current end-effector position to the next boll position in the camera images.
The results of the five experiments, using six plants with three bolls each, were collected and analyzed, using the robot performance metrics mentioned by Reference [
34].
2.14. Field Experiment
The field experiment in undefoliated cotton was conducted at the Horticulture Hill Farm (31.472985 N, 83.531228 W), near Bunny Run Road in Tifton, Georgia, after establishing the calibrated parameters of the rover. The field (
Figure 13) was planted on 19th June 2019, using a tractor (Massey-Fergurson MF2635 tractor, AGCO, Duluth, GA, USA) and a 2-row planter (Monosem planter, Monosem Inc, Edwardsville, KSN USA). The cotton seeds (Delta DP1851B3XF, Delta & Pine Land Company of Mississippi, Scott, MS, USA) were planted every two rows, and two rows skipped. The rows were 36 inches (91.44 cm) wide, and the seed spacing was 4 inches (10.16 cm). The field experiment was done after finishing the preliminary experiments. Two tests (5.3 m) for picking the cotton bolls were conducted on 22nd November 2019 and 2nd December 2019. The slope of the ground surface in the direction of the forwarding movement was 2.7668°. It is steeper than the preliminary experiment field. We measured the Action Success Ratio (ASR), which is the ratio of the number of the picked bolls to a number of all cotton bolls present, and Manipulator Reaching Ratio (MRR), which is the ratio of the bolls seen and attempted to be picked to the number of all bolls present.
4. Conclusions
The preliminary design and performance of a prototype cotton harvesting rover were reported. The system was optimized to use visual-based controls to pick cotton bolls in undefoliated cotton. The system used SMACH, an ROS-independent finite state machine library that provides task-level capabilities, to design a robotic architecture to control the rover’s behavior. The cotton harvesting system consisted of a hydrostatic, center-articulated rover that provided mobility through the field, and a 2D manipulator with a vacuum and rotating mechanism for picking cotton bolls and transporting them to a collection bag. The system achieved a picking performance of 17.3 s per boll in simulated field conditions and 38 s per boll in a real cotton field. The increased time to pick each boll resulted from the cotton plants’ overlapping leaves and branches obstructing the manipulator. Cotton boll detachment was much more difficult because the bolls were not placed artificially (as done in the potted plants), and the level of uphill and downhill movement resulted in poor control of the hydraulic navigation system.
The overall goal of the harvesting rover was to develop a system to harvest cotton that uses multiple small harvesting units per field. These units would be deployed throughout the harvest season, beginning right after the opening of the first cotton bolls. If this team of harvesting rovers is to reach commercial viability, the speed of harvest (CT) and successful removal of bolls (ASR) must be improved. To address these shortcomings, a modified end-effector and an extra upward-looking camera at the bottom of the manipulator in undefoliated cotton will be studied in future studies of the prototype. Furthermore, future research will be conducted to improve the rover’s overall navigation, to improve the rover’s and manipulator’s alignment with pickable bolls.
