Article

Dynamic and Static Calibration of Ultra-Low-Voltage, Digital-Based Operational Transconductance Amplifiers †

1
Department of Electronics and Telecommunications (DET), Politecnico di Torino, 10129 Turin, Italy
2
Graduate Program in Microelectronics (PGMICRO), Federal University of Rio Grande do Sul, 91501-970 Porto Alegre, Brazil
*
Author to whom correspondence should be addressed.
This paper is an extended version of our papers: P. Toledo, P. Crovetti, H. Klimach and S. Bampi, “A 300 mV-Supply, 2 nW-Power, 80 pF-Load CMOS Digital-Based OTA for IoT Interfaces”, IEEE International Conference on Electronics, Circuits and Systems (ICECS), Italy, 2019; and P. Toledo, O. Aiello and P. S. Crovetti, “A 300 mV-Supply Standard-Cell-Based OTA with Digital PWM Offset Calibration”, in IEEE Nordic Circuits and Systems Conference (NORCAS), Helsinki (FI), 2019.
Electronics 2020, 9(6), 983; https://doi.org/10.3390/electronics9060983
Submission received: 11 May 2020 / Revised: 2 June 2020 / Accepted: 5 June 2020 / Published: 12 June 2020
(This article belongs to the Special Issue Low-Voltage Integrated Circuits Design and Application)

Abstract

:
The calibration of the effects of process variations and device mismatch in Ultra Low Voltage (ULV) Digital-Based Operational Transconductance Amplifiers (DB-OTAs) is addressed in this paper. For this purpose, two dynamic calibration techniques, intended to dynamically vary the effective strength of critical gates by different modulation strategies, i.e., Digital Pulse Width Modulation (DPWM) and Dyadic Digital Pulse Modulation (DDPM), are explored and compared to classic static calibration. The effectiveness of the calibration approaches as a mean to recover acceptable performance in non-functional samples is verified by Monte-Carlo (MC) post-layout simulations performed on a 300 mV power supply, nW-power DB-OTA in 180 nm CMOS. Based on the same MC post-layout simulations, the impact of each calibration strategy on silicon area, power consumption, and OTA performance is discussed.

1. Introduction

Small dimensions and low power consumption are critical requirements of pervasive, (nearly) energy autonomous sensor nodes for the Internet of Things (IoT) [1,2,3,4], Figure 1a. While digital circuits can be extremely power- and area-efficient thanks to geometry, voltage and frequency scaling [5], analog circuits are still lagging behind and their performance can be severely degraded in new CMOS technologies nodes due to the limited voltage headroom, high process variability and poor analog characteristics of nanoscale transistors [6].
Focusing on the Operational Transconductance Amplifier (OTA), which is a key building block in most analog sub-systems, several new topologies and design techniques (Figure 1b–g) have been recently devised to enable efficient operation in nanoscale technologies and/or under Ultra-Low-Voltage (ULV) supply [7,8,9,10,11,12,13,14,15,16].
In general, ULV OTAs can be classified as: gate-driven, bulk-driven, inverter-based, VCO-based and digital-based [15,16] topologies.
In [8,9] gate-driven MOS transistors working in subthreshold regime are exploited (Figure 1b) and the minimum power supply and common mode input range (CMIR) are limited to V D D = 3 V sat 300 mV and V CM = V DD 2 V sat V TH , respectively, being V sat the minimum drain-source voltage required to operate an MOS device in saturation voltage and V TH is the threshold voltage.
In [10] (Figure 1c), bulk-driven input devices are exploited to mitigate the CMIR limitation, at the cost of reduced efficiency due to the lower values of the bulk transconductance g mb compared to the gate transconductance g mg under the same bias. Inverter-based amplifiers [11,12] (Figure 1d–e) have been proposed to achieve a large equivalent transconductance ( g m TOTAL = g m PMOS + g m NMOS ) under low V DD and voltage headroom. However, they suffer of limited intrinsic gain and common-mode rejection in nanometer-scale technologies.
An alternative approach [17,18,19,20,21,22,23,24,25,26,27] aims at the implementation of analog functions by digital means. Leveraging this concept, a VCO-based OTA [28] and a digital-based [15] OTA (DB-OTA), Figure 1f,g, have been recently proposed [13,16]. Both OTAs are based on time-domain information processing and prove to be very good candidates for efficient ULV operation. Their operation, however, can be impaired by process variations and mismatch, so that an ad-hoc calibration is required for acceptable yield [16,29]. The design of a calibration network for DB-OTAs is critical since it can possibly impair the versatility and limit the power and area advantage of these solutions. The design of a traditional calibration network, in particular, can be not compatible with DB-OTA implementations by small standard cell libraries and by Field Programmable Gate Arrays (FPGAs), in which a limited set of gates is available and the geometrical dimensions of the calibration transistors cannot be finely tuned by the designer. At the same time, the dynamic calibration approach proposed in [29] to address these limitations results in increased power.
In this paper, the dynamic digital calibration (DDC) and static digital calibration (SDC) of DB-OTAs are addressed. In particular, the trade-off between area/power overhead and performance in post-calibrated Digital-Based OTAs [16,29], is deeply investigated on a 300 mV -power-supply 180 nm CMOS standard-cell DB-OTA by extensive post-layout simulations. Moreover, the possibility of replacing the Digital Pulse-Width Modulation (DPWM) adopted in [29] for DDC by Digital Dyadic Pulse Modulation (DDPM) [30], which shows better spectral properties for dithering purposes [31], is explored for the first time.
The paper is organized as follows: in Section 2, the DB-OTA operation and its limitations are described along with the classical SDC approach. Then, DPWM and DDPM modulations are introduced in Section 3, as well as their application in digital calibration to dynamically compensate the effects of process variations and device mismatch on DB-OTA offset. The effectiveness of the proposed calibration strategies and their impact on DB-OTA performance is then verified in Section 4 by Monte-Carlo (MC) post-layout simulation. In Section 5, some concluding remarks are drawn.

2. Digital-Based OTA

In this section, the operation of a DB-OTA [15,16] is revised highlighting the effects of process variations and mismatch that will be addressed by the calibration techniques considered in this paper.

2.1. Basic Operation

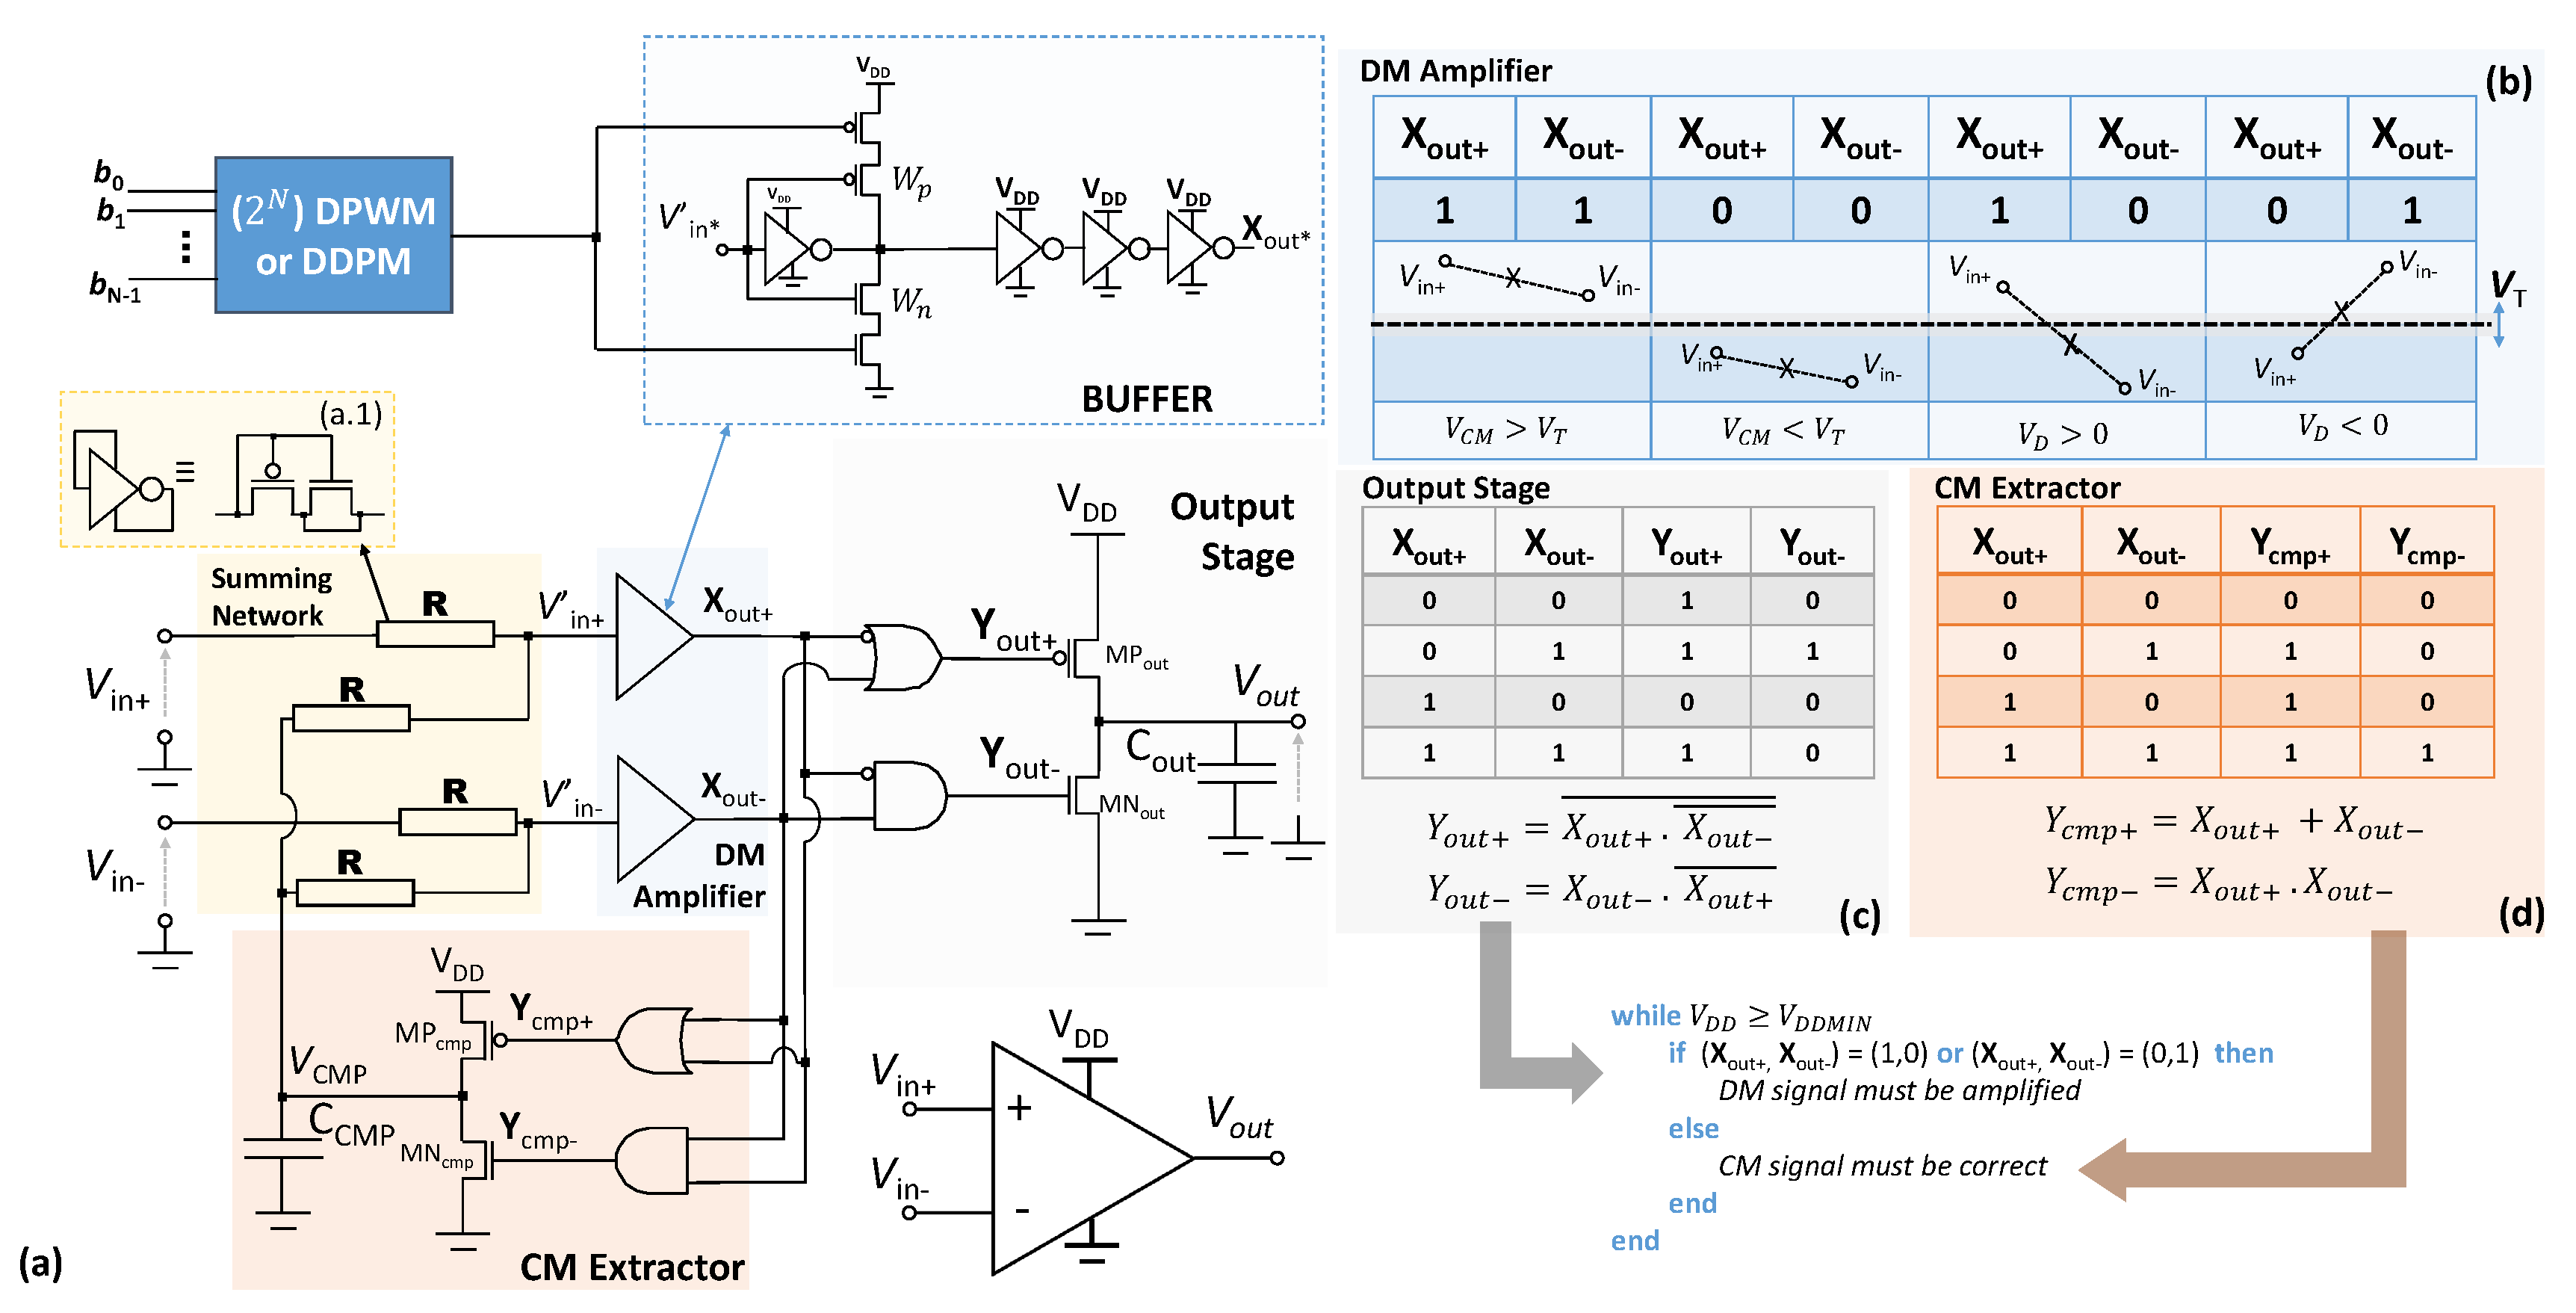
The schematic of the DB-OTA considered in this work is shown in Figure 2a. The circuit is intended to implement the functionality of an OTA by digital means, i.e. to amplify the differential component of the input signal v d = V in + V in while rejecting the common mode component v cm = V in + + V in 2 .
For this purpose, the DB-OTA includes a Differential-Mode (DM) amplifier, a Common-Mode (CM) extractor block, a summing network, and an output stage, as detailed in [16].
The DM Amplifier consists of two digital buffers which provide two logical outputs X out + and X out depending on the level of the input voltages with respect to the trip points ( V T ) of the voltage buffers, resulting in four possible cases:
( X out + , X out ) = ( 0 , 0 ) , ( 1 , 1 ) , ( 1 , 0 ) , ( 0 , 1 )
As shown in Figure 2b, whenever ( X out + , X out ) = ( 1 , 0 ) , ( 0 , 1 ) , it follows that v d > 0 or v d < 0 respectively, so the output stage needs to be activated to increase or decrease V out , accordingly. For this purpose the gate signals given by the Boolean equations in Figure 2c are applied to the output stage.
When ( X out + , X out ) = ( 0 , 0 ) , ( 1 , 1 ) , the transistors MN cmp ( MP cmp ) of the CM Extractor are operated according to the Boolean equations in Figure 2d, to increase (decrease) the capacitor C CMP voltage, V CMP , which is added to the external inputs V in + ( ) through the summing network:
V in + ( ) = V CMP + V in + ( ) 2
so that to compensate the CM input signal variations in the inputs V in + ( ) of the DM Amplifier. As described in [15], this behavior of the CM Extractor results in dynamic common mode tracking.
When the CM input component is within the CM input range, the transistors MP out and MN out are operated by digital pulses with a duration proportional to v d so that to charge or discharge C OUT . A more detailed analysis of the circuit can be found in [15].

2.2. Process Variations and Mismatch

The ULV DB-OTA operation can be severely impaired by process variations and mismatch in the trip points V T [32] of the first inverters of the DM amplifier, which result in an input offset voltage [15]:
V OFF = Δ V T + I OUT C OUT Δ t D
where
Δ V T = V T 1 V T 2
is the difference of the trip points V T 1 and V T 2 of the first inverters, both expressed in terms of technology and geometrical parameters as:
V T = κ T q log I D 0 P W L P I D 0 N W L N + V DD n P 1 n P + 1 n N ,
Δ t D is the difference in the propagation delays of the two branches of the OTA, I OUT is the output stage current (assumed to be fixed for the sake of simplicity), I D 0 N ( P ) is the zero- v G S drain current of nMOS (pMOS) in weak inversion and it is process parameter dependent, n N ( P ) is the subthreshold slope factor of the nMOS (pMOS) device. All the other symbols have their usual meaning [32].
For minimum-size devices, the offset predicted by Equation (3) can be easily large enough to saturate the DB-OTA, thus fully impairing the DB-OTA operation, and needs to be compensated.
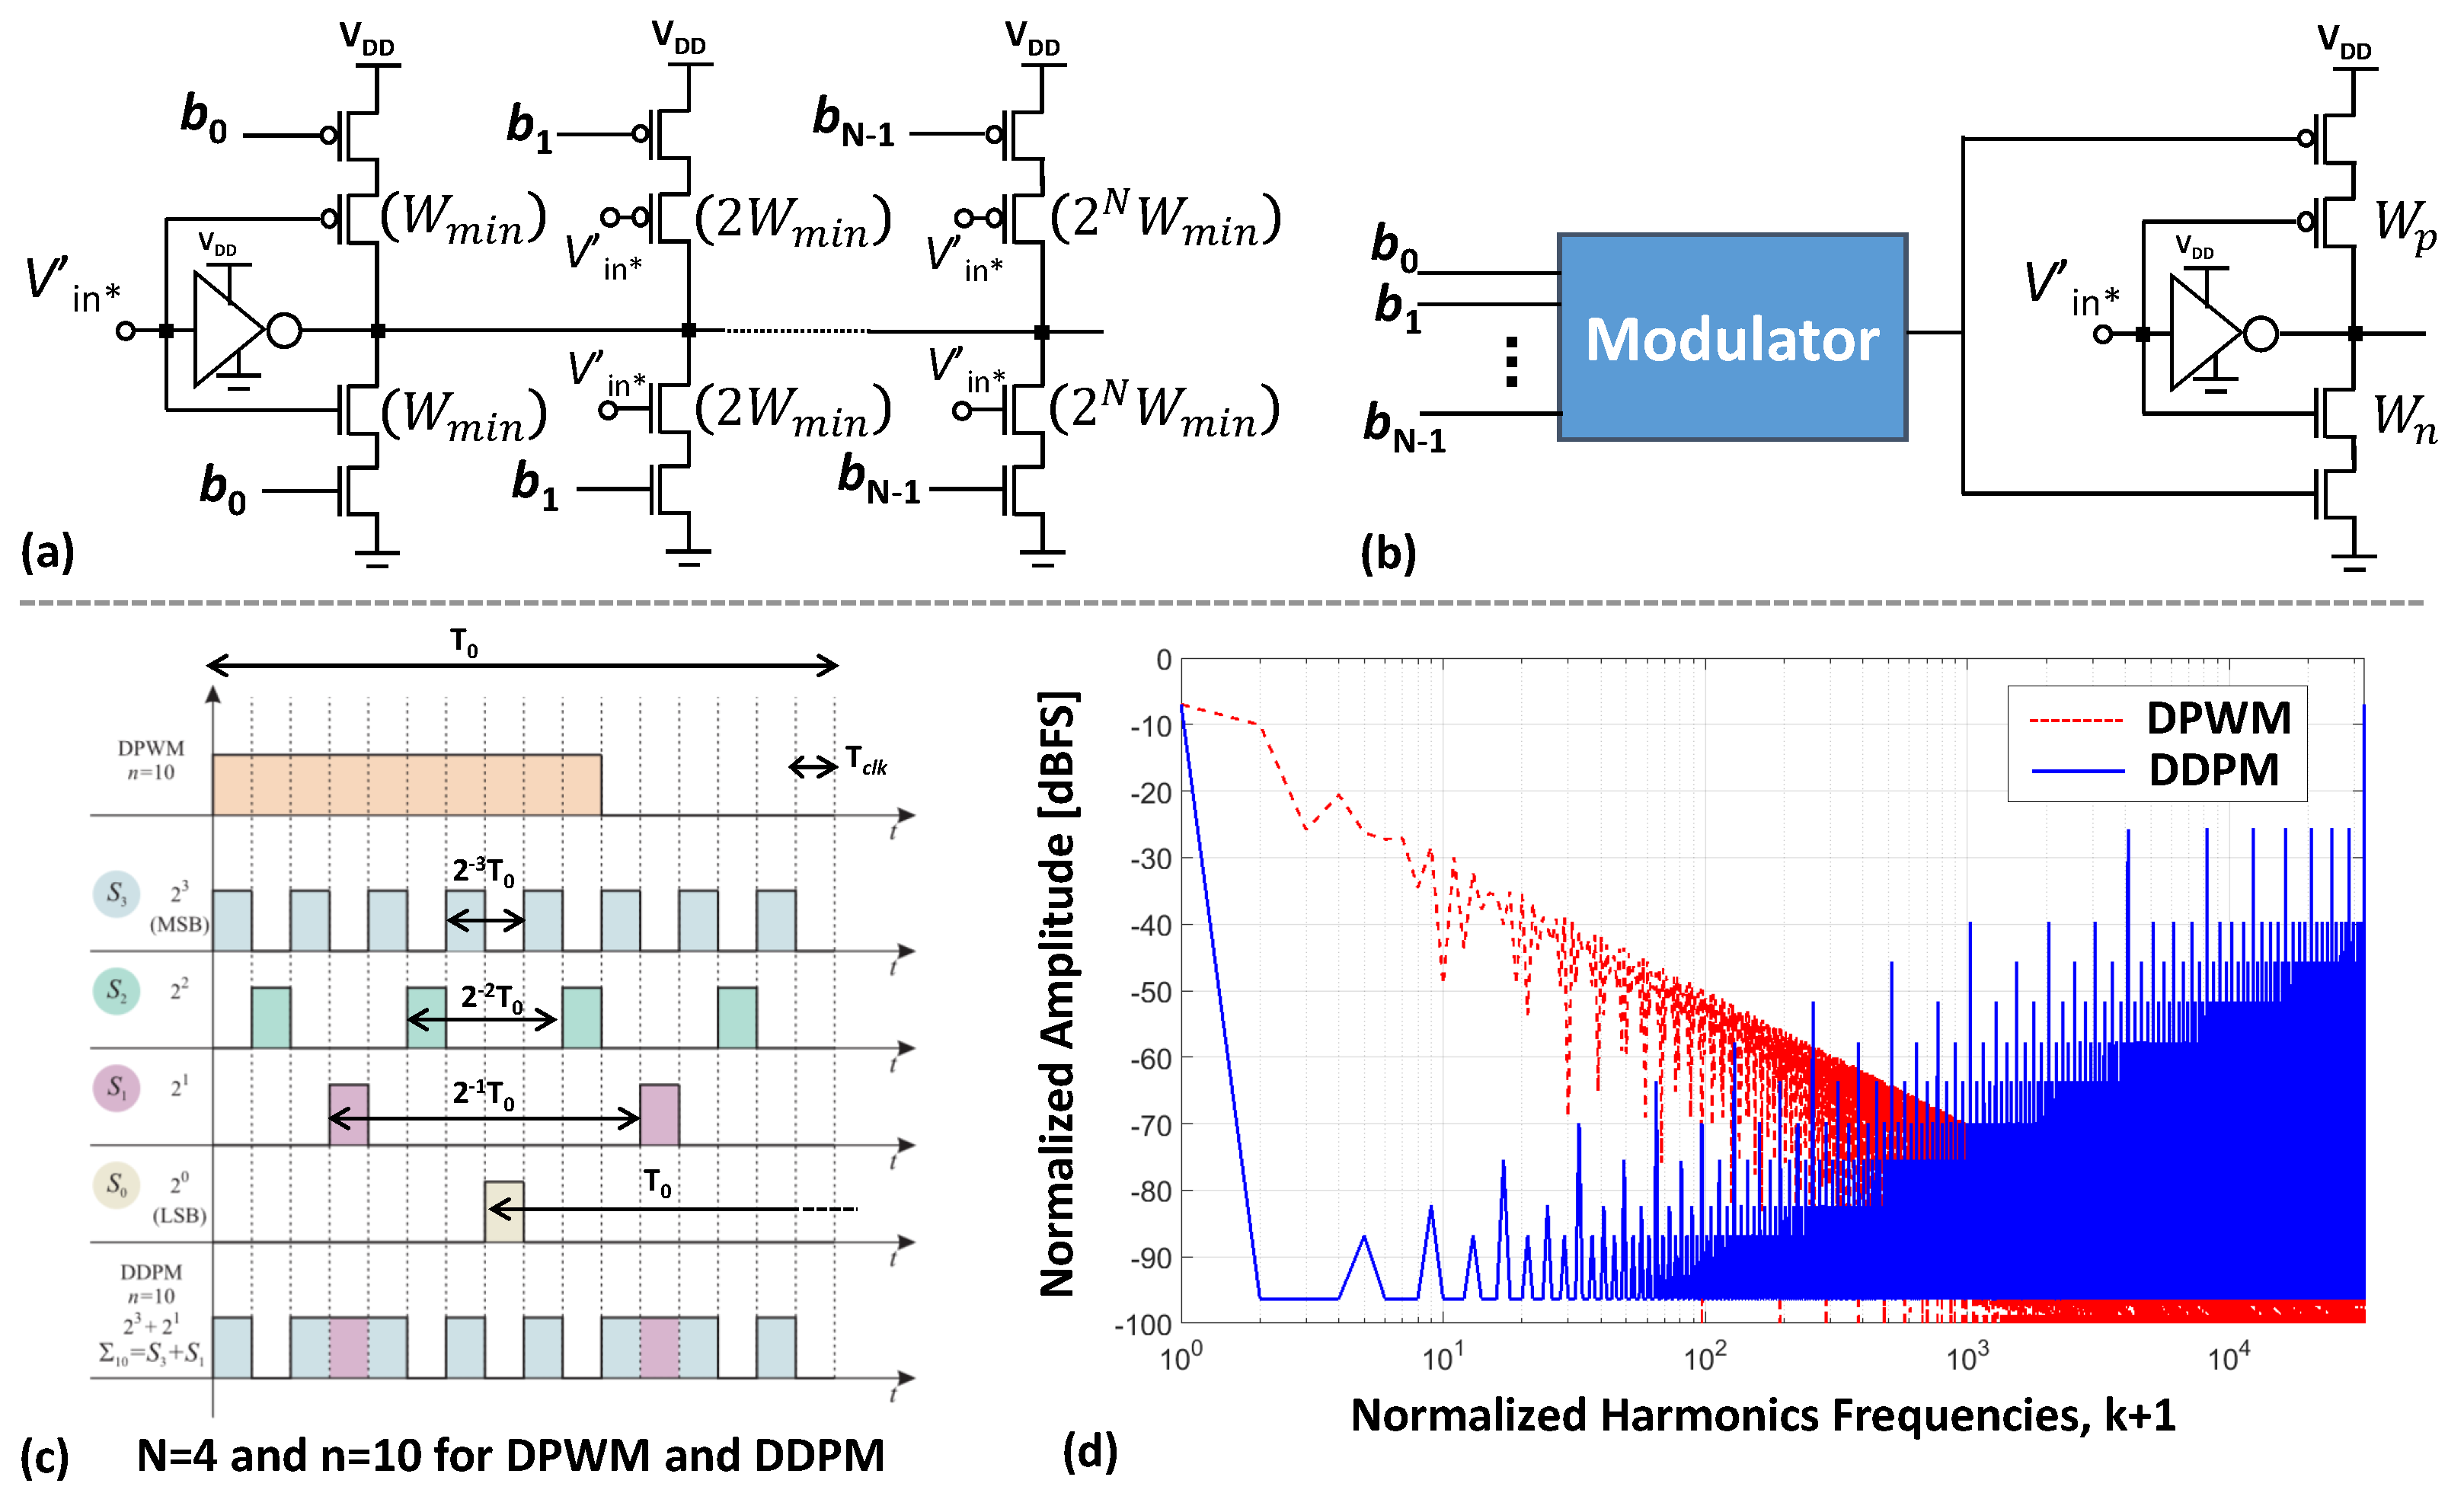
For this purpose, the dependence of the trip points of a CMOS inverter on the aspect ratios of the pull-up and pull-down devices, given by Equation (5), is leveraged in the post-fabrication SDC (Figure 3a) procedure proposed in [16], which makes it possible to tune the effective aspect ratio of either the pull-up or the pull-down branch by enabling/disabling binary weighted 2 i W min transistors in parallel to first inverters of the DM amplifier, based on a 8-bit calibration code b i , n with i = 0 N 1 .
This calibration procedure, however, is not compatible with a pure digital flow and requires extra area and analog design effort. In view of these limitations, all-Digital Dynamic Calibration (DDC) based on DPWM has been first explored in [29] and will be further investigated in this work, together with an alternative DDC approach based on the DDPM modulation.

3. Dynamic Digital Calibration

In this section, the digital pulse width modulation (DPWM) and the dyadic digital pulse modulation (DDPM) are first introduced and then their application to DDC of a DB-OTA is proposed in Section 3.2.

3.1. Digital PWM (DPWM) Modulation

Pulse Width Modulation (PWM) is a technique intended to generate a low-frequency output by extracting the DC component D · V DD of a square wave with high level V DD , low level 0 V, duty cycle D, and frequency f 0 = 1 T 0 high enough to be conveniently filtered.
A Digital PWM (DPWM) signal with quantized duty cycle D = n / 2 N can be expressed as:
v DPWM , n ( t ) = V DD k = + Π t n T clk 1 2 2 N n k ,
where
Π ( x ) = 1 | x | < 1 2 1 2 | x | = 1 2 0 | x | > 1 2 ,
and
n = i = 0 N 1 b i , n 2 i
in which T clk is the bit period and b i , n are the binary digits of the number n represented by N unsigned bits. Such a signal can be generated as a digital stream at clock frequency T clk = T 0 2 N consisting of n ones followed by 2 N n zeros, as shown in Figure 3c.
Looking at the spectrum of a DPWM signal, which is plotted in red in Figure 3d for an input word n = 29,365 on N = 16 bits, it can be observed that most of the AC spurious spectral energy is concentrated at low frequencies. As a consequence, a low pass filter with very steep transition from the pass band to the attenuated band is required to extract the DC component while suppressing low-frequency spurious components.

3.2. DDPM Modulation

In view of the limitations of DPWM discussed so far, the Dyadic Digital Pulse Modulation (DDPM) has been introduced in [30] as an alternative to DPWM for digital to analog conversion, so that to relax the low pass filter requirements while keeping the same mean value.
A DDPM stream v DDPM , n ( t ) for a given digital code n on N bits is defined as:
v DDPM , n ( t ) = V DD k = + x n ( t 2 N k T clk )
where
x n ( t ) = i = 0 N 1 h = 0 2 i 1 b i , n Π t T clk 2 N i h 2 N i 1 1 2
and can be regarded as the linear superposition of N orthogonal dyadic basis functions consisting of 2 i non-overlapped T clk pulses with i = 1 N 1 arranged so that to have more switching activities along the same T 0 , as illustrated in the bottom waveform of Figure 3c, where a DDPM modulated signal for the same N and n chosen for the DPWM stream in the top waveform is shown.
The higher switching activity of a DDPM signal results in more spectral energy at high frequencies and less at low frequency harmonics, thus releasing the requirements of the low pass filter intended to extract its DC component. This as can be clearly observed in the DDPM spectrum plotted in blue in Figure 3d for the same input word (n = 29,365) and resolution ( N = 16 bits) of the DPWM signal (spectrum in red curve).

3.3. Static and Dynamic Calibration Networks

The SDC and DDC based on DPWM and DDPM, which are considered and compared in this paper, are introduced in this Section.

3.3.1. Static Digital Calibration (SDC) Network

In Figure 3a, the post-fabrication SDC network adopted in [16] is depicted. Such a network comprises N inverters - in parallel with the DB-OTA input stage-with a strength scaled by 2 i W min . Each of such inverters includes an MOS switch in series with the pull-up branch and one in series with the pull-down branch, which can be turned on/off so that to enable/disable more pull-up and pull-down branches in parallel to the DB-OTA input stage based on a digital calibration word, so that to achieve minimum input offset voltage by compensating process- and mismatch-related variations, as described by Equations (3)–(5).

3.3.2. Dynamic Digital Calibration (DDC)

The proposed Dynamic Digital Calibration (DDC) network, which consists of only one enabled-inverter driven by the input signals ( V in ( + ) ) and also connected in parallel to the first stage of each branch in the DM amplifier, is depicted in Figure 3b. A DPWM or a DDPM modulator are then connected to the DDC network to modulate the input signal in the two proposed DDC implementations.
The operation of the calibration network can be described as follows. The pull-up (pull-down) network of the calibration inverter can be connected to the supply (to ground) through a pMOS (nMOS) power gating switch. When the pMOS (nMOS) gating switch is on, the pMOS (nMOS) of the calibration inverter, with width W n ( W p ) is enabled and connected in parallel to the nMOS (pMOS) device in the first stage of the DM amplifier, thus effectively increasing its width and significantly reducing (increasing) its trip point according to Equation (5).
When the gating switches are periodically operated with frequency f = 1 T 0 larger than the DB-OTA GBW, it is observed that periodically enabling the gates has the same net effect on the trip points of the DM amplifier gates as increasing the width of the DM amplifier devices by a fraction D W n ( D W p ) of the calibration inverter width W n ( W p ), being D = T EN T 0 the effective enabling duty cycle, where T EN is the overall time the calibration inverter is enabled over the period T 0 . This approach is adopted in what follows for dynamic offset calibration of the OTA, considering both DPWM and DDPM streams as gating signals for the calibration inverter.

4. Simulation Results

To compare the calibration approaches (SDC and DDC using DPWM and DDPM modulations), a DB-OTA designed in CMOS 180 nm technology has been considered [16,29]. The DB-OTA layout, including the SDC calibration network, occupies less than 1500 μ m 2 silicon area, as shown in Figure 4a.
In [16], the proposed DB-OTA performs amplification at V DD = 300 mV power supply driving up to 80 pF C LOAD and its nominal performance, verified by post-layout simulations, are summarized in the next subsection. Then, the feasibility to replace the SDC network introduced in [16] by the DDCs described above is verified by post-layout MonteCarlo simulations.

4.1. Performance under Nominal Conditions

The input and output waveforms of the ULV DB-OTA operated at V DD = 300 mV and connected in the voltage follower configuration, with a sine wave input at 30 Hz frequency, 50 mV peak amplitude and C out = 80 pF are reported in Figure 4b. In this configuration, a THD less than 2 % and 2 nW power consumption are achieved. In the same figure, a detail of the waveform reveals the step-wise changes in v out related to the intrinsic digital characteristic of the DB-OTA [15]. The ULV DB-OTA frequency response, calculated through Fast Fourier Transform (FFT) analysis of transient simulations, as done in [16], is reported in Figure 4d for C L O A D = 10 , 45 , 80 pF . According to that, the DB-OTA shows 35 dB DC gain and 0.85 , 1.3 and 2.48 kHz Gain Bandwidth Product (GBW) with phase margins 76 , 68.5 and 57 , respectively.

4.2. Process Variations, SDC and DDC comparison

The DB-OTA without calibration has been simulated under process variations for the same voltage follower configuration as in Section 4.1 and for V amp = 50 mV , C out = 80 pF and f in = 30 Hz by Montecarlo (MC) simulations on 100 samples. The statistical sampling method used within the MC analysis was the low-discrepancy sequence sampling (LDS) to get evenly distributed samples over the statistical space.
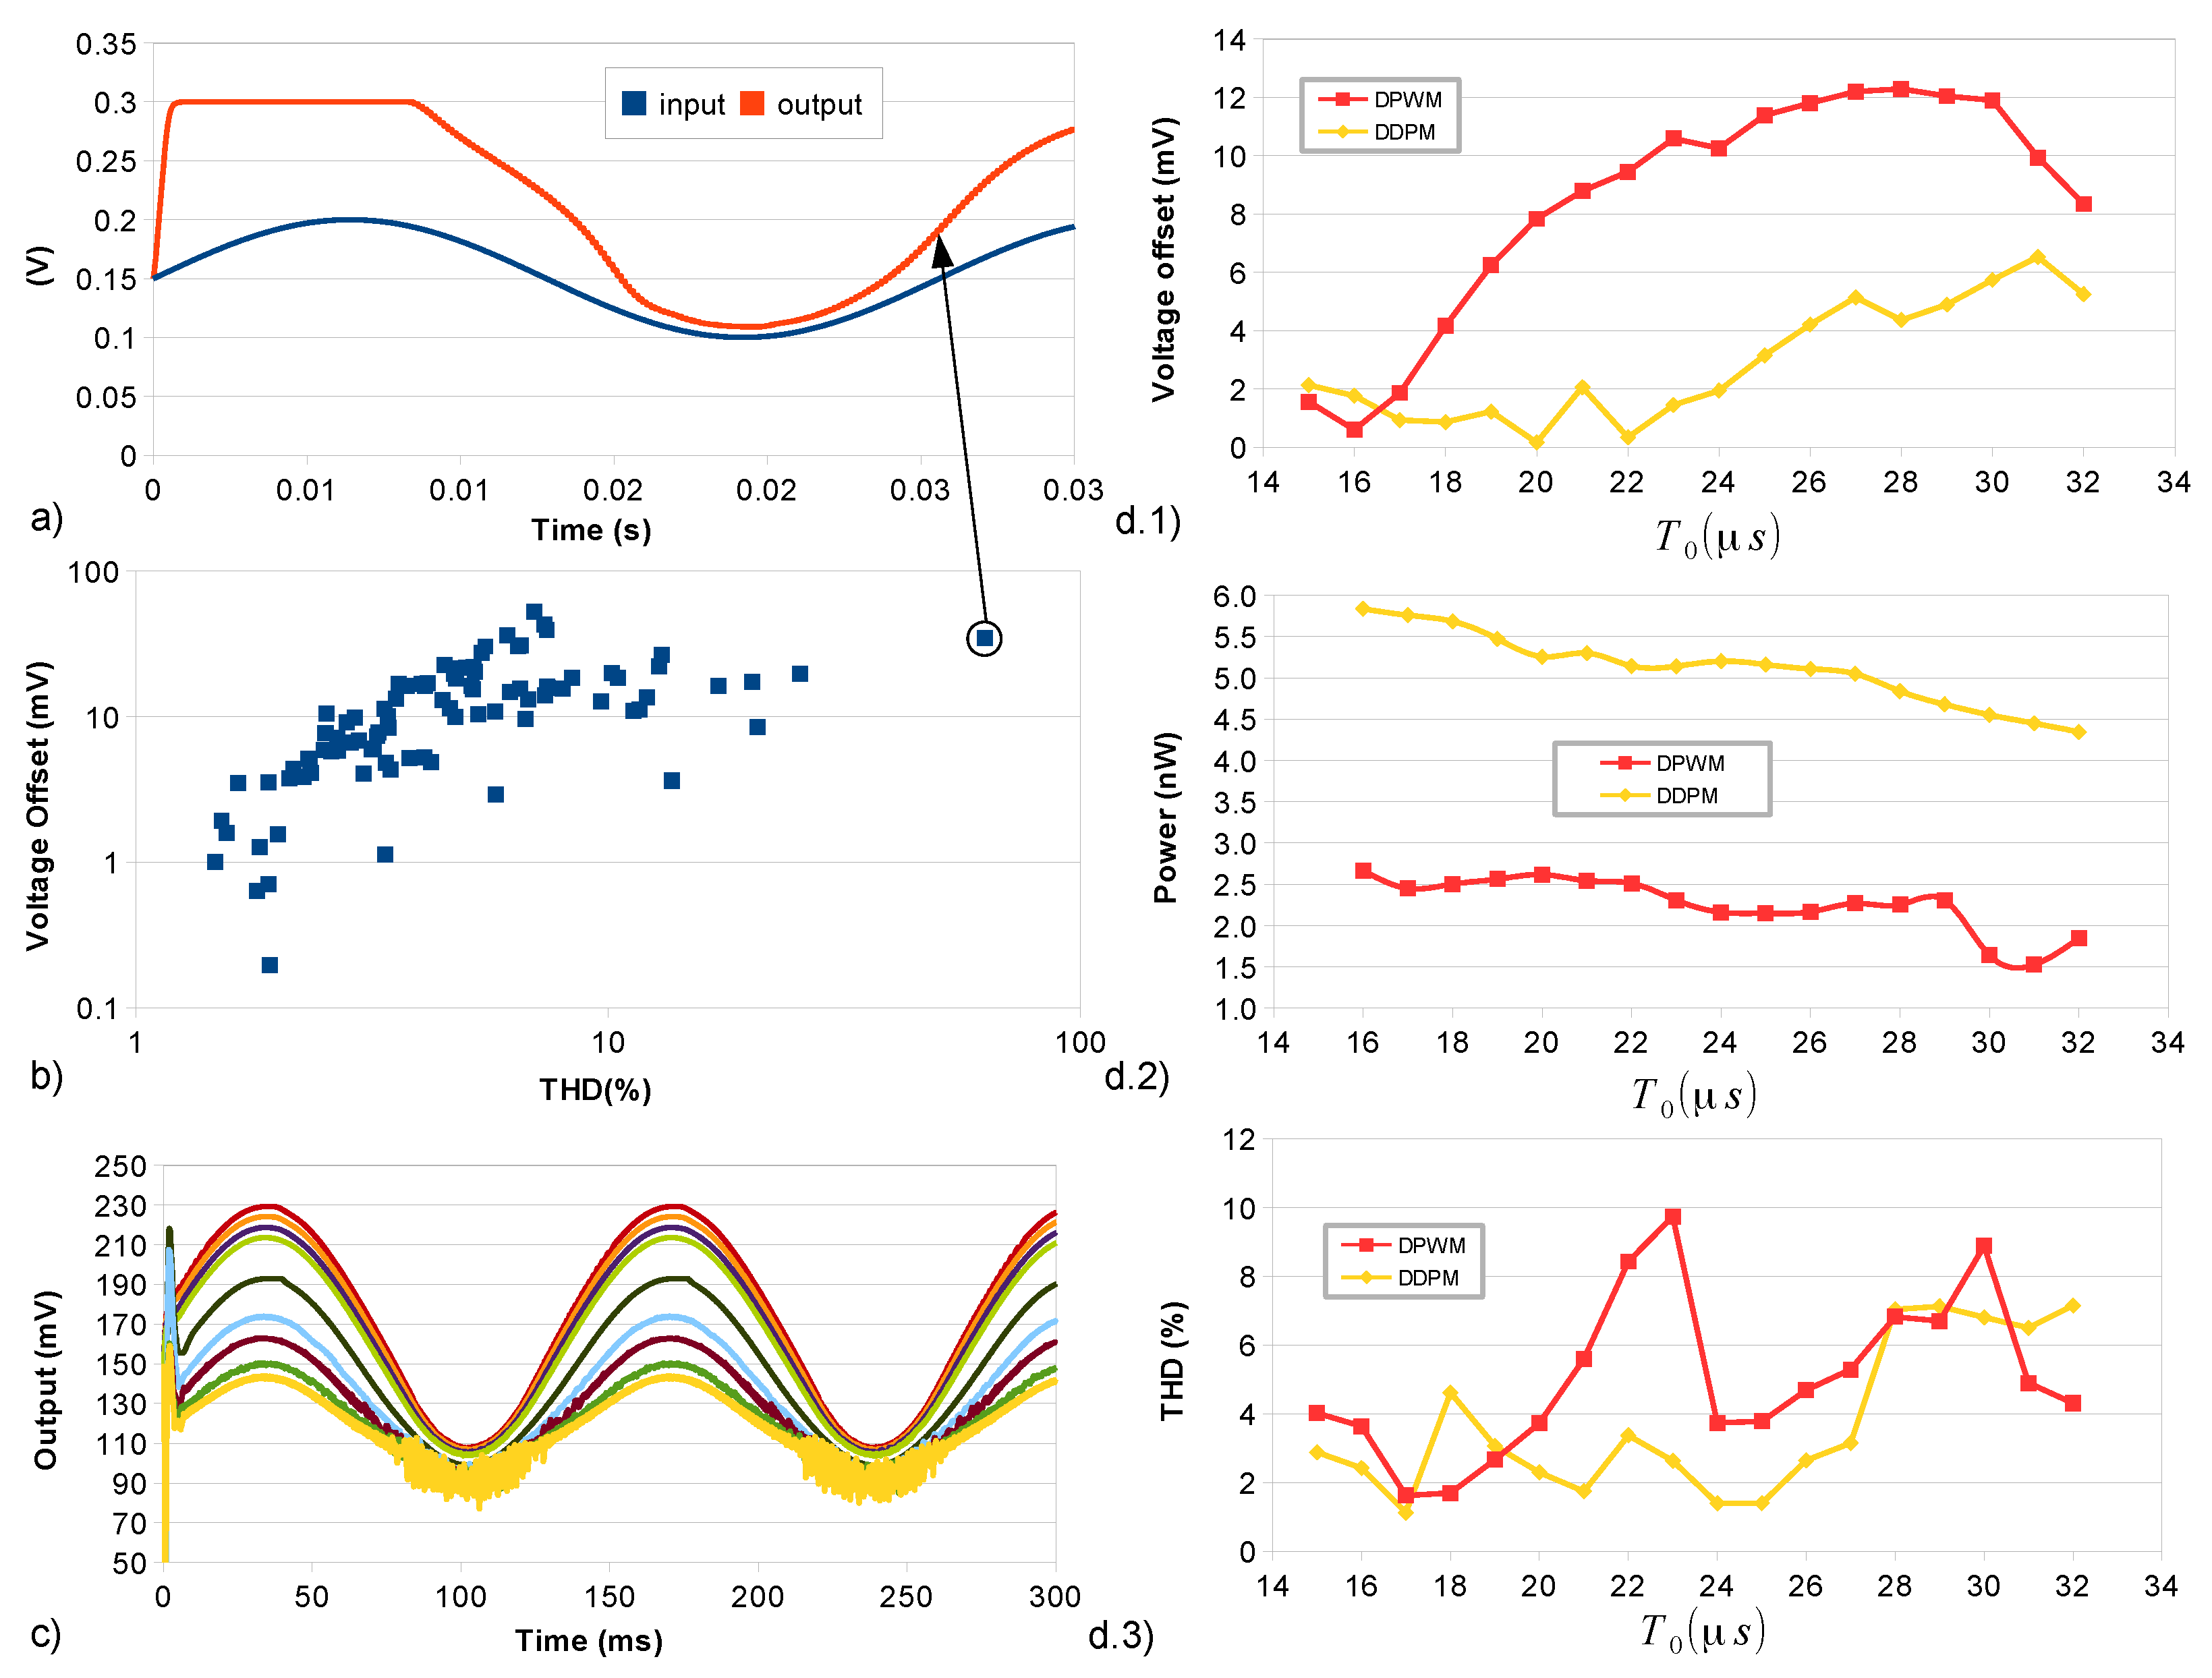
The V in and V out simulated waveforms for a bad sample resulting from this analysis are shown in Figure 5a. Mainly due to mismatch in the DM amplifier first inverter, the output signal of this sample is pushed towards V DD distorting the signal and increasing the offset voltage.
To gain more insight about the effects of process variations, a scattered plot of the THD (%) and offset voltage (mV) for the 100 MC samples is depicted in Figure 5b. This analysis reveals that more than 50% of the samples show an offset exceeding 10 mV or a THD of more than 5%, confirming the relevant impact of process variations on the DB-OTA performance. The same analysis also reveals a significant correlation between THD and offset (Pearson’s correlation coefficient of 40%). As a consequence, if the offset is attenuated by calibration, the THD can be also improved and minimum offset voltage can be conveniently targeted as a global calibration goal.
In view of that, the SDC and DDC have been adopted and compared in the following to tweak the offset the DB-OTA as shown Figure 5c. The calibration simulation flow and the results of the simulations are discussed in what follows.

4.2.1. SDC and DDC Simulation Flow

The high-level simulation flow illustrated in Figure 6 has been adopted to compare the SDC and DDC techniques considered in this paper. After performing a first MC without calibration by LDS statistical sampling method (step #1), statistical corners are created for each sample in the Cadence environment, so that to get direct access to each sample keeping fixed the random number generator seed in MC simulations (step #2). Next (step #3), SDC and DDC techniques are systematically applied to each sample so that to find the 3-bit calibration code (to be applied as an input decoder enabling the calibration network in SDC and as the DPWM/DDPM modulators input words for DDC) which minimizes the simulated input offset voltage. Calibration signals applied just to the non-inverting input branch have been considered to reduce power and area overhead. In step #4, the results are post-processed to evaluate the main DIGOTA performance, which are presented and discussed in what follows.

4.2.2. SDC and DDC Statistical Characterization

The calibrated DB-OTA input offset voltage, power (DB-OTA alone) and THD evaluated by the simulation flow in Figure 6 for one representative sample are plotted in Figure 5d versus the period T 0 of DDPM and DPWM calibration patterns applied to the enabling transistors in Figure 3b, revealing that improved offset and THD (both slightly better for DDPM compared to DPWM, as expected in consideration of the better spectral characteristics of the DDPM modulation.) can be achieved at lower T 0 at the cost of an increased power consumption, which is more relevant for DDPM, in view of the higher switching activity. An extra power overhead of around 6 nW and silicon area of 25 μ m × 25 μ m should be also taken into account for DPWM and DDPM modulators [29]. Trading off power and accuracy, a different period T 0 = 24 μ s for DPWM and 32 μ s for DDPM have been considered as an optimal choice for the two DDC strategies.
To make a fair comparison over different samples, SDC and DDCs have been considered to trim a population of 100 samples keeping the same MC seed used in Figure 5b. Optimal 3-bit calibration words leading to minimum input offset voltage have been first identified for each sample for SDC, and both the DPWM and the DDPM DDC techniques. Then, such optimal calibration words have been applied in simulations, so that to compare the performance statistics of the calibrated samples.
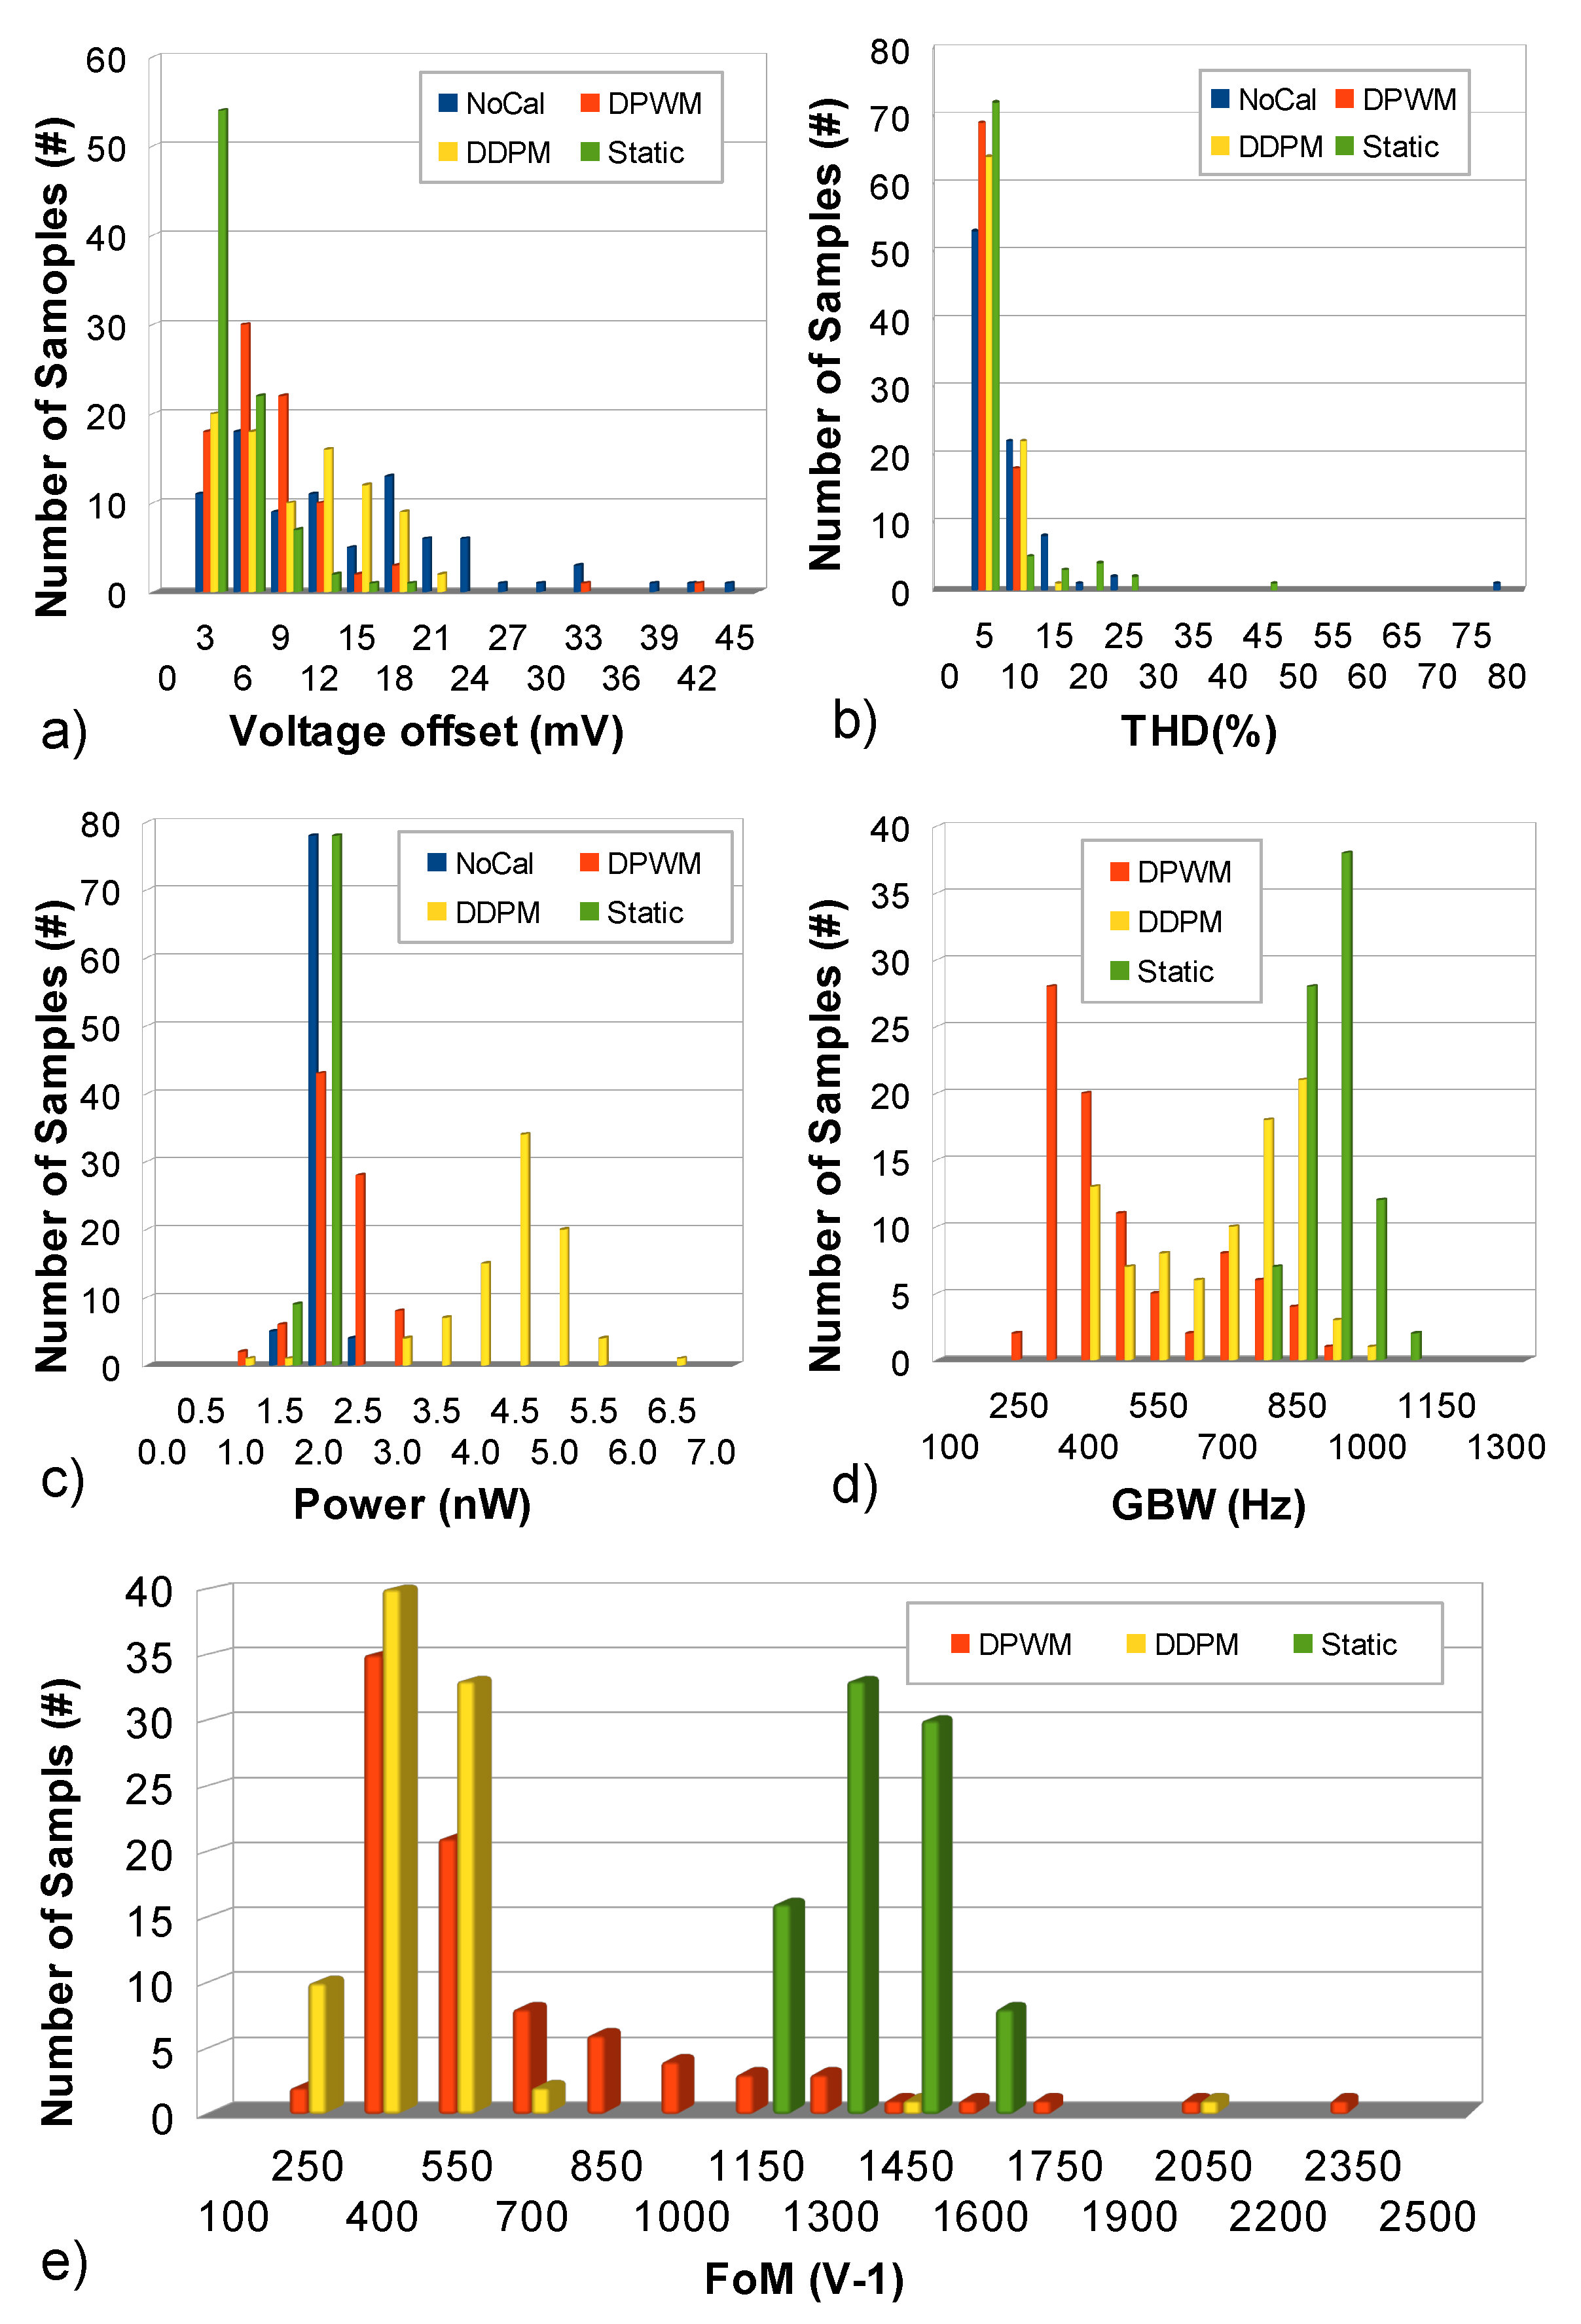
The histogram of the DB-OTA voltage offset is reported in Figure 7a before and after calibration. Without calibration (blue bars), the mean ( μ ) and standard deviation ( σ ) are 12.26 mV and 9.29 mV , respectively. Using the SDC (green bars), μ = 3.15 mV and σ = 2.9 mV have been achieved. As far as DDC is concerned, the simulated mean value and standard deviation are 6.86 mV and 5.8 mV , respectively for DPWM (red bars) and 8.19 mV and 5.34 mV for DDPM (yellow bars). The histograms of THD, Power, GBW and F O M S = 100 G B W · C L o a d I DD for the calibrated samples are reported in Figure 7b–e.
In Table 1, the mean and standard deviation of each performance parameter before calibration and for the SDC and DDC calibration techniques are compared. The DDC shows an average offset reduction of 1.79× for DPWM and 1.5× for DDPM modulation, increasing the THD yield by 1.3× and 1.2×, respectively, for 5% THD as threshold.
In Table 2, a comparison with state of the art ULV OTAs reveals competitive performance also for the worst case sample after calibration. It is worth to stress that worst case sample term is used here to define the sample with highest THD and highlighted in Figure 5b.

4.3. Discussion

Based on the results presented in Figure 3 and Figure 7 and Table 1, both the traditional SDC and the novel DDC techniques considered in this paper have been shown to be effective in mitigating the adverse effects of process variations and mismatch in a DB-OTA circuit, so that to recover proper functionality even for the worst samples.
Moreover, it is observed that in both the proposed DPWM and DDPM DDC techniques, calibration accuracy is related to the period T 0 of the dynamic calibration signal and is traded off with an increased power consumption in the DB-OTA circuit and in the modulator. Comparing DPWM and DDPM, a higher accuracy is observed for DDPM in Figure 3 up to longer periods T 0 , in view of the spectral characteristics of the DDPM modulation. By the way, this advantage is offset by the higher switching activity of DDPM, which also results in higher power consumption compared to DPWM.
Comparing DDC and SDC techniques on the same samples in Figure 7 and Table 1, traditional SDC, which requires a semi-custom flow, appears to be preferable to DDC in view of the reduced power overhead and better accuracy. At the same time, DDC, which is fully compatible with a digital flow, provides an effective opportunity to calibrate process and mismatch variations in DB-OTA synthesized by small standard-cell libraries or implemented by FPGAs, where the aspect ratio of calibration devices is not fully under the control of the designer and SDC is therefore not a viable option.

5. Conclusions

The effectiveness of fully digital dynamic calibration techniques based and DPWM and DDPM modulations in compensating the adverse effect of process variations and mismatch in ULV DB-OTAs has been analysed and compared to a classical static calibration approach. In particular, the effectiveness of dynamic calibration techniques on non-functional DB-OTA samples has been demonstrated with reference to an ULV DB-OTA designed in 180 nm CMOS and operating at 300 mV supply. Based on the results of Monte-Carlo (MC) post-layout simulations, a 1.79× and 1.5× offset voltage reduction and a THD yield enhancement by 1.3× and 1.2× have been achieved by DPWM and DDPM DDC, respectively, while keeping reasonable performance compared with the current ULV state-of-the-art OTAs and at the cost of small extra silicon area and power consumption.

Author Contributions

Conceptualization, P.T. and P.C.; Data curation, P.T.; Funding acquisition, P.C.; Investigation, P.T.; Methodology, P.T. and P.C.; Resources, P.C.; Software, P.T.; Supervision, P.C., H.K. and S.B.; Validation, P.T.; Writing—original draft, P.T.; Writing—review & editing, P.C., H.K. and S.B. All authors have read and agreed to the published version of the manuscript.

Funding

This research received no external funding.

Conflicts of Interest

The authors declare no conflict of interest.

Abbreviations

The following abbreviations are used in this manuscript:
MDPIMultidisciplinary Digital Publishing Institute
ULVUltra Low Voltage
DB-OTAsDigital-Based Operational Transconductance Amplifiers
DPWMDigital Pulse Width Modulation
DDPMDyadic Digital Pulse5Modulation
MCMonte-Carlo
IoTInternet of Things
CMOSComplementary Metal-Oxide Semiconductor
MOSMetal-Oxide Semiconductor
OTAOperational Transconductance Amplifier
VCOVoltage Controlled Oscillator
CMIRCommon Mode Input Range
PMUPower Management Unit
AFEAnalog Front-End
ULPUltra Low Power
μ Pmicroprocessor
MACMedia Access Control
SDCStatic Digital Calibration
DDCDynamic Digital Calibrations
DMDifferential-Mode
CMCommon-Mode
GBWGain Bandwidth Product
THDTotal Harmonic Distortion
FFTFast Fourier Transform

References

  1. Kim, S.; Vyas, R.; Bito, J.; Niotaki, K.; Collado, A.; Georgiadis, A.; Tentzeris, M.M. Ambient RF Energy-Harvesting Technologies for Self-Sustainable Standalone Wireless Sensor Platforms. Proc. IEEE 2014, 102, 1649–1666. [Google Scholar] [CrossRef]
  2. Zhang, Y.; Zhang, F.; Shakhsheer, Y.; Silver, J.D.; Klinefelter, A.; Nagaraju, M.; Boley, J.; Pandey, J.; Shrivastava, A.; Carlson, E.J.; et al. A Batteryless 19 μW MICS/ISM-Band Energy Harvesting Body Sensor Node SoC for ExG Applications. IEEE J. Solid-State Circuits 2013, 48, 199–213. [Google Scholar] [CrossRef]
  3. Klinefelter, A.; Roberts, N.E.; Shakhsheer, Y.; Gonzalez, P.; Shrivastava, A.; Roy, A.; Craig, K.; Faisal, M.; Boley, J.; Oh, S.; et al. A 6.45 μW self-powered IoT SoC with integrated energy-harvesting power management and ULP asymmetric radios. In Proceedings of the IEEE International Solid-State Circuits Conference, San Francisco, CA, USA, 22–26 February 2015. [Google Scholar]
  4. Alioto, M. Enabling the Internet of Things—From Integrated Circuits to Integrated Systems, 1st ed.; Springer: Berlin, Germany, 2017. [Google Scholar]
  5. Lee, J.; Zhang, Y.; Dong, Q.; Lim, W.; Saligane, M.; Kim, Y.; Jeong, S.; Lim, J.; Yasuda, M.; Miyoshi, S.; et al. A Self-Tuning IoT Processor Using Leakage-Ratio Measurement for Energy-Optimal Operation. IEEE Solid-State Circuits Mag. 2020, 55, 87–97. [Google Scholar] [CrossRef]
  6. Kinget, P.R. Scaling analog circuits into deep nanoscale CMOS: Obstacles and ways to overcome them. In Proceedings of the 2015 IEEE Custom Integrated Circuits Conference (CICC), San Jose, CA, USA, 28–30 September 2015; pp. 1–8. [Google Scholar]
  7. Richelli, A.; Colalongo, L.; Kovacs-Vajna, Z.; Calvetti, G.; Ferrari, D.; Finanzini, M.; Pinetti, S.; Prevosti, E.; Savoldelli, J.; Scarlassara, S. A Survey of Low Voltage and Low Power Amplifier Topologies. J. Low Power Electron. Appl. 2018, 8, 22. [Google Scholar] [CrossRef] [Green Version]
  8. Yoon, Y.; Choi, D.; Roh, J. A 0.4 V 63 μW 76.1 dB SNDR 20 kHz Bandwidth Delta-Sigma Modulator Using a Hybrid Switching Integrator. IEEE J. Solid-State Circuits 2015, 50, 2342–2352. [Google Scholar] [CrossRef]
  9. Dessouky, M.; Kaiser, A. Very low-voltage digital-audio ΔΣ modulator with 88-dB dynamic range using local switch bootstrapping. IEEE J. Solid-State Circuits 2001, 36, 349–355. [Google Scholar] [CrossRef]
  10. Ferreira, L.; Sonkusale, R. A 60-dB Gain OTA Operating at 0.25-V Power Supply in 130-nm Digital CMOS Process. IEEE Trans. Circuits Syst. I Regul. Pap. 2014, 61, 1609–1617. [Google Scholar] [CrossRef]
  11. Lv, L.; Zhou, X.; Qiao, Z.; Li, Q. Inverter-Based Subthreshold Amplifier Techniques and Their Application in 0.3-V ΔΣ -Modulators. IEEE J. Solid-State Circuits 2019, 54, 1436–1445. [Google Scholar] [CrossRef]
  12. Michel, F.; Steyaert, M. A 250 mV 7.5 μW 61 dB SNDR SC ΔΣ Modulator Using Near-Threshold-Voltage-Biased Inverter Amplifiers in 130 nm CMOS. IEEE J. Solid-State Circuits 2012, 47, 709–721. [Google Scholar] [CrossRef]
  13. Kalani, S.; Bertolini, P.; Richelli, A.; Kinget, P. A 0.2 V 492 nW VCO-based OTA with 60 kHz UGB and 207 μVrms noise. In Proceedings of the IEEE International Symposium on Circuits and Systems, Baltimore, MD, USA, 28–31 May 2017; pp. 1–4. [Google Scholar]
  14. Kinget, P.; Kalani, S. Zero-Crossing-Time-Difference Model for Stability Analysis of VCO-Based OTAs. IEEE Trans. Circuits Syst. I Regul. Pap. 2020, 67, 839–851. [Google Scholar]
  15. Crovetti, P. A Digital-Based Analog Differential Circuit. IEEE Trans. Circuits Syst. I Regul. Pap. 2013, 60, 3107–3116. [Google Scholar] [CrossRef]
  16. Toledo, P.; Crovetti, P.; Klimach, H.; Bampi, S. A 300 mV-Supply, 2 nW-Power, 80 pF-Load CMOS Digital-Based OTA for IoT Interfaces. In Proceedings of the IEEE International Conference on Electronics, Circuits and Systems, Genoa, Italy, 27–29 November 2019; pp. 170–173. [Google Scholar]
  17. Crovetti, P.; Musolino, F.; Aiello, O.; Toledo, P.; Rubino, R. Breaking the boundaries between analogue and digital. Electron. Lett. 2019, 55, 672–673. [Google Scholar] [CrossRef]
  18. Aiello, O.; Crovetti, P.; Alioto, M. Fully Synthesizable, Rail-to-Rail Dynamic Voltage Comparator for Operation down to 0.3 V. In Proceedings of the IEEE International Symposium on Circuits and Systems Letters, Florence, Italy, 27–30 May 2018; pp. 1–5. [Google Scholar]
  19. Drost, B.; Talegaonkar, M.; Hanumolu, P. Analog Filter Design Using Ring Oscillator Integrators. IEEE J. Solid-State Circuits 2012, 47, 3120–3129. [Google Scholar] [CrossRef]
  20. Cai, G.; Zhan, C.; Lu, Y. A Fast-Transient-Response Fully-Integrated Digital LDO with Adaptive Current Step Size Control. IEEE Trans. Circuits Syst. I Regul. Pap. 2019, 66, 3610–3619. [Google Scholar] [CrossRef]
  21. Crovetti, P. A Digital-Based Virtual Voltage Reference. IEEE Trans. Circuits Syst. I Regul. Pap. 2015, 62, 1315–1324. [Google Scholar] [CrossRef]
  22. Aiello, O.; Crovetti, P.; Alioto, M. Standard Cell-Based Ultra-Compact DACs in 40-nm CMOS. IEEE Access 2019, 7, 126479–126488. [Google Scholar] [CrossRef]
  23. Unnikrishnan, V.; Vesterbacka, M. Time-Mode Analog-to-Digital Conversion Using Standard Cells. IEEE Trans. Circuits Syst. I Regul. Pap. 2014, 61, 3348–3357. [Google Scholar] [CrossRef] [Green Version]
  24. Park, J.; Hwang, Y.; Jeong, D. A 0.5-V Fully Synthesizable SAR ADC for On-Chip Distributed Waveform Monitors. IEEE Access 2019, 7, 63686–63697. [Google Scholar] [CrossRef]
  25. Weaver, S.; Hershberg, B.; Moon, M. Digitally synthesized stochastic flash ADC using only standard digital cells. In Proceedings of the Symposium on VLSI Circuits—Digest of Technical Papers, Honolulu, HI, USA, 10–13 June 2014; pp. 266–267. [Google Scholar]
  26. Crovetti, P.; Rubino, R.; Musolino, F. Relaxation digital-to-analogue converter. Electron. Lett. 2019, 55, 685–688. [Google Scholar] [CrossRef]
  27. Deng, W.; Yang, D.; Ueno, T.; Siriburanon, T.; Kondo, S.; Okada, K.; Matsuzawa, A. A Fully Synthesizable All-Digital PLL with Interpolative Phase Coupled Oscillator, Current-Output DAC, and Fine-Resolution Digital Varactor Using Gated Edge Injection Technique. IEEE J. Solid-State Circuits 2015, 50, 68–80. [Google Scholar] [CrossRef]
  28. Park, M.; Perrott, M. A multiphase PWM RF modulator using a VCO-based opamp in 45 nm CMOS. In Proceedings of the IEEE Radio Frequency Integrated Circuits Symposium, Anaheim, CA, USA, 23–25 May 2010; pp. 39–42. [Google Scholar]
  29. Toledo, P.; Aiello, O.; Crovetti, P. A 300 mV-Supply Standard-Cell-Based OTA with Digital PWM Offset Calibration. In Proceedings of the IEEE Nordic Circuits and Systems Conference, Helsinki, Finland, 29–30 October 2019; pp. 1–5. [Google Scholar]
  30. Crovetti, P. All-Digital High Resolution D/A Conversion by Dyadic Digital Pulse Modulation. IEEE Trans. Circuits Syst. I Regul. Pap. 2017, 64, 573–584. [Google Scholar] [CrossRef] [Green Version]
  31. Crovetti, P.S.; Usmonov, M.; Musolino, F.; Gregoretti, F. Limit Cycle-Free Digitally Controlled DC-DC Converters based on Dyadic Digital PWM. IEEE Trans. Power Electron. 2020. [Google Scholar] [CrossRef]
  32. Braga, R.; Ferreira, L.; Coletta, G.; Dutra, O. A 0.25-V calibration-less inverter-based OTA for low-frequency Gm-C applications. Microelectron. J. 2019, 83, 62–72. [Google Scholar] [CrossRef]
  33. Abdelfattah, O.; Roberts, G.; Shih, I.; Shih, Y. An Ultra-Low-Voltage CMOS Process-Insensitive Self-Biased OTA with Rail-to-Rail Input Range. IEEE Trans. Circuits Syst. I Regul. Pap. 2015, 62, 2380–2390. [Google Scholar] [CrossRef]
  34. Chatterjee, S.; Tsividis, Y.; Kinget, P. 0.5-V analog circuit techniques and their application in OTA and filter design. IEEE J. Solid-State Circuits 2005, 40, 2373–2387. [Google Scholar] [CrossRef]
  35. Veldandi, H.; Shaik, R. A 0.3-v pseudo-differential bulk-input ota for low-frequency applications. Circuits Syst. Signal Process. 2018, 37, 5199–5221. [Google Scholar] [CrossRef]
  36. Ferreira, L.; Pimenta, T.; Moreno, R. An Ultra-Low-Voltage Ultra-Low-Power CMOS Miller OTA with Rail-to-Rail Input/Output Swing. IEEE Trans. Circuits Syst. II Express Briefs 2007, 54, 843–847. [Google Scholar] [CrossRef]
  37. Woo, K.; Yang, B. A 0.25 V Rail-to-Rail Three-Stage OTA with an Enhanced DC GainA 0.25 V Rail-to-Rail Three-Stage OTA With an Enhanced DC Gain. IEEE Trans. Circuits Syste. II Express Briefs 2020. [Google Scholar] [CrossRef]
  38. Kulej, T.; Khateb, F. A 0.3-V 98-dB Rail-to-Rail OTA in 0.18μm CMOS. IEEE Access 2020, 8, 27459–27467. [Google Scholar] [CrossRef]
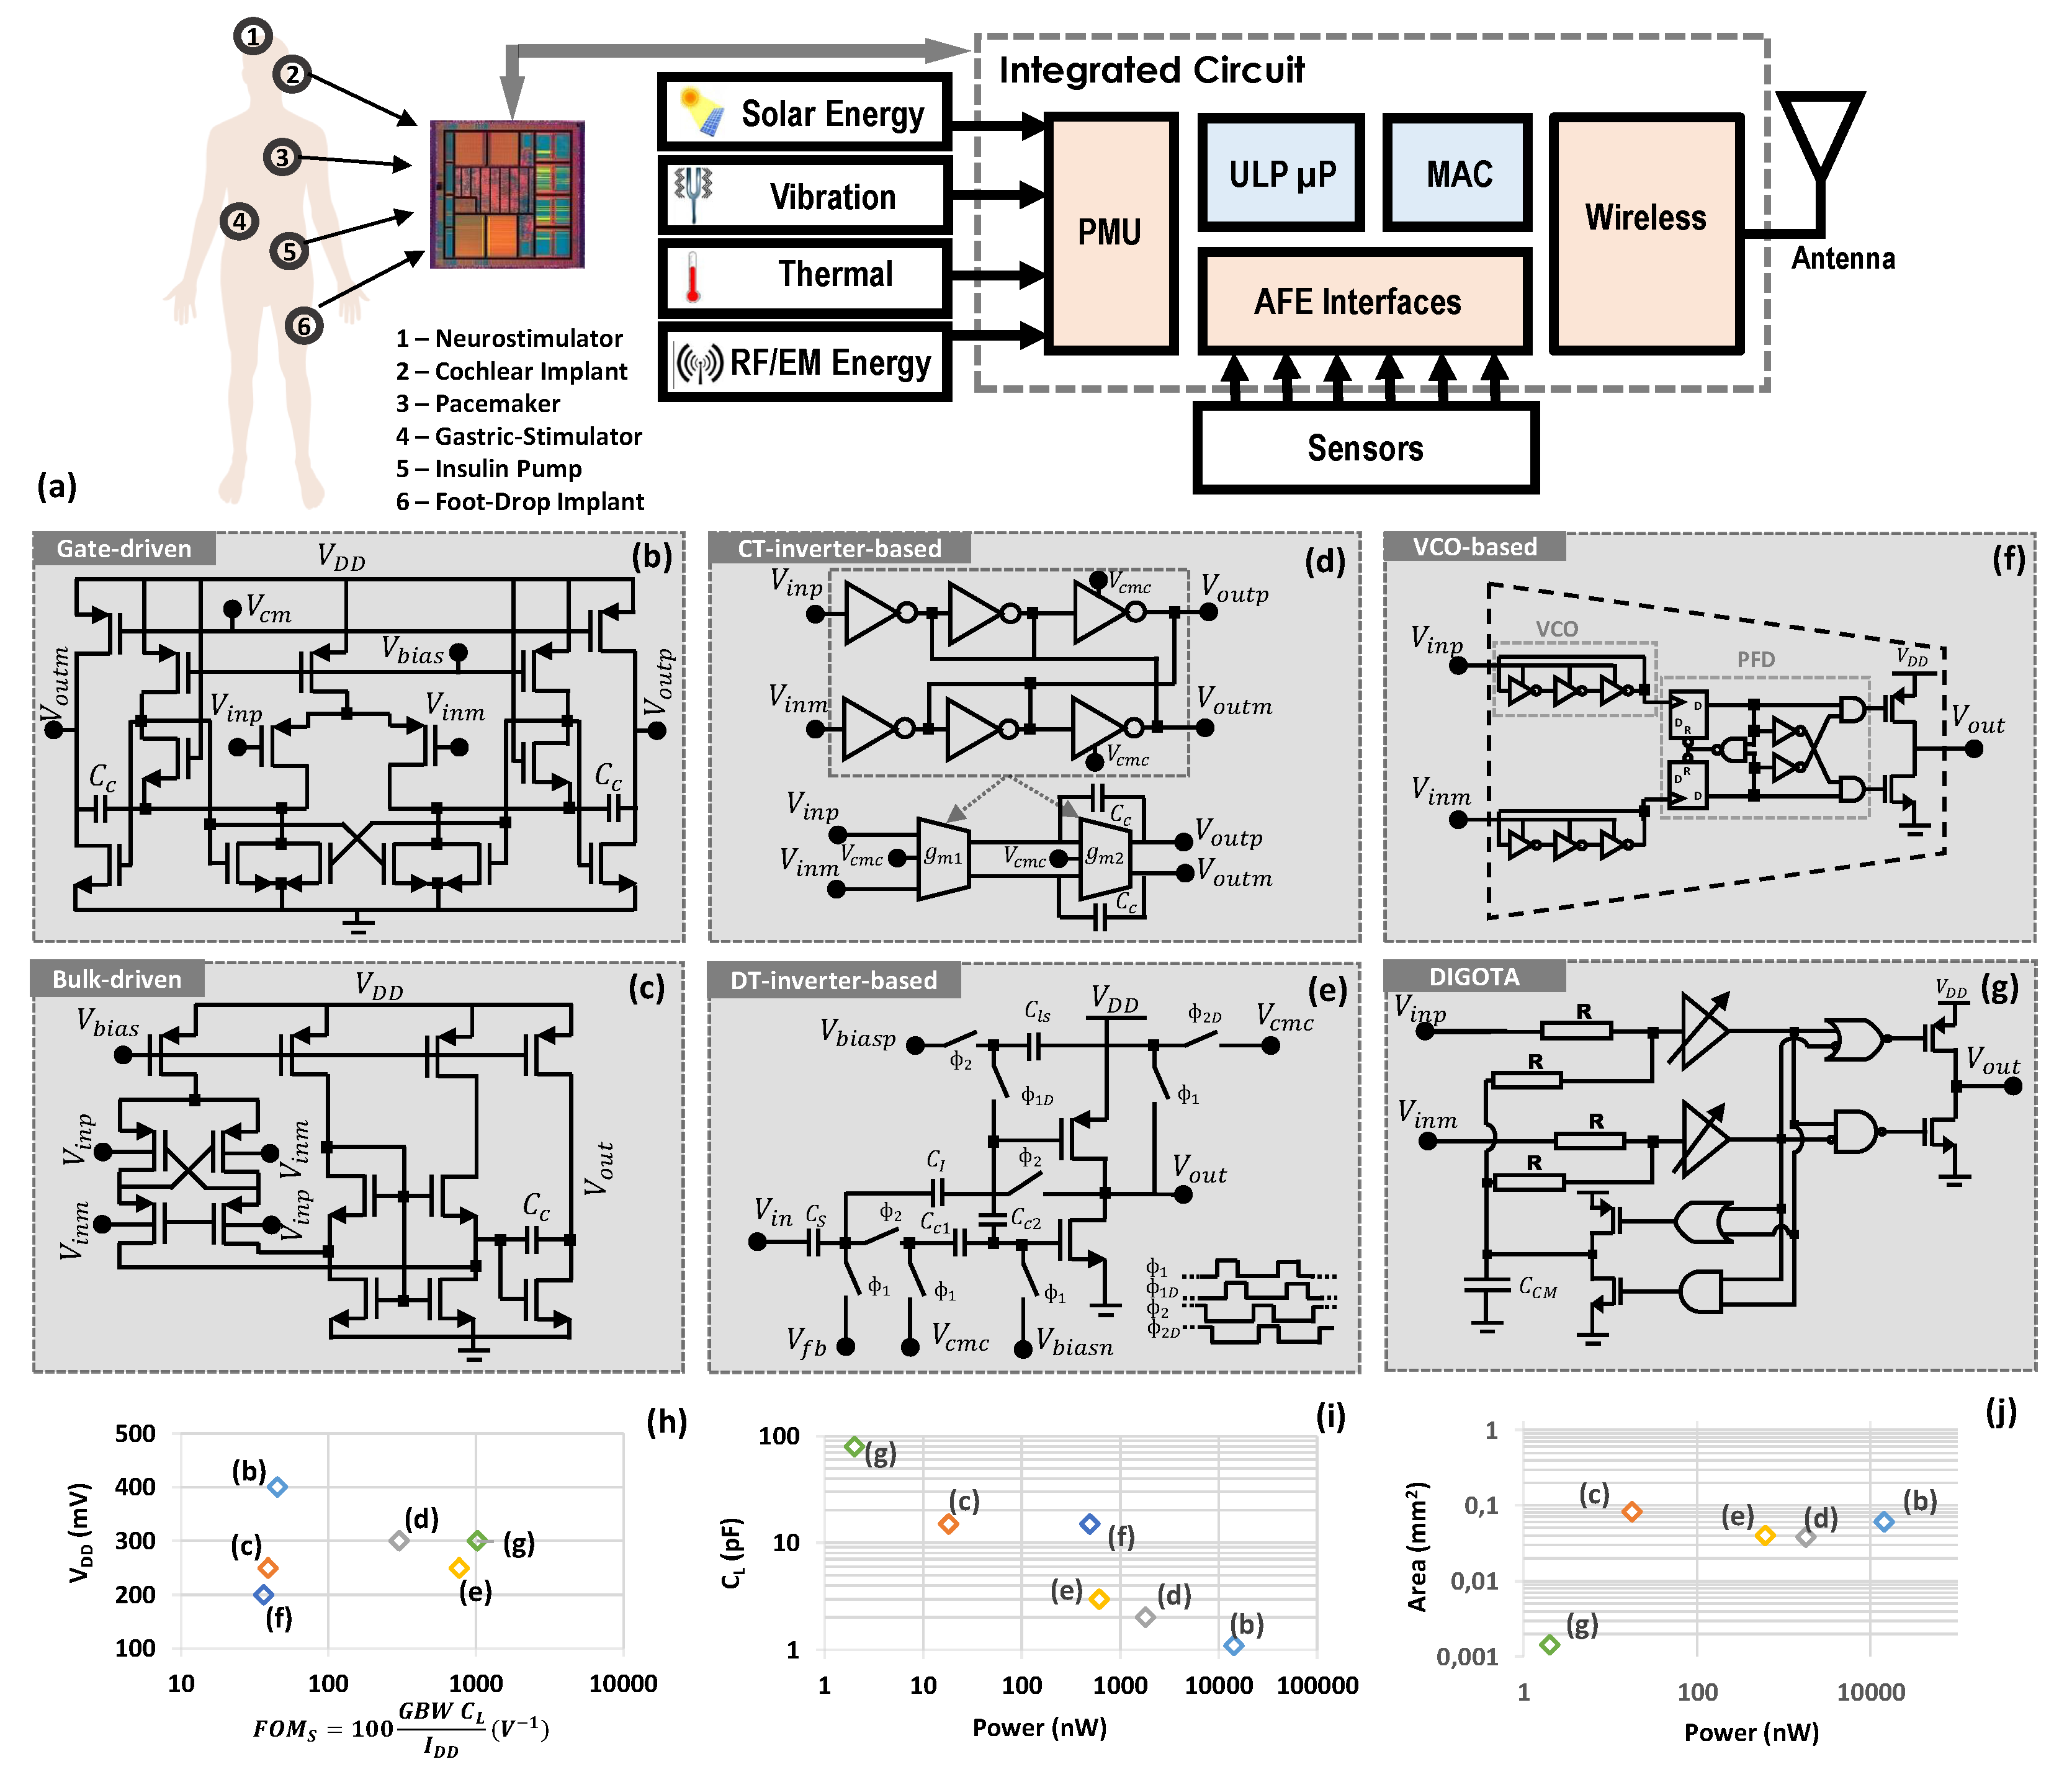
Figure 1. (a) General block diagram of an IoT energy-harvesting-enabled device, including its Power Management Unit (PMU), Analog Front-End (AFE) interfaces, ULP microprocessor ( μ P ), Media Access Control (MAC) unit, Wireless unit. (b) Gate-driven [8,9], (c) Bulk-driven [10] (d,e) Inverter-based [11,12] (f) VCO-based [13,14] (g) Digital-based [16] topologies. ULV OTA state-of-art comparison plots: (h) V D D (mV) versus F O M S = 100 G B W C L I D D ( V 1 ) (i) C L (pF) versus Power (nW) (j) Area ( m m 2 ) versus Power (nW).
Electronics 09 00983 g001
Figure 2. (a) ULV DB-OTA schematic (b) DM Amplifier analog input voltage tracking (c) output stage Boolean equations (d) CM extractor Boolean equations.
Electronics 09 00983 g002
Figure 3. (a) N-bit static calibration (b) N-bit dynamic calibration (c) DDPM and DPPM waveforms for N = 4 and n = 10 (d) Normalized DPWM and DPPM spectrum for N = 16 and n = 29,365.
Electronics 09 00983 g003
Figure 4. (a) DB-OTA layout and Area breakdown (b) V in and V out at 30 Hz frequency, 50 mV peak amplitude and C out = 80 pF (c) Power breakdown (d.1,d.2) ULV DB-OTA frequency response.
Electronics 09 00983 g004
Figure 5. (a) V in and V out of a bad sample from the MC analysis with 30 Hz frequency, 50 mV peak amplitude and C out = 80 pF (b) Thumbnail plot between THD (%) and Voltage offset (mV)—each point is a sampe of the MC simulation (c) Changing the BD-OTA offset through DDC using the DPWM modulator (d.1,d.2,d.3) Trade-off between power and signal integrity (THD) versus T 0 .
Electronics 09 00983 g005
Figure 6. High-level simulation flow adopted in the assessment of SDC and DDC techniques.
Electronics 09 00983 g006
Figure 7. (a) Voltage offset (b) THD (c) Power (d) GBW (e) and F O M S = 100 G B W C L o a d I DD histograms.
Electronics 09 00983 g007
Table 1. Monte Carlo simulation results: statistics parameters.
PeformanceNo CalibrationStaticDPWMDDPM
Voltage Offset (mV) μ = 12.26 , σ = 9.29 μ = 3.15 , σ = 2.9 μ = 6.86 , σ = 5.8 μ = 8.19 , σ = 5.34
THD (%) μ = 6.17 , σ = 8.65 μ = 4.6 , σ = 6.18 μ = 3.61 , σ = 1.82 μ = 4.16 , σ = 2.04
Power (nW) μ = 1.73 , σ = 0.15 μ = 1.65 , σ = 0.13 μ = 1.95 , σ = 0.41 μ = 4.12 , σ = 0.78
GBW (nW)- μ = 865.9 , σ = 63.3 μ = 434.4 , σ = 174.28 μ = 643.99 , σ = 166.65
FoM ( V 1 )- μ = 1269.5 , σ = 127.7 μ = 592.11 , σ = 385.17 μ = 402.13 , σ = 227.21
Table 2. Comparison with the state-of-the-art Ultra-Low-Voltage Operational Transconductance Amplifier.
This Work *
Calibration of the Worst Sample
Performance[10] + [11] * [13] * [33][34] + [35][36] + [37] + [38] + Typ.Uncal.StaticDPWMDDPM
Tech. (nm)13013065651806535065180180180180180180
Supply (mV)250300200350500300600250300300300300300300
DC Gain (dB)6049.8-435260697098.135-322726
GBW (kHz)1.88910060360012007011.49.53.10.85-0.8360.670.69
Slew Rate ( V m s )0.7380010.5560028902514.629.10.5--
THD (%)0.2--0.61-0.08-0.493771.322.732.35
Phase Margin ( )52.576-56-536589.95476-706768
C out (pF)1521532051515308080808080
Power (nW)18180049217,000110,00051550261321.181.811.15 3.8
Area ( μ m 2 )83,000--500026,000300060,000200098001426142614261426 1426
F O M S ( V 1 )39.230336.622.311205191372151020-11081397 434.76
+ experimental; * simulation; The power and area overhead from the modulators are not included.