1. Introduction
Automated driving represents a challenging frontier for embedded systems, with an ever-wider interest rising among academia and industry in terms of sensors, devices, algorithms and development frameworks, in a pervasive continuum from the edge to the cloud (e.g., [
1,
2,
3,
4]). In this rapidly advancing research and development process, it is of paramount importance to analyze field data from road tests. Not only do tests support performance assessment and spot technical issues and indicate possible solutions [
5], but they also reveal user behavior and acceptance, which is a key factor in designing useful and successful products.
The big challenge represented by automated driving has drawn vehicle manufacturers to join forces to face pre-competitive research both on specific aspects and in wider, more general pilot projects. The L3Pilot research project aims at testing the viability of automated driving as a safe and efficient means of transportation on public roads. It focuses on large-scale piloting of Society of Automotive Engineers (SAE) Level 3 functions, with an additional assessment of some Level 4 functions [
6], with a goal of laying the foundation for the design of future, user-accepted, L3 and L4 systems. The systems are being exposed to variable conditions in hundreds of trips on vehicles by 13 vehicle owners across 10 European countries. In L3Pilot, vehicle owners are the companies that perform tests on a vehicle prototype: either an original equipment manufacturer (OEM) (the project includes 10 OEMs), a supplier or a research facility. The tests cover a wide range of driving scenarios, including parking, overtaking on highways and driving through urban intersections. The tests are expected to provide valuable data for evaluating technical aspects, user acceptance, as well as impact on traffic and safety. The project intends also to create a large databank to enable simulation studies of the performance of automated driving (AD) over time, which can’t be investigated in road tests, due to the time and effort needed.
For such large test campaigns projects, efficiently and effectively dealing with data is of paramount importance. The scientific literature has already provided an account of data management in large-scale automotive research projects (e.g., [
7]), however, this information needs to be updated in the light of the evolution of the automated functions and of the data processing and management tools and architectures (e.g., cloud computing [
8]). In this context, we are particularly interested in understanding how to design and develop a data management toolchain for automotive test data (both qualitative and quantitative, both vehicular and subjective), with a goal to support a wide spectrum research investigation. The toolchain should be used by various stakeholders and owners, with strong privacy and intellectual property (IP) requirements.
This paper describes the methodology and the toolchain we have designed in order to manage data throughout the whole project. The L3Pilot toolchain has been implemented in a desktop/cloud environment, exploiting state-of-the-art technology. We believe that this step is necessary, in order to efficiently set up a comprehensive reference system architecture. However, we also expect that part of this implementation will smoothly pass towards the edge, exploiting the well-known benefits of edge processing [
9], and we hope that our experience may be useful to define effective specifications and support development in an automotive embedded environment.
The remainder of the article is organized as follows.
Section 2 provides a short overview of related works, while
Section 3 introduces the design methodology, and
Section 4 introduces the L3Pilot reference system architecture.
Section 5 focuses on the common data format designed in order to support portability.
Section 6 goes in detail of the data processing, while
Section 7 presents the subjective data tool to perform user acceptance analysis.
Section 8 illustrates the database storing aggregated data from all the pilot sites, while
Section 9 presents and discuss achievements after the pre-pilot (i.e., preparatory tests). Conclusions are finally drawn in
Section 10.
2. Related Work
Data acquisition and telemetry are key factors for quality and performance in vehicle development and management [
10]. The euroFOT project already used small built-in devices with flash storage and GPRS network connection to remotely track and upload data during field operational tests (FOT) [
11]. Recently, connectivity has been introduced in automotive production series, making vehicles highly mobile nodes in the Internet of Things (IoT) paradigm. In this context, [
12] presents the Common Vehicle Information Model as a harmonized data model, allowing a common understanding and generic representation, brand-independent throughout the whole data value and processing chain. Since the volume of data collected from fleets of vehicles using telematics services can be very high, it is important to design the systems and frameworks to support scalability and efficiency, [
13] explore the opportunities of leveraging Big Automotive Data for knowledge-driven product development, and to present a technological framework for capturing data from connected vehicles and analyzing it online.
Concerning the data format, [
14] describes an approach to combine standards specified for the automotive test data management with the widely used Unified Modelling Language (UML).
Over the past decade, a large number of FOTs have been conducted to test Intelligent Transport Systems in real traffic conditions with thousands of drivers (e.g., euroFOT [
15], which also investigated whether automatic video processing could improve naturalistic data analyses [
16]). In order to ensure scientifically sound studies, the Field opErational teSt supporT Action (FESTA) project developed a methodology for FOTs, mainly centered on three focuses: the user, the vehicle or the context [
17]. L3Pilot decided to follow this methodology, which has been used by several European FOTs in the last ten years. The main handbook has been periodically updated by the FOT-Net community, capturing lessons learned and documenting best practices. L3Pilot intends to offer experiences and recommendations to future pilot projects and FOTs, especially considering the Data Sharing Framework [
18].
Several collaborative industrial research projects have been conducted in Europe concerning the first levels of driving automation. The AdaptIVe project developed several automated functions offering different levels of assistance, including partial, conditional and high automation [
19]. Drive C2X investigated cooperative awareness enabled by periodic message exchange between vehicles and roadside infrastructure [
20]. The FOT-Net Data project prepared a Data Sharing Framework, including hands-on recommendations on how to prepare for and perform data sharing of transport research data [
7]. TEAM developed a set of apps for collaborative mobility [
21].
3. Methodology
A fundamental step in the design of a system for a complex project, combining human and technological aspects, is given by the definition of the methodology, which shapes all the phases of an FOT project. As several FOTs have been conducted in Europe in recent years, the FESTA methodology has established itself as a reference [
17,
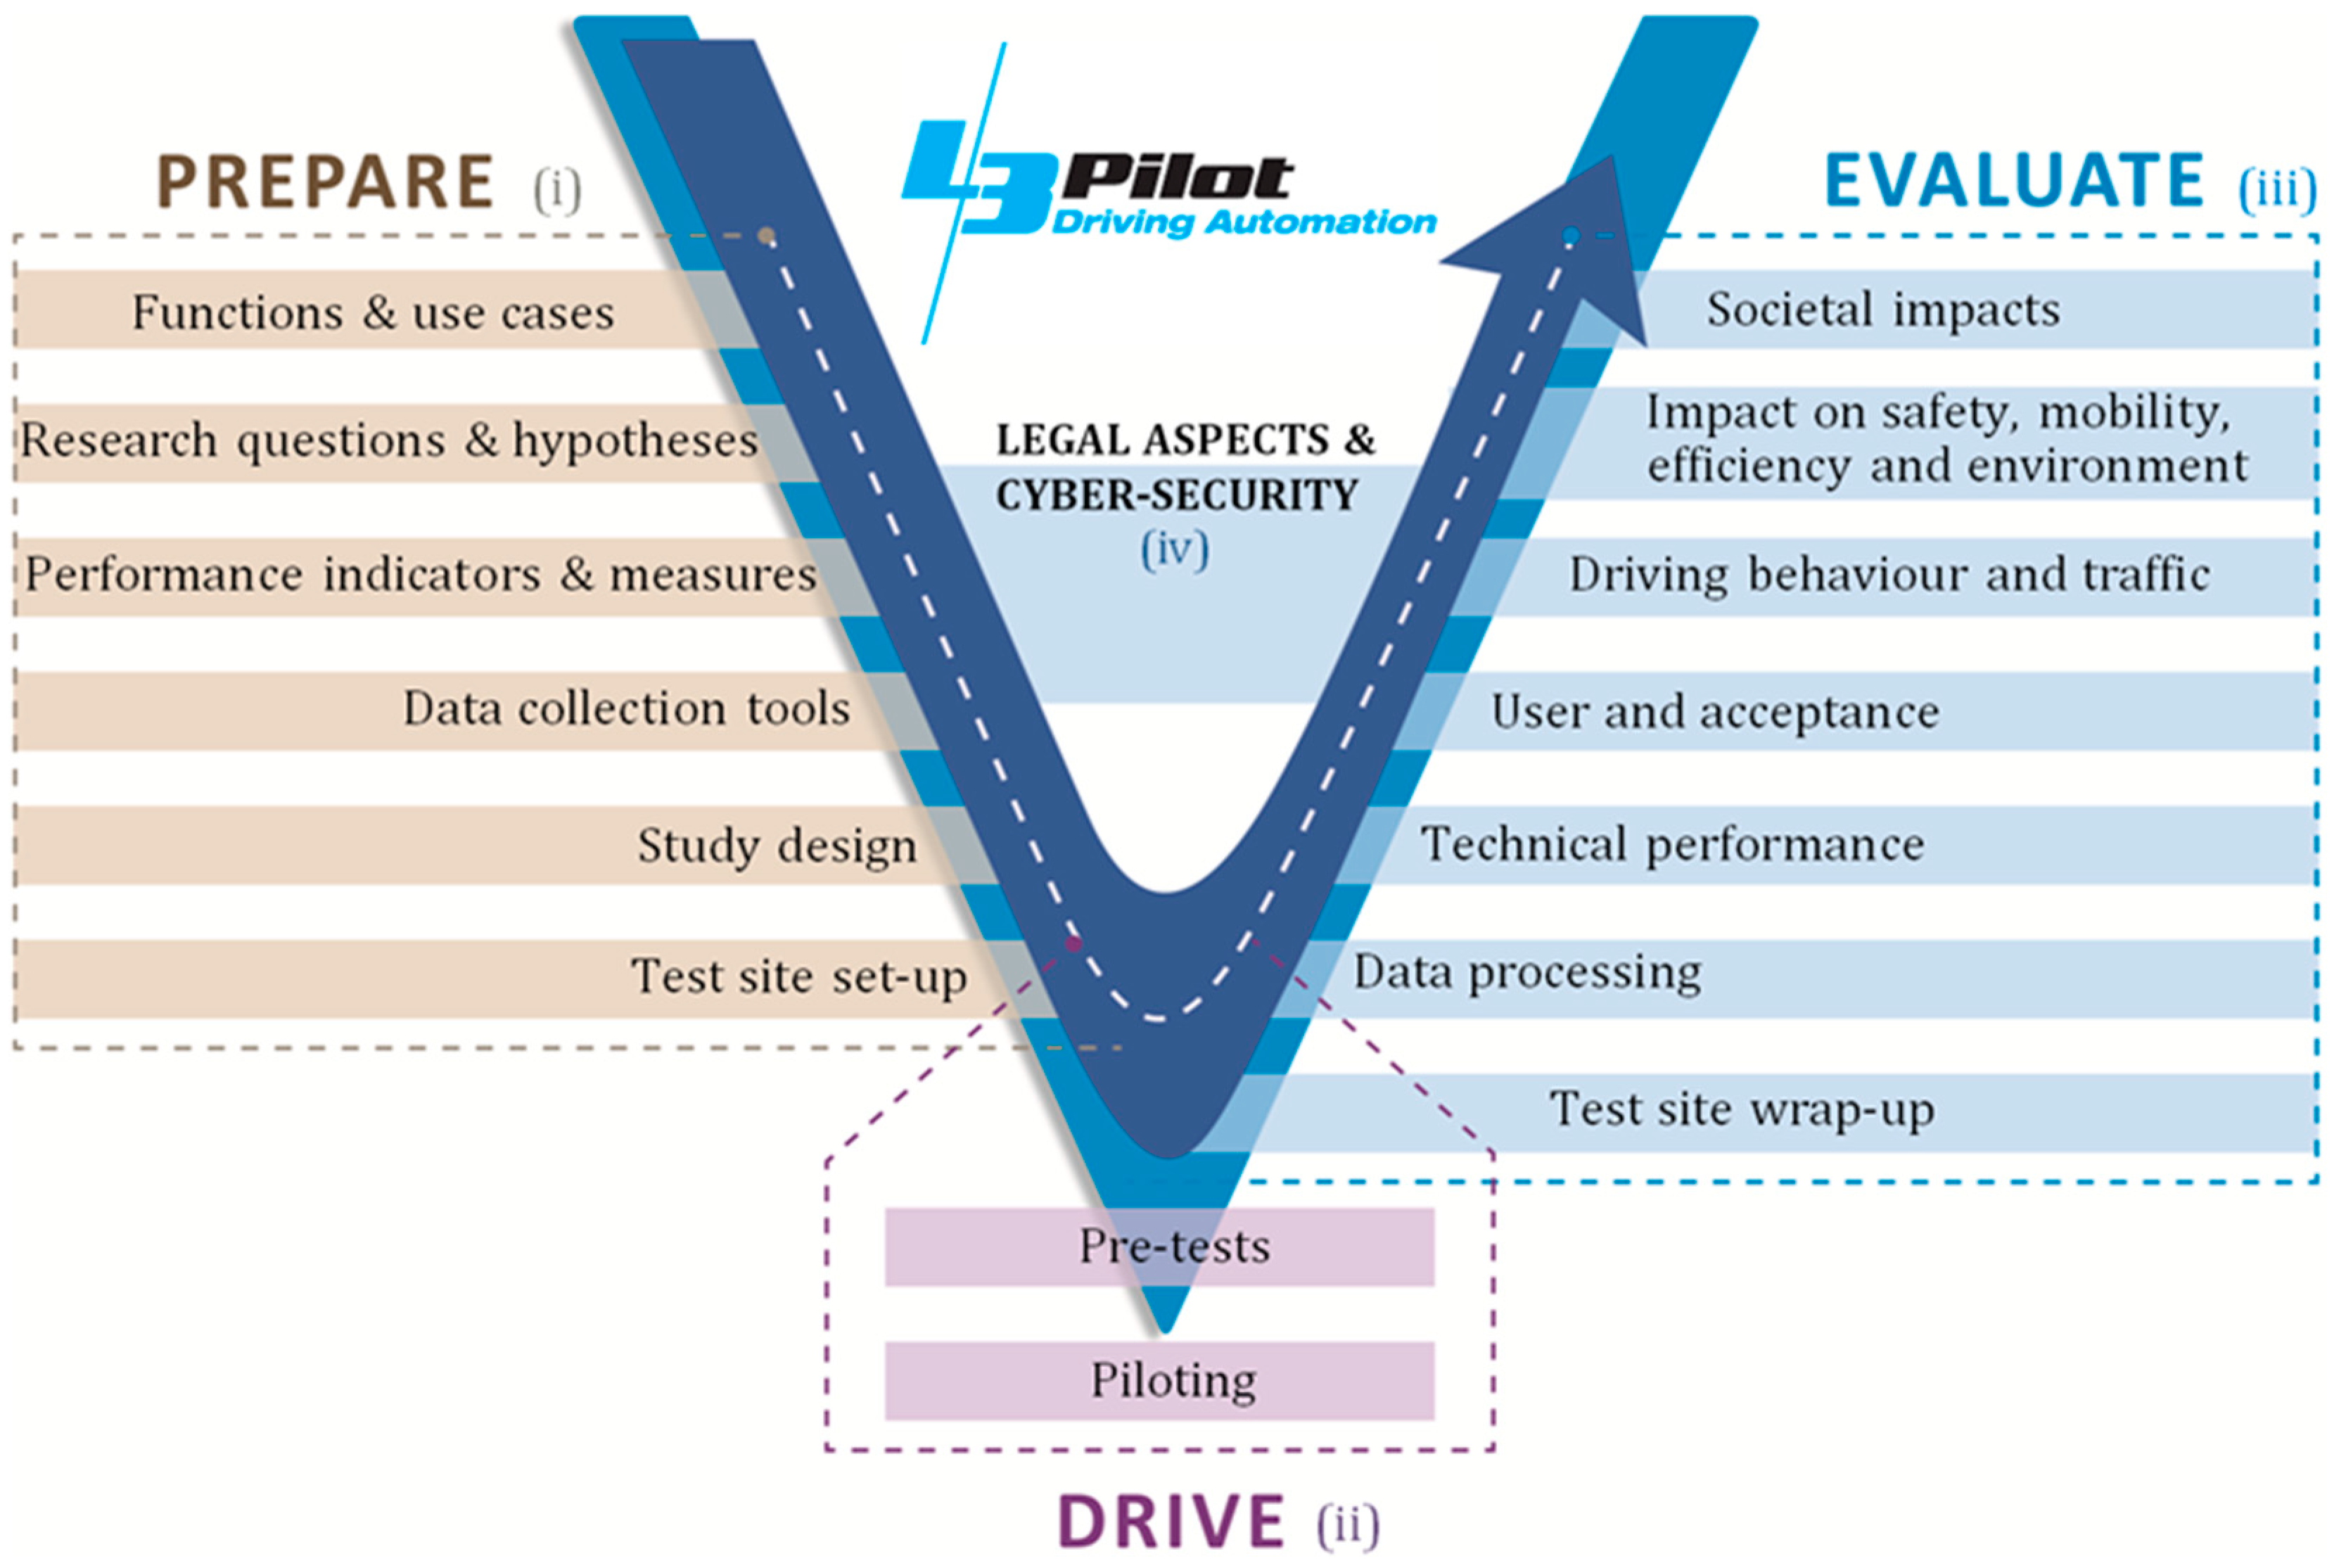
22]. The FESTA approach gives general guidance on organizational issues, methodology and procedures, data acquisition and storage and evaluation for FOTs. FESTA covers the whole process of planning, preparing, executing, analyzing and reporting an FOT. The steps that need to be carried out during an FOT are graphically presented in the form of a V diagram, where there is correspondence between the levels on the left-hand side (concerning the “preparation” of the FOT) and right-hand side (concerning the “analysis” or “evaluation”).)
Figure 1 shows the L3Pilot FESTA methodology implementation [
23]. The left side of the V descends from definition of functions and use cases, down to research questions and hypotheses, performance indicators and measures, data collection tools and pilot site set-up. The bottom of the V (concerning the “use”, which is “drive” in L3Pilot) is represented by data acquisition during tests. In L3Pilot, the drive phase consists of two parts: pre-tests (or pre-pilots) and tests (or pilots). The pre-tests period takes place before large-scale user tests can safely and confidently begin. During pre-testing, e.g., function performance is honed and data collection processes tested. Traditionally, in FOT terminology, the pre-testing would be called piloting. Finally, the right side rises mirroring the left side: data processing, data analysis to answer research questions on technical performance, user acceptance and behavior, impact on traffic and mobility, up to societal impacts. The methodology allows considering, at different levels, the point of view of different stakeholders, such as politics, industry, research.
Data are at the center of the methodology, as they are the basis for the analysis and assessment steps, that will provide the final outcome of the project. Consequently, the data toolchain has to be carefully designed together with the relevant stakeholders in the preparation phase, so to support an efficient and effective support of the test phase, where data are collected, and of the assessment phase, where data are analyzed.
Based on FESTA, the L3Pilot analysis is driven by a set of research questions (RQs) and hypotheses that have been published in L3Pilot Deliverable 3.1 [
23]. Targeted research questions are grouped in four clusters. Each research question is further divided in sub-questions, that have then been mapped to requirements for the tests (e.g., required type of automated functions, driving scenarios, road types, drivers, questionnaires, need for a baseline drive) and to data collection and analysis procedures, through the steps described in the next sections. The clusters are represented in
Table 1, together with an example.
The L3Pilot requirements document defines also the performance indicators needed to answer the research sub-questions [
23]. In an extensive test such as L3Pilot, data come from a multitude of heterogeneous sources, and have to be processed by a variety of tools for analysis and assessment, considering different interests by different stakeholders. This called for the importance of implementing continuous data quality checking. Recorded data concern different in-vehicle sensors and systems and are enriched with external data sources. Signal time-series are also supplemented with video streams recording the driver activity and the surroundings, as we will see in the next sections.
4. Test Data Management System Architecture
The first step in system design consisted in defining the workflow to support. L3Pilot deals with a complex data flow, because of the quantity and variety of data and stakeholders. Vehicle owners are interested in an in-depth analysis of their own data. This analysis should be complete and, for obvious confidentiality concerns, restricted. The consortium, on the other hand, is interested in answering to the RQs, assessing the overall impact of SAE level 3/4 ADFs, without considering differences in performance among the different manufacturers. Finally, a part of the data is to be made available publicly.
Due to competitive and secretive phase of current production development, the collected datasets are not shared as full within the consortium. Only indicators that are seen reasonably free of product-level confidentiality are shared. The restriction is not a huge limitation, since high-level impact analysis does not necessarily need the raw vehicular data time-series, but can work on statistical synthesis values. L3Pilot has not yet decided on which parts and how exactly the datasets could be accessed publicly. Summary indicators at project level, for which reasonable anonymity can be ensured and agreed, are currently seen to become available. Even more detailed datasets might be possible to access by making a non-disclosure agreement with the dataset owner. The data chain should thus enable collaborative evaluation activities in the current competitive ADF development framework.
Based on these requirements, the project designed a multi-layer data processing flow, beginning with raw data acquisition from the vehicles and ending with the analysis and display of the results [
24].
Figure 2 shows an outlook of this process, which will be detailed in the remainder of this article.
Figure 2 highlights four layers which correspond to different levels of data access and confidentiality. The left-most one is the vehicle owner layer, involving proprietary data logged from the vehicle. Filtered data, according to the vehicle owner confidentiality requirements and policies, are then converted to a common data format, in order to tackle the variety of proprietary data sources, and support the processing through the different tools made available by the analysis and evaluation partners, as described in the next sections. After translation into the common format, these data are made available to an “analysis partner”, a selected project partner (one or more for each vehicle owner) who supports the data owner in a detailed, and restricted, analysis. The minimal set of tasks for a “selected partner” concern video data annotation, data quality checking and execution of scripts for extraction of indicators and events (these tasks are illustrated in the next sections). But such partners are also consulted on test procedures, analysis of signal quality and verification of driving scenario detection (e.g., uninfluenced driving, following a lead vehicle, etc.). The third layer involves aggregating data for higher level analyses, and feeds into the de-identified The consolidated database (CDB) is described in
Section 7. The fourth step consists in further filtering and aggregating data to be made available publicly.
5. Data Logging, Conversion to the Common Format and Storage in HDF5 Files
A fundamental design choice was to define a common format for all the data processed in the project, to be agreed and shared by all the project partners. This choice was deemed necessary in order to facilitate the processing of data and the analysis, by allowing a common processing of heterogeneous source data. The L3Pilot Common Data Format (CDF), which is detailed in the following sub-sections, makes it possible to use a comprehensive toolchain for all analysis steps, following the transfer of data from the vehicle owner to an analysis partner [
25]. To the best of our knowledge, this is the first time that such a big automotive consortium defined and released as open source—a common data format for processing information about automated driving.
From a methodological viewpoint, the format emerged as a combination of a bottom-up approach, stemming from the need to include all the signals necessary to answer the project’s RQs, and of a top-down approach, due to the need for generalizing and abstracting the data structure for future projects.
5.1. Common Data Format
The first step in the data management chain consists of logging data, in a proprietary format, from the vehicular communication buses. Logged data are then converted in the L3Pilot CDF. Conversion is done through MATLAB, Python or C++ scripts. One file is produced for every test trip, which contains all the information related to that trip, apart from the videos recorded by the several cameras installed in a vehicle (front camera, driver face and upper body, driver hands, driver feet).
We decided to store the converted data in HDF5 [
26], a binary file format characterized by its ability to contain and compress large and complex structured data [
27]. HDF5 also includes a data model and software libraries for storing and managing data. Through the compression, HDF5 enables portability, so facilitating the transfer of large amounts of data. HDF5 supports various programming languages, one of them being Python, which is important for exploiting the rising potential within artificial intelligence (e.g., for automatic scene detection and video data annotation). An .h5 file can be extracted to a set of .csv files and, vice-versa, several tables (or .csv files) can be combined into one .h5 file. The benefit over .mat is in the wider selection of supported tools.
In L3Pilot, an .h5 file is organized as an extensible set of datasets.
Table 2 provides a brief description of the datasets, together with some signal examples. In each dataset, data (listed in columns) are recorded in a timeline with a 10 Hz sampling frequency. For each signal, the CDF specifications mandate units, resolution, range of values or enumeration, required frequency, data type and interpolation method (linear or zero-order hold).
5.2. Data Quality Checking
Data converted in the CDF is next checked for correctness and consistency. Data quality checking is very important, according to our experience with previous projects, where faulty or incomplete data caused issues in later data processing stages, causing significant delays and inconvenience in a more critical phase of the project. Several factors may jeopardize data quality, such as test set-up, time synchronization among sensors, sensor/communication failures, etc.
We thus decided to develop a specific checking tool (we called it L3Q), that parses the HDF5 files in order to guarantee that all the defined data structures are present and correct, so that they are compatible with the post-processing and evaluation tools. The main purpose of L3Q is to speed up manual quality checking and warn about errors in log files.
L3Q is a small Java software for checking the conformity of log files against the published log file format. It checks whether the stored values in each log file respect the set minima, maxima and sampling frequencies defined for each variable, and highlights implausible ranges in the html reports it generates. Additionally, it visualizes a few key signals in the html reports to support manual inspection on plausibility and time synchronization: e.g., vehicle speed vs GPS speed vs brake signal. The tool signals the error/warning conditions, without making any automatic correction.
The quality checking tool is run also after the post-processing step, that is described in the next sub-section, guaranteeing that all the data delivered to the analysis phase are correct.
5.3. Pseudonymization
The tests include sensitive data for vehicle owner confidentiality and driver privacy. We decided that pseudonymization (or de-identification) was the most appropriate solution to deal with such data. Pseudonymization allows identifying database entities such as trips and drivers, but only by the owners of the data, who know the pseudonymized ID. The pseudonymization process is managed by the vehicle owners, and is applied to produce the trip ID and the user ID. The ID is an 8-character string, obtained through a simple procedure, based on a SHA-256 hashing. Source information (e.g., driver name, date of birth, trip place, vehicle owner, etc.), integrated with a secret word for “salting”, is processed through a deterministic hash function (e.g., SHA-256), that generates a 64-character identifier [
28]. For the purposes of L3Pilot, we considered it to be sufficient to extract the left-most 8 characters of the 64-character string to have the driver ID and the trip ID. This way, there are still enough unique combinations with sufficiently low collision probabilities. Using these IDs, vehicle manufacturers can then track their participants and trips throughout the HDF5 files, subjective questionnaires and the CDB, where data from all the owners are finally put together. When sharing data beyond the analysis partner(s), further sensor-level data anonymization steps may be deemed necessary to protect product intellectual property rights (IPR).
6. Data Post-Processing and Enrichment
The second main step is represented by data enrichment. This involves the processing—through MATLAB scripts—of the data present in an HDF5 file, in order to obtain additional information, particularly related to the methodological requirements and the project RQs.
Figure 3 sketches the post-processing steps, highlighting the main iteration, which revolves around video annotation. The additional data can be grouped in three main clusters, such as:
Derived Measures (DMs). These are time-series signals computed from the above-mentioned raw signals. Examples of DMs include: time headway, time-to-collision, traffic density, absolute acceleration of the objects in their direction of travel, etc. The calculated derived measures are then stored in the DerivedMeasures HDF5 dataset, which is added to the original HDF5 file structure (
Figure 3).
Driving Scenarios (or simply scenarios). These are stereotypical situations that may happen during a drive. They are recognized by analyzing the raw signal timelines. Driving scenarios are saved in the scenario timeline dataset. Examples of scenarios recognized by L3Pilot include: uninfluenced driving, lane change, merge, cut-in, approaching a leading vehicle, approaching a static object, following a lead vehicle. A scenario of an incident with a rear vehicle is considered as well.
Performance Indicators (PIs). PIs aggregate information from one or more timelines (raw data and/or DMs) in an HDF5 file. They are computed at full trip level, or at driving scenario instance level. In general, PIs are single values or arrays, and no longer time-series data. PIs are specified in the methodology document [
23]. PIs are typically statistical descriptors of relevant signals/scenarios/events (e.g., frequencies, min, max, avg, std dev). Examples of PIs include: frequency of cut-in scenarios in a trip, average time headway in a following a lead vehicle scenario instance, standard deviation of the relative longitudinal velocity of the front vehicle in a driving in a traffic jam scenario instance, etc. The calculated PIs are then stored in the HDF5
PerformanceIndicators dataset, which is added to the original HDF5 file structure.
6.1. Scenario Detection
For computing the above-defined additional quantities, we defined a methodology that was implemented by all the developers in the team. The methodology consisted of various aspects, starting from discussion and definition of the quantities, up to their coding in MATLAB and the final merge, in the shared online repository, of the lab-tested code. In an agile-like approach, conf-calls were held weekly among all the developers, in order to track the progress and decide further steps.
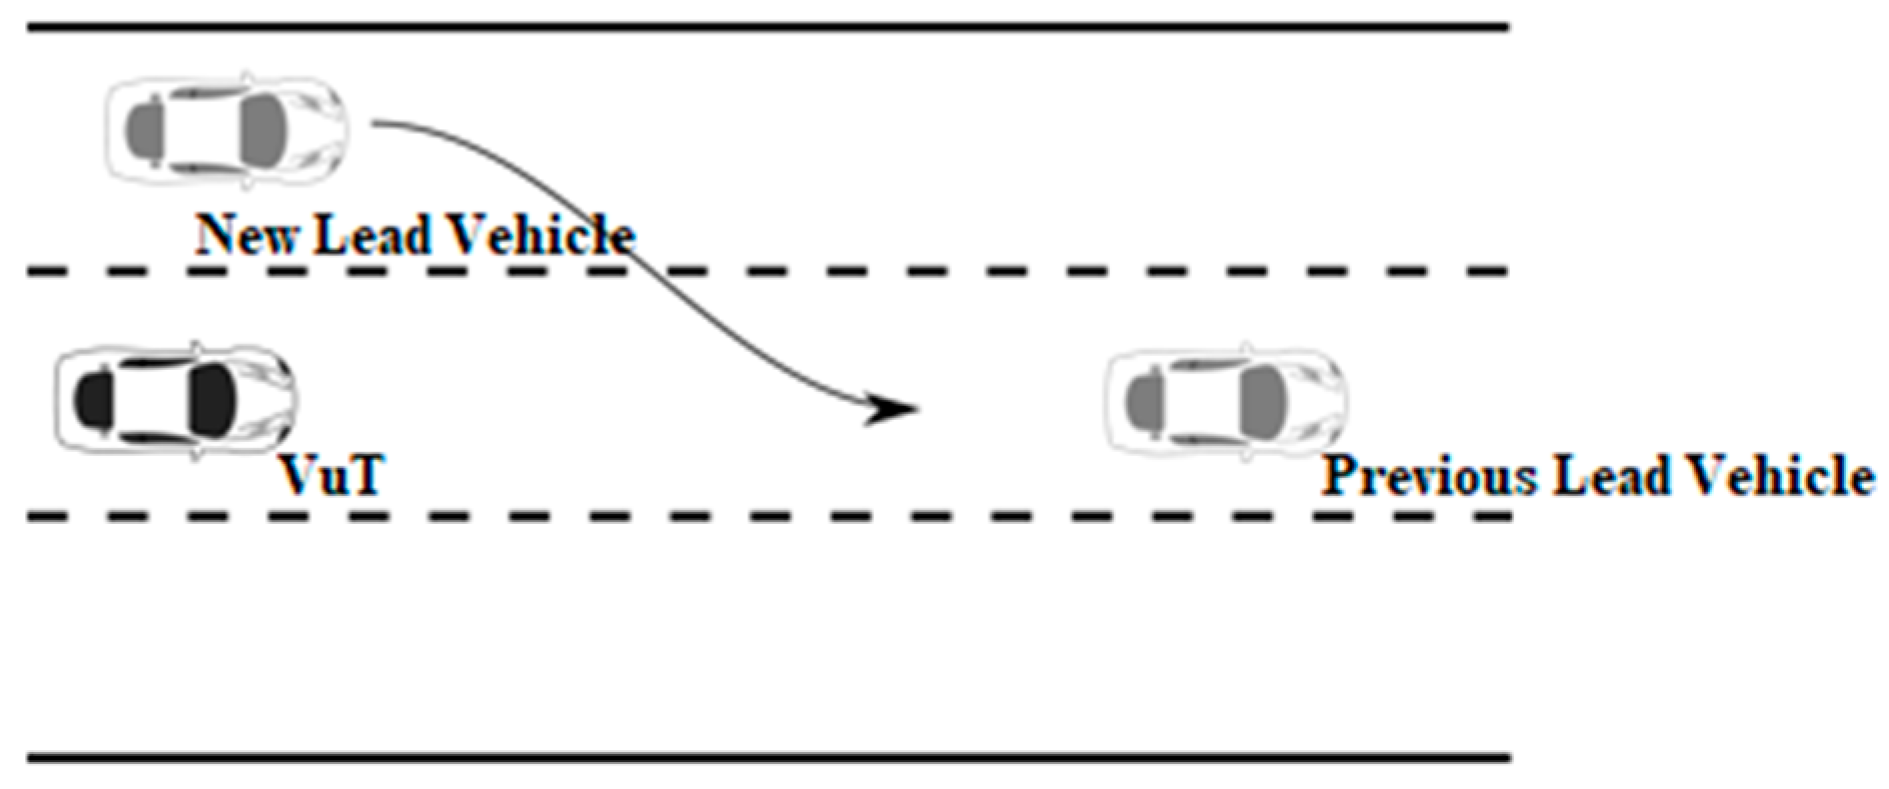
As an implementation example of the methodology, we present here the case of the function we defined for the Cut-in scenario (
Figure 4).
First, the goal of the function is defined, which, in this case, is to detect a situation in which a vehicle is changing its lane to the lane of the ego vehicle, such that the new resulting scenario for the ego vehicle will be either Following a lead vehicle or Approaching a lead vehicle.
Then, the problem has to be formalized mathematically; i.e.,
The algorithm has to consider the cases where a new lead vehicle is detected. For a cut-in scenario to be detected: (i) the distance of such vehicle from the vehicle under test must be less than the exclusion distance (a predefined threshold); (ii) its absolute speed less than a speed threshold; and (iii) the vehicle must be changing its lane coming from either the left or right lane, with respect to the one of the ego vehicle.
The function signature is then defined, as shown in
Table 3 (input parameters) and
Table 4 (output parameters).
Then, the function is expressed in pseudo-code and finally implemented in MATLAB. The steps of the Cut-in detection algorithm are the following:
Set the default input values, if the relevant parameters were not passed;
Check for necessary fields;
Preparatory calculations. This involves the creation of: (i) the Cut-in scenario array (one entry for each sample in the timeline), which is initially zeroed; and of (ii) the newLeadVehicle_Indices, which marks all the time samples where a new lead vehicle is detected;
Iterate over the time samples in which a new lead vehicle is detected;
Get the index of the object matching the lead vehicle;
Check that the object is not empty and that its longitudinal distance and absolute velocity are below the given thresholds;
Get the mean of the lateral position of this object starting from (current time—WindowSize) until (current time—DeadPeriod). If this mean is greater than LateralDistanceThreshold, Cut-in is considered from the left. If this mean is lower than—LateralDistanceThreshold, Cut-in is considered from the right. Otherwise, no Cut-in is detected;
Write the Cut-in scenario to the scenario dataset and finally pass the updated overall dataset as the output parameter.
If, in 4b above, the object is empty, there could be three cases: if the id of the former lead vehicle still exists, then it is a lane change of the lead vehicle; otherwise, the lead vehicle left the view range.
6.2. Video Annotation
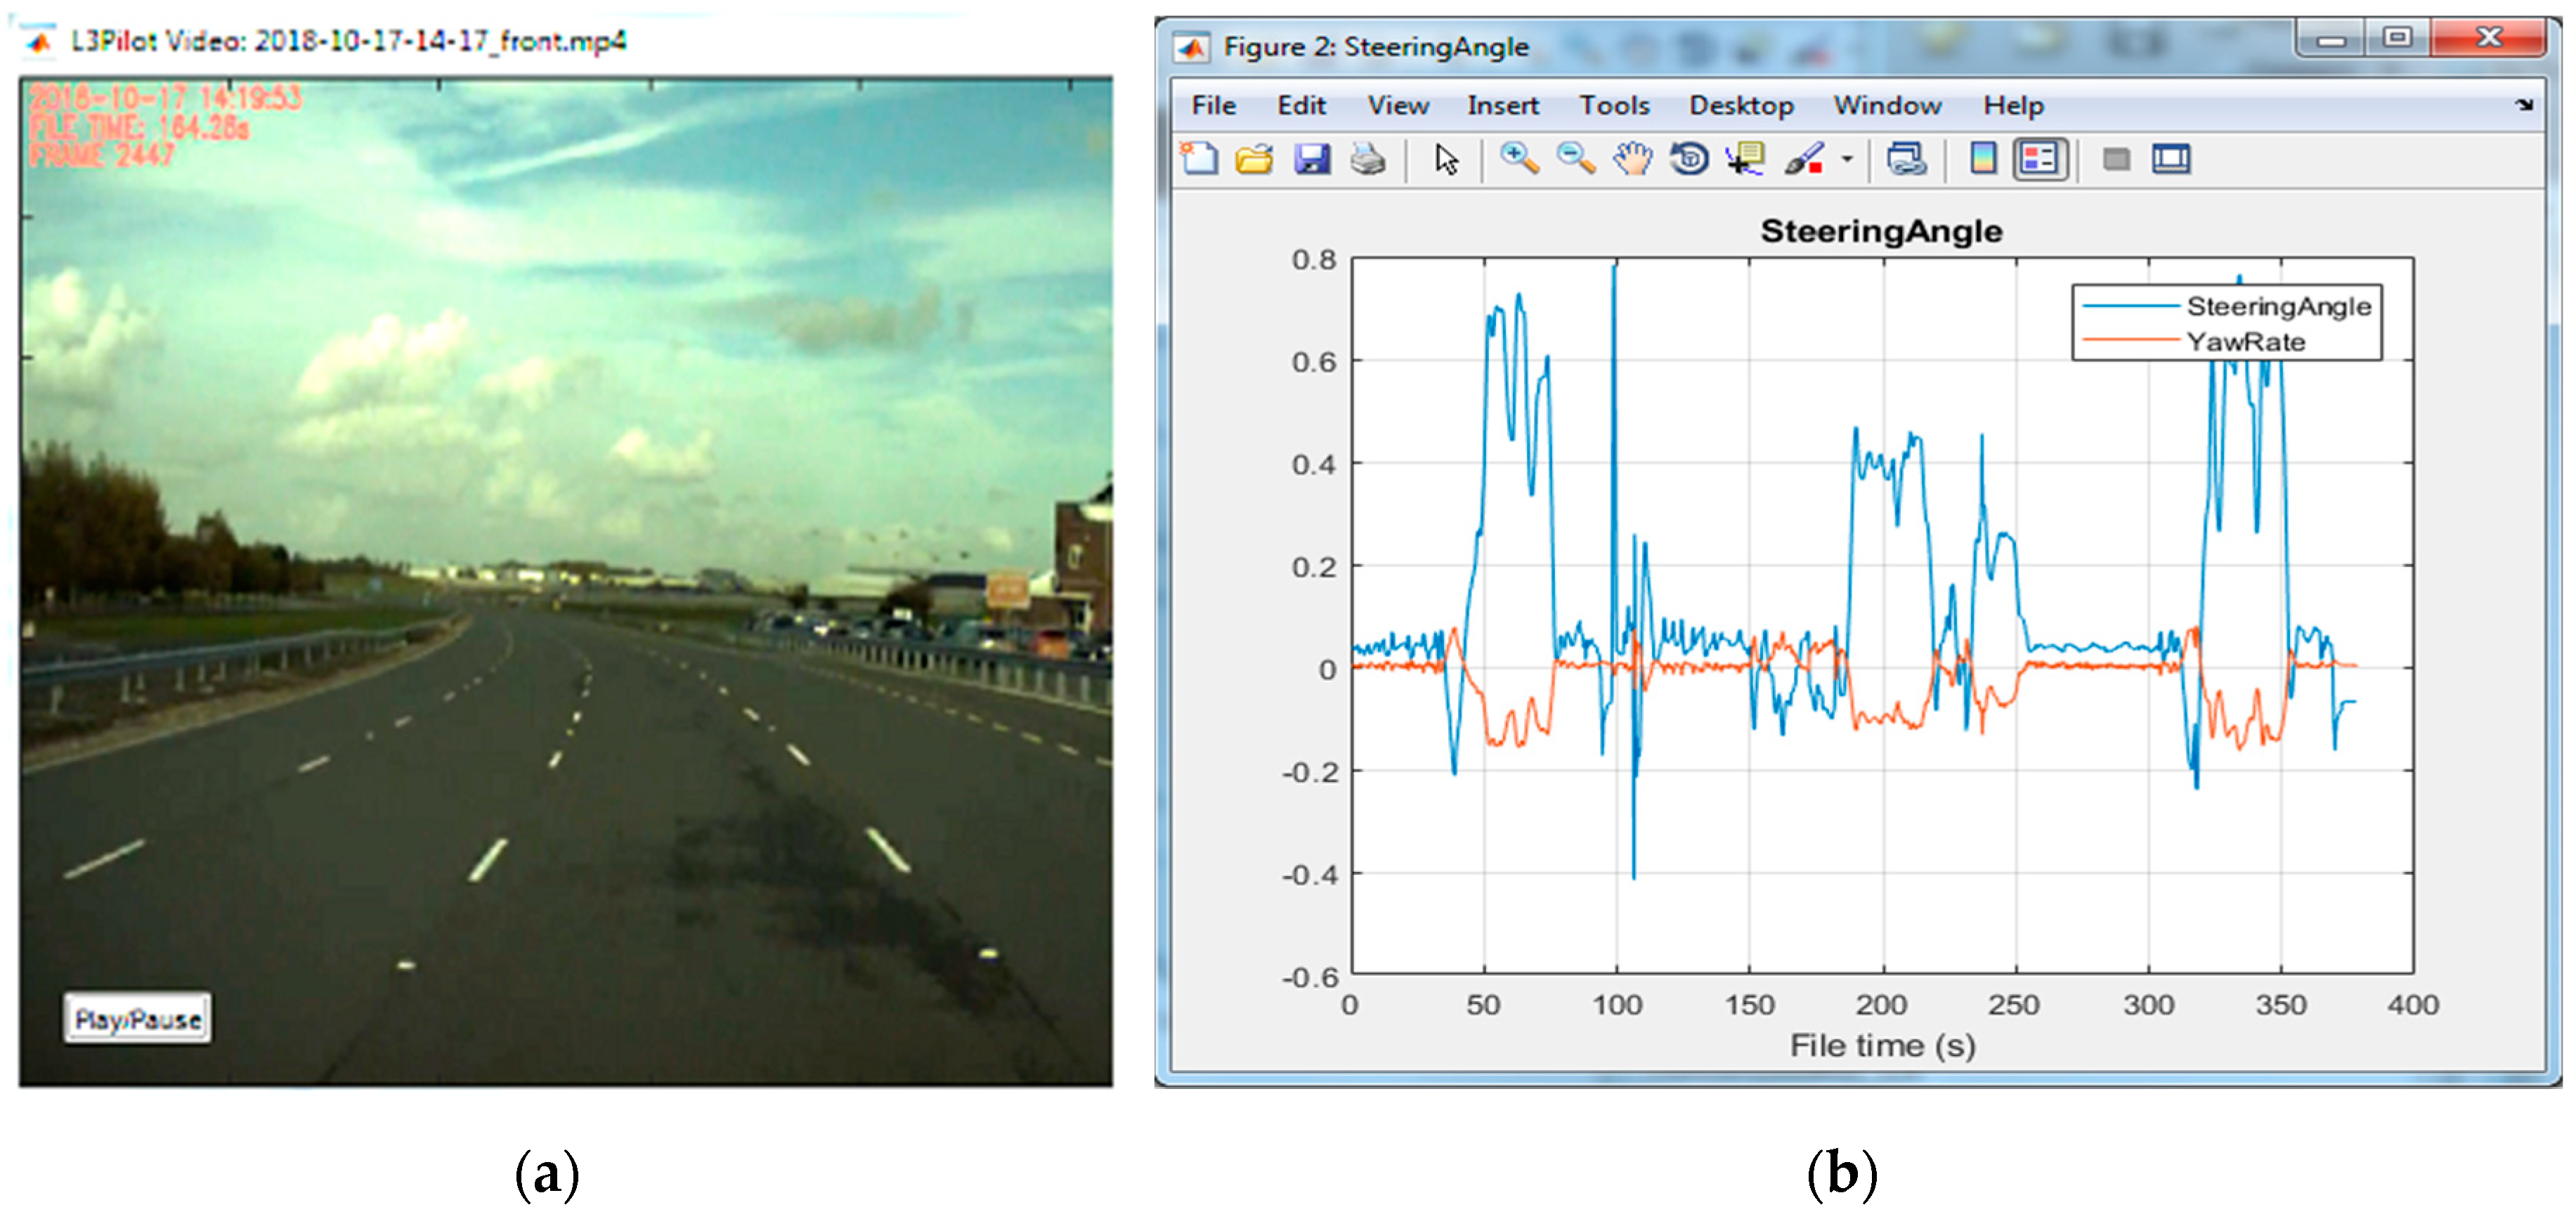
A key role in the post-processing phase is played by the video annotation, which is done manually, with the support of a MATLAB-based viewer tool we developed in the project (
Figure 5). Through this software interface, an analyst can view one or more video signals stored in the HDF5 file under study, simultaneously watching also the current signal evolution. The tool enables the analyst to move quickly within the data to a driving scenario detected in the above-described vehicular data processing step. He can then confirm or discard scenarios, and annotate them according to the best practices [
29,
30].
Table 5 provides an outlook of the video annotations. Annotation information is finally stored in the Annotations HDF5 dataset, which is added to the original HDF5 file structure (
Figure 3).
All the additional information created in the post-processing phase is incrementally added in the HDF5 file, which is thus enriched with computed data, in addition to the original signal time series (
Figure 3). As anticipated, a new round of data quality checking is then performed on the enriched HDF5 file as well.
7. Subjective Data Tool
Until now, we have dealt with data from vehicles and cameras. Another important aspect is subjective data collection using online surveys. Pilot vehicle users are asked to reflect on (automated) driving and report about their test experience, mainly addressing the RQs on impact evaluation and socio-economic impact evaluation. There are two main types of participants: drivers (for legal/company rules, driving automated vehicles is restricted in several cases) and passengers. Questionnaires are filled by users before and after the driving experience.
In order to support execution and management of the subjective data collection, we chose the LimeSurvey commercial tool [
31]. Three specific questionnaires were developed, according to the context of use: urban, traffic jam motorway and parking. The questionnaires are translated in all the pilot sites’ local languages. Survey results are exported in .csv files to feed the “selected partner” analysis and the CDBDB.
Each questionnaire is structured into groups of questions, as specified by the user assessment methodology. Questions are of different types: text input, single and multiple choices, arrays, numeric arrays. Conditional questions are also implemented, for instance to show (or hide) some questions (or their answers), based on the answer to a previous question.
Customizations are needed for some questions, for instance, to add text options to numeric arrays or to add text input to sub-questions (typically to allow the user to specify the “Other” option), or to automatically set values for consistency among answers. Customization is also needed to check and enforce consistency of the input values. For instance, clicking on a checkbox (stating that the participant never makes certain kind of trips) clears its favorite transport means selections for a specific kind of trip (if the participant had selected some). Customizations are implemented by modifying/adding the Javascript and JQuery source code for the relevant questions. LimeSurvey has a well-established user/developer community that provides extensive support for queries and extensions.
Several questions required participant’s input validation, in order to prevent the insertion of incorrect data. For instance, when ranking transport mode preferences, participants have to provide ordered values (without ties or empty slots). This is achieved by writing validation expressions, which are checked at runtime by the LimeSurvey Expression manager.
A small set of MATLAB scripts were also developed, that extract and convert data from the .csv files exported from LimeSurvey into the .json format, which is the body of the HTTP POST requests that are needed to insert data in the CDBCDB, as described in the next section.
8. Consolidated Database (CDB)
The final step of the data processing involves the preparation of information for the CDB. The goal is to collect aggregated and pseudonymized information from all the HDF5 files, and make it available to the whole consortium (while the “selected partner” analysis is restricted to each specific vehicle owner), in order to support high-level impact analysis.
Collected data are also being utilized as feeds, to allow for further impact analysis studies. Not only does L3Pilot capture a snapshot of how automated driving technology is and looks like today, it also scales up the detailed findings from log and survey data with various tools, such as macroscopic simulations and transparent stepwise calculations, to estimate higher level impacts of automated driving. To the best of our knowledge, L3Pilot is among the first projects collecting data (from several vehicle manufacturers) and scientific evidence on near-future impacts. Data needed for this goal typically refer to instances of scenarios and related key performance indicators, in order to enable simulation studies for impact analysis.
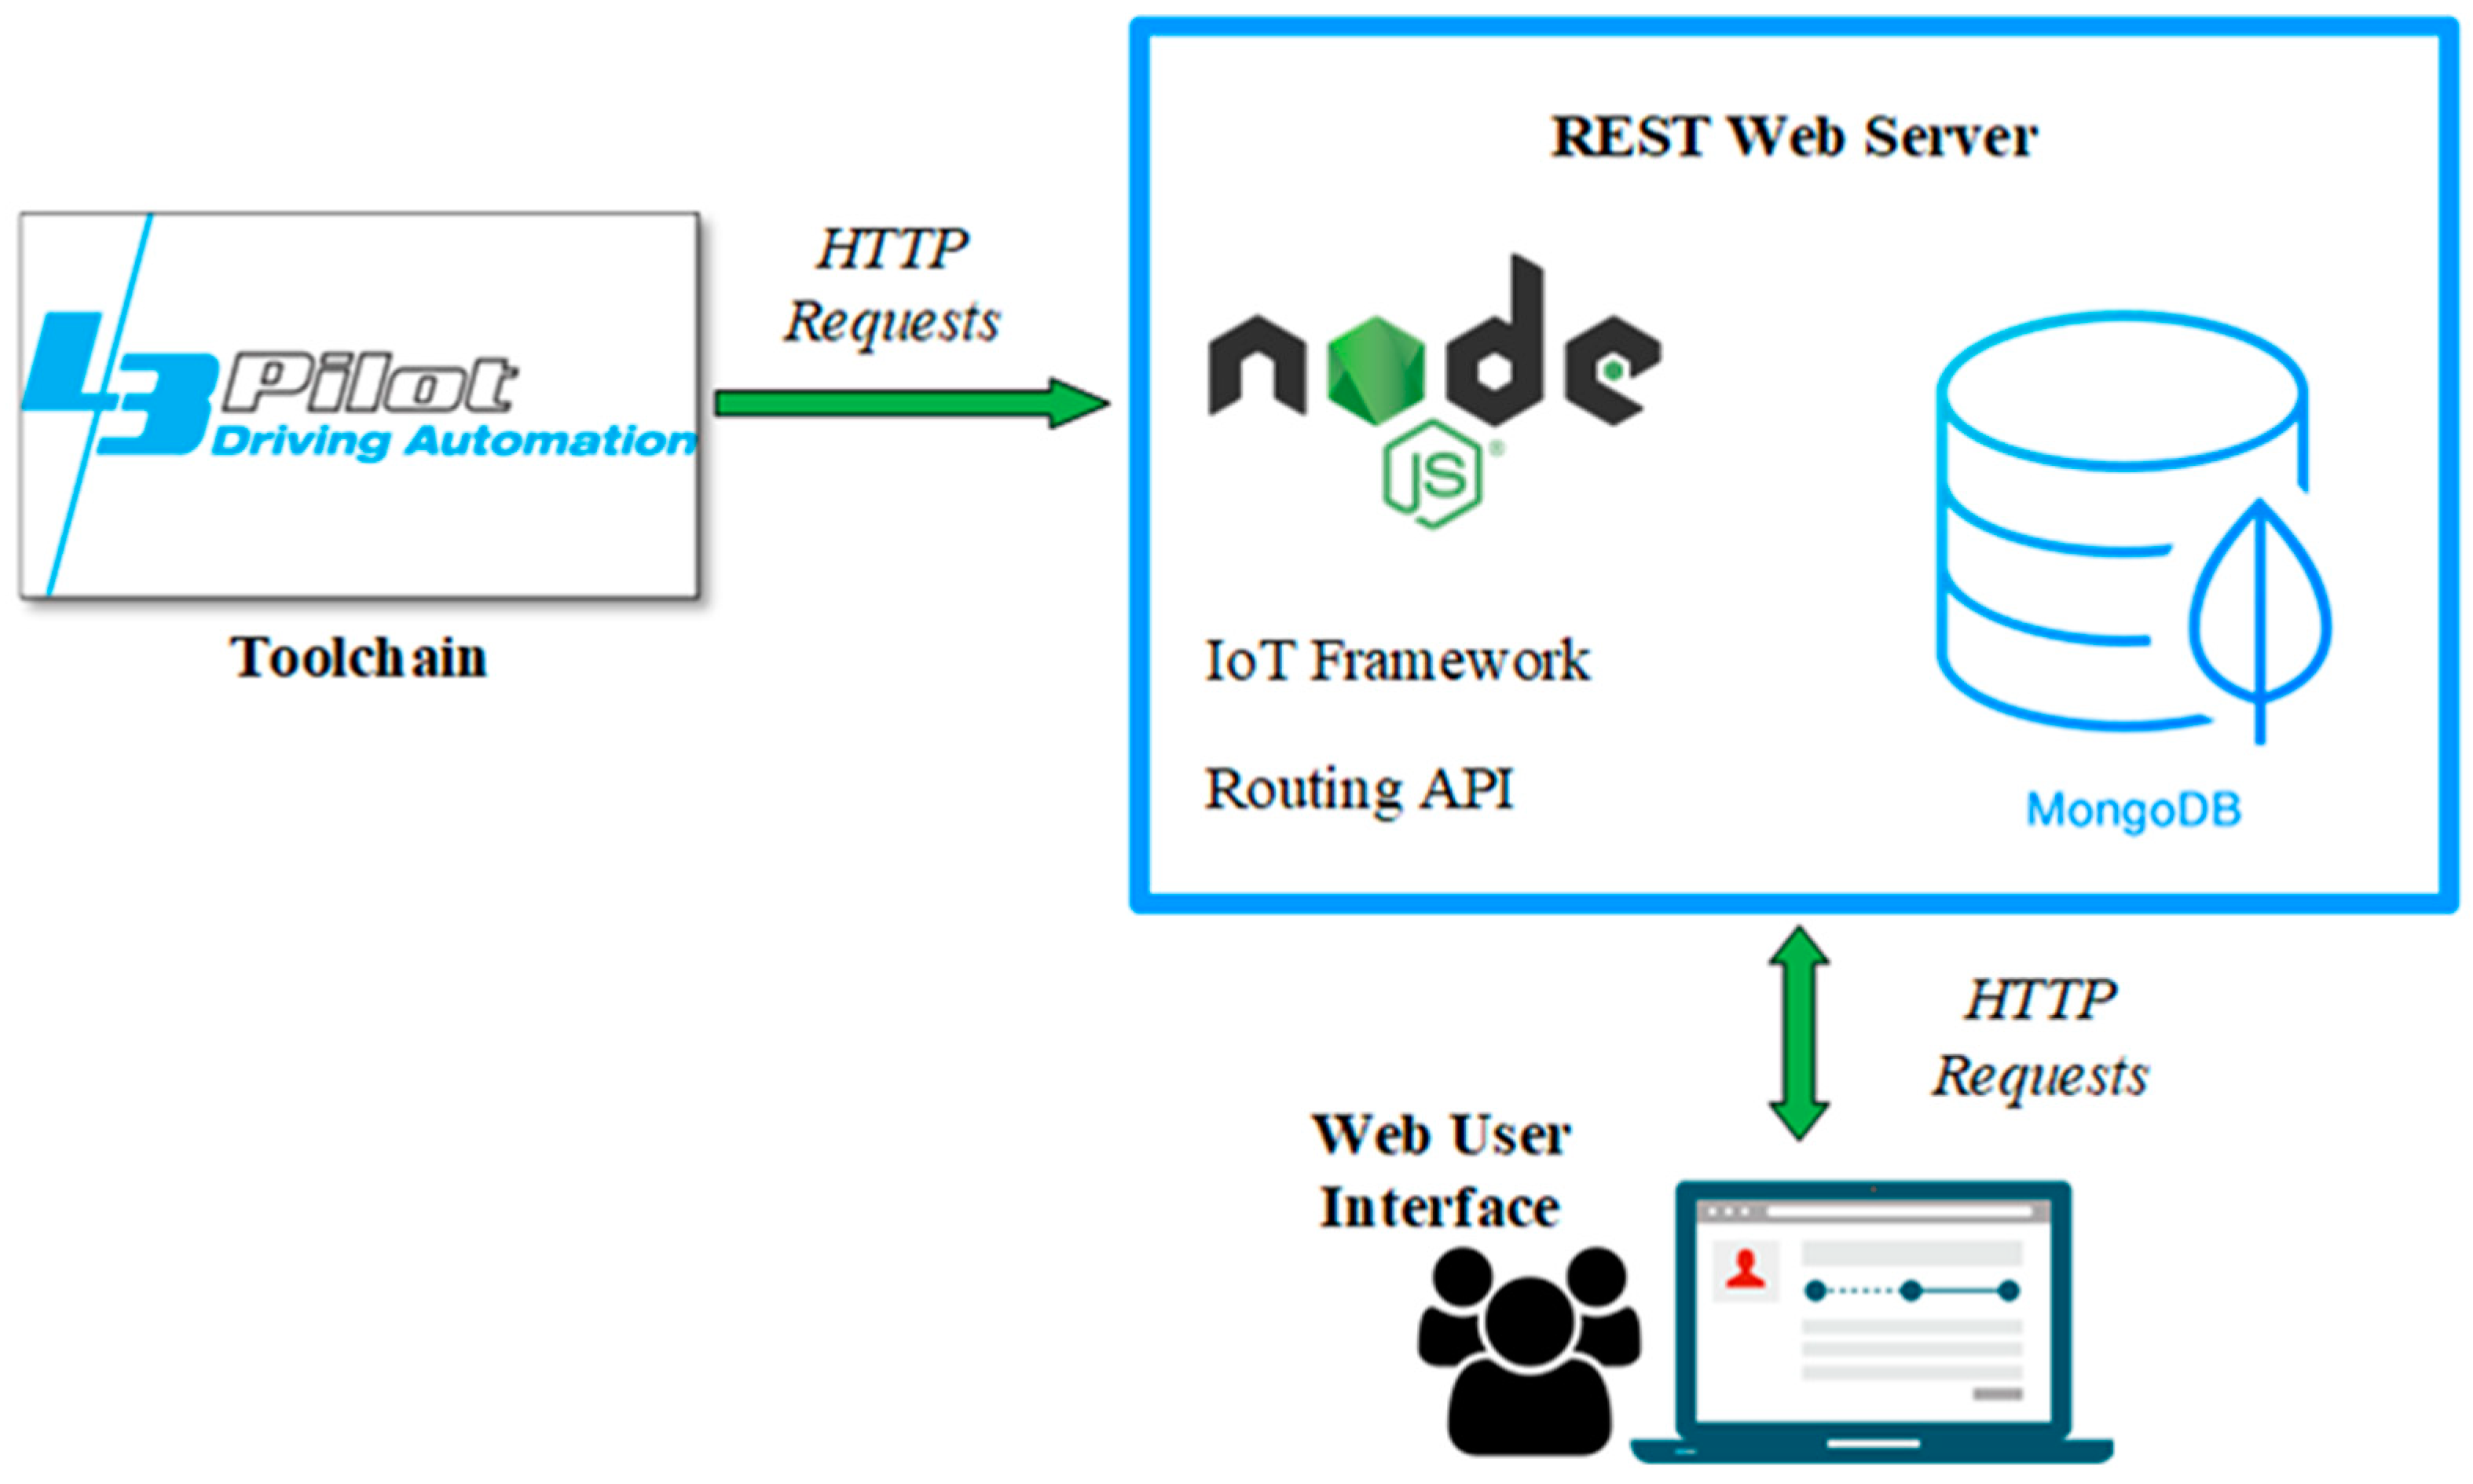
From an architectural point of view, we have developed a platform for supporting project-level data storage and retrieval. The platform relies on a MongoDB non-relational database, which is accessed through a Node.js application programming interface (API) (
Figure 6). The platform, which is based on the open source Atmosphere framework [
32], exposes a set of RESTful APIs [
33,
34] for inserting and retrieving data [
35]. A web Graphical User Interface (GUI) has been implemented in order to allow a user-friendly access to data. Different user roles have been defined for administrators, vehicle owners, and analysts. Such roles implement different data read/write rights, in order to meet the project information confidentiality requirements, which we described previously. An Uploader tool has also been created, to support efficient checking (e.g., for duplicates) and uploading of the data.
A set of MATLAB scripts have been developed as part of the data toolchain (
Section 6), through which vehicle owners and pilot site managers compute aggregated indicators and datapoints from HDF5 files and post them to the CDB. All collected data are segmented in the CDB, according to the road type and experimental condition (baseline or treatment, ADF available or not, ADF active or not), so as to support analysis and comparisons, according to the research questions. As anticipated in
Section 7, subjective data, which is the outcome of questionnaires filled by users, is also inserted. Putting things together, information from the source files to be inserted in the CDF is of the following kind:
Performance Indicators. These are the statistical descriptors presented in
Section 6. They are computed at trip level or at driving scenario instance level;
Data Points per driving scenario instances. These are particular types of data that are used for assessing impact by comparing different simulations enabled by the collected data. For each driving scenario, two types of data are recorded: starting points and summary values. The former record significant values at the beginning of the considered scenario instance (e.g., relative speed of the involved vehicles, relative positions, geometrical characteristics of the objects). The latter record significant statistical values for the considered scenario instance (e.g., mean speed of the ego vehicle, min and mean longitudinal acceleration, etc.);
Subjective data. One array of data is provided for each user questionnaire, including both pre- and post-hoc experience. Each element of the array contains the numerical code of the corresponding test participant’s response.
Beside a remote CDB, which is shared among all the consortium analysts, various installations of the same platform were also set up at each pilot site, in order to perform preliminary analyses before the complete common data gathering.
The CDB is able to provide this feature by creating a new user typology (“Public user”), which will be allowed access only to specific computations that will aggregate stored data at a level considered suited to preserve confidentiality. However, as anticipated, L3Pilot has not defined which data will be made available publicly yet, nor the access modality.
9. Pre-Pilot Achievements and Discussion
As of April 2020, the data chain has been developed and tested in the pre-pilots, which were planned for preliminarily testing of the data processing and analysis chain, before full-scale, on-road tests. AllsA tests have been substantially positive, and allowed us to spot bugs and face challenging situations that we had not previously considered. The data chain has been used by the analysts and all the 13 vehicle owners in the project.
A preliminary test showed that the L3Pilot CDF is more efficient than formats well established for FOTs, such as .csv (82% size reduction). On the other hand, it performs almost as well in terms of memory efficiency as the MATLAB proprietary format (9% size increase), while being independent of the software used [
25]. Portability has already been successfully experienced by the use of various tools that process the CDF files in different environments: Windows or Linux, and using Python, R, Java or MATLAB. The binary format requires specific tools for accessing/adding data in HDF5 files, but this is considered a minor limitation. L3Pilot contributed new open source code to the HDF Group by improving the Java support of the format (e.g., handling complex variables, which entailed a table within a table).
MATLAB scripts for vehicular data processing have been implemented, also exploiting synthetic data or collected from previous drives, for initial and continuous testing. Lab tests also involved data quality checking through the dedicated tool. The experience demonstrates that such quality monitoring is mandatory in large-scale tests.
Using a common format among different vehicle owners was deemed very useful. For research organizations and development projects in general, a common data format would enable the development of various tools on top of it, with clear efficiency advantages compared to the state-of-the-art.
As none of the vehicle owners currently log directly in CDF, recordings had to be filtered, resampled and then converted into CDF. Development of conversion software took an important part of the development, and led to availability of tools that can now flexibly manage different requirements. In general, experience taught us the higher importance of the CDF as the number of sensors increases. However, it must be kept in mind that automotive companies have departments with different logging needs, which are very difficult to harmonize, and a lot of work is needed in this direction. Of course, format unification or harmonization may be applied at later stages of the processing pipe. For instance, the definition of common key performance indicators allows common impact analysis, without prescribing a format for the source signal time series.
A huge quantity of data (in the order of terabytes) is being processed, size depending mostly on the amount of video cameras and selected resolution. Aggregated data is being loaded in the CDB (both in local private installations and in the shared cloud installation, that collects data from all the pilot sites). Scalability is necessary when dealing with such quantities of data. This is increasingly supported by state-of-the-art cloud services. The CDB implements another level of data integrity check, which allowed for the spotting of other bugs in data preparation and upload.
Overall, the L3Pilot experience stresses the importance of sharing information and data, at least at the level of indicators and well-defined syntheses (e.g., the datapoints), which enables combining test results from several pilot sites. Overall, this makes it possible to develop interoperable tools. The scope of data processing scripts in a project such as L3Pilot has become very large. The number of derived measures, performance indicators and scenarios to be calculated out of test data amounts to hundreds. If pilot sites would each face such evaluation and calculation requirements alone, they would just end up carrying out a limited evaluation due to the lack of resources. There are also general barriers that hinder data sharing, such as: intellectual property rights, privacy and product confidentiality, quality issues, lack of resources or trust, poor or missing agreements. This obviously stresses the importance of data sharing clauses in consortium agreements.
Toolchain developers found it good practice to organize weekly scrum calls to review development status, list tasks and go through issues, according to the agile methodology [
36]. Weekly meetings also enabled creation of a well-functioning team across many organizations, and the use of a versioning tool such as Git was vital to manage the several teams working on complex hardware/software system development.
10. Conclusions and Future Work
Conducting a pilot on novel automated driving functions implies processing a huge amount of data, in order to extract meaningful information. We have faced this challenge designing and developing a toolchain to process and manage qualitative (user questionnaire) and quantitative (vehicular) data in L3Pilot. Such data are now being analyzed for answering a set of RQs about evaluation of L3 automation on aspects such as technical functioning, user acceptance, traffic impact, and socio-economic impact. Positive feedback from the L3Pilot analysts has shown the validity of presented approach.
Data processing starts by converting all logged data into the CDF—a format that L3Pilot created and promotes for open collaboration [
25,
26]. Open source ideas and tools are becoming more common, as data processing needs have spread across vehicle makers. The CDF is a HDF5-based file format, where each trip is saved as one file, including metadata that provides further information of the recording. The minimum required CDF signal list caters for various impact assessment areas, mainly: driver behavior, user experience, mobility, safety, efficiency, environment, and socio-economics. Creating conversion scripts from original logs into CDF required considerable effort. However, the alternative of using tailored analysis scripts for each different log format and vehicle type would have been very challenging in such a large research project with several vehicle manufacturers, whose sensor sets and setups differ.
The common format enabled the development of combined analysis scripts for all pilot sites, that include indicator calculation, event and driving situation detection, and support for video data annotation. The shared calculation framework ensures that fully comparable indicators, distributions and event lists can be extracted from each test. The resulting indicators and data distributions were further used as an input for impact assessment, where results from many pilot sites are statistically combined. As an important novelty, a low-confidentiality, pseudonymized aggregation of data from each test trip is stored in the CDB shared in the cloud. Combining results from different pilot sites enabled analysts to use a larger dataset for statistical work. To the best of our knowledge, this is the first open-sourced format by a large automotive consortium to store and process data from automated driving tests, and it comes with a confidentiality-aware toolchain for processing, data sharing and evaluation.
Our experience stresses two main benefits of data sharing within a consortium: (1) getting more research results for the money that was spent into collecting data, (2) multiple people being able to scientifically validate results and build belief into the findings. Of course, there are also important aspects of confidentiality, property, and privacy, that must be considered and adequately balanced.
The next major step of the project is completing the analysis of the test data, in order to respond to the project RQs. This will provide further feedback on the quality of the designed data chain. We are confident that the open source release of the CDF specifications will enable further collaboration regarding automated driving data sharing and analysis.
A key point will concern the study on how to improve CDF, particularly considering the different and sometimes conflicting needs of different users and stakeholders (e.g., different departments of an automotive company), also implying different types of source data, derived measures, detectable scenarios, and performance indicators.
Overall, we hope that the presented L3Pilot toolchain may become a comprehensive edge-to-cloud reference workflow and architecture for managing data in automated vehicle tests. The CDF can also encourage the development community to share data and tools.

 ,
, 


