Article

Nondestructive Testing of Hollowing Deterioration of the Yungang Grottoes Based on THz-TDS

1
School of Geophysics and Information Technology, China University of Geosciences, Beijing 100083, China
2
School of Physics and Electronics Science, Shanxi Datong University, Datong 037009, China
3
The Research Institute of Yungang Grottoes, Datong 037007, China
4
Department of Physics, Capital Normal University, Beijing 100048, China
*
Author to whom correspondence should be addressed.
Electronics 2020, 9(4), 625; https://doi.org/10.3390/electronics9040625
Submission received: 24 February 2020 / Revised: 6 April 2020 / Accepted: 7 April 2020 / Published: 9 April 2020
(This article belongs to the Special Issue Terahertz Technology and Its Applications)

Abstract

:
Terahertz (THz) spectroscopy is an important method in noninvasive detection and diagnosis for historic relics. A new nondestructive testing (NDT) method based on terahertz time-domain spectroscopy (THz-TDS) technology was developed to measure the hollowing deterioration of the Yungang Grottoes in this paper. Hollowing deterioration samples were strictly prepared, and a series of experiments were conducted to ensure the representativeness of the experimental results. A hollowing thickness model was established by the relationship between the thickness of the hollowing deterioration sample and the time difference of the front flaked stone surface and the stone wall surface of the hollowing deterioration samples. The results show that the R-squared value of the model equation reached 0.99795, which implies that this model is reliable. Therefore, the actual hollowing thickness of the Yungang Grottoes can be obtained by substituting the time difference in the proposed thickness hollowing model, where the time difference is obtained from measured THz spectra. The detection method of stone relic hollowing deterioration is easy to apply, which can not only realize qualitative NDT but also quantitative hollowing deterioration thickness determination. This method has crucial practical significance for the repair and strengthening of stone relics similar to the Yungang Grottoes.

Graphical Abstract

1. Introduction

Stone relics are monuments consisting of natural stones, including buildings, grottoes, stone tablets, etc., which have very high historical and artistic values, as well as represent a specific kind of geological engineering requiring long-term preservation. However, with the intensification of environmental pollution and under the influence of natural and human factors, stone relics (especially open stone relics) are being damaged at an alarming rate [1,2,3]. This damage has endangered the safety of cultural relic preservation and has affected the historical and cultural values of stone relics.
As one of the commonly occurring types of damage, hollowing deterioration destroys the structure and shortens the life of stone relics. Hollowing possesses concealed characteristics that cannot be observed timely and clearly from the stone surface. With the Yungang Grottoes as an example, as shown in Figure 1, the surface of stone relics is corroded, and the internal layered or sheet-like clay mineral and gypsum components produce a high expansion pressure under the action of natural precipitation, such as rain. When a rock formation has low rock strength, a hollowing structure will be produced, which comprises three parts, namely, the front rock wall (flaked stone), the air layer, and the substrate layer (stone wall). When the air layer in the hollowing structure reaches a certain thickness, the front rock wall may naturally detach, forming new cracks as a result of large temperature fluctuations and an uneven internal force distribution, which significantly endangers stone relics.
The nondestructive detection technique is an effective method for identifying hidden internal defects and dislocation impurities to estimate and extend the life of the tested object by the use of sound, light, magnetic field, electricity, etc., under the precondition of not damaging the detection target [4,5,6,7,8,9,10,11,12,13,14]. Compared with the conventional methods in the present nondestructive testing (NDT) field, such as magnetic particle testing, penetration testing, eddy current testing, radiographic testing, and ultrasonic testing, the typical wavelength of terahertz (THz) waves (300 µm) is larger than the size of small-scale structures; therefore, THz scattering in most objects occurs far less than for visible and near-infrared light, and the THz wave photon energy is commonly lower than the chemical bond energy, which means that THz waves can better penetrate most nonpolar materials. Furthermore, a THz wave is particularly suitable for NDT, and it allows the development of non-destructive, non-contact, non-ionizing methods that could advantageously replace other evaluation methods based on X-rays, ultrasound, and thermography [15,16,17,18,19,20,21].
Terahertz time-domain spectroscopy (THz-TDS) is a new THz spectrum measurement technique based on ultra-short pulse technology developed in recent years, which has been widely applied in the fields of physics, chemistry, biology, etc. [22,23,24,25,26,27]. The physical and chemical parameters of tested objects, such as the complex dielectric constant, dispersion coefficient, transmission, and absorption, are usually obtained by THz-TDS, and the material composition and structure of the tested objects can then be studied. However, no relevant report is found on characterizing stone relic hollowing deterioration with THz-TDS. In this paper, the hollowing deterioration of Yungang Grotto samples was studied using THz nondestructive testing (THz-NDT) technology based on THz-TDS.

2. Hollowing THz-NDT Theory

THz-TDS is a coherent detection technology that can simultaneously obtain information about the THz pulse amplitude and phase [28,29,30]. As such, it relies on THz wave reflection to detect changes in the THz time-domain pulse wave in the sample before and after irradiation, called the reference and sample waveforms, respectively. The THz time-domain spectra of reference and hollowing deterioration samples are shown in Figure 2. The reference wave is the THz wave in the sample without hollowing deterioration, with a corresponding d_2 value of 0. When the corresponding d_2 values of the hollowing deterioration sample waves are 1, 2, 3, and 4 mm, the upper right figure shows that the THz time-domain spectra of the reference and hollowing deterioration samples range from 368 to 404 picoseconds. Figure 2 reveals that the different peak positions of the echo waves correspond to various prolonged times of hollowing samples with different thicknesses (d_2). With increasing hollowing deterioration sample thickness, the delay time of the echo wave increases. The peak positions are reflected from the front and back flaked stone surfaces (S_1 and S_2, as shown in Figure 1) corresponding to 314.88 and 374.17 ps, respectively. The peak positions reflected from the stone wall surface (S_3 and d_2, as shown in Figure 1) occur at 378.49, 384.45, 389.79, and 396.08 ps, which correspond to d_2 values of the hollowing deterioration model samples of 1, 2, 3, and 4 mm, respectively.

2.1. Single-Point Thickness Extraction Hollowing Model

THz waves are reflected at the interfaces between media with different dielectric constants during propagation, as shown in Figure 1. The THz wave reflection single-point thickness extraction principle of the hollowing model is based on the assumption that flaked stone is homogeneously and isotropically distributed at a scale that is relatively larger compared with the focal spot size of the THz wave.
When the THz wave has an incident angle θ i , E_{s1} is the THz wave reflected by the front flaked stone surface (S_1), and T_1 is the peak position of the first wave, E_{s1}. Similarly, T_2 and T_3 are the peak positions of the first wave reflected by the back flaked stone surface (E_{s2}) and the stone wall surface (E_{s3}), respectively (as shown in Figure 1). According to the THz wave propagation theory, the thickness was defined in the reflection single-point extraction model as follows [13]:
d _ 2 = c n 0 2 n 2 sin 2 θ t 2 n 0 2 ( T _ 3 T _ 1 ) n 0 2 n 2 sin 2 θ t n 2 n 0 2 sin 2 θ i ( n 2 n 0 2 · d _ 1 ) ,
When the incident direction of the THz wave is perpendicular to the hollowing deterioration samples, the thickness of the single-point extraction model can be simplified as:
d _ 2 = c 2 n 0 ( T _ 3 T _ 1 ) n n 0 · d _ 1 ,
where d_1 and d_2 are the thicknesses of the flaked stone and the hollowing deterioration sample, respectively, T_1 and T_3 are the peak positions of the first wave reflected by E_{s1} and E_{s3}3, respectively, n and n 0 are the refractive indexes of the flaked stone sample and air, respectively, and c is the light propagation velocity in air.

2.2. Simplified Hollowing THz-NDT Model

The hollowing thickness can be obtained by measuring the THz echo time difference when the refractive index of the flaked stone is known. However, in a general engineering test, the optical parameters of samples are very difficult to extract. However, the THz echo time difference can represent the hollowing thickness, so we simplified the proposed model with reflective thickness correlation coefficients k and b as follows:
d _ 2 = a × ( T _ 3 T _ 1 ) + b = k × Δ T + b ,
Currently, irregularly shaped targets cause challenges in hollowing deterioration detection in engineering applications. Therefore, the simplified hollowing thickness model is pre-established by the correlation coefficient method to solve this problem. The actual hollowing thickness of the Yungang Grottoes can be determined by substituting the time difference in the hollowing thickness model, and this difference time can be obtained from measured THz spectra.

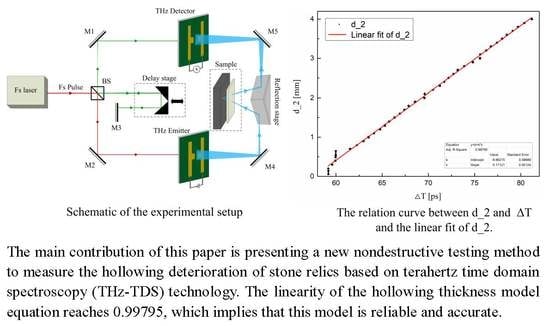
3. Experimental Method

3.1. Nondestructive Testing Using THz Wave Technique

In this paper, the hollowing deterioration samples are tested with a THz-TDS1008 test system, which is compact, self-contained, and highly integrated, and the optical antenna method is adopted to produce and detect THz pulses. The latter approach relies on a femtosecond laser, THz emission and detection components, and a composite time-delay system. The central wavelength of the laser is 800 nm, the pulse duration is 100 fs, the THz pulse width is 0.05~3.5 THz, and the signal-to-noise ratio (SNR) >65 dB. In addition, the hollowing deterioration model samples were tested at normal temperature (293 K) and 30% relative humidity. The schematic experimental setup is shown as Figure 3.

3.2. Hollowing Deterioration Sample Preparation and Testing

Hollowing deterioration is a common stone surface degradation phenomenon, in which surface sheet-like layers experience uplift deformation leading to cavities and cracks. Over time, these layers will detach due to their weight and the environmental changes, such as temperature, humidity, shock, and vibration. The THz-TDS can be effectively applied to the quantitative diagnosis of hollowing deterioration. In this work, we have avoided the inhomogeneous samples so that precise THz spectra can be obtained. We cut grotto samples into approximately 2-mm stone sheets and 6-mm stone blocks using an angle grinder and then polished them with sandpaper, which were used as the stone flake and stone wall of the hollowing deterioration model. Finally, we overlaid the two stone slices with different thicknesses to form a hollowing deterioration sample, as shown in Figure 4. The hollowing deterioration model samples were tested, and the thickness range of the hollowing deterioration samples was 0 to 4 mm at 0.1-mm intervals.
Since the thickness of the front surface of most hollowing deterioration in Yungang Grottoes is about 2 mm, we chose this typical thickness for our study. At the same time, we also tested the time-domain spectra of the flaked stone in the THz reflection and transmission system, as shown in Figure 5. Figure 6 is the refractive index spectrum. As can be seen from Figure 6, the refraction index of flaked stone was 2.11 in the THz band.

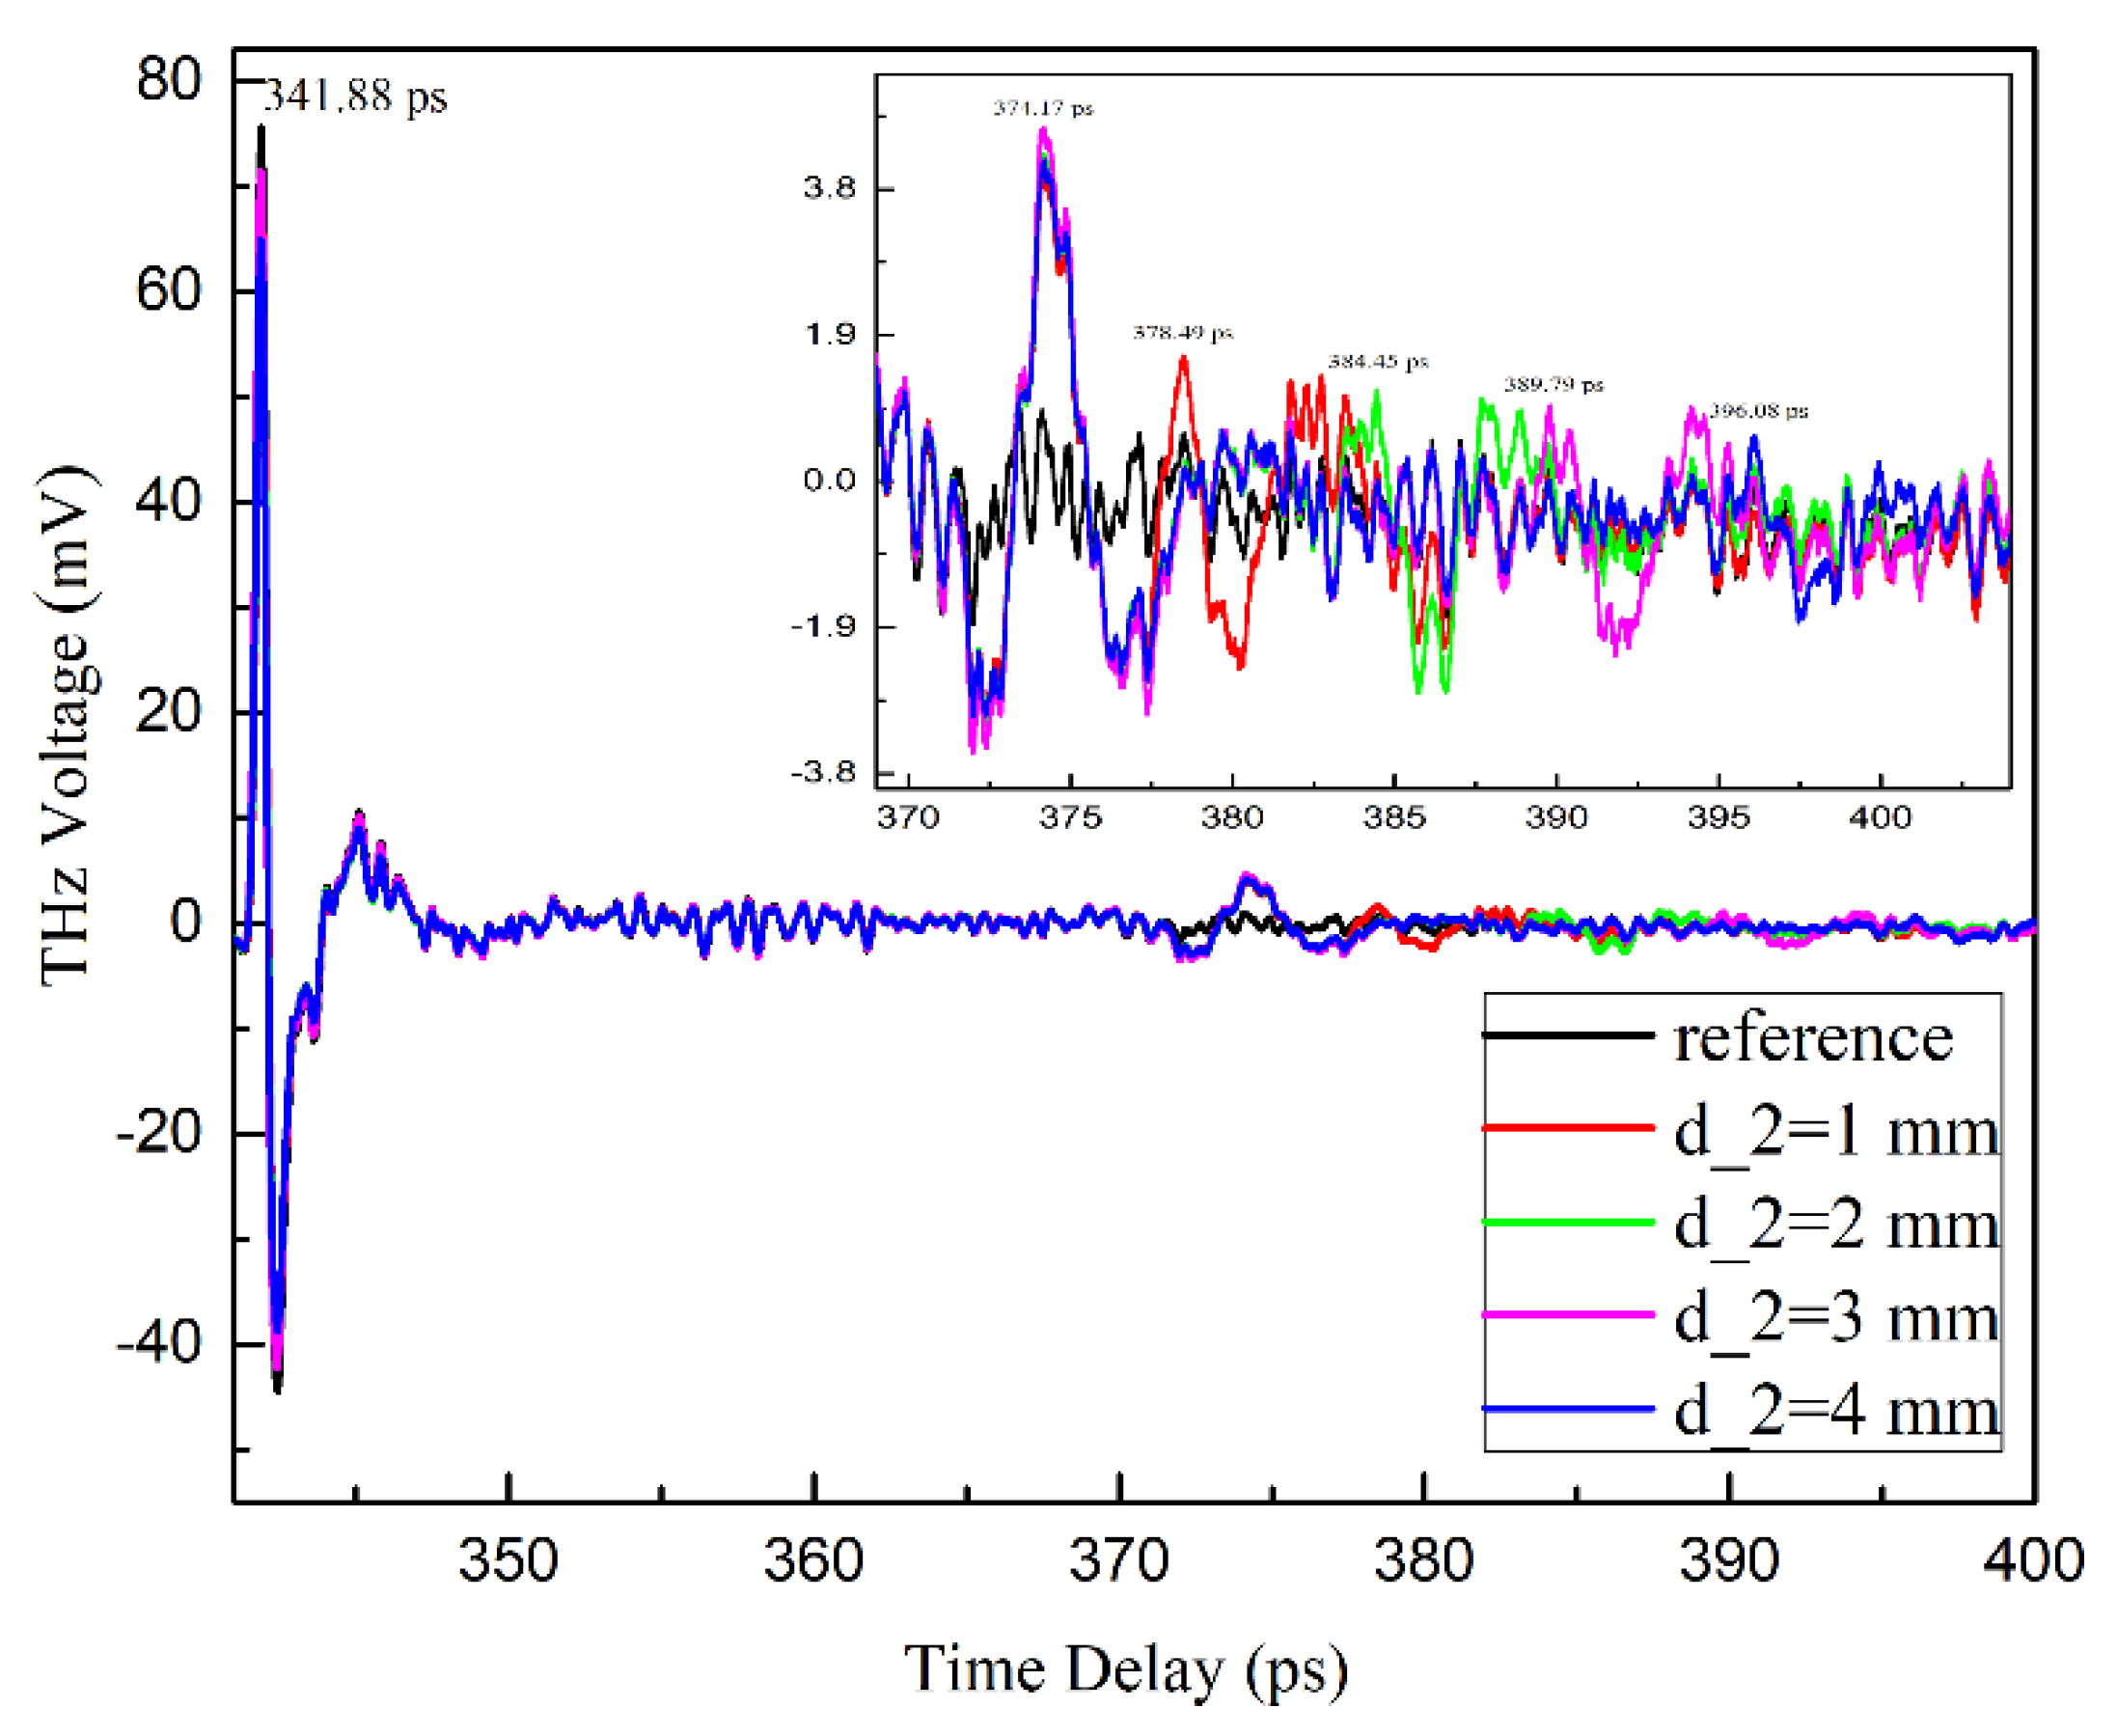
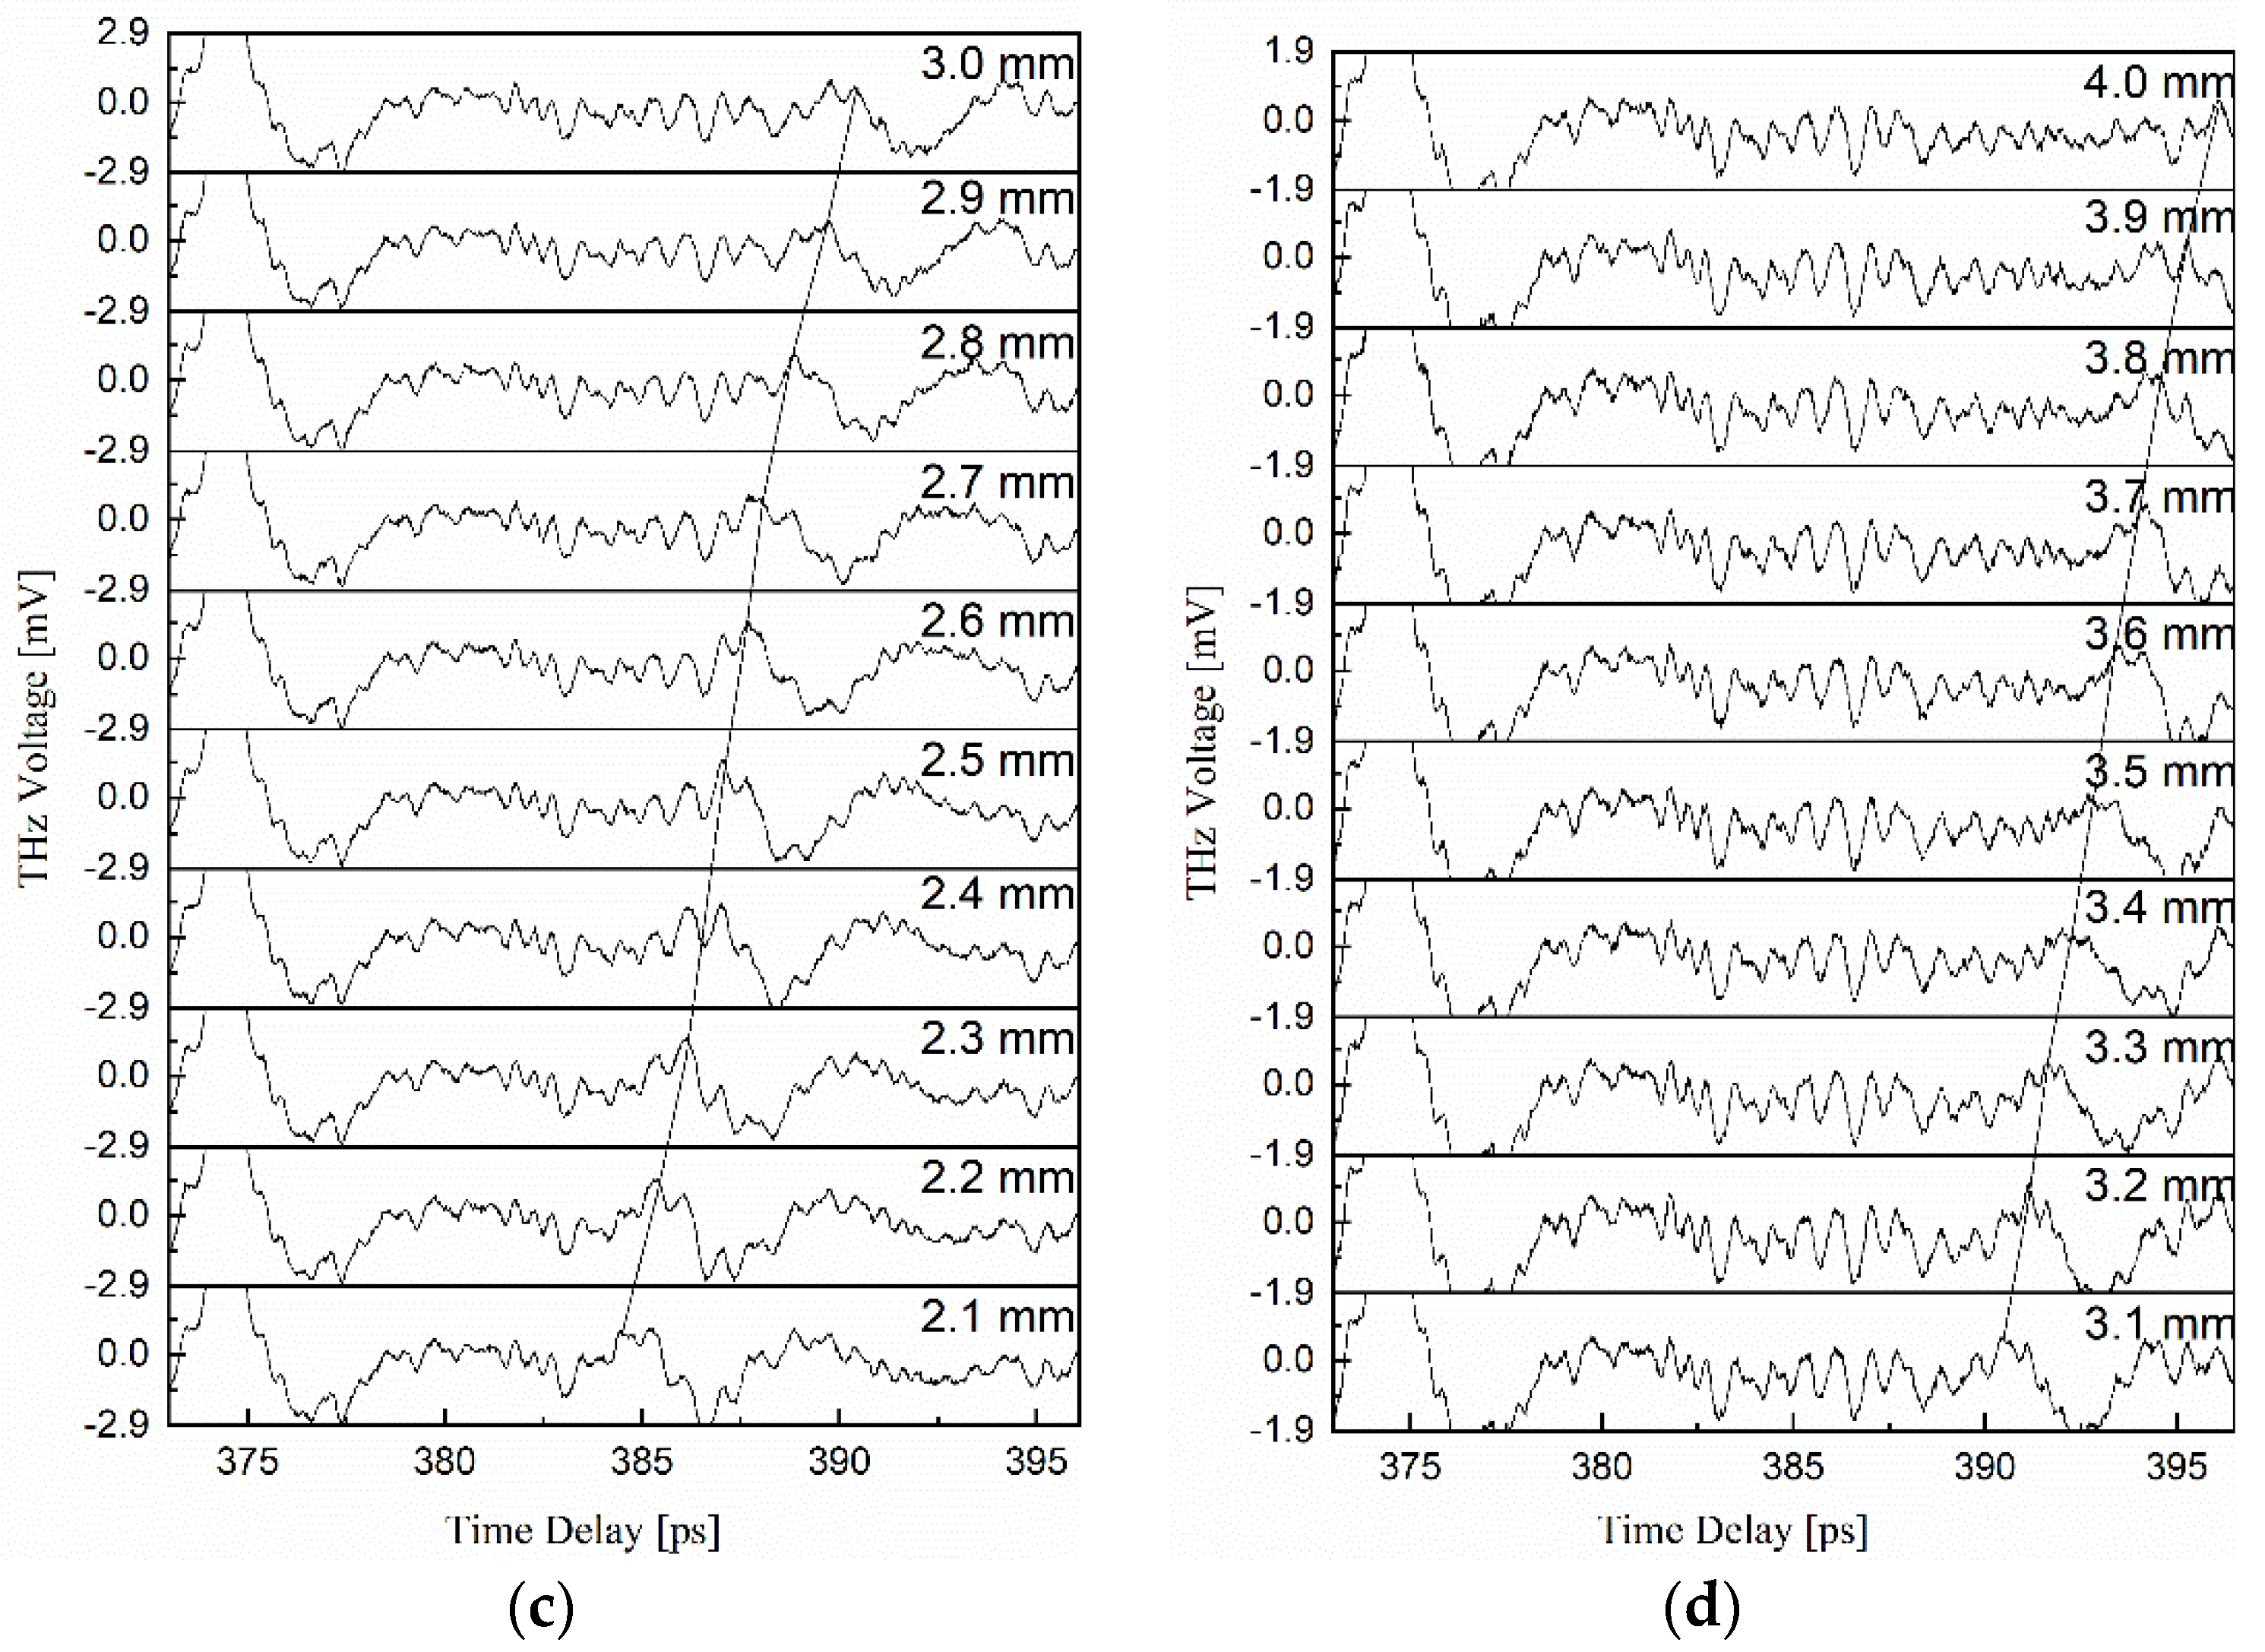
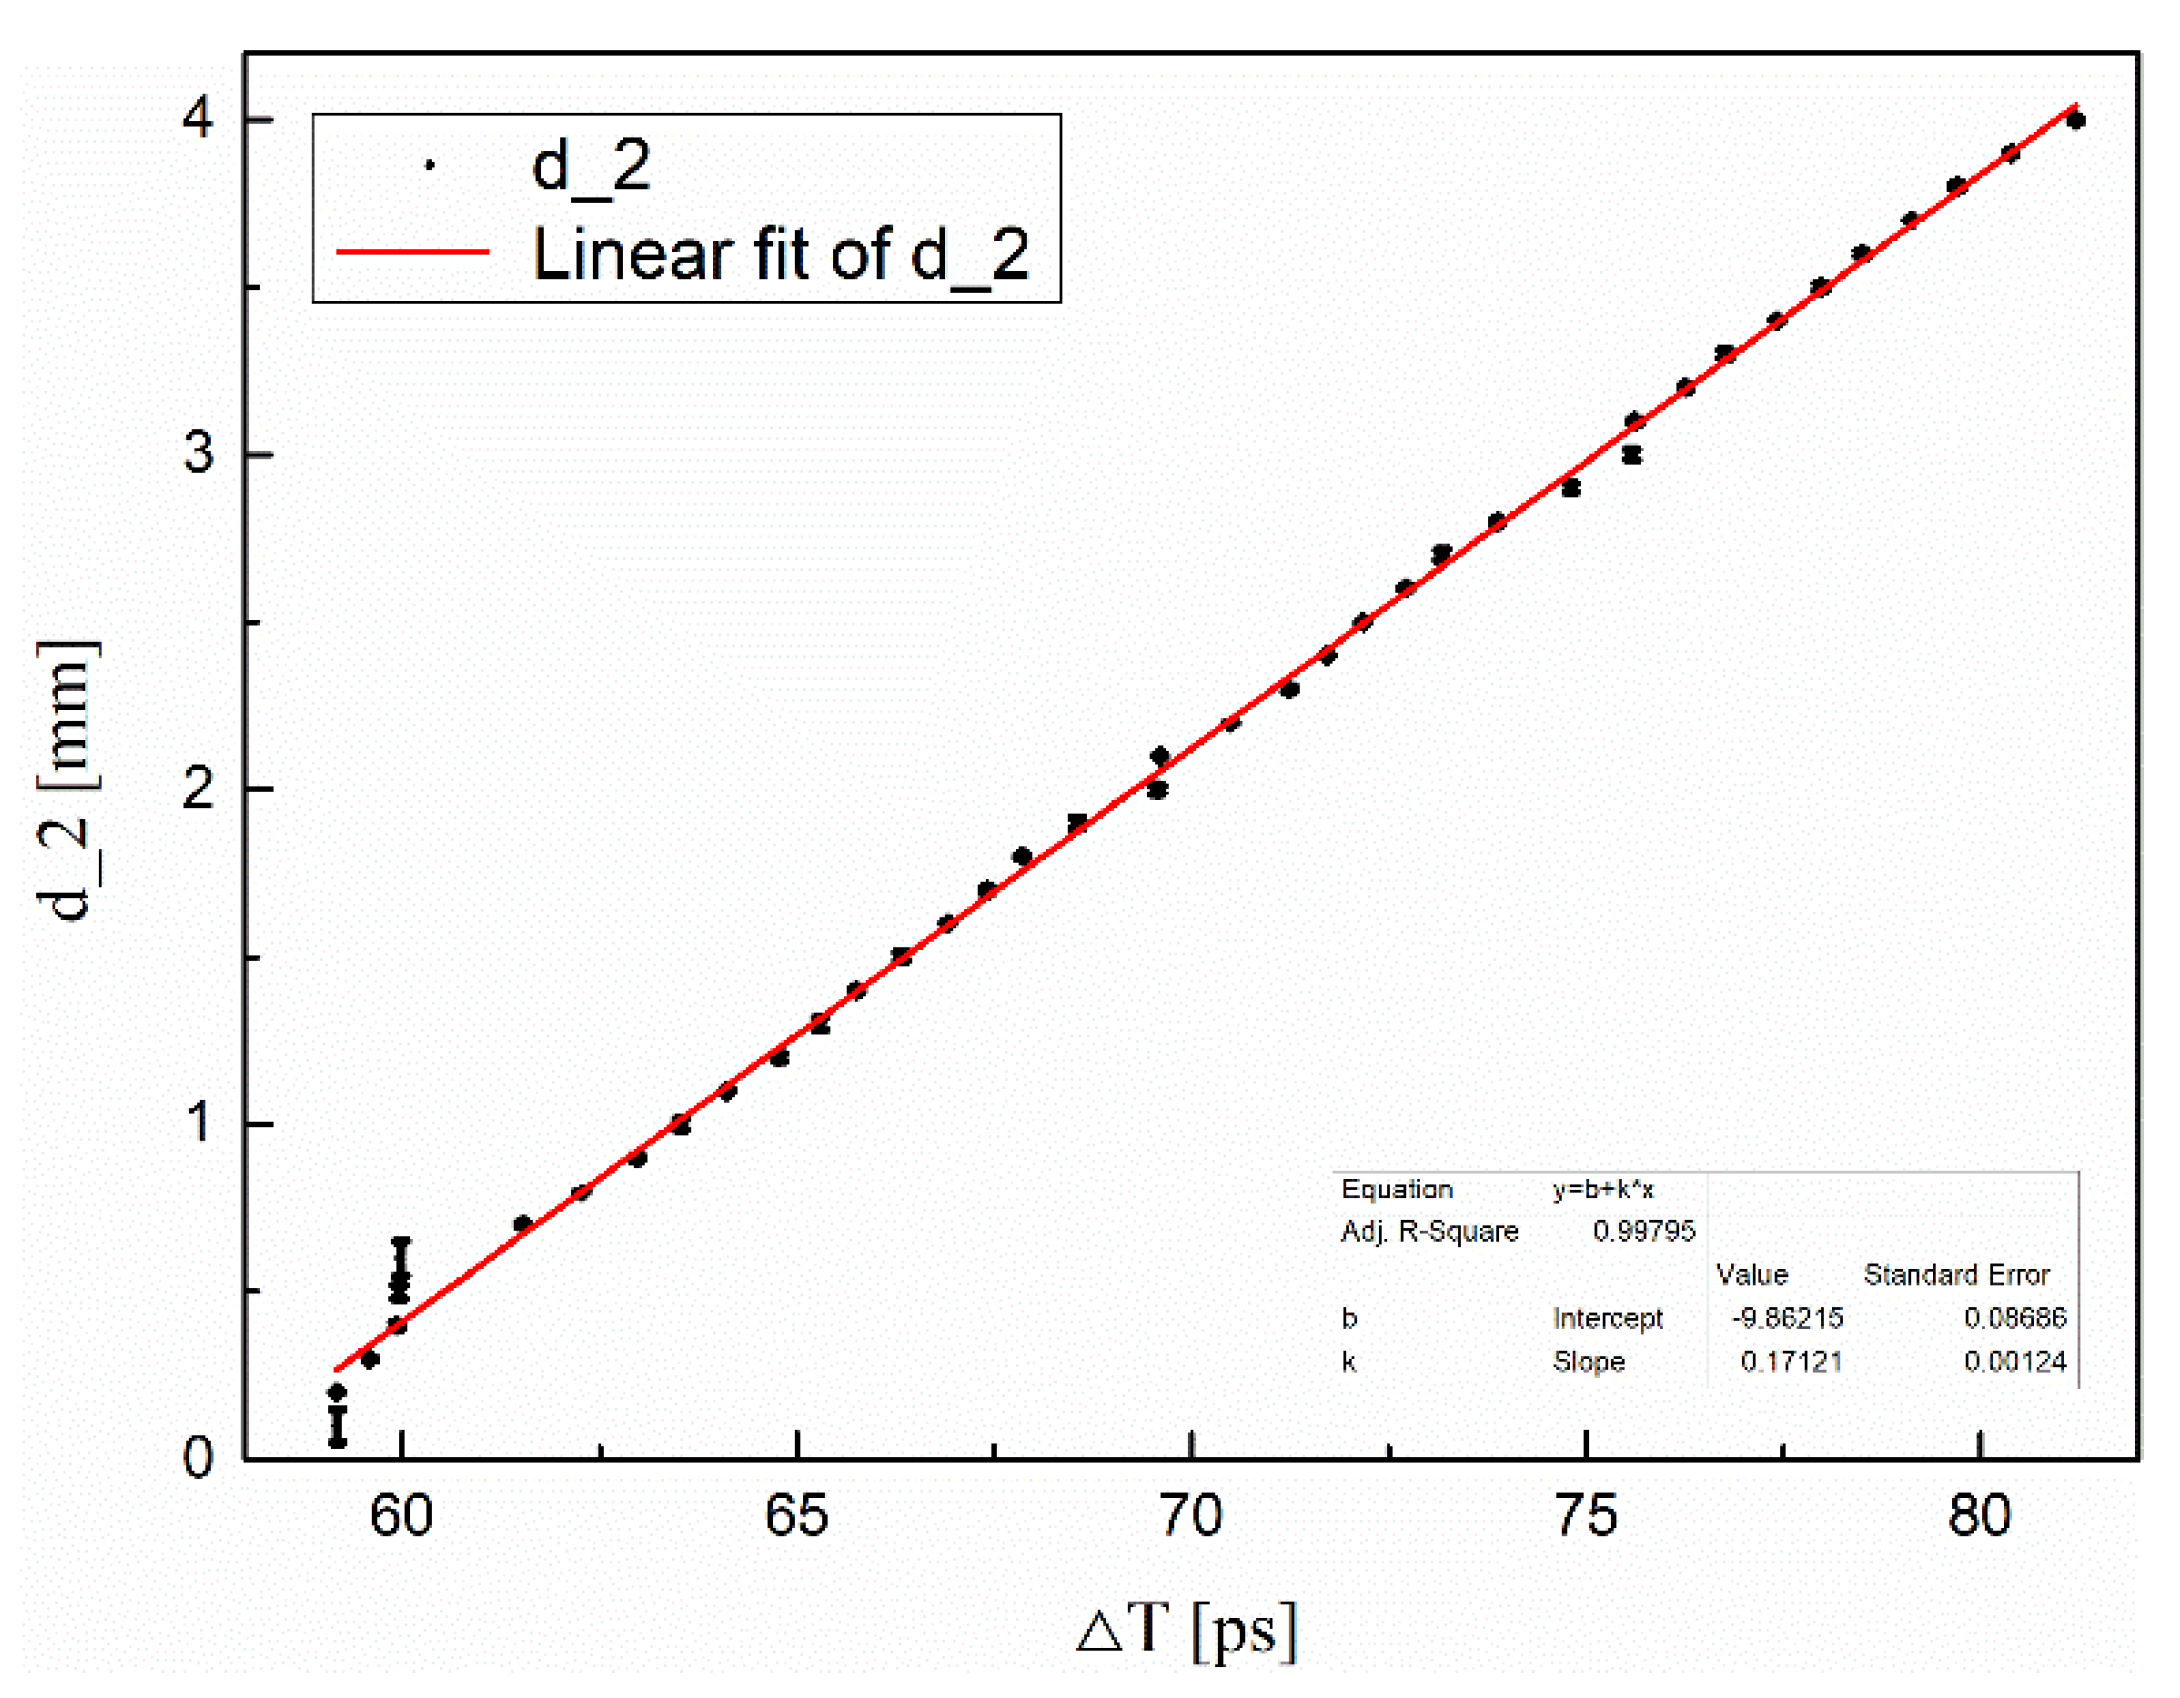
4. Results and Discussion

To accurately and reliably obtain the hollowing thickness, we measured THz spectra of the hollowing deterioration samples, where the thickness ranged from 0 to 4 mm at 0.1-mm intervals, and the measured data was used to develop the hollowing detection model. The THz time-domain spectra for all the hollowing deterioration samples are shown in Figure 7. Figure 7a–d are the THz time-domain spectra of the hollowing deterioration samples with different thicknesses. As THz wave is very sensitive to the small changes of the hollowing deterioration samples, the THz time-domain spectra of the different hollowing deterioration samples were different in the terahertz band and could be distinguished. In addition, it should be pointed out that the stone sheet of the hollowing deterioration samples was relatively thin but had a high refractive index. So the oscillating wave mainly resulted from the multiple reflections inside the sample, which is the Fabry–Perot interference effect. THz time-domain spectra revealed significant differences among the hollowing deterioration samples with different thicknesses, which caused the different propagating velocities in sample paths that gave rise to the different time delays. The decrease in terahertz pulse intensity was due to the reflectivity and absorption of the sample and the THz pulse became broad with the dispersion of the sample. Figure 7 indicates that the THz spectra of all samples attenuated quickly with the increasing of time delay in the whole spectral regions. The thickness of hollowing deterioration samples varied linearly with the peak position of the first wave reflected by the stone wall surface of the hollowing deterioration samples (T_3).
The peak positions of the THz spectra (T_3) for all of the different thicknesses were extracted with the hollowing model, and the reflection peak position of the S_1 surface (T_1, 314.88 ps) and the S_2 surface (T_2, 374.16 ps) was then subtracted to obtain the THz time delay difference (ΔT). As the thickness of the air layer in the hollowing deterioration increased, several close echoes appeared at the same time. Grubbs’ test was selected to eliminate the noise value when T_3 was selected accurately in the measured THz spectra. By Grubbs’ table look-up method, we were able to obtain the values of G ( n 0 ) for use in excluding outliers (for which G is greater than G ( n 0 )). G is defined as follows:
G = | t ¯ t n s | = | 1 n i = 1 n t i t n 1 n 1 i = 1 n ( t i 1 n i = 1 n t i ) 2 |
where t ¯ is the average of all THz wave time (t) data for every sample, s is the standard deviation, and n 0 is the significance level, which was taken to be 5%.
Figure 8 shows the relationship between ΔT and d_2, and in addition, the experimental data were linearly fitted. The R-squared value was up to 0.99795, which verifies the feasibility and validity of this method. The linear fitting equation for ΔT and d2 can also be described as follows:
d _ 2 = 9.88215 + 0.17121 ×   Δ T
By comparing the above linear fitting equation and Equation (3) of the hollowing thickness model, the correlation coefficients b and k of the latter could be determined as 9.88215 and 0.17121, respectively. In a general survey of Yungang Grottoes deterioration, the accurate hollowing thickness can be calculated by substituting actually measured THz spectra in the proposed model, which can provide effective references for repairing and reinforcing ancient relics.

5. Conclusions

In this work, we established a hollowing deterioration thickness detection model based on THz-TDS single-point experimental measurements. Our analysis suggests that THz technology can be applied to efficiently detect hollowing deterioration, as it reflects the thickness of hollowing deterioration. Even though the refractive index of hollowing deterioration samples is unknown, the model is universal. In the case of the hollowing deterioration samples of Yungang Grottoes, the THz spectra of 40 hollowing deterioration samples were determined, and the linear relationships between the thickness of hollowing deterioration samples and THz wave time-delay differences of the front flaked stone surface and the stone wall surface in samples were investigated. The resulting statistical model R-squared value reached 0.99795, which verified the feasibility and validity of this model. The method of analyzing the hollowing thickness of cultural relics using the THz-TDS method, which has high precision, is simple and nondestructive, and the method can be used for real-time hollowing deterioration detection of the Yungang Grottoes and be extended to other cultural relics. Moreover, the development of miniaturized, integrated, and higher-resolution THz instrumentation will enable this method to be applied in the field of cultural relic detection.

Author Contributions

Conceptualization, J.F., T.M., Y.L., G.Z., H.L., and J.Y.; Data curation, J.F., T.M., J.R., and R.H.; Investigation, J.F., T.M., and J.R.; Methodology, J.F., T.M., G.Z., and R.H.; Supervision, Y.L., G.Z., and J.Y.; Validation, J.F. and T.M.; Visualization, J.F., T.M., Y.L., H.L., J.Y., and R.H.; Writing—original draft, J.F. and T.M.; Writing—review and editing, J.F., T.M., G.Z., H.L., and J.Y. All authors have read and agreed to the published version of the manuscript.

Funding

This work was supported by the National Natural Science Fund of China under grants 11504212, the Science and Technology Innovation Group of Shanxi Province, China under grants 201805D131006, Important R&D projects of Shanxi Province under grants 201803D121083 and 201803D31014, Applied Basic Research projects of Shanxi Province under grants 201801D121072, and the Ph.D. research startup foundation of Shanxi Datong University under Grant No. 2014B06.

Conflicts of Interest

The authors declare no conflict of interest.

References

  1. Shyllon, F. International Standards for Cultural Heritage: An African Perspective. Int. Crimes 2017, 5, 347–363. [Google Scholar]
  2. Turkington, A.; Martin, E.; Viles, H.; Smith, B. Surface change and decay of sandstone samples exposed to a polluted urban atmosphere over a six-year period: Belfast, Northern Ireland. Build. Environ. 2003, 38, 1205–1216. [Google Scholar] [CrossRef]
  3. Doehne, E.; Price, C.A. Stone Conservation: An Overview of Current Research, 2nd ed.; Getty Conservation Institute: Los Angeles, CA, USA, 2010; pp. 1–25. [Google Scholar]
  4. Gericke, O.R. Determination of the Geometry of Hidden Defects by Ultrasonic Pulse Analysis Testing. J. Acoust. Soc. Am. 1963, 35, 364. [Google Scholar] [CrossRef]
  5. Jiles, D. Review of magnetic methods for nondestructive evaluation (Part 2). NDT E Int. 1990, 23, 83–92. [Google Scholar] [CrossRef]
  6. Márquez, E.; Ramirez-Malo, J.; Villares, P.; Jiménez-Garay, R.; Ewen, P.J.S.; Owen, A.E. Calculation of the thickness and optical constants of amorphous arsenic sulphide films from their transmission spectra. J. Phys. D Appl. Phys. 1992, 25, 535–541. [Google Scholar] [CrossRef]
  7. Hellier, C.J. Handbook of Nondestructive Evaluation; Mcgraw-hill: New York, NY, USA, 2001. [Google Scholar]
  8. Leona, M.; Casadio, F.; Bacci, M.; Picollo, M. Identification of the Pre-Columbian Pigment Mayablue on Works of Art by Noninvasive UV-Vis and Raman Spectroscopic Techniques. J. Am. Inst. Conserv. 2004, 43, 39–54. [Google Scholar] [CrossRef]
  9. Anouncia, S.; Saravanan, R. Non-destructive testing using radiographic images? A survey. Insight Non-Destructive Test. Cond. Monit. 2006, 48, 592–597. [Google Scholar] [CrossRef]
  10. Puryear, C.I.; Castagna, J.P. Layer-thickness determination and stratigraphic interpretation using spectral inversion: Theory and application. Geophysics 2008, 73, R37–R48. [Google Scholar] [CrossRef]
  11. Duling, I.; Zimdars, D. Revealing hidden defects. Nat. Photon 2009, 3, 630–632. [Google Scholar] [CrossRef]
  12. Lü, Q.; Tang, M.-J.; Cai, J.; Zhao, J.-W.; Vittayapadung, S. Vis/NIR hyperspectral imaging for detection of hidden bruises on kiwifruits. Czech J. Food Sci. 2011, 29, 595–602. [Google Scholar] [CrossRef] [Green Version]
  13. Duvillaret, L.; Garet, F.; Coutaz, J.-L. Highly precise determination of optical constants and sample thickness in terahertz time-domain spectroscopy. Appl. Opt. 1999, 38, 409–415. [Google Scholar] [CrossRef]
  14. Ospina-Borras, J.E.; Benitez-Restrepo, H.D.; Benitez-Restrepo, H.D. Non-Destructive Infrared Evaluation of Thermo-Physical Parameters in Bamboo Specimens. Appl. Sci. 2017, 7, 1253. [Google Scholar] [CrossRef] [Green Version]
  15. Zhang, W.; Lei, Y. Progress in terahertz nondestructive testing. Chin. J. Sci. Instrum. 2008, 29, 1563–1568. [Google Scholar] [CrossRef]
  16. Jolly, M.; Prabhakar, A.; Sturzu, B.; Hollstein, K.; Singh, R.; Thomas, S.; Foote, P.; Shaw, A. Review of Non-destructive Testing (NDT) Techniques and their Applicability to Thick Walled Composites. Procedia CIRP 2015, 38, 129–136. [Google Scholar] [CrossRef] [Green Version]
  17. Park, S.-H.; Jang, J.-W.; Kim, H.-S. Non-destructive evaluation of the hidden voids in integrated circuit packages using terahertz time-domain spectroscopy. J. Micromech. Microeng. 2015, 25, 95007. [Google Scholar] [CrossRef]
  18. Cheng, L.; Wang, L.; Mei, H.; Guan, Z.; Zhang, F. Research of nondestructive methods to test defects hidden within composite insulators based on THz time-domain spectroscopy technology. IEEE Trans. Dielectr. Electr. Insul. 2016, 23, 2126–2133. [Google Scholar] [CrossRef]
  19. Oh, G.-H.; Jeong, J.-H.; Park, S.-H.; Kim, H.-S. Terahertz time-domain spectroscopy of weld line defects formed during an injection moulding process. Compos. Sci. Technol. 2018, 157, 67–77. [Google Scholar] [CrossRef]
  20. Lewis, R. A review of terahertz detectors. J. Phys. D Appl. Phys. 2019, 52, 433001. [Google Scholar] [CrossRef]
  21. Wang, Y.; Sun, Z.; Xu, D.; Wu, L.; Chang, J.; Tang, L.; Jiang, Z.; Jiang, B.; Wang, G.; Chen, T.; et al. A hybrid method based region of interest segmentation for continuous wave terahertz imaging. J. Phys. D Appl. Phys. 2019, 53, 095403. [Google Scholar] [CrossRef]
  22. Akevren, S. Non-Destructive Examination of Stone Masonry Historic Structures Quantitative IR Thermography and Ultrasonic Testing. Master’s Thesis, Middle East Technical University, Universiteler Mahallesi, Cankaya Ankara, Turkey, 2010. [Google Scholar]
  23. Wang, Y.; Xia, Y.; Zhang, J.S.; Li, H.S.; Dai, S.B.; Tang, Z. Experimental Research about Weathering Resistance and Surface Deterioration of Two Kinds of Stone Cultural Relics. Adv. Mater. Res. 2011, 250, 65–69. [Google Scholar] [CrossRef]
  24. Li, L.; Zhou, M.; Ren, J. Test of the adhesive thickness uniformity based on terahertz time-domain spectroscopy. Laser Infrared. 2014, 44, 801–804. [Google Scholar] [CrossRef]
  25. Tanaka, S.; Shiraga, K.; Ogawa, Y.; Fujii, Y.; Okumura, S. Applicability of effective medium theory to wood density measurements using terahertz time-domain spectroscopy. J. Wood Sci. 2014, 60, 111–116. [Google Scholar] [CrossRef]
  26. Zhang, Z.; Wang, K.; Lei, Y.; Zhang, Z.; Zhao, Y.; Li, C.; Gu, A.; Shi, N.; Zhao, K.; Zhan, H.; et al. Non-destructive detection of pigments in oil painting by using terahertz tomography. Sci. China Ser. G Phys. Mech. Astron. 2015, 58, 124202. [Google Scholar] [CrossRef]
  27. Yang, Y.; Wu, T.V.; Sempey, A.; Pradère, C.; Sommier, A.; Batsale, J.-C. Combination of terahertz radiation method and thermal probe method for non-destructive thermal diagnosis of thick building walls. Energy Build. 2018, 158, 1328–1336. [Google Scholar] [CrossRef]
  28. Swanepoel, R. Determination of the thickness and optical constants of amorphous silicon. J. Phys. E Sci. Instrum. 1983, 16, 1214–1222. [Google Scholar] [CrossRef]
  29. Auston, D.H.; Cheung, K.P.; Valdmanis, J.A.; Kleinman, D.A. Cherenkov Radiation from Femtosecond Optical Pulses in Electro-Optic Media. Phys. Rev. Lett. 1984, 53, 1555–1558. [Google Scholar] [CrossRef]
  30. Fattinger, C.; Grischkowsky, D. Terahertz beams. Appl. Phys. Lett. 1989, 54, 490–492. [Google Scholar] [CrossRef]
Figure 1. Schematic illustration of hollowing deterioration of stone relics and the terahertz (THz) wave reflection single-point thickness extraction principle of the hollowing model. E_{in} is the incident field; E_{s1}, E_{s2}, and E_{s3} are the fields reflected from the front and back flaked stone surfaces and the stone wall surface, respectively; d_1 and d_2 are the flaked stone and hollowing sample thicknesses, respectively; θ i and θ t are the incidence and refraction angles, respectively; and n and n 0 are the refractive indexes of the flaked stone sample and air, respectively.
Electronics 09 00625 g001
Figure 2. THz time-domain spectra of the reference and hollowing deterioration samples.
Electronics 09 00625 g002
Figure 3. Schematic of the experimental setup. BS: splitter; M: mirror.
Electronics 09 00625 g003
Figure 4. Schematic of the hollowing deterioration sample.
Electronics 09 00625 g004
Figure 5. THz time-domain spectra of the reference and the flaked stone thickness of 2 mm. The time-domain spectra of (a) were obtained from the THz reflector system, with the transmission THz system for (b).
Electronics 09 00625 g005
Figure 6. The THz refractive index spectra of the flaked stone thickness of 2 mm.
Electronics 09 00625 g006
Figure 7. THz time-domain spectra of the hollowing deterioration samples. The thickness of the hollowing deterioration samples in (a) are 0.1 to 1.0 mm at 0.1-mm intervals. The thickness of the hollowing deterioration samples (b) are 1.1 to 2.0 mm at 0.1-mm intervals. The thickness of the hollowing deterioration samples (c) are 2.1 to 3.0 mm at 0.1-mm intervals. The thickness of the hollowing deterioration samples (d) are 3.1 to 4.0 mm at 0.1-mm intervals.
Electronics 09 00625 g007aElectronics 09 00625 g007b
Figure 8. The relation curve between d_2 and ΔT and the linear fit of d_2.
Electronics 09 00625 g008

