Article

Application of Terahertz Spectroscopy to Rubber Products: Evaluation of Vulcanization and Silica Macro Dispersion

1
National Institute of Technology (KOSEN), Kurume College, Kurume 830-8555, Japan
2
Advanced Materials Division, Bridgestone Corporation, Kodaira 187-8531, Japan
*
Author to whom correspondence should be addressed.
Electronics 2020, 9(4), 669; https://doi.org/10.3390/electronics9040669
Submission received: 27 March 2020 / Revised: 17 April 2020 / Accepted: 18 April 2020 / Published: 20 April 2020
(This article belongs to the Special Issue Terahertz Technology and Its Applications)

Abstract

:
Industrial applications of terahertz (THz) technology are becoming more widespread. In particular, novel evaluation methods for essential rubber products are being developed. THz absorbance spectra of various rubber polymers and reagents enable visualization of filler dispersions and vulcanization reactions. Here, improved visualization of the vulcanization reaction in thick rubber samples is discussed. Silica macro-dispersion is also analyzed because it is a general filler in automobile tires and has been difficult to evaluate with conventional techniques.

1. Introduction

Terahertz (THz) waves are located in the electromagnetic band between the far-infrared and the microwave regions corresponding to the fingerprint region of some materials and can exhibit penetration of materials except for metals [1]. Many applications using THz light have been attempted in various fields such as semiconductors, biological materials, and polymers [2,3,4,5,6]. Among them, industrial applications are limited so far, and a few, such as characterization of paint films [7] and tablet coatings [8], were reported.
Rubber products, such as automobile tires, rubber bands, rubber balls, insulators, and O-rings, are essential to modern society. Manufacturers of these products use sophisticated chemical reagents and control systems; however, the manufacturing processes depend considerably on empirical procedures and craftsmanship. This situation suggests that the production is not very efficient and could be improved. Hence, to obtain better quality of rubber products, it is crucial to realize uniform dispersions of filler materials and to visualize vulcanization.
Our research group has been developing novel evaluation methods using THz radiation. THz absorbance spectra of various chemical materials used in rubber products has been reported [9,10], and visualization of the dispersion of carbon black (CB), a major filler material, has been experimentally demonstrated [10]. It has also been reported that THz light could nondestructively detect the mesh network structure in the vulcanization reaction and the depth of the cure condition in rubber products having thicknesses greater than 10 mm [10]. These techniques are based on the transmission capability of THz radiation.
In this article, improved imaging of vulcanization depths in thick rubber samples and, for the first time, visualization of silica filler dispersion are demonstrated. The latter has been difficult to perform with conventional techniques.

2. Experimental

THz time-domain spectroscopy (THz-TDS) was performed with a custom instrument (Otsuka Electronics Co., Ltd., TR-100KS) that included a femtosecond (fs) fiber laser (IMRA AMERICA, INC., Femtolite, 100 fs, 1620 nm) and a 4′-dimethylamino-N-methyl-4-stilbazolium tosylate (DAST) crystal for THz generation. Due to the THz detector of a photoconductive switch, the bandwidth of the applicable THz radiation was limited to 3 THz for a better signal–noise ratio. The THz-TDS system was described in detail previously [10]; the transmission mode was used in this study.
The rubber samples were based on the synthetic polymer styrene-butadiene rubber (SBR, commercial-grade), which is widely used in automobile tires, and isoprene rubber (IR, commercial-grade). Table 1 lists the compounds in the samples used for the vulcanization imaging in thick rubber; all the reagents related to vulcanization except for filler materials used for high-sensitivity detection of mesh structure growth. The unit of “phr” in Table 1 is the preferred unit used in the rubber industry, indicating “parts per hundred rubber”, which is the relative weight when the rubber polymer is 100. Samples for silica dispersion visualization had a different formulation, as shown in Table 2. The main difference from Table 1 was silica filler material, and a silane coupling reagent, which improves filler dispersion.
The samples in Table 1; Table 2 were vulcanized via different methods. The sample for visualizing thick rubber curing was made with a mold, illustrated in Figure 1, that cured samples 35 mm in diameter and 20 mm thick. The vulcanization conditions were a pressure of 10 MPa and a temperature of 150 °C. For THz-TDS analysis, the cured thick rubber sample was sliced into six 2 4 -mm-thick pieces, as shown in Figure 2. For THz absorbance spectra, 25 points in the central part of each sliced piece were evaluated. In the case of silica dispersion, masterbatch mixing, final mixing samples, and cured samples were used and imaged with a scanning electron microscope (SEM, CARL ZEISS AG, Ultra55), in addition to the THz-TDS characterization. The cure conditions were 10 MPa pressure at 160 °C. Here, we describe the experimental results of visualization of vulcanization and filler dispersion. These two conditions affect the quality of the rubber products considerably, and they are the main subject of concern of rubber manufactures; however, it was difficult to obtain their information rapidly and destructively using conventional techniques.
Filler dispersion was divided into two categories, micro-dispersion and macro-dispersion. Micro-dispersions were sub-μm-sized aggregates that could be observed by an electron microscope. Here, the emphasis was on macro-dispersions of mm–μm-sized aggregates that could be evaluated visually or with an optical microscope. However, an established method has not been developed for objective numerical evaluations. As previously reported [10], the THz-TDS technique has the potential to observe the macro-dispersions of CB filler. In this study, the silica macro-dispersion was visualized.

3. Data Processing

The THz-TDS data were evaluated as the absorbance A per unit thickness (cm) using
A ( ν ) = log I 0 ( ν ) I ( ν ) T   [ cm 1 ]
where I 0 and I are the reference and transmitted THz light intensities through the sample, respectively, and T is the sample thickness. After the THz absorbance spectrum was obtained at position ( x , y ) on the sample, the representative value A r e p ( x ,   y ) of the THz absorbance for the imaging process was calculated by
A r e p ( x ,   y ) = ν 1 ν 2 A x y ( ν ) d ν ν 2 ν 1
where ν 1 and ν 2 were the low- and high-end frequencies of the THz absorbance spectrum, respectively. The statistical values, such as mean, standard deviation (SD), and coefficient of variation (CV), were derived by A r e p ( x , y ) s for one sample. CV defined by SD/mean was useful for measuring the degree of uniformity of the A r e p ( x , y ) values over the sample. The penetration depth of the rubber samples used in this study was estimated to be about 1 μm. The transmission loss due to Fresnel reflections from rubber-air interfaces was estimated to 4~5% per interface; however, all the results processed in this study were calculated without considering this loss. This is because it was difficult to obtain an accurate loss for each rubber sample, and it was expected that the magnitude of the loss was not so critical when the THz transmission was evaluated as absorbance having a logarithm scale.
To estimate the dispersion of the silica filler, a new parameter evaluating fluctuations in the THz absorbance spectral profiles was introduced. Usually, the coefficient of correlation is used for this purpose; however, differences of the coefficient were small when applied to fluctuations of the absorbance spectra. Therefore, spectral profile dissimilarity ( S P D ) was used instead. Specifically, nine or 25 points in each sample were measured to evaluate the filler dispersion, and the S P D numerically calculated differences in the spectra by
S P D = j = 1 ( j k ) n [ i = 1 m | A k ( ν i ) A j ( ν i ) A k ( ν i ) | m / | r k j | ] n 1
where A k ( ν ) and A j ( ν ) are the absorbances of the standard and compared spectra, respectively, as shown in Figure 3a. The r k j is Pearson’s coefficient of correlation, which is usually 0.9 for THz absorbance spectra. Once the S P D value for one particular standard spectrum was obtained, the next standard spectrum was selected to calculate the next S P D . If n points were sampled in one sample, the S P D s were averaged like,
S P D s a m p l e = k = 1 n S P D k n
Figure 3b shows an example of n = 4 . Here, the S P D values were indicated as 100 times S P D , 100 S P D . For complete overlaps between all spectra, 100 S P D takes the null value.
To confirm the filler dispersion evaluation via THz absorbance, the silica dispersions were estimated with SEM. In the rubber industries, the macro-dispersion of filler in SEM images is usually evaluated with number or weight averaging of aggregates, which is correctly cross-section weight aggregate cross-section. This cross-section is calculated by using processed SEM images where the aggregate cross-section thresholds were 1   μ m 2 and 10   μ m 2 , for example. The filler dispersion was evaluated using a statistical parameter for an accurate estimation. The discrepancy D in the k dimensional unit cube is defined as [11,12]
D N ( k ) = sup t [ 0 , 1 ] k | # ( [ 0 , t ) ; N ) N t 1 × × t k | ,   t = ( t 1 , ,   t k ) ,  
where # is the counting function, N is the number of random nodes, and t is the point set. This value varies from 0 to 1, where smaller values indicate better dispersion. Because calculating this discrepancy is cumbersome even on a computer [12], a “simplified discrepancy” was used based on the concept of the discrepancy in this study. The idea of the new parameter is shown in Figure 4. The evaluated sample was equally divided into 16 areas to count the particle (filler) after image binarization. The ratio of filler number to the total filler number N in the sample was calculated, it was then subtracted by the normalized area section in each divided area, and its absolute value was calculated. Finally, the “simplified discrepancy” was obtained as the mean value over the 16 divided areas. The equation is as follows:
D s i m p l e = i n | # ( a r e a i ) N S n o r m | n ,  
where n and S n o r m are the divided area number in one SEM image and the normalized area cross-section, respectively. Here, the arithmetic mean was used instead of the operator “ sup ” in Equation (5), because the considered regions in one sample were only 16. This “simplified discrepancy” had values within a range of 0 to ( n 1 ) / n 2 , where 0 indicates complete uniformity.

4. Results and Discussion

4.1. Visualization of Vulcanization in Thick Samples

A simple analysis of vulcanization conditions in thick samples has been reported previously [10]. Prior to the analysis of vulcanization depth by the THz light, the dependence of THz absorbance on the cure time was investigated. This procedure yielded two cure times, T 90 and T 100 , for visualizing vulcanization determined by a curemeter (JSR Trading Co., Ltd. (JSR Corporation), CURELASTOMER W). T 90 is generally called the “optimum vulcanization time,” while T 100 is the vulcanization finishing time. This simple analysis indicated that the central part of the sample had a low cure speed, while the THz absorbance in the center of the T 100 sample was higher than that for T 90 . The analysis only considered heat sources for vulcanization located in the pressed direction, and the analysis target was six sliced pieces; however, the actual thick sample was surrounded by the aluminum mold shown in Figure 1. This means that the sample was heated from all directions, and the sliced pieces each had a distribution of vulcanization. To solve this problem, the analyzed areas were set as shown in Figure 5. The previously analyzed sliced areas were depicted as # 1 # 6 in Figure 5a. The averaged THz absorbance values in each sliced piece had been evaluated previously [10]. Here, a total of 150 measured points was classified into the three sections “around the center”, the “central part”, and the surroundings of each (“edge”), as shown in Figure 5b,c. Figure 6 compares the THz absorbance and the CV values of the THz absorbance in each section. The comparison results for “around the center” and the “edge” are shown in Figure 6a,b, while Figure 6c,d indicates the results for the central and the edge parts. For the T 90 sample, the THz absorbance differences between the edge and “around the center” in Figure 6c are more significant than those in Figure 6a. The same tendency was observed in the CV comparisons in Figure 6b,d. Previous results showed that the THz absorbance was proportional to the cure progress [10]. Therefore, considering the distance from the heat source, the results here suggest that the vulcanization reaction in the edge part of the T 90 sample was active and inhomogeneous, while in the “around the center”/central parts, the reaction progress was slower [10]. For the T 100 sample, there was an almost equal THz absorbance for the edge and the “around the center”/central parts. This was understood by assuming that the cure reaction was nearly finished, and as a result, the CV values of the edge became small. Furthermore, the edge part in T100 samples indicated considerably larger CV values than that of the “around the center”/central parts. This result probably reflected that over-cure [10], which causes mesh structure destruction, occurred in T100 samples. Thus, it was confirmed that these detailed analyses revealed more information about vulcanization inside the thick rubber product.

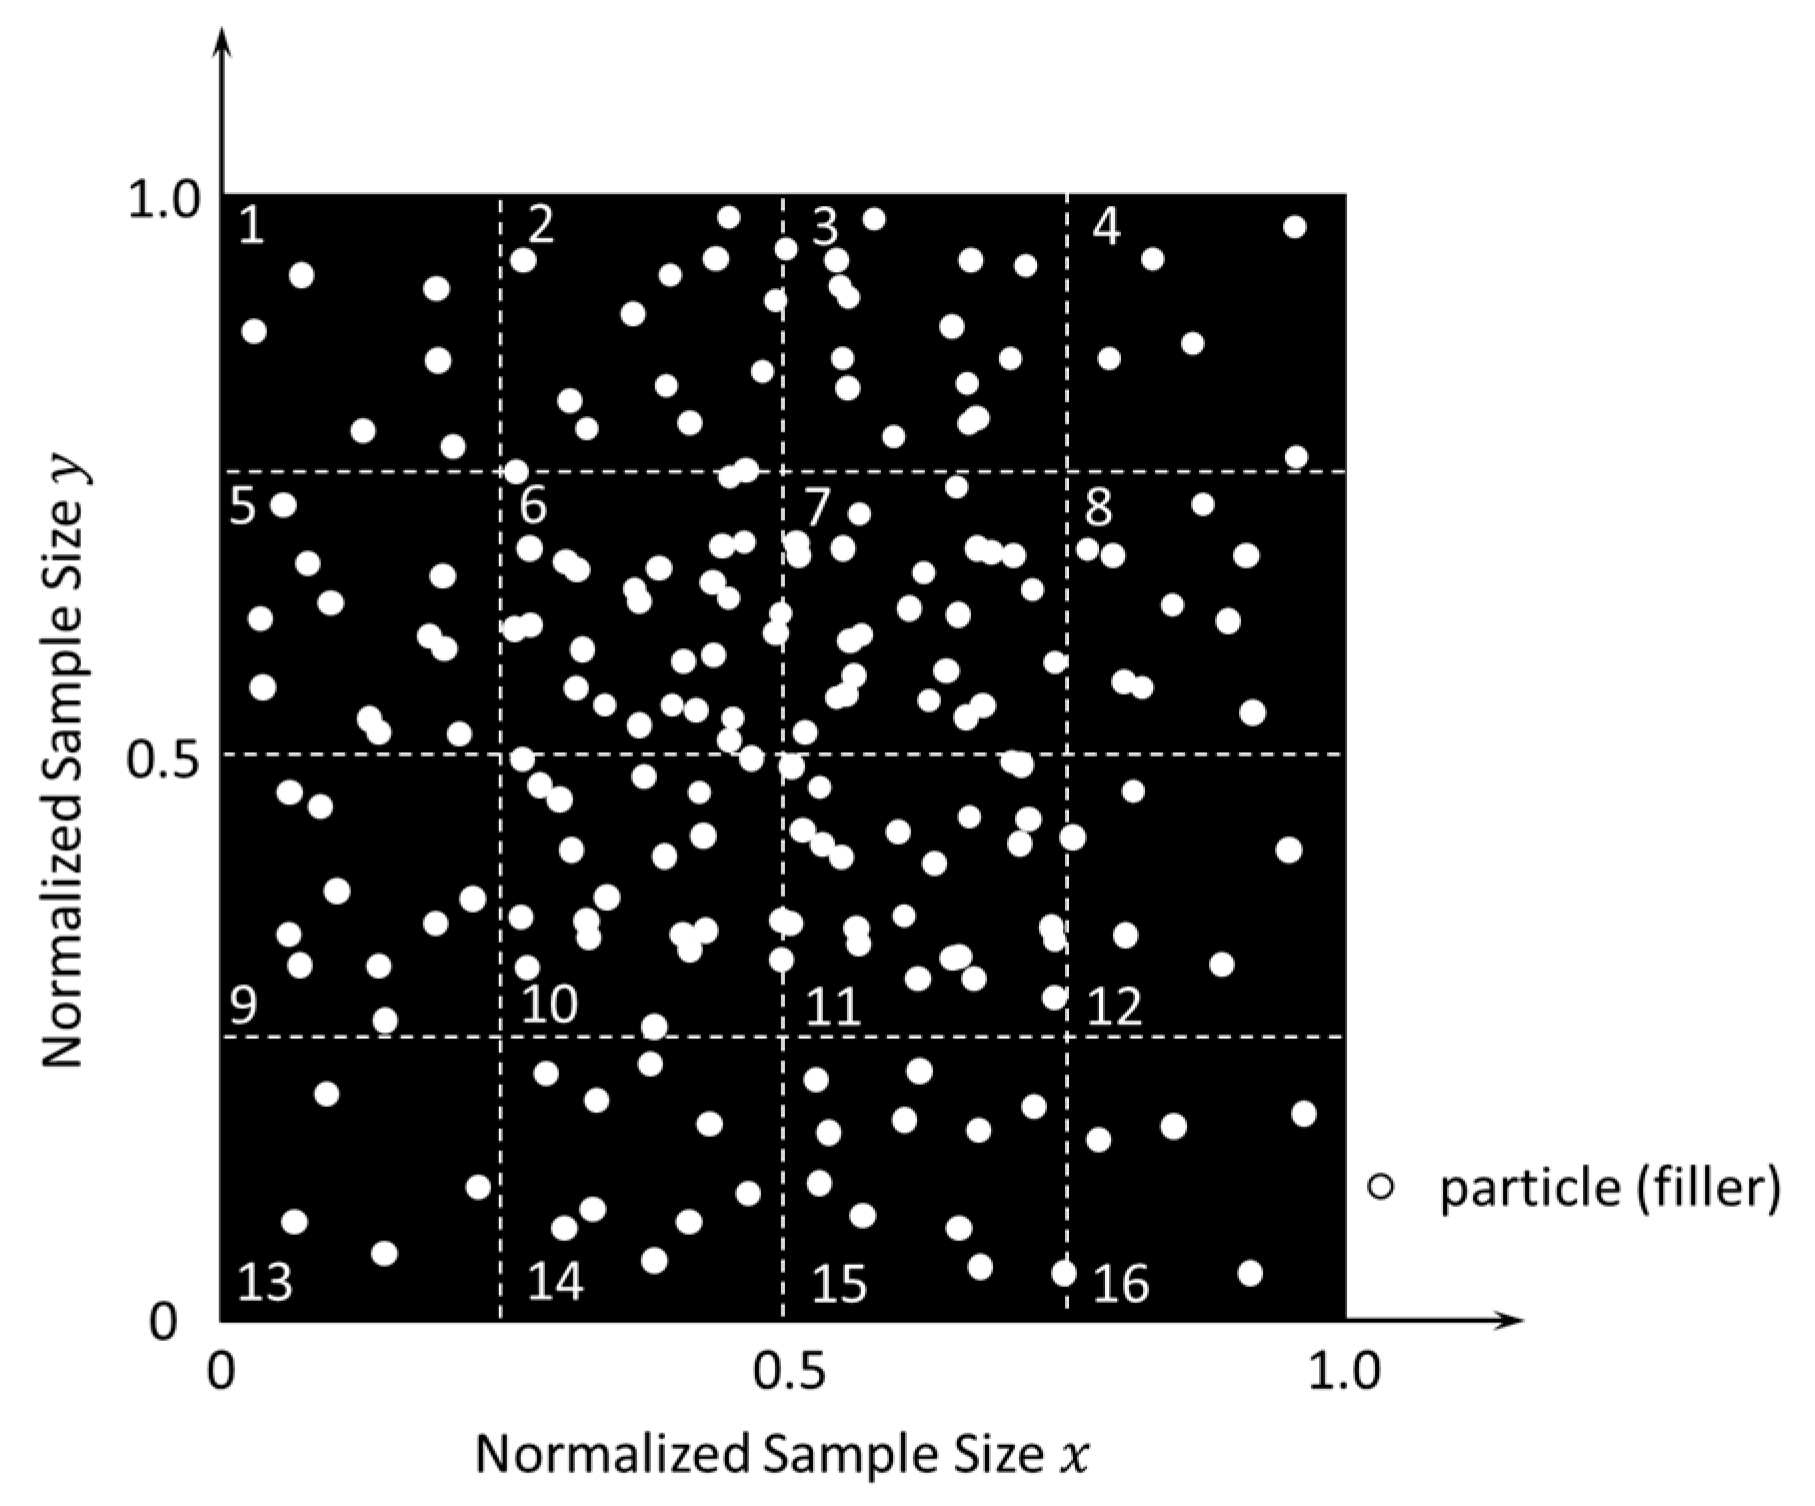
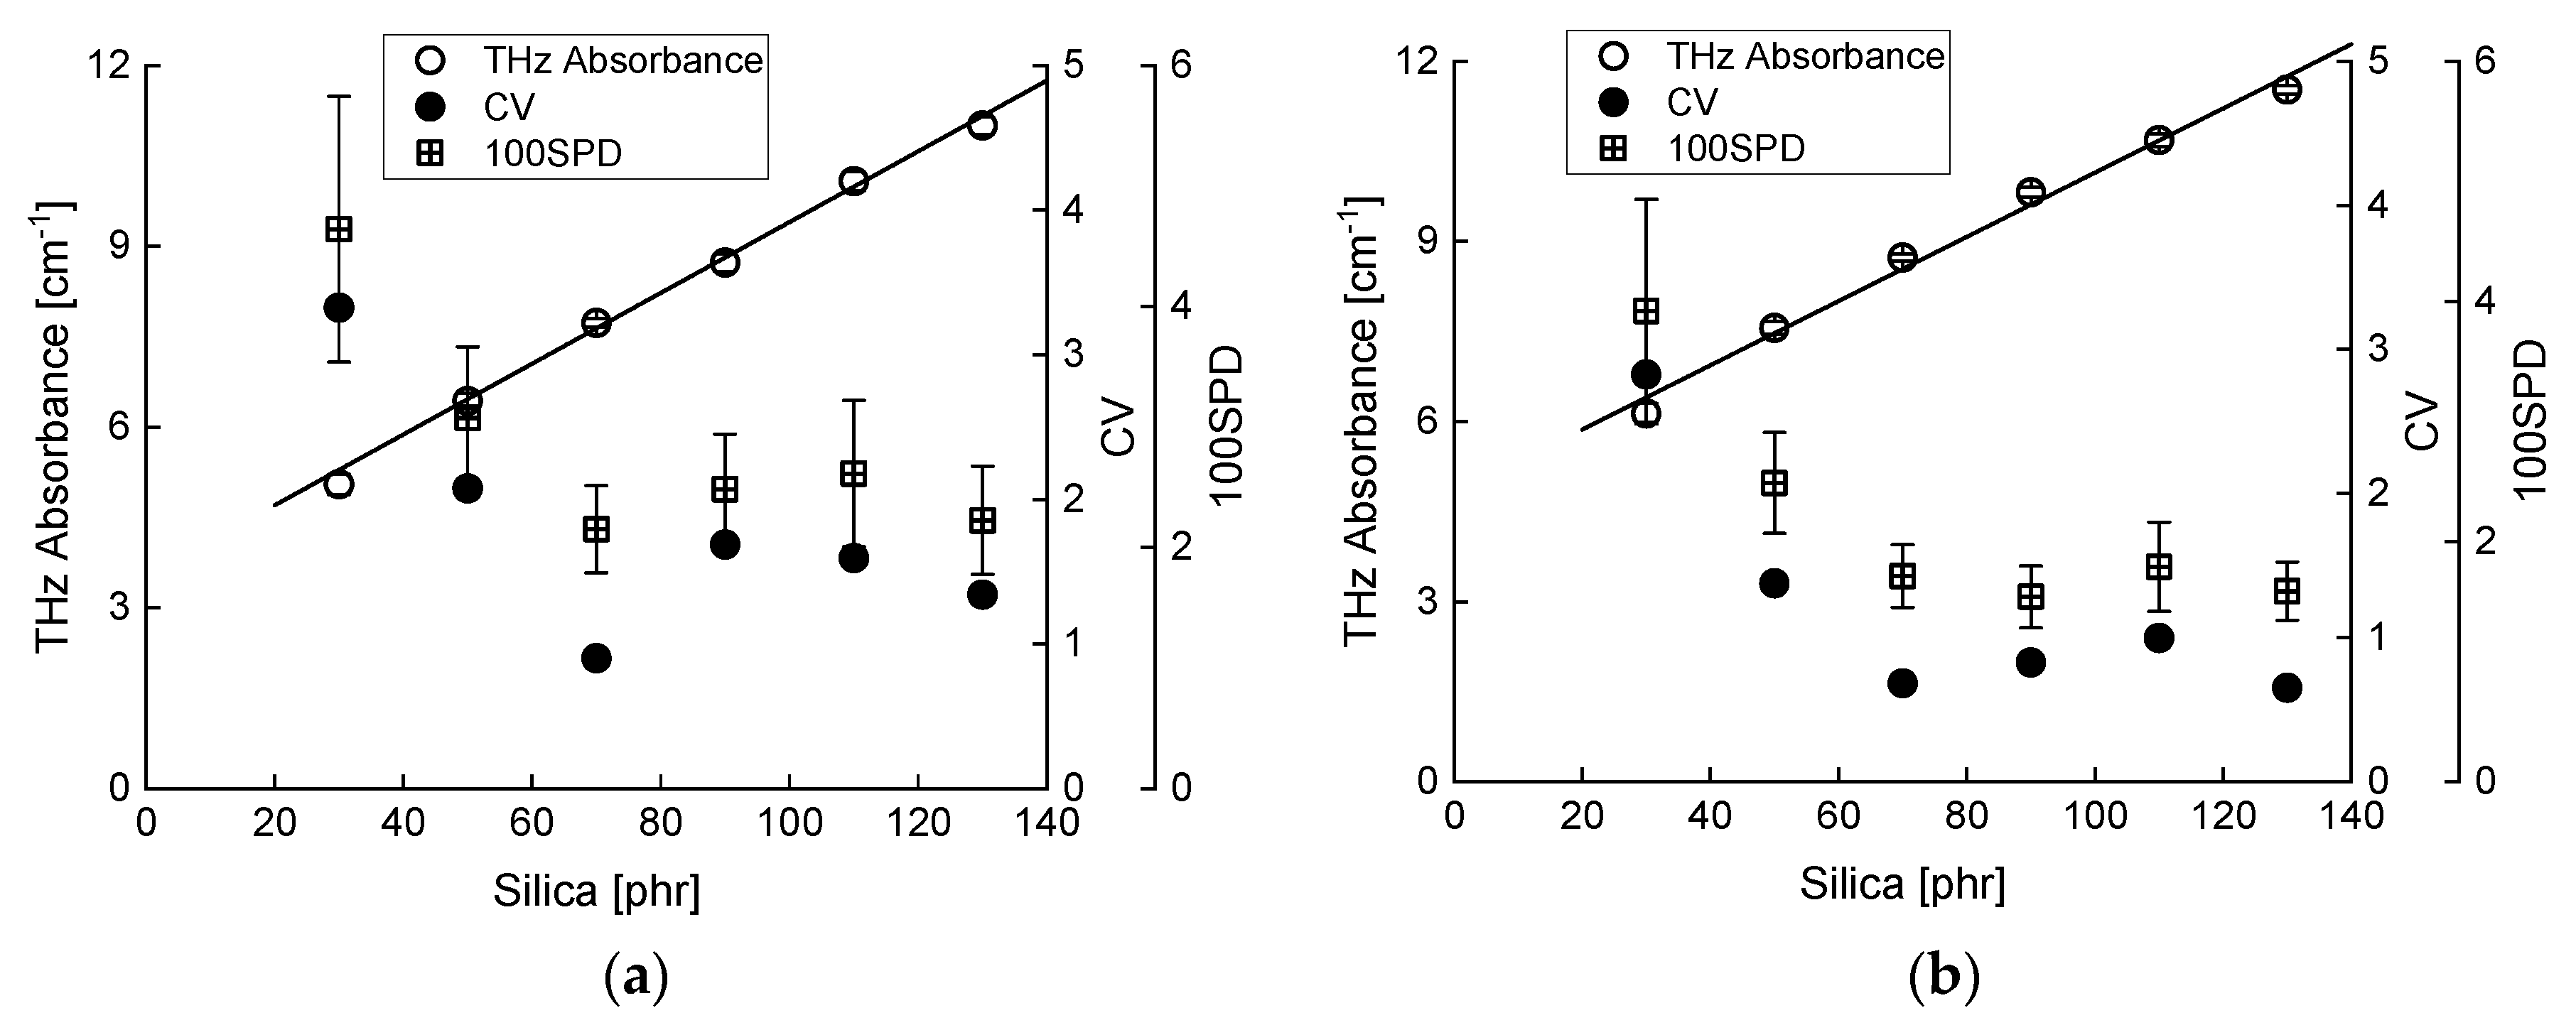
4.2. Silica Dispersion in Rubber Samples

Previously the dispersion visualization of CB, the most general filler in rubber, was reported [10]. Here, silica was visualized because it is a significant filler in ecological automobile tires. Because several unmeasured additives were used in the samples, THz absorbance spectra were evaluated for each of the new additives, as shown in Figure 7. The identification of observed peaks was not performed in this study. By considering the amount of each reagent used in Table 2, it was found that the diphenylguanidine (DPG), antioxidant, and wax were negligible in the THz absorbance of the rubber sample as much as other vulcanization accelerators and vulcanizing agent. Silane is an essential chemical material when silica is used as a filler in rubber products because silica cannot be uniformly distributed due to silanol groups on the silica surface. The silane bis(3-Triethoxylpropyl) tetrasulfide (TESPT in Table 2) reacted with silica at temperatures less than 140 °C, shown in Figure 8 [13,14]. The THz absorbance change due to this reaction was monitored in a preliminary experiment that used powdered samples. Because the bulk density of the powdered silica was approximately one-half that of the tablet silica, in addition to a scattering of THz light by powdered silica, the measured absorbance was smaller than that in Figure 7. When liquid silane was mixed with the silica, the silica tended to clump, and the absorbance spectrum was obtained by averaging three points. In contrast, the absorbance of the pure silica powder sample was stable. After heating at 130 °C for 2 h, the spectra of the mixed powder were as stable as those of the pure silica; however, the THz data were measured at the different three points in the sample and averaged. From Figure 9, it was found that the absorbance increased with silane addition and, after heating (silica-silane reaction), the absorbance decreased. Although the cause of this decrease was unclear (it may be an intermediate product, shown in Figure 8), the results indicated the detection of the silica inside rubber samples.
A calibration curve of the silica THz absorbance was used to visualize the dispersion of silica filler inside the rubber samples. Samples made from two different polymers were prepared because SBR polymer, which is the main target and widely used in automobile tires, has a lower viscosity and affects filler dispersion. Isoprene rubber (IR) was selected for comparison because it has a simple structure, a higher Mooney viscosity (stiffer), and an almost equal THz absorbance relative to SBR. When the calibration curves were calculated for silica filler, the same procedure was chosen as that for CB filler dispersion [10]. The THz-TDS system evaluated 25 points in each sample and processed the data to produce absorbance images. The results are shown in Figure 10. Both the IR and SBR samples had excellent correlations between the THz absorbances and the amount of silica. The squared Pearson’s coefficient of correlation, r 2 , was 0.994 and 0.990 for IR and SBR, respectively. Comparing the previous results using CB filler, no saturation was observable at higher silica amounts. This suggests that internal scattering or multiple scattering inside the rubber samples was not dominant even in samples having higher filler concentration. This assumption was supported by the fact that remarkable temporal THz waveform degradation [15] was not observed in samples containing silica filler (the waveform is not shown). The parameters of C V and S P D were plotted together in Figure 10. The C V was obtained from the integrated absorbance values, which eliminated the THz absorbance spectral fluctuations. In contrast, the S P D reflected the difference in spectral profiles. Increased filler concentration induced more uniform dispersion; thus, the C V and S P D trends in Figure 10 were acceptable. Furthermore, the variations were comparable. Both samples indicated minimum values at 70 phr silica; however, the cause was not understood. The 70-phr silica possibly matched the quantities of other additives and polymer weights. Figure 10 verified that THz absorbance was suitable for evaluating the silica dispersion, and that the parameter S P D was a potential indicator of spectral uniformity.
The visualization of silica dispersion was performed using the same imaging procedure as that used for CB filler [10]. The grayscale images for the silica dispersion were inferior to the CB dispersion images in recognition of the dispersion. Meanwhile, the fluctuation of the absorbance spectrum was suitable to evaluate silica dispersion in the samples. This was because there was much less silica or silica-silane compound absorption relative to that of CB, although the linearity of the silica absorbance was confirmed in Figure 10. The 25 spectra were overlapped in one plot in Figure 11 to identify fluctuations more easily. The THz absorbance image is shown in the inset of each spectrum for reference. The spectra were for (a) silica masterbatch mixing (unvulcanized), (b) final mixing (unvulcanized), and (c) vulcanized rubber. These production processes of rubber products, such as masterbatch mixing and final mixing, were explained previously [10]. The first process was the masterbatch mixing, and the last condition of the product was a vulcanized rubber, which follows the final mixing. As shown in Figure 11, the fluctuations settled as the procedure progressed. The SPD in Equations (3) and (4) was used to evaluate the spectral fluctuations. Table 3 summarizes the averaged absorbance, C V , and 100 S P D for these three conditions over the range 1.2–2.6 THz. The mean value of the absorbance was almost constant, while the fluctuations gradually decreased with the process. To confirm the validity of the fluctuation evaluation with the S P D parameter, SEM images were acquired for samples of masterbatch mixing and cured rubber. The SEM images and the analysis of dispersion by the simplified discrepancy are shown in Figure 12. The brightness of the images was slightly adjusted by software to emphasize the surface conditions for the (a) masterbatch mixing and (b) cured rubber. In Figure 12b, the vulcanized rubber had a clean surface. The evaluation by the simplified discrepancy is shown in Figure 12c, which has two bars for the masterbatch mixing sample (from two SEM images) and one bar for the cured rubber. The data confirmed that the value of the simplified discrepancy for the cured sample was smaller with fewer errors than that of the masterbatch sample, and that the dispersion evaluation of silica filler by THz absorbance was valid. This result proved that the novel parameter of the simplified discrepancy can function for the SEM image analysis.

5. Conclusions

The vulcanization condition inside thick rubber samples was visualized by THz absorbance images in detail. They revealed that the surrounding aluminum mold acted as a heat source, and that the central and the “around the center” regions had a lower rate of vulcanization relative to the edges. The THz absorbance characterized the dispersion of the silica filler in the rubber samples, which is difficult to evaluate nondestructively and rapidly with other methods. The profile fluctuation of the absorbance spectrum was an effective indicator of the homogeneity of the silica filler. The validity of this method was confirmed with SEM imaging, where a new parameter was used to evaluate the filler uniformity. Overall, the THz technique could be used for detecting or assessing the distribution of silica, which will have more importance in future rubber products.

Author Contributions

Conceptualization, M.H., T.G and Y.H.; methodology, T.G. and Y.H.; software, Y.H.; validation, M.H., T.G. and Y.H.; formal analysis, Y.Y., T.M. (Toshiaki Morichika), R.S., T.M. (Takakazu Minato) and Y.H.; investigation, Y.Y., R.S., T.M. (Toshiaki Morichika), T.M. (Takakazu Minato) and Y.H.; resources, M.H., T.G and Y.H.; data curation, M.H., T.G., Y.Y. and Y.H.; writing—original draft preparation, Y.H.; writing—review and editing, Y.Y., T.G., R.S., T.M. (Toshiaki Morichika), T.M. (Takakazu Minato), M.H. and Y.H.; visualization, Y.H.; supervision, M.H. and Y.H.; project administration, M.H. and Y.H.; funding acquisition, M.H. All authors have read and agreed to the published version of the manuscript.

Funding

This research received no external funding.

Acknowledgments

The authors thank associate professor Katsunori Watanabe and technical staff member Takuta Kamino, the national institute of technology (KOSEN), Kurume College, for helping in making the rubber compounds. We thank Alan Burns, from the Edanz Group (www.edanzediting.com/ac) for editing a draft of this manuscript.

Conflicts of Interest

The authors declare no conflict of interest.

References

  1. Tonouchi, M. Cutting-edge terahertz technology. Nat. Photonics 2007, 1, 97–105. [Google Scholar] [CrossRef]
  2. Schmuttenmaer, C.A. Exploring Dynamics in the Far-Infrared with Terahertz Spectroscopy. Chem. Rev. 2004, 104, 1759–1780. [Google Scholar] [CrossRef] [PubMed]
  3. Heilweil, E.J.; Plusquellic, D.F. Terahertz Spectroscopy of Biomolecules. In Terahertz Spectroscopy Principles and Applications; Dexheimer, S.L., Ed.; CRC Press: Boca Raton, FL, USA, 2007; pp. 269–298. [Google Scholar]
  4. Hoshina, H.; Hayashi, A.; Miyoshi, N.; Miyamaru, F.; Otani, C. Terahertz pulsed imaging of frozen biological tissues. Appl. Phys. Lett. 2009, 94, 123901. [Google Scholar] [CrossRef]
  5. Rungsawang, R.; Geethamma, V.G.; Parrot, E.P.J.; Ritchie, D.A.; Terentjev, E.M. Terahertz spectroscopy of carbon nanotubes embedded in a deformable rubber. J. Appl. Phys. 2008, 103, 123503. [Google Scholar] [CrossRef]
  6. Piesiewicz, R.; Jansen, C.; Wietzke, S.; Mittleman, D.; Koch, M.; Kürner, T. Properties of Building and Plastic Materials in the THz Range. Int. J. Infrared Millim. Waves 2007, 28, 363–371. [Google Scholar] [CrossRef]
  7. Yasui, T.; Yasuda, T.; Sawanaka, K.; Araki, T. Terahertz paintmeter for noncontact monitoring of thickness and drying progress in paint film. Appl. Opt. 2005, 44, 6849–6856. [Google Scholar] [CrossRef] [PubMed] [Green Version]
  8. Fitzgerald, A.J.; Cole, B.E.; Taday, P.F. Nondestructive analysis of tablet coating thicknesses using terahertz pulsed imaging. J. Pharm. Sci. 2005, 94, 177–183. [Google Scholar] [CrossRef] [PubMed]
  9. Hirakawa, Y.; Ohno, Y.; Gondoh, T.; Mori, T.; Takeya, K.; Tonouchi, M.; Ohtake, H.; Hirosumi, T. Nondestructive Evaluation of Rubber Compounds by Terahertz Time-Domain Spectroscopy. J. Infrared Millim. Terahertz Waves 2011, 32, 1457–1463. [Google Scholar] [CrossRef]
  10. Hirakawa, Y.; Yasumoto, Y.; Gondo, T. Evaluation of Rubber Products by Terahertz Time-domain Spectroscopy Carbon Black Dispersion and Vulcanization State. J. Infrared Millim. Terahertz Waves 2020. [Google Scholar] [CrossRef]
  11. Niederreiter, H. Quasi-Monte Carlo Methods for Numerical Integration. In Random Number Generation and Quasi-Monte Carlo Methods; Society for Industrial and Applied Mathematics: Philadelphia, PA, USA, 1992; pp. 13–22. [Google Scholar]
  12. Gandar, B.; Loosli, G.; Deffuant, G. Sample Dispersion Is Better than Sample Discrepancy for Classification, hal-00679061. 2010. Available online: https://hal.archives-ouvertes.fr/hal-00679061 (accessed on 1 February 2020).
  13. Rodgers, B.; Wanddell, W. The Science of Rubber Compounding. In The Scientific and Technology of Rubber, 4th ed.; Mark, J.E., Erman, B., Roland, C.M., Eds.; Academic Press: Amsterdam, The Netherlands, 2013; pp. 417–471. [Google Scholar]
  14. Ichino, T. Silane Coupling Agent for Rubber Usage. J. Soc. Rubber Sci. Technol. Jpn. 2009, 82, 67–72. [Google Scholar] [CrossRef]
  15. Hirakawa, Y.; Yamauchi, T.; Kamino, T.; Gondoh, T.; Hirano, S.; Noguchi, T. Dependence of THz Signals on Carbon Black Compounding Amount in Vulcanized Rubber. In Technical Digests of the Conference on Lasers and Electro-Optics (CLEO); Optical Society of America: San Jose, CA, USA, 2017. [Google Scholar]
Figure 1. Mold for thick rubber production.
Electronics 09 00669 g001
Figure 2. Sample preparation and measured areas for THz-TDS evaluation of thick rubber.
Electronics 09 00669 g002
Figure 3. Definition of spectral profile dissimilarity (SPD). (a) SPD calculation, and (b) averaged SPD in one sample.
Electronics 09 00669 g003
Figure 4. The concept of the simplified discrepancy calculation. This figure shows an example of n = 16.
Electronics 09 00669 g004
Figure 5. Thick rubber sample for detailed analysis in this study. (a) Coordinate axes and sliced areas (#1~#6) in the sample, (b) the “around the center” (36 points) and its surroundings (“edge,” 114 points), and (c) the center (10 points) and its surroundings (“edge,” 140 points).
Electronics 09 00669 g005
Figure 6. Comparison of the THz absorbance and the CV values of the THz absorbance in each section of T90 and T100 samples. (a) and (c) averaged THz absorbance in “around the center” and central part, and (b) and (d) CV of THz absorbance in “around the center” and central part, respectively.
Electronics 09 00669 g006
Figure 7. THz absorbance spectra for newly measured agents.
Electronics 09 00669 g007
Figure 8. Chemical reaction between silica and silane.
Electronics 09 00669 g008
Figure 9. Change of the THz absorbance spectrum by silica-silane chemical reaction. Gray-colored zones mean standard errors.
Electronics 09 00669 g009
Figure 10. Calibration lines for the THz absorbance (solid line) against silica concentration with CV of the THz absorbance and 100SPD of the THz absorbance spectra. (a) IR- and (b) SBR-based sample.
Electronics 09 00669 g010
Figure 11. THz absorbance spectra at 25 measured point in various sample condition. (a) Silica masterbatch mixing (unvulcanized), (b) final mixing (unvulcanized), and (c) vulcanized rubber. Inset shows each THz absorbance image.
Electronics 09 00669 g011
Figure 12. SEM image evaluation of SBR-based sample. (a) Silica masterbatch mixing, (b) vulcanized rubber, and (c) silica dispersion in SEM images derived by simplified discrepancy.
Electronics 09 00669 g012
Table 1. Compounding formulation of the thick sample for vulcanization evaluation.
IngredientMaterialQuantity [phr]
PolymerSBR100
Accelerator activatorsStearic Acid1
Zinc Oxide5
Vulcanization acceleratorsTMTD1
MBTS1
CBS1
Vulcanizing agentSulfur1
Materials included styrene-butadiene rubber (SBR), tetramethlthiuram disulfide (TMTD), dibenzothiathiazole disulfide (MBTS), and n-cyclohexyl-2-benzothiazole sulfenamide (CBS).
Table 2. Compounding formulation of silica sample.
IngredientMaterialQuantity [phr]
PolymerIR or SBR100
FillerSilica30–130
Coupling agentTESPTWeight ratio of 8% of Silica
Accelerator activatorsStearic Acid2
Zinc Oxide2.5
Vulcanization acceleratorsDPG1.5
MBTS2.5
TBBS0.7
Vulcanizing agentSulfur1.6
OthersWax2
Antioxidant1
Materials included isoprene rubber (IR), styrene-butadiene rubber (SBR), diphenylguanidine (DPG), triethoxylpropyl tetrasulfide (TESPT), dibenzothiathiazole disulfide (MBTS), and N-(tert-butyl)-2-benzothiazole sulfenamide (TBBS).
Table 3. The averaged THz absorbance, CV, and 100SPD for masterbatch mixing, final mixing, and vulcanized rubber.
SampleMasterbatch MixingFinal MixingCured Rubber
Mean8.208.32 8.22
CV [%]3.042.84 0.242
100SPD6.325.68 2.38

